

Research on Key Parameters of Wellbore Stability for Horizontal Drilling in Offshore Hydrate Reservoirs

 , ,
, , 
Abstract
1. Introduction
2. The Model of the Hydrate Reservoir at Sea Around the Horizontal Well During Drilling
2.1. Fluid–Solid Coupling Seepage Equation
- (1)
- The gas in the pores and pores in the formation were compressible, and the formation water was slightly compressible. The deformations of rock skeleton were all small in displacement.
- (2)
- The heat exchange in the formation only affected the decomposition of hydrate and had no effect on the properties of the rock skeleton and formation fluid.
- (3)
- The rock skeleton and reservoir hydrate did not change in density in the whole process.
- (4)
- The generalized Darcy’s law was applicable to the flow of all fluids in the formation.
2.1.1. Continuity Equation
2.1.2. Darcy’s Law of Two-Phase Seepage
2.2. Energy Conservation Equation
2.3. Equation of Solid Field of the Reservoir
2.3.1. Balance Equation of the Rock Skeleton
2.3.2. Geometric Equation of Reservoir Skeleton
2.3.3. Constitutive Equation of Reservoir Skeleton
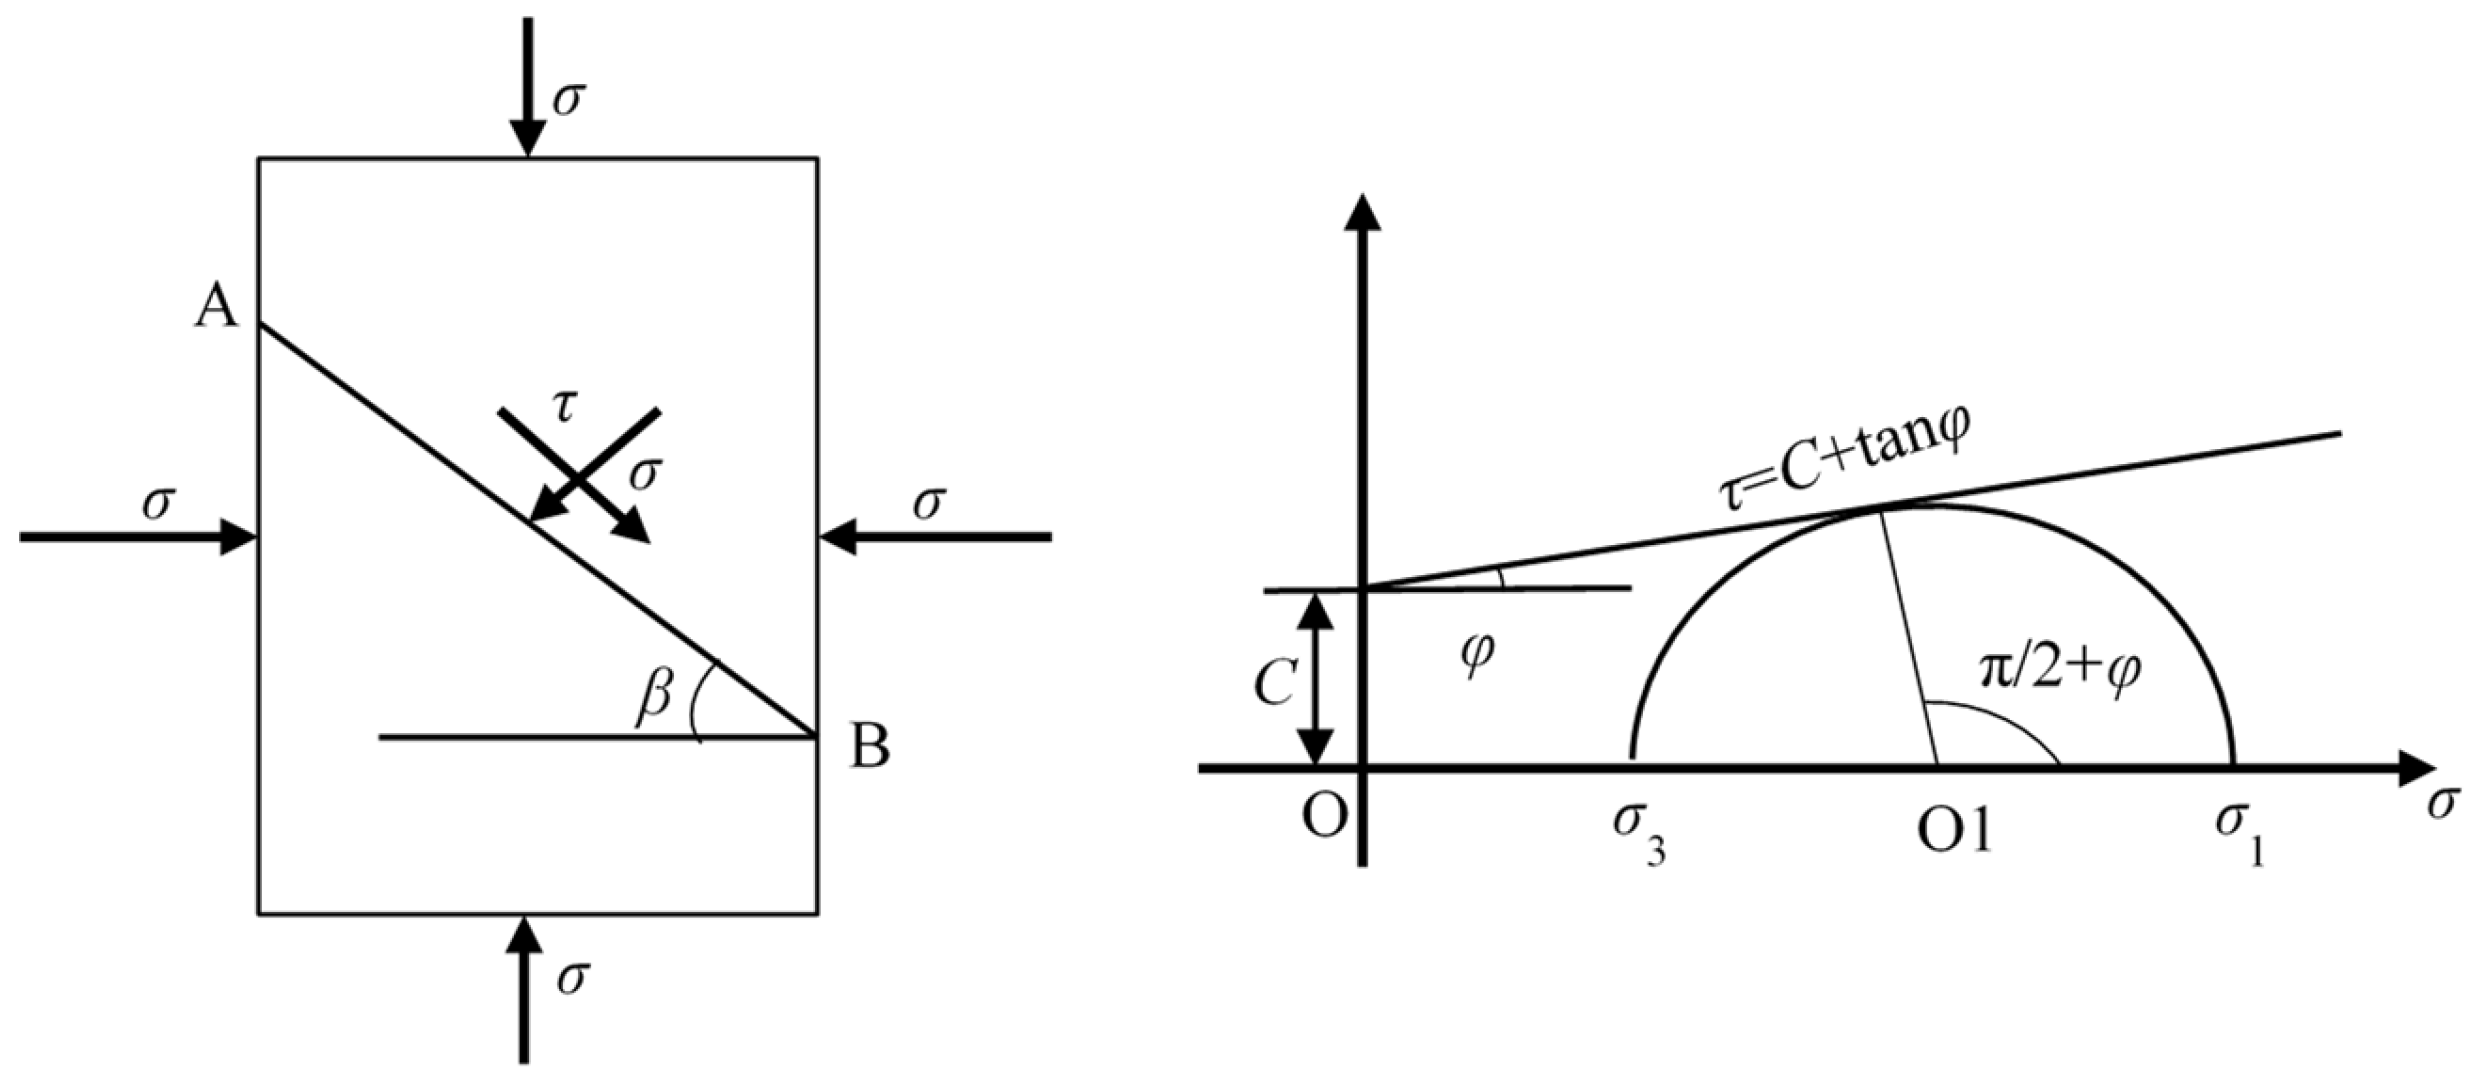
2.4. Kinetic Equations for Hydrate Decomposition
2.5. Model Definite Solution Conditions
3. Numerical Solution Method and Model Validation
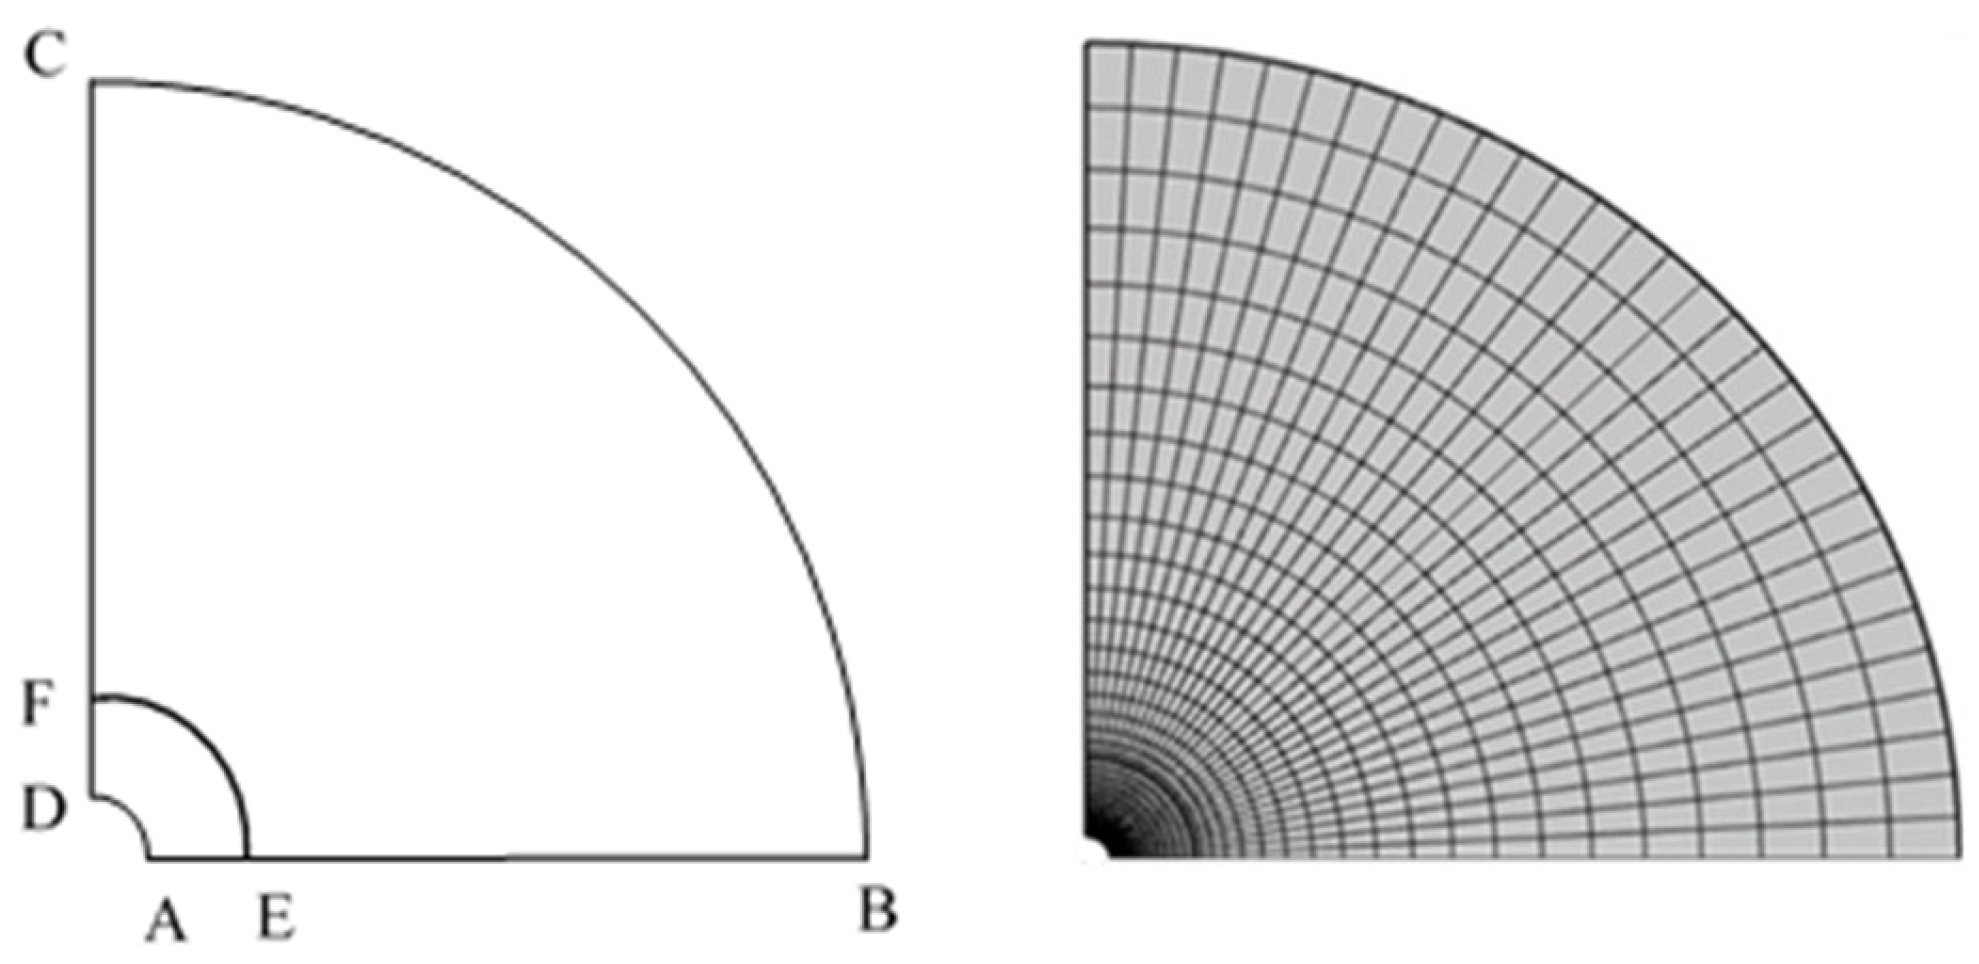
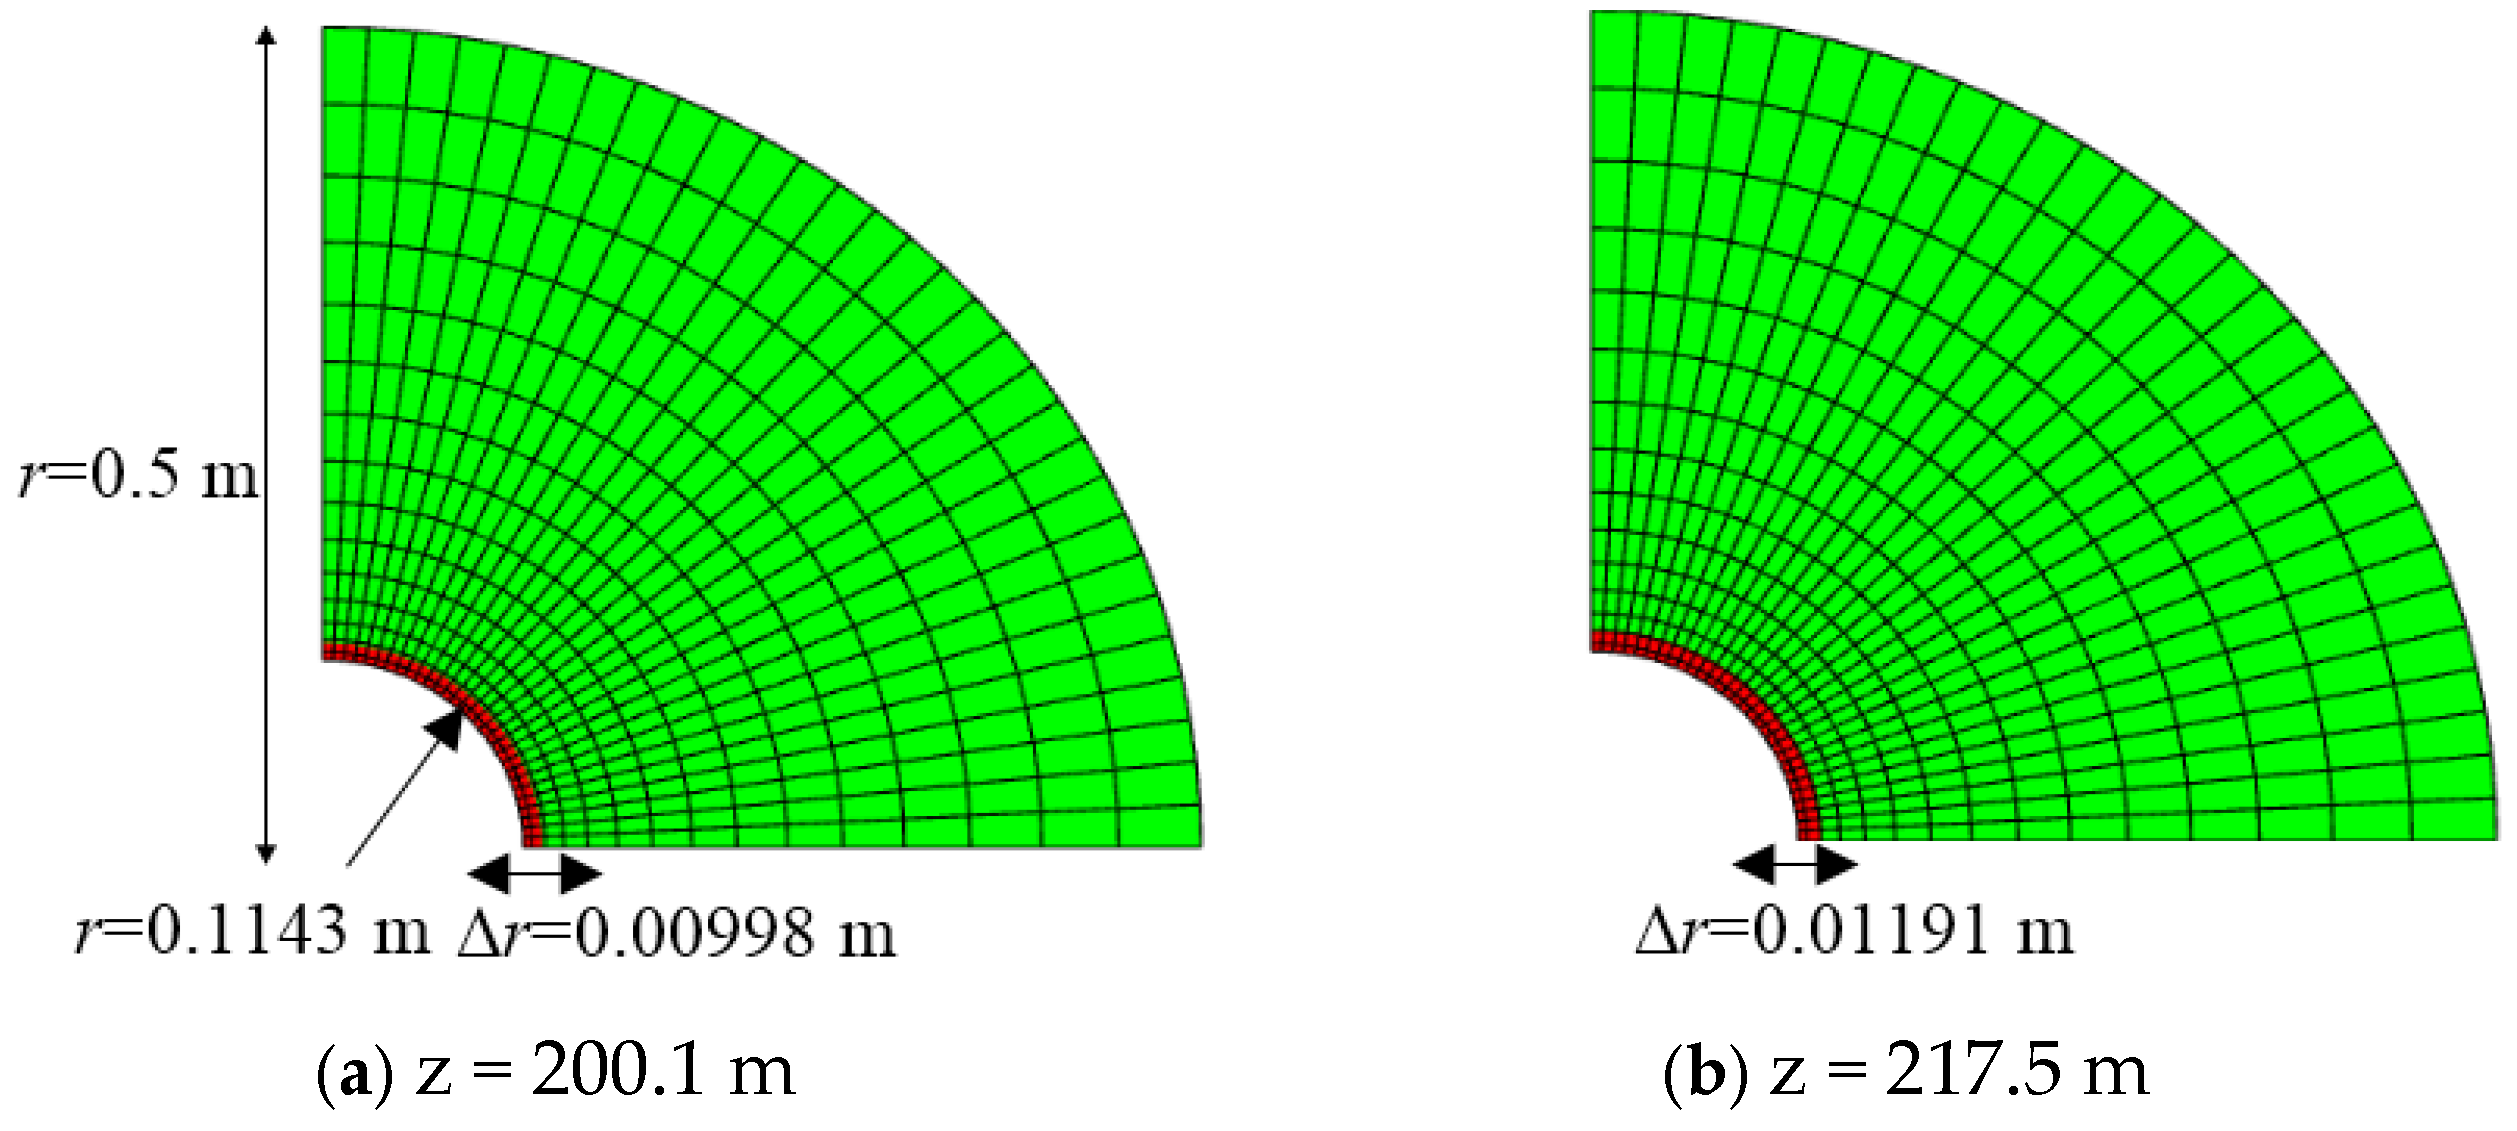
3.1. Mesh Division
3.2. The Numerical Solution Method
- (1)
- The pores and gases in the formation are compressible, and the formation water is considered as a slightly compressible fluid. The deformation generated by the rock skeleton is small displacement deformation;
- (2)
- The heat exchange occurring in the formation only affects the decomposition of hydrates and has no effect on the rock skeleton and formation fluid properties;
- (3)
- The density of rock skeleton and reservoir hydrates remains unchanged throughout the entire process;
- (4)
- Hydrate reservoirs are uniformly isotropic;
- (5)
- The generalized Darcy’s law is applicable to the flow of all fluids in geological formations;
- (6)
- The relative velocity of hydrates to the rock skeleton is zero, and the relative velocity between the gas–liquid phases is zero.
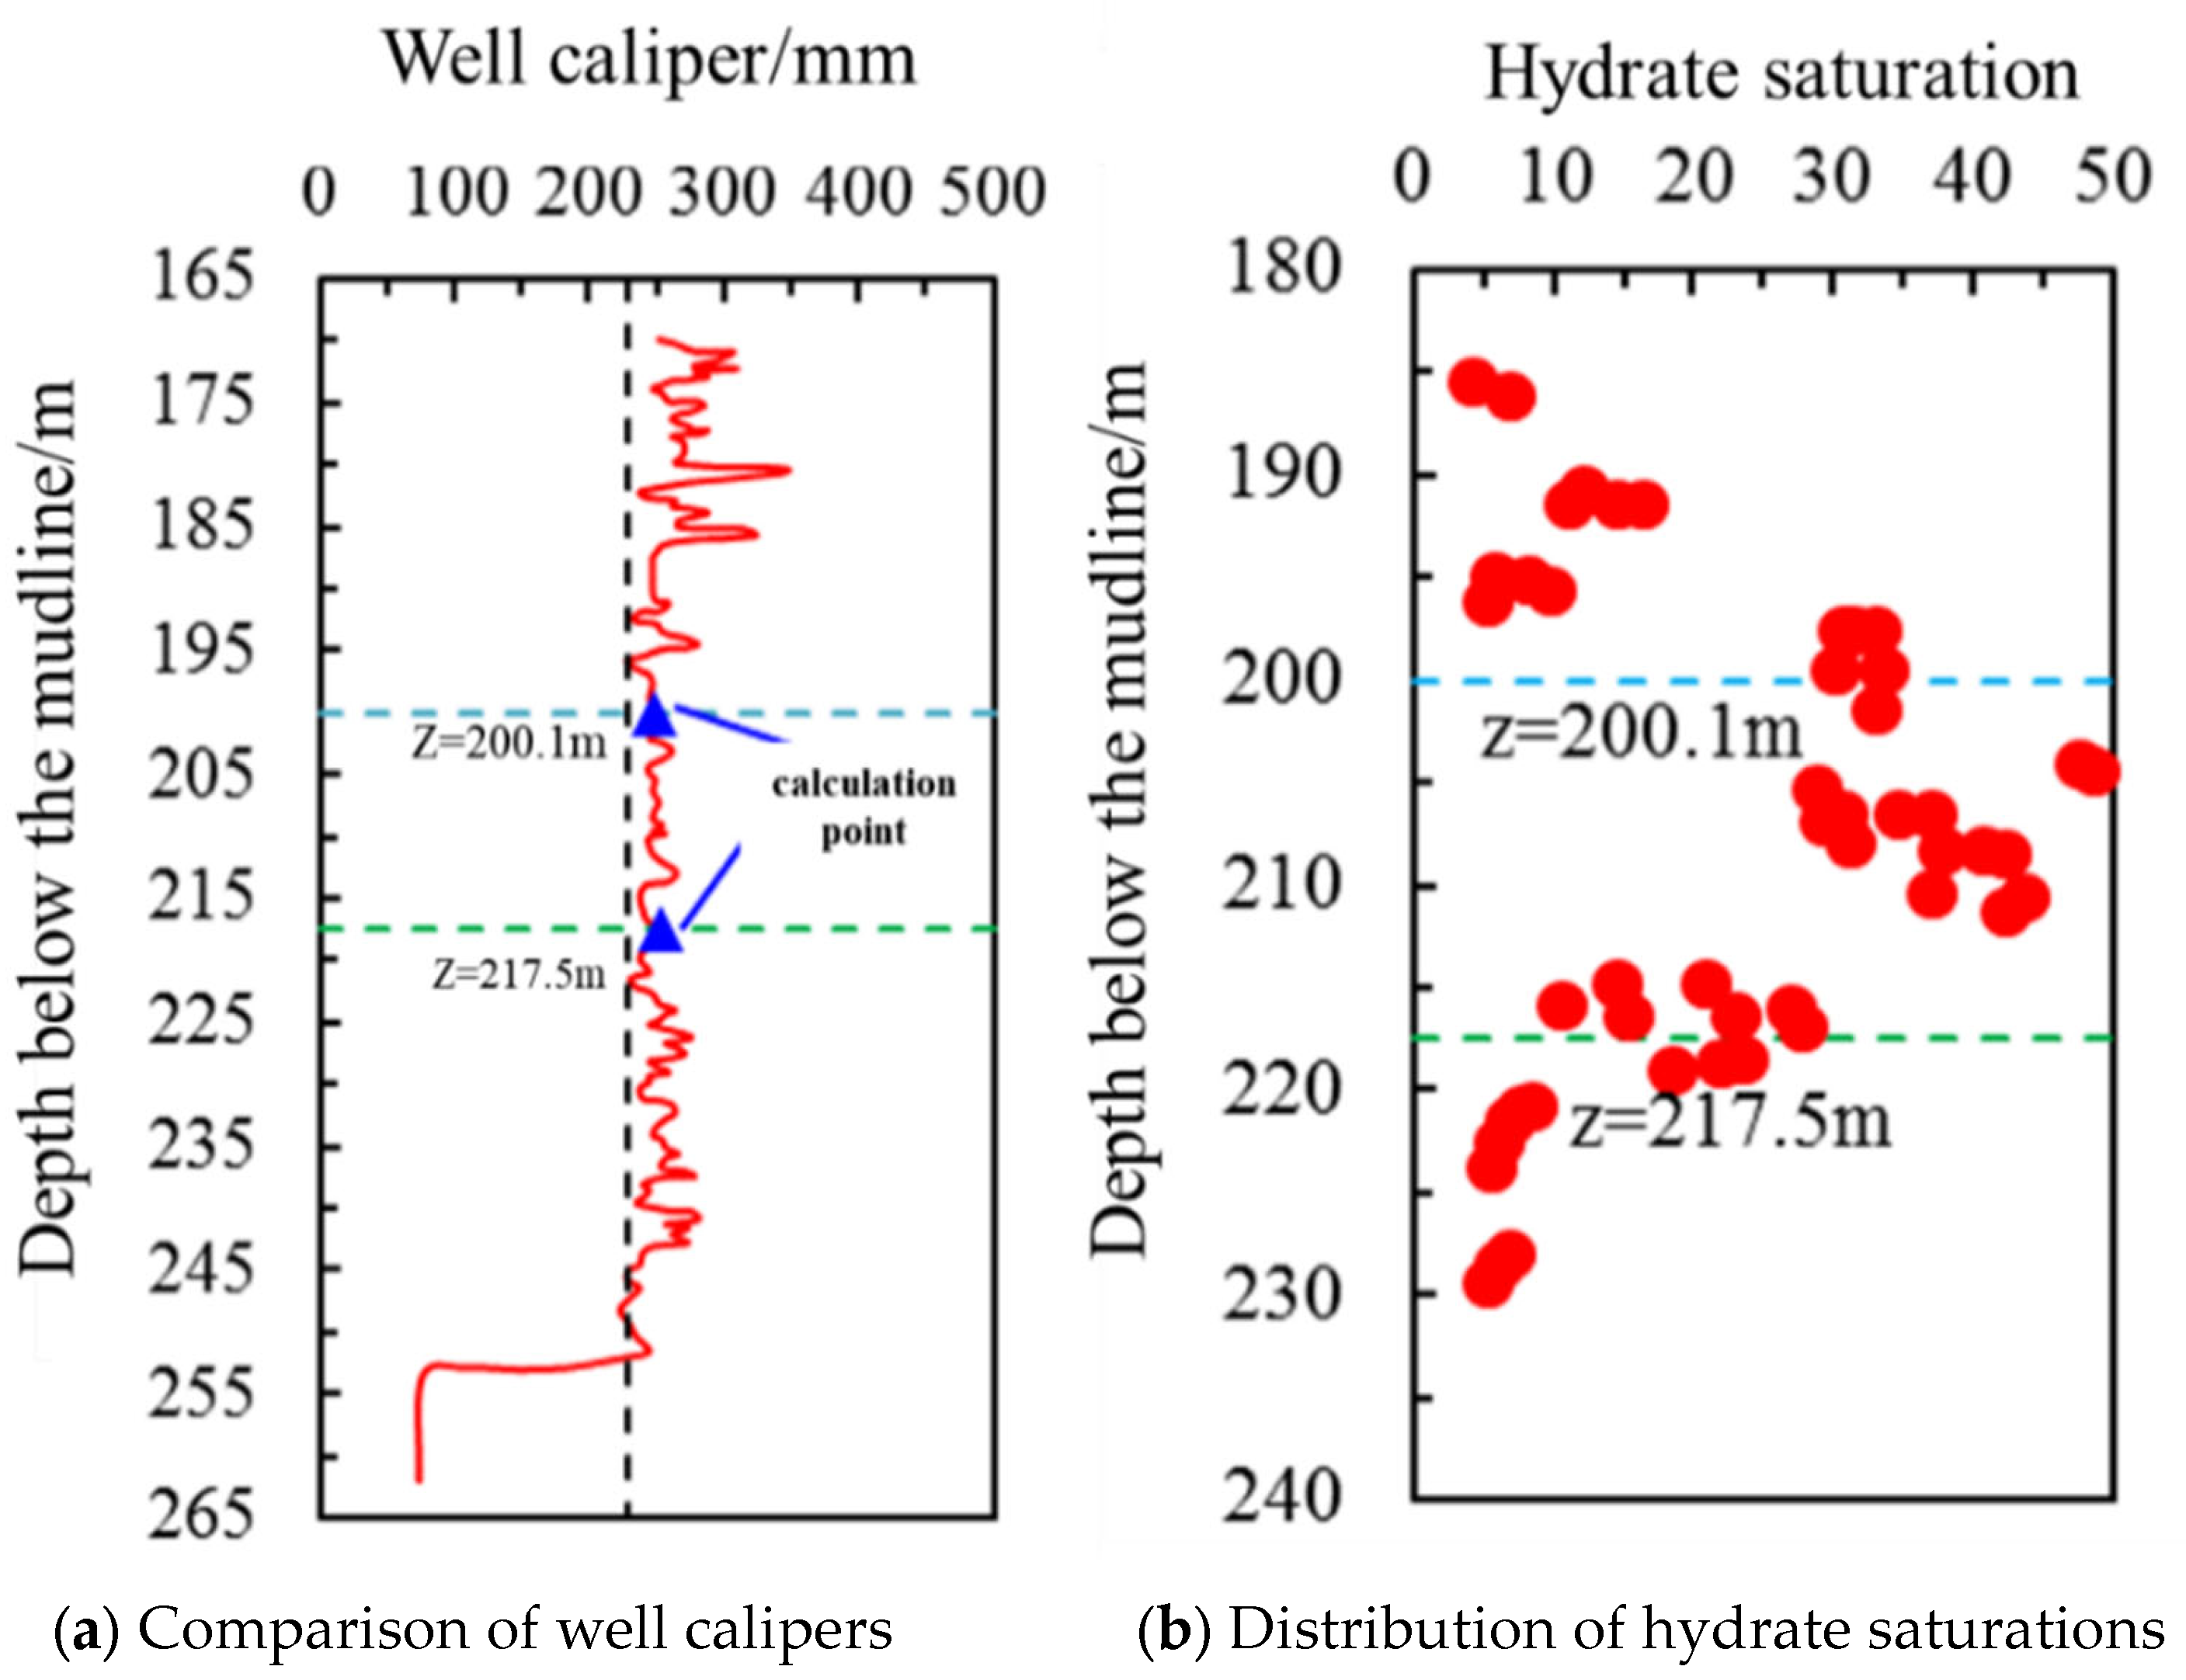
3.3. Validation of the Model
- (1)
- AD was the boundary of the drilling fluid invading the hydrate reservoir, the temperature and pressure of the drilling fluid invading the reservoir were set, the volume fraction of the liquid phase was set at 1, and the boundary load condition of the solid field was set as the drilling fluid invading pressure.
- (2)
- AB and CD were both set as symmetrical boundaries, the solid field was set as roller supporting, with the normal displacement of 0.
- (3)
- BC was the outer boundary, which was set as the outflow boundary condition in the porous medium phase transfer and the porous medium heat transfer modules, as the boundary with the constant pressure of the initial pressure of the hydrate reservoir in the Darcy law module, and as the boundary with the load condition of the initial pressure in the solid field.
4. Results and Discussion
4.1. Sensitivity Analysis of Basic Parameters
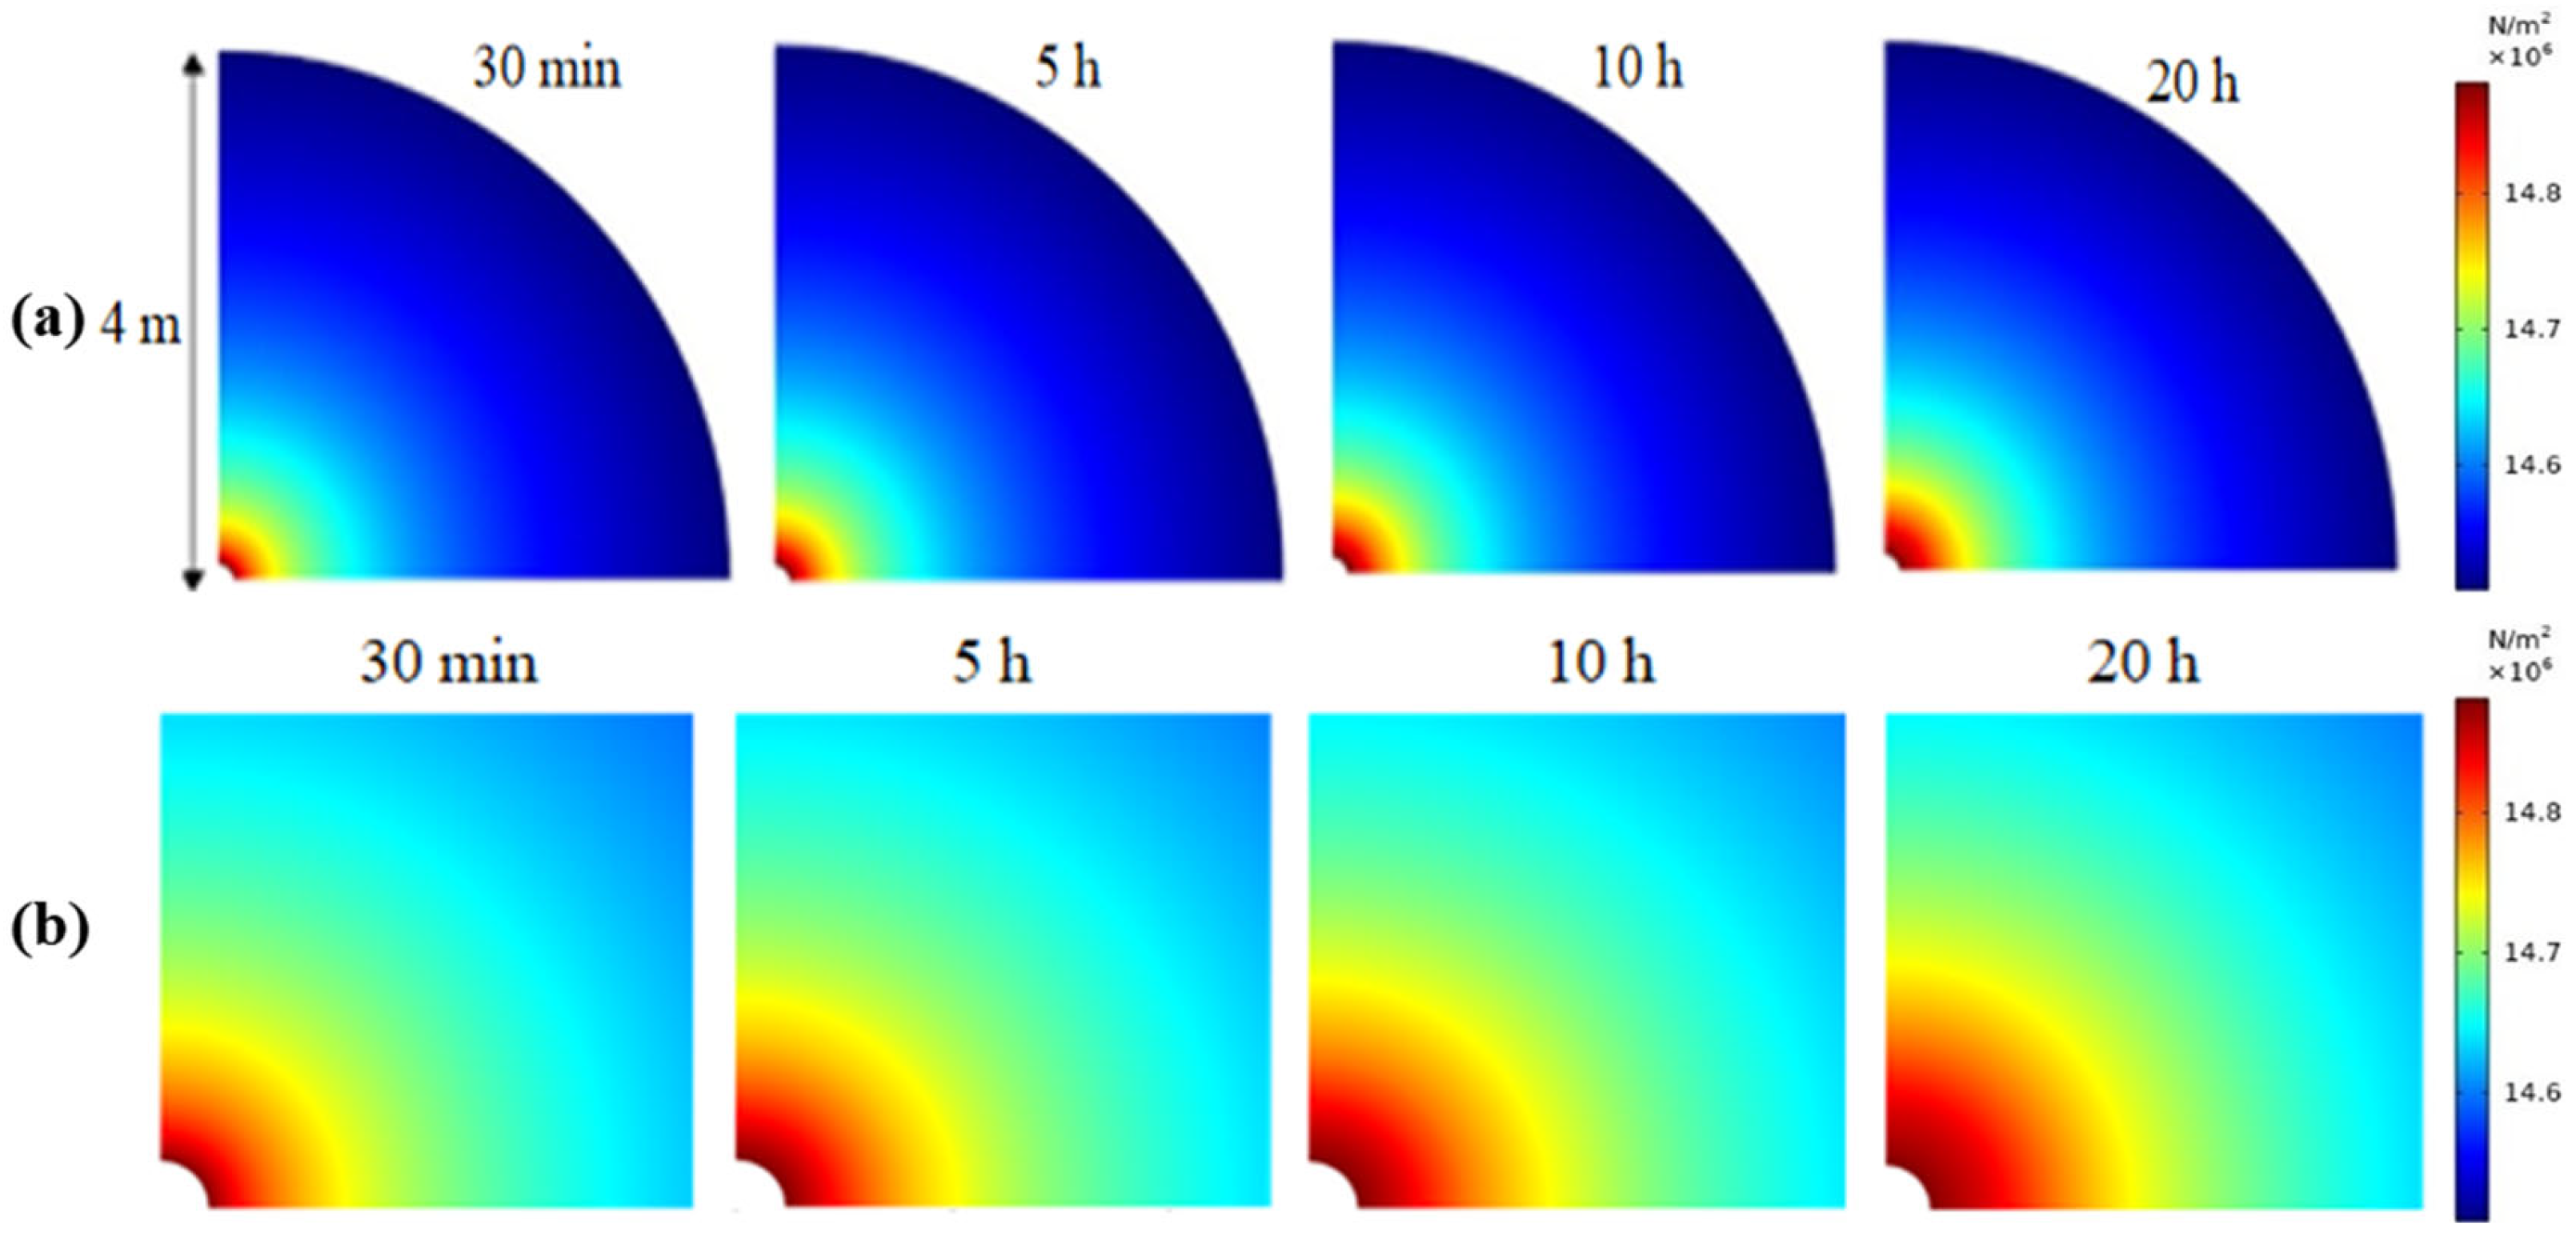
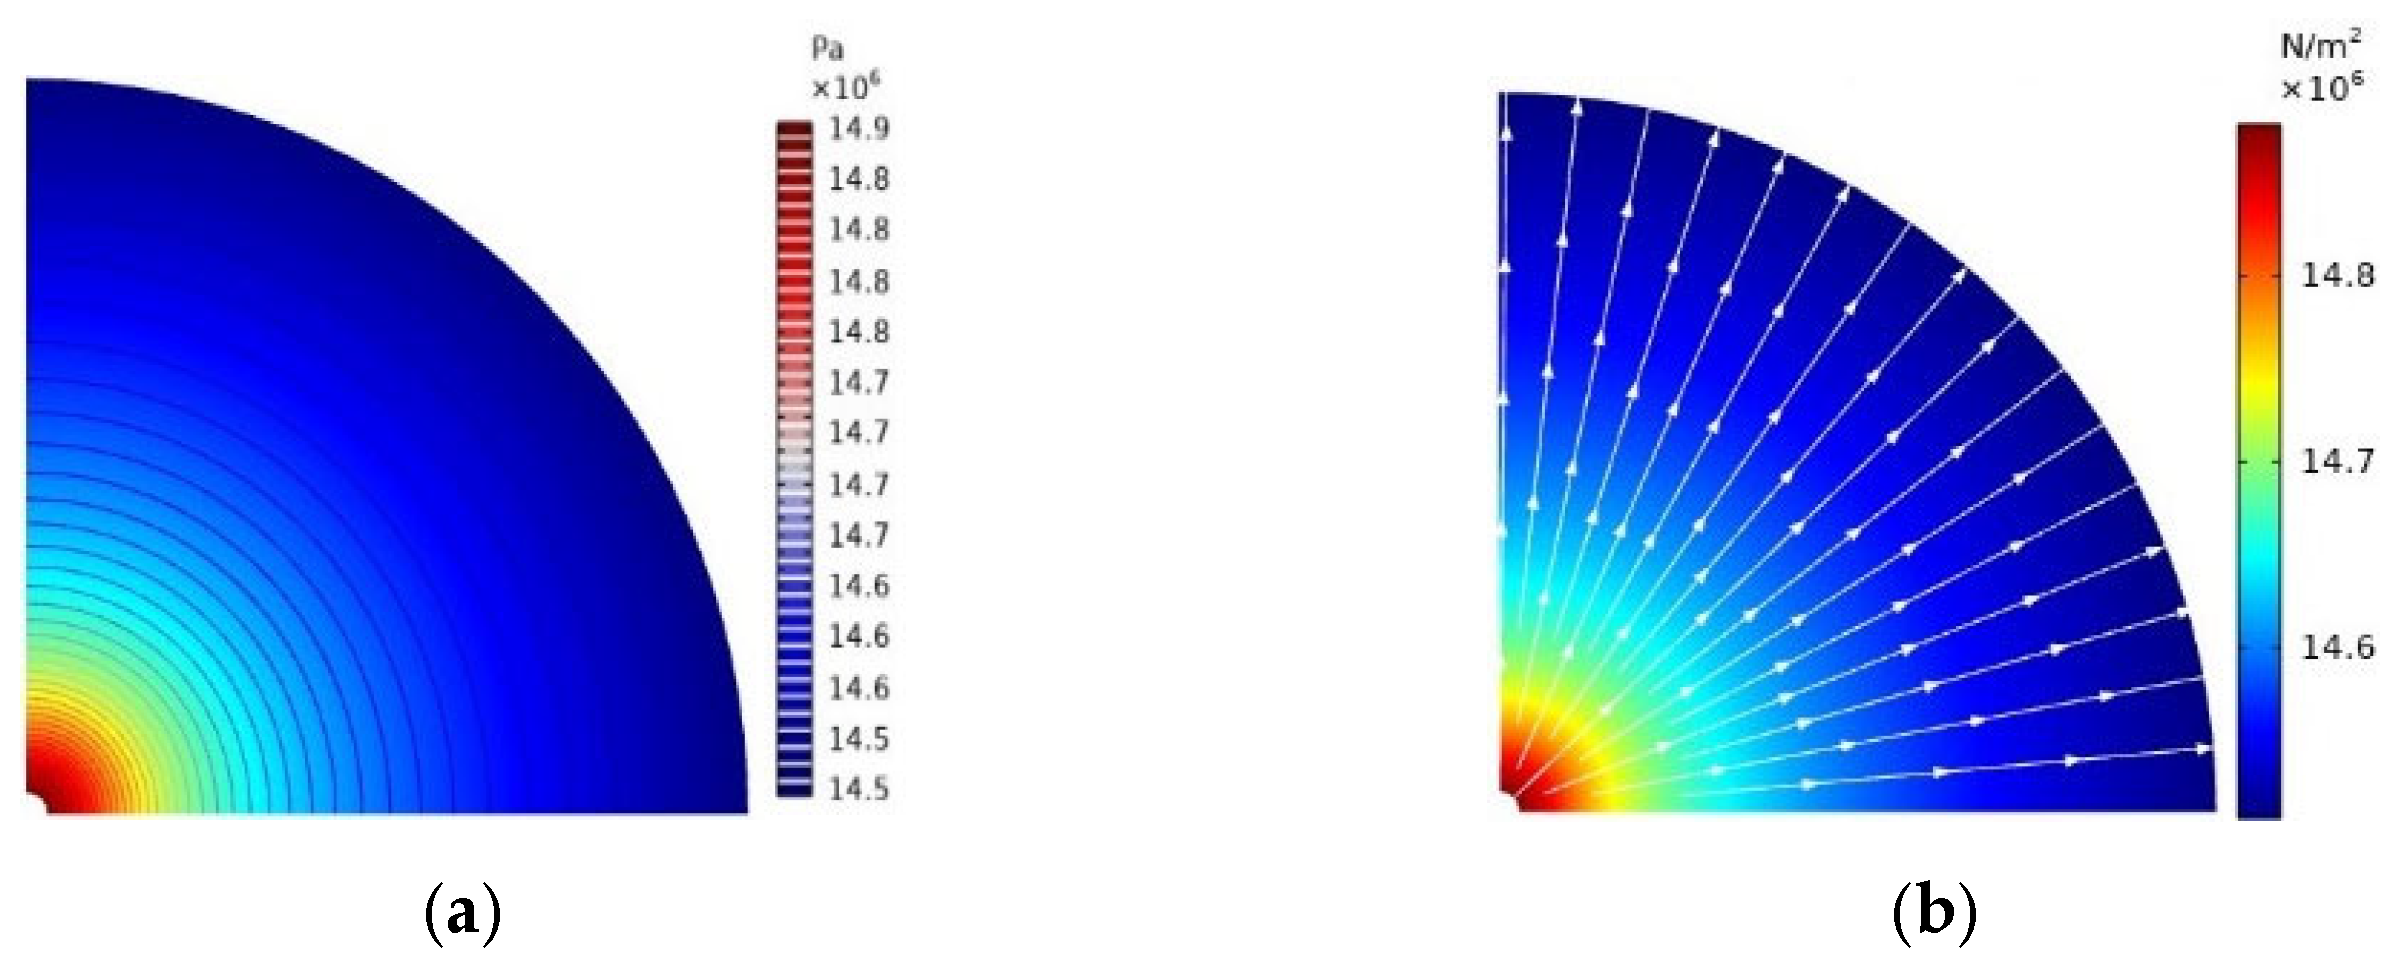
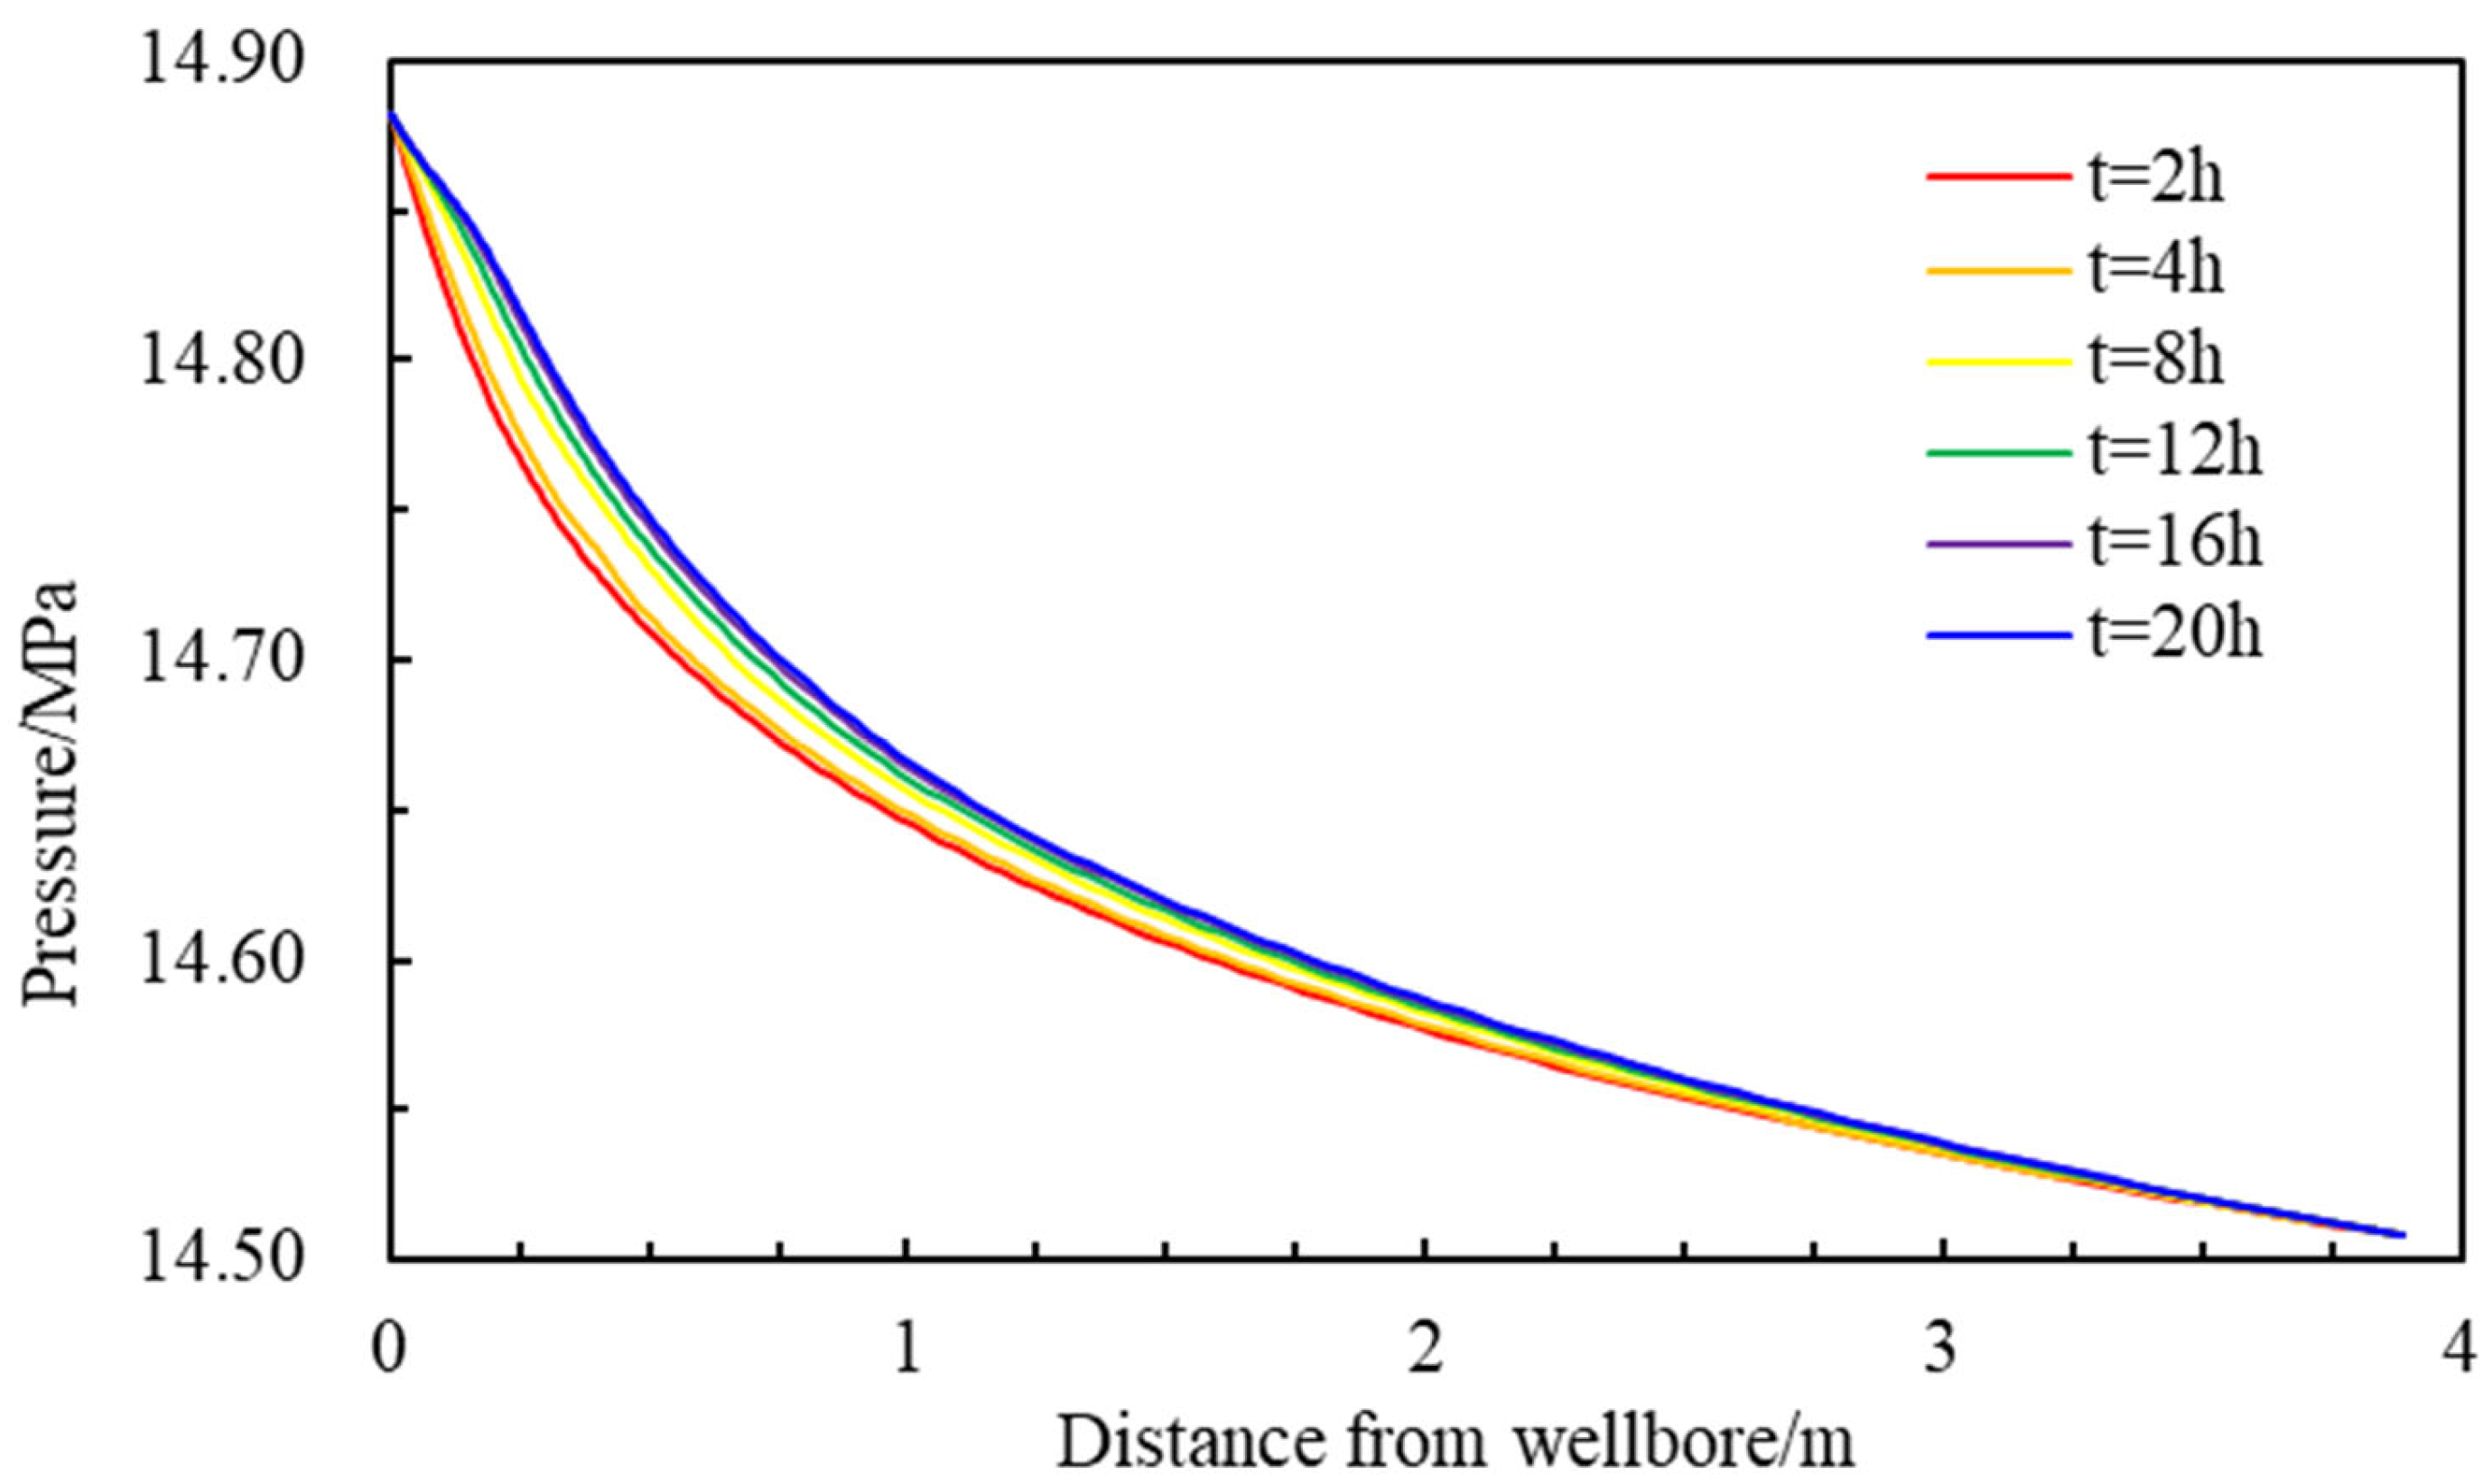
4.1.1. Distribution Pattern of Formation Pressure
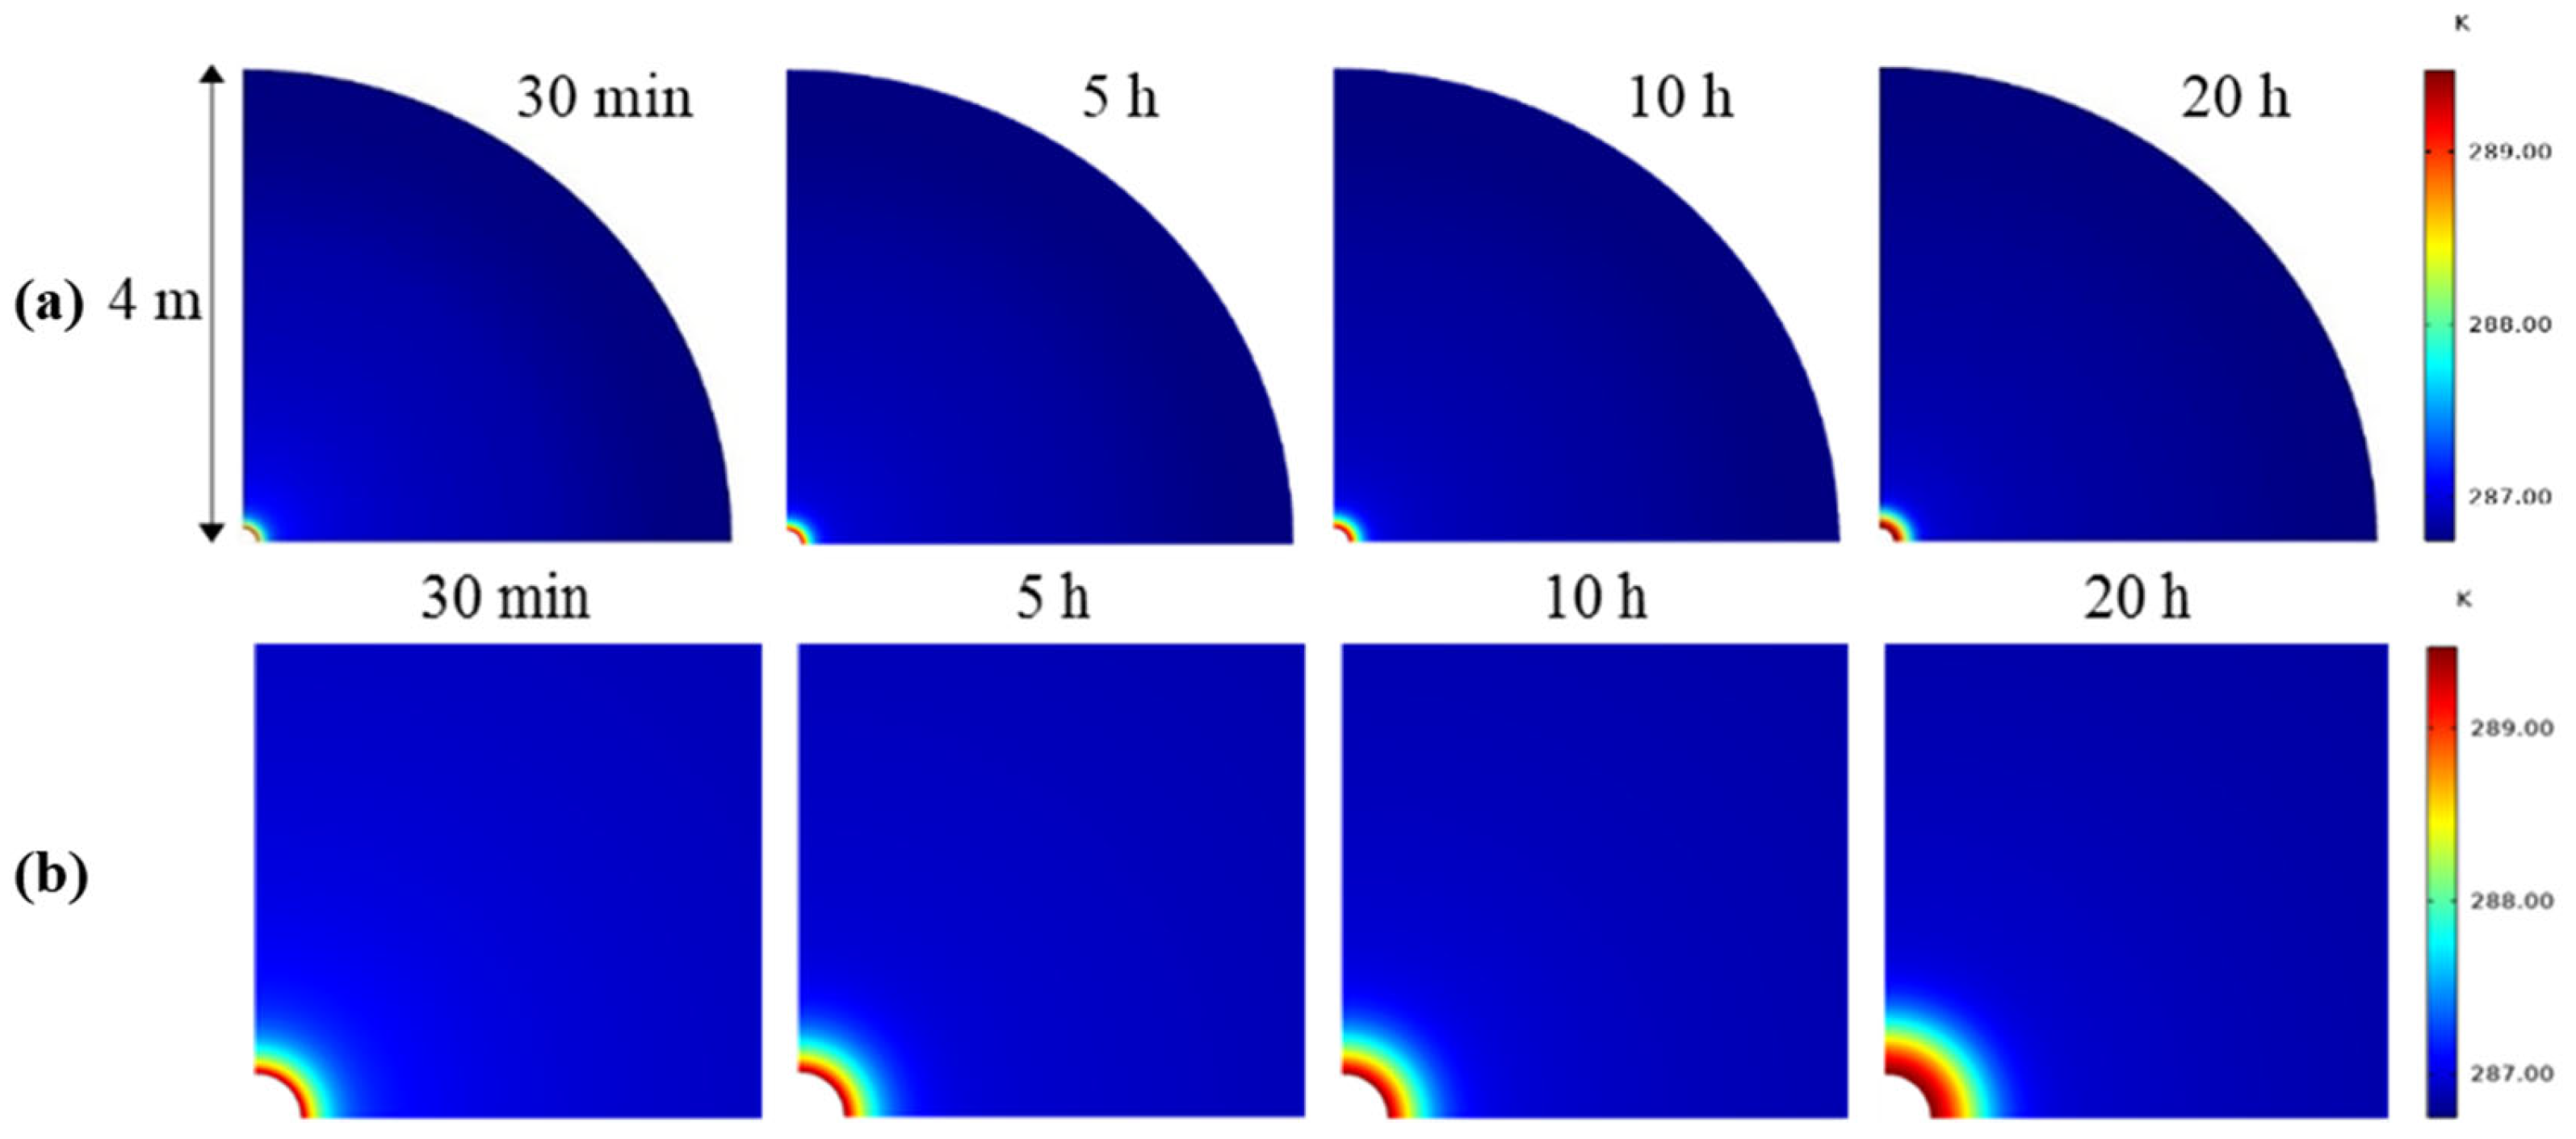
4.1.2. Distribution Pattern of Formation Temperatures
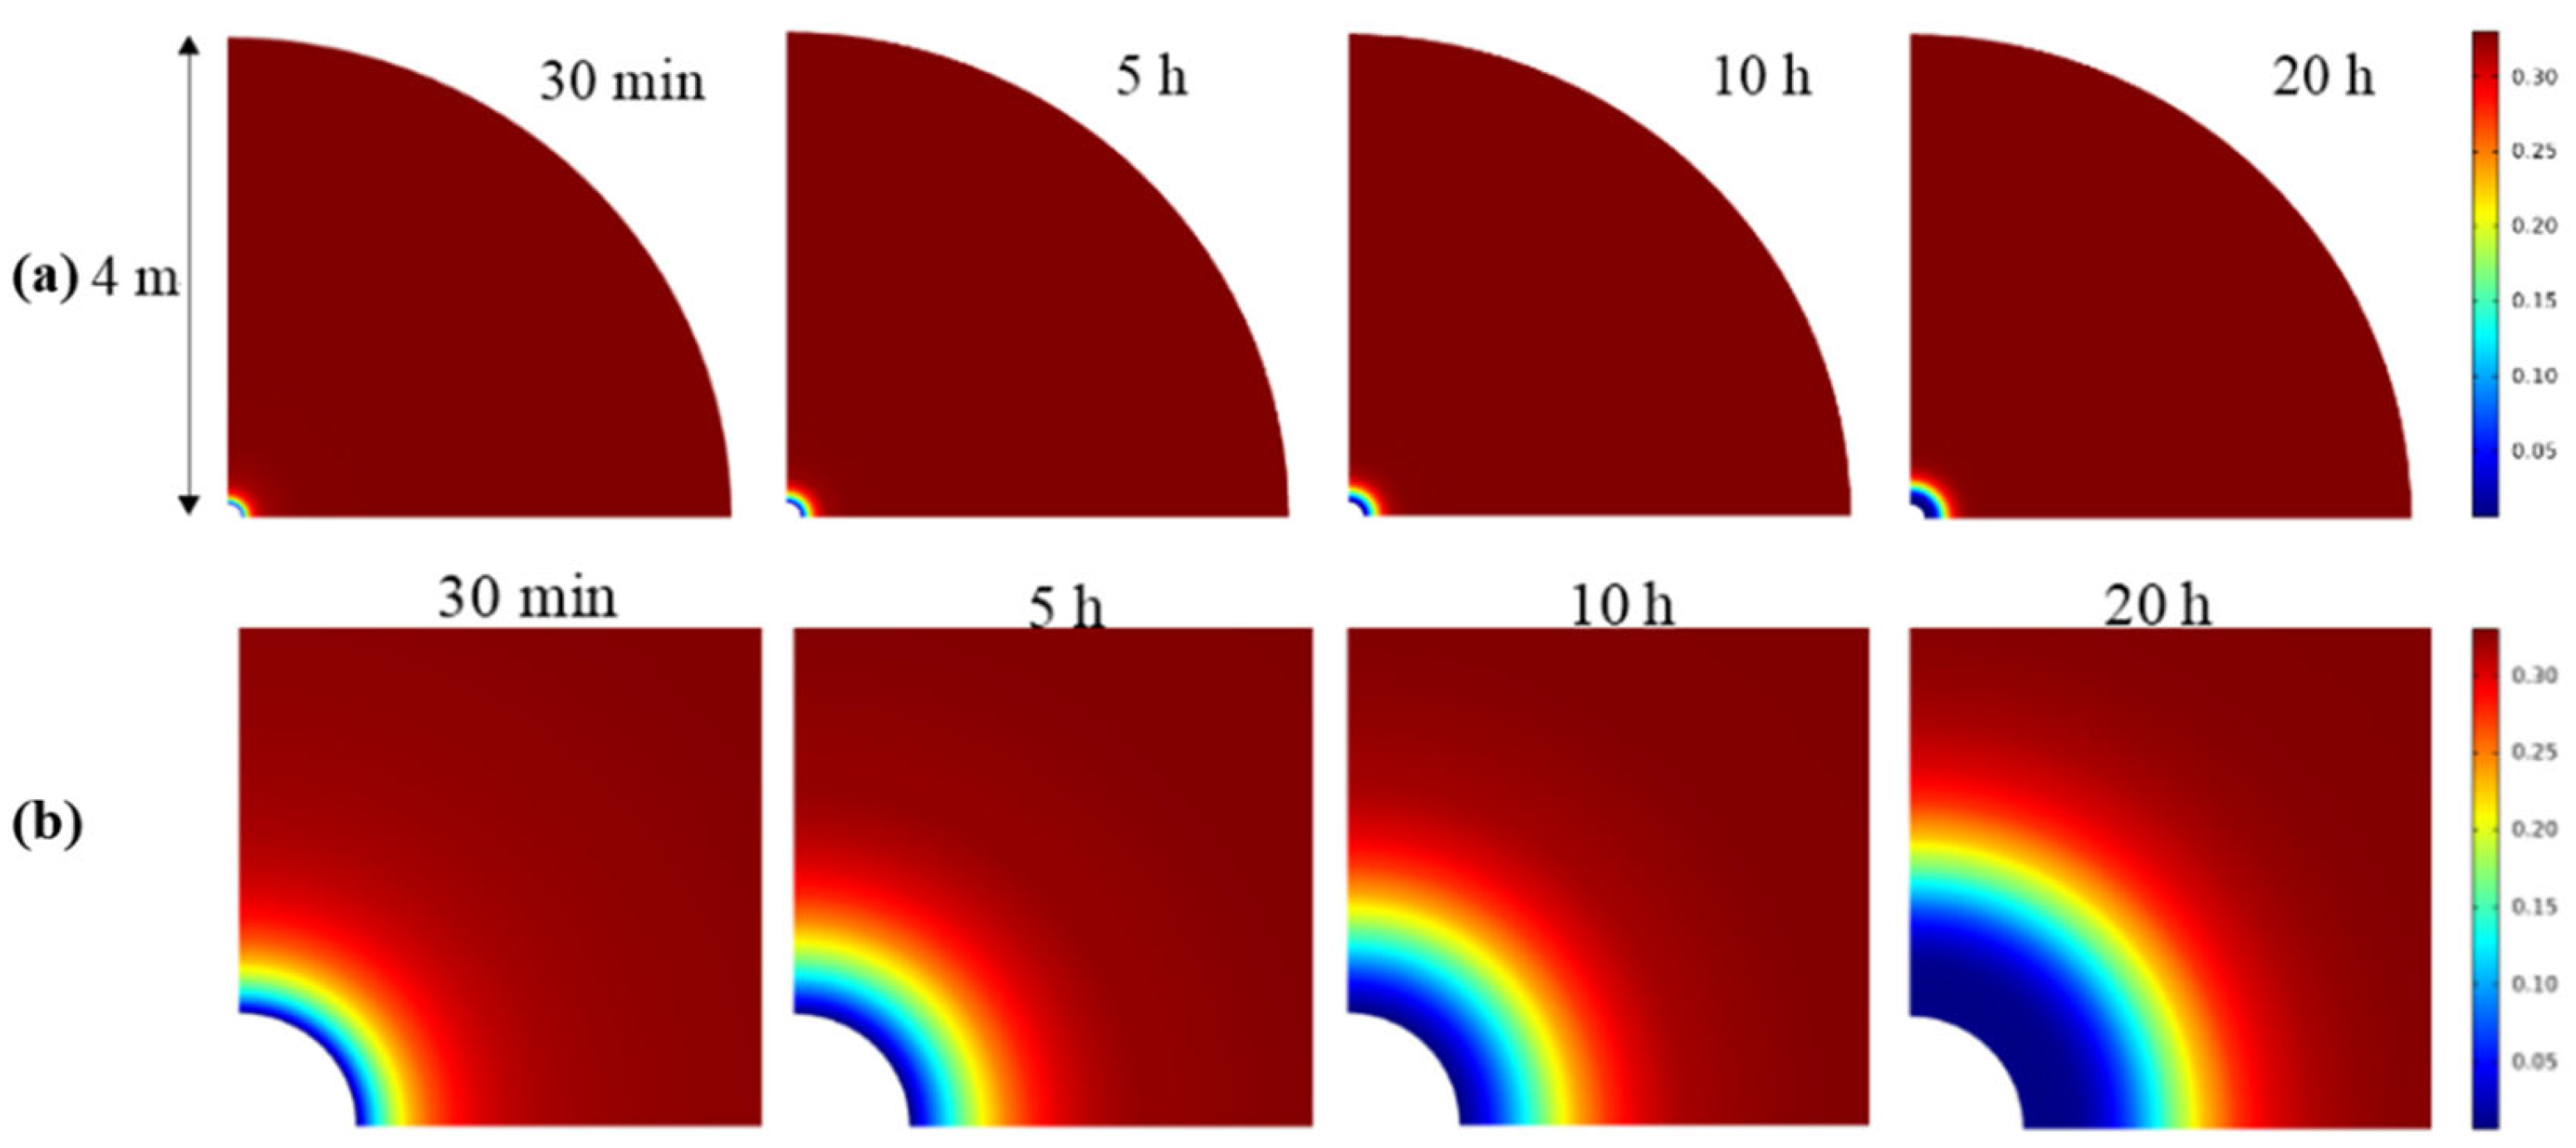
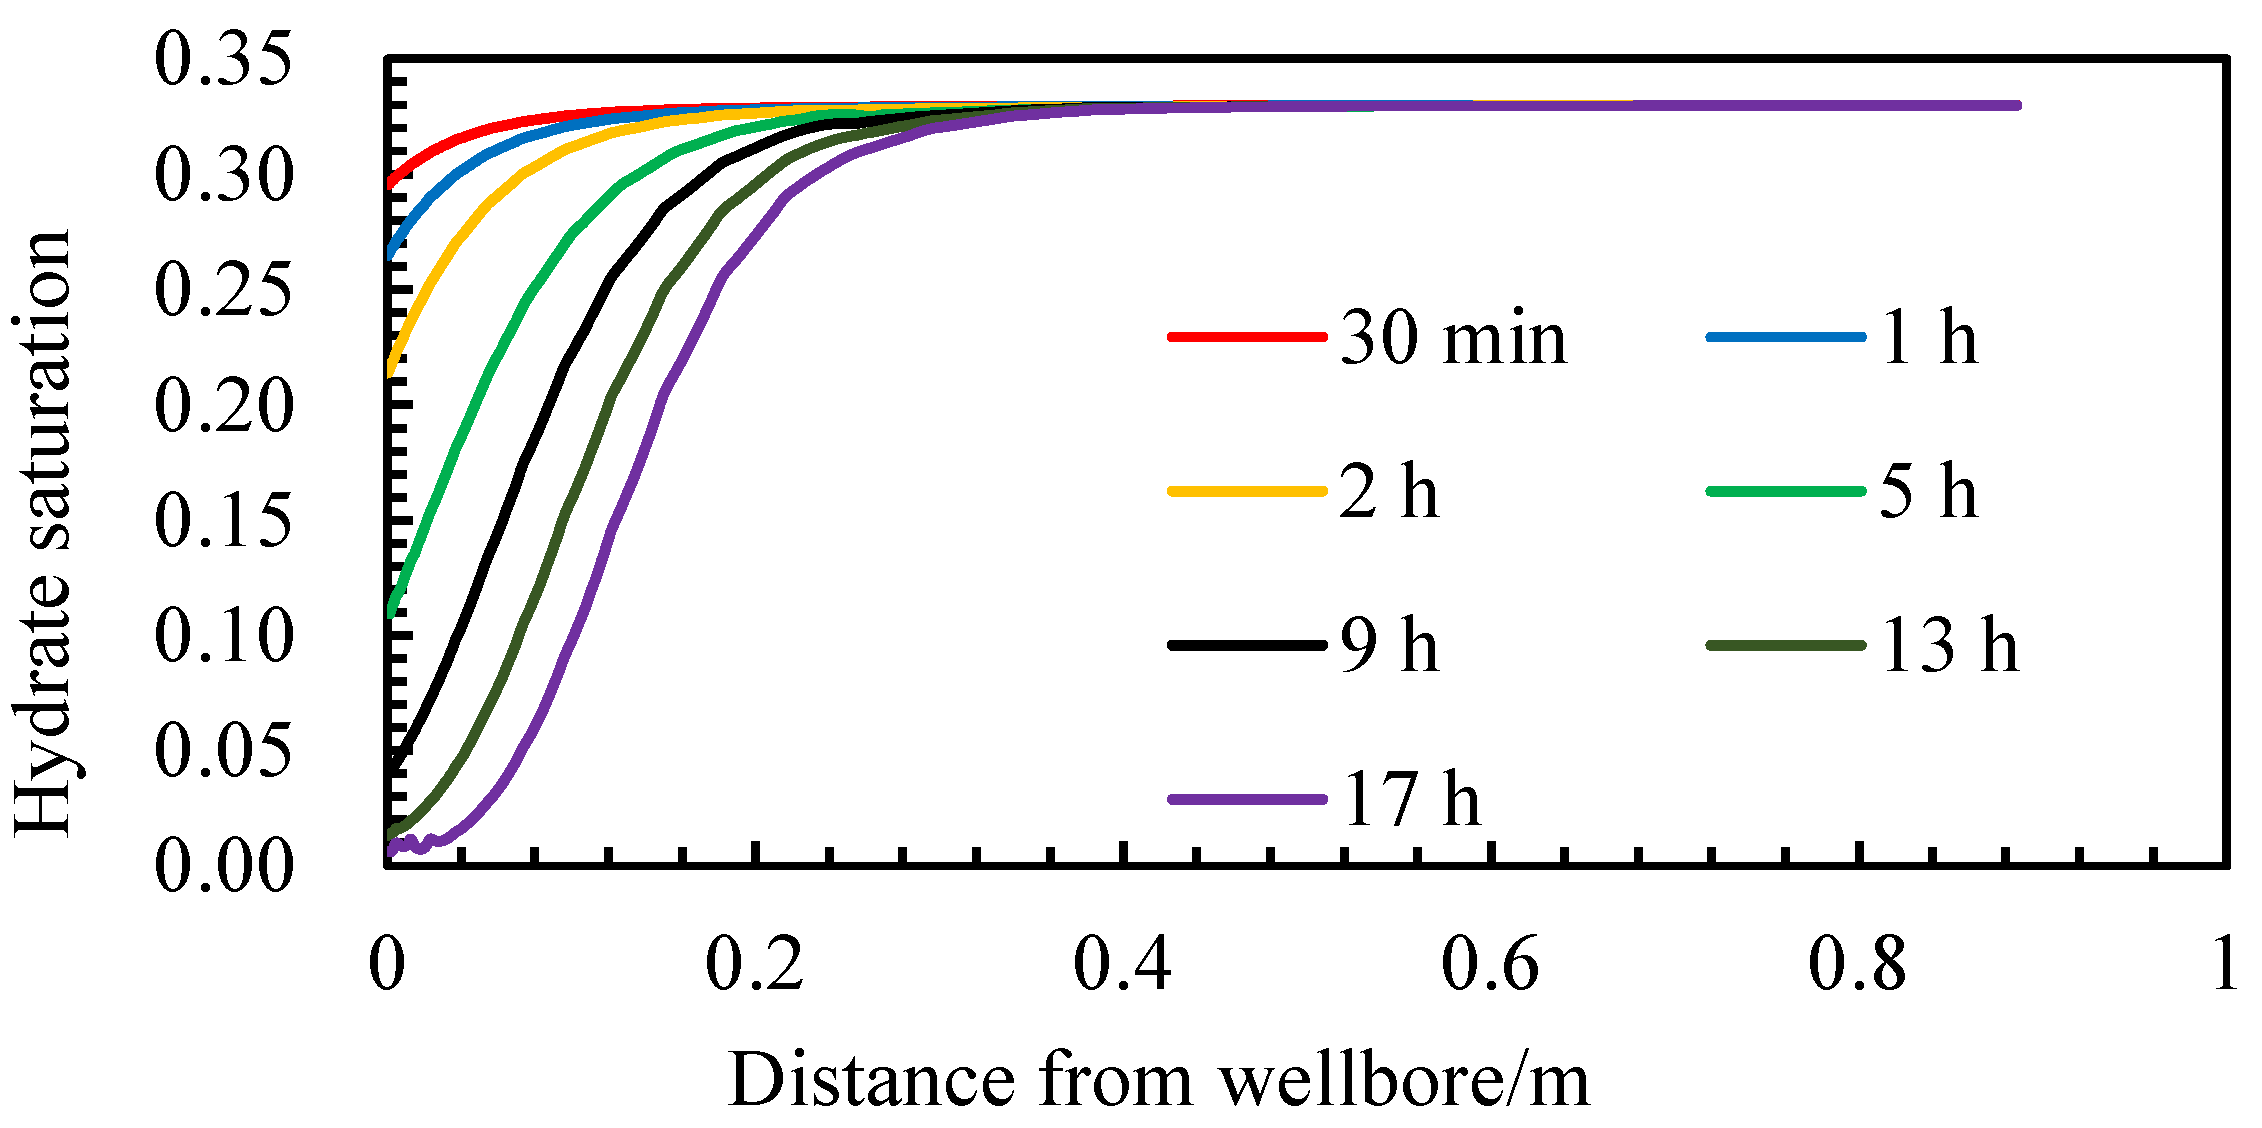
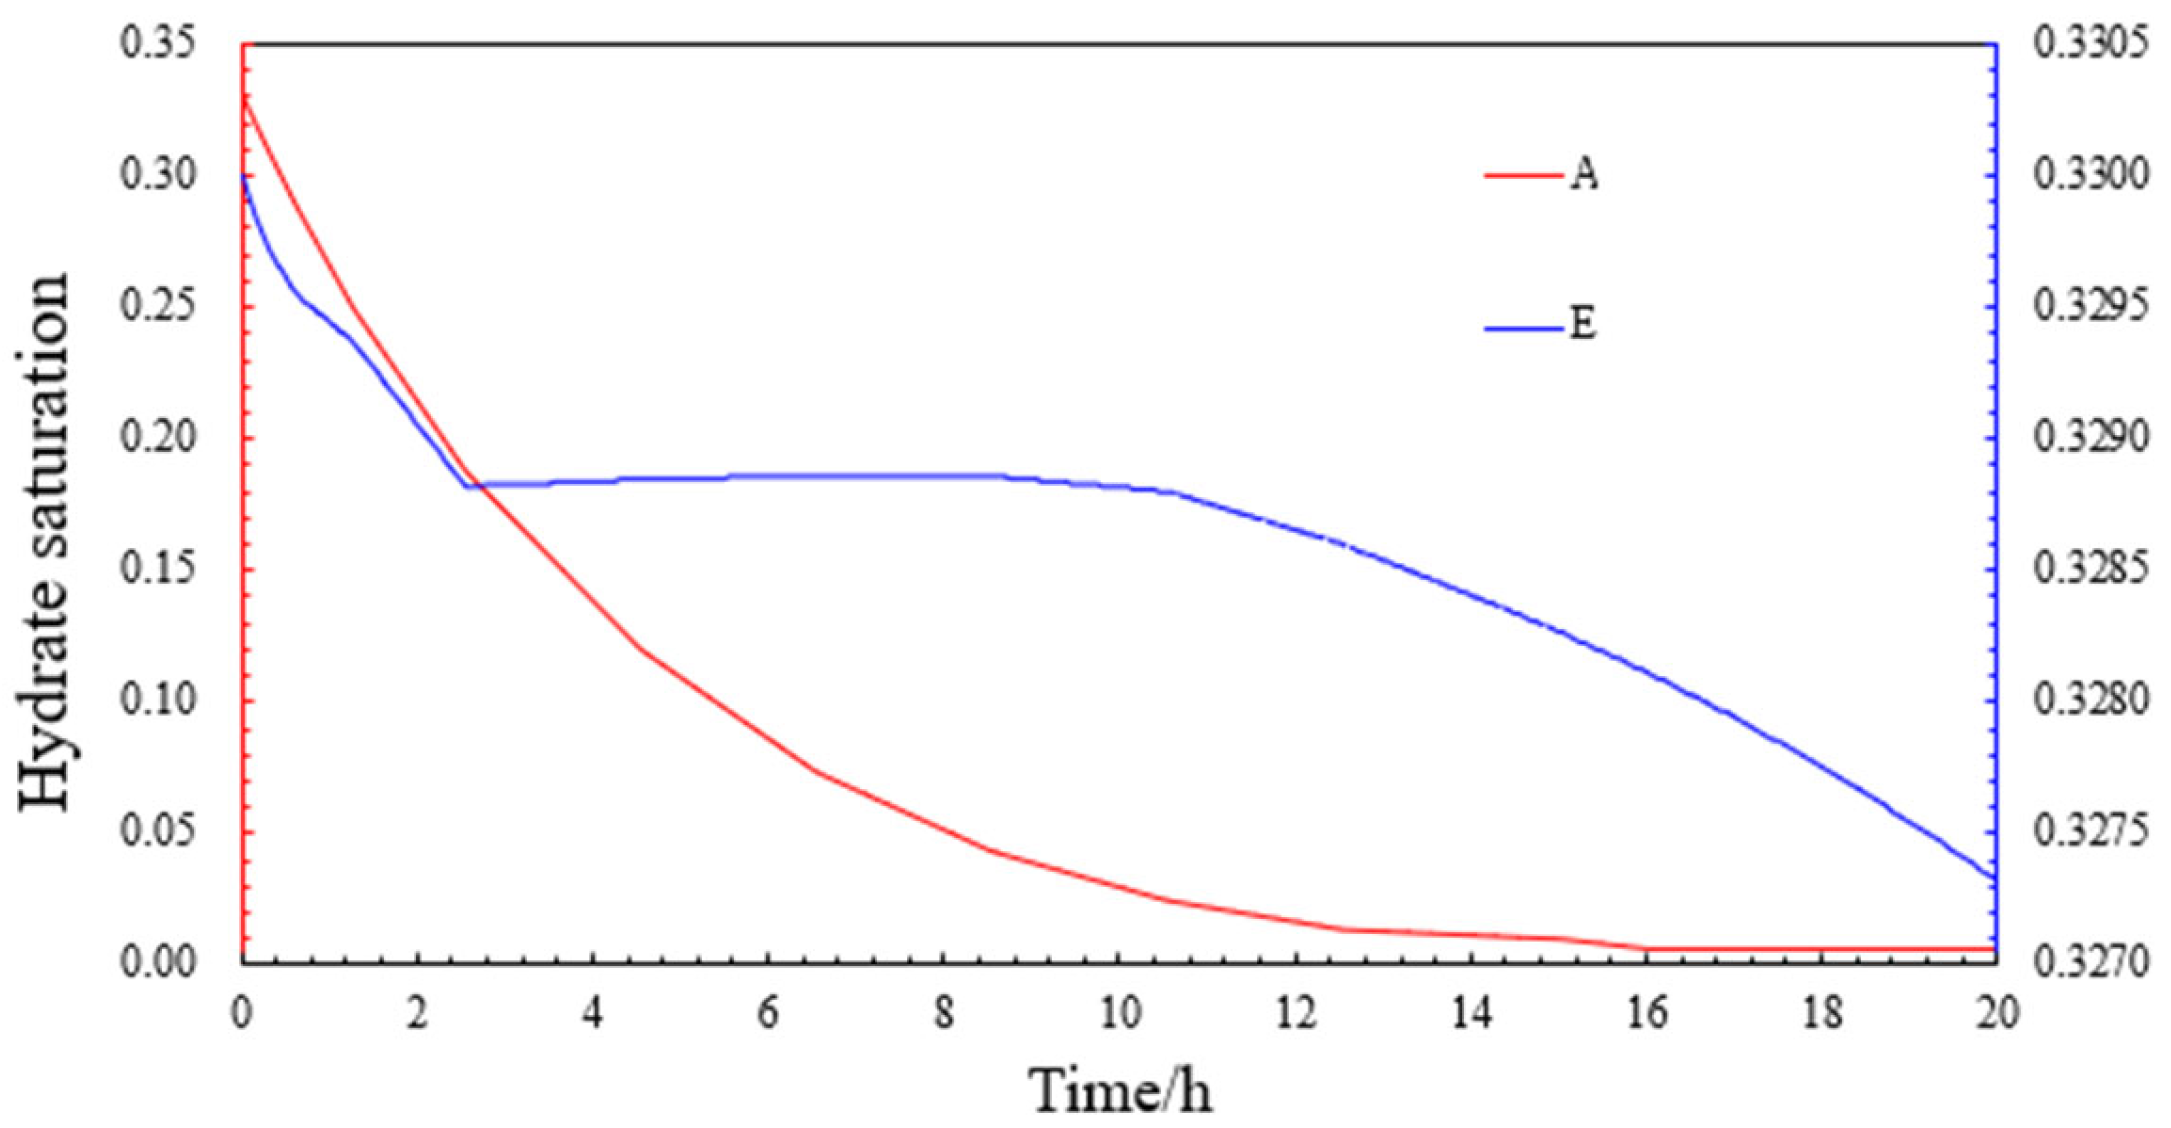
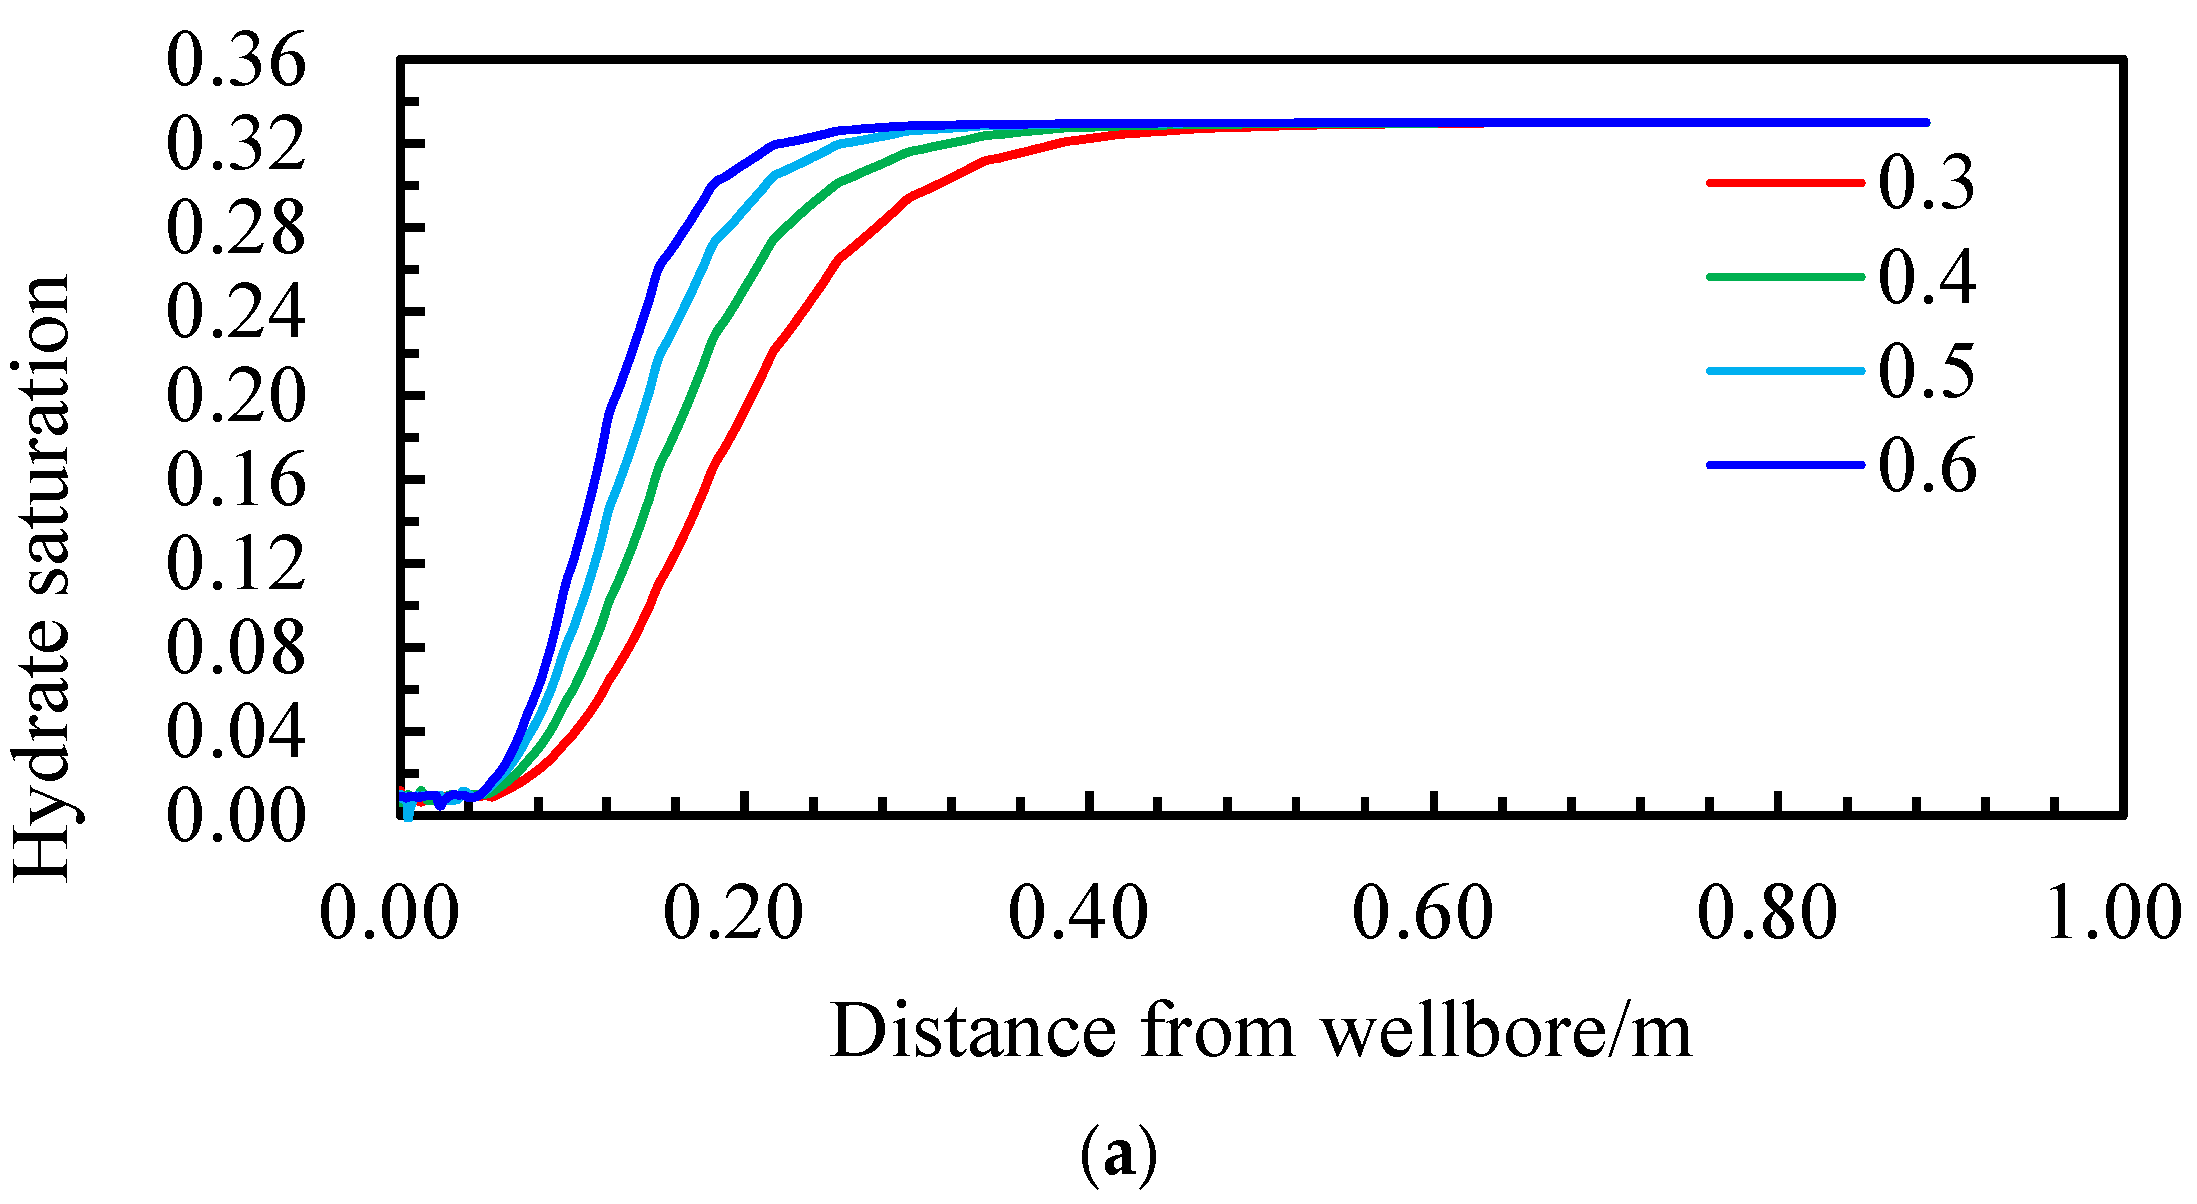
4.1.3. Distribution Pattern of Hydrate Saturation
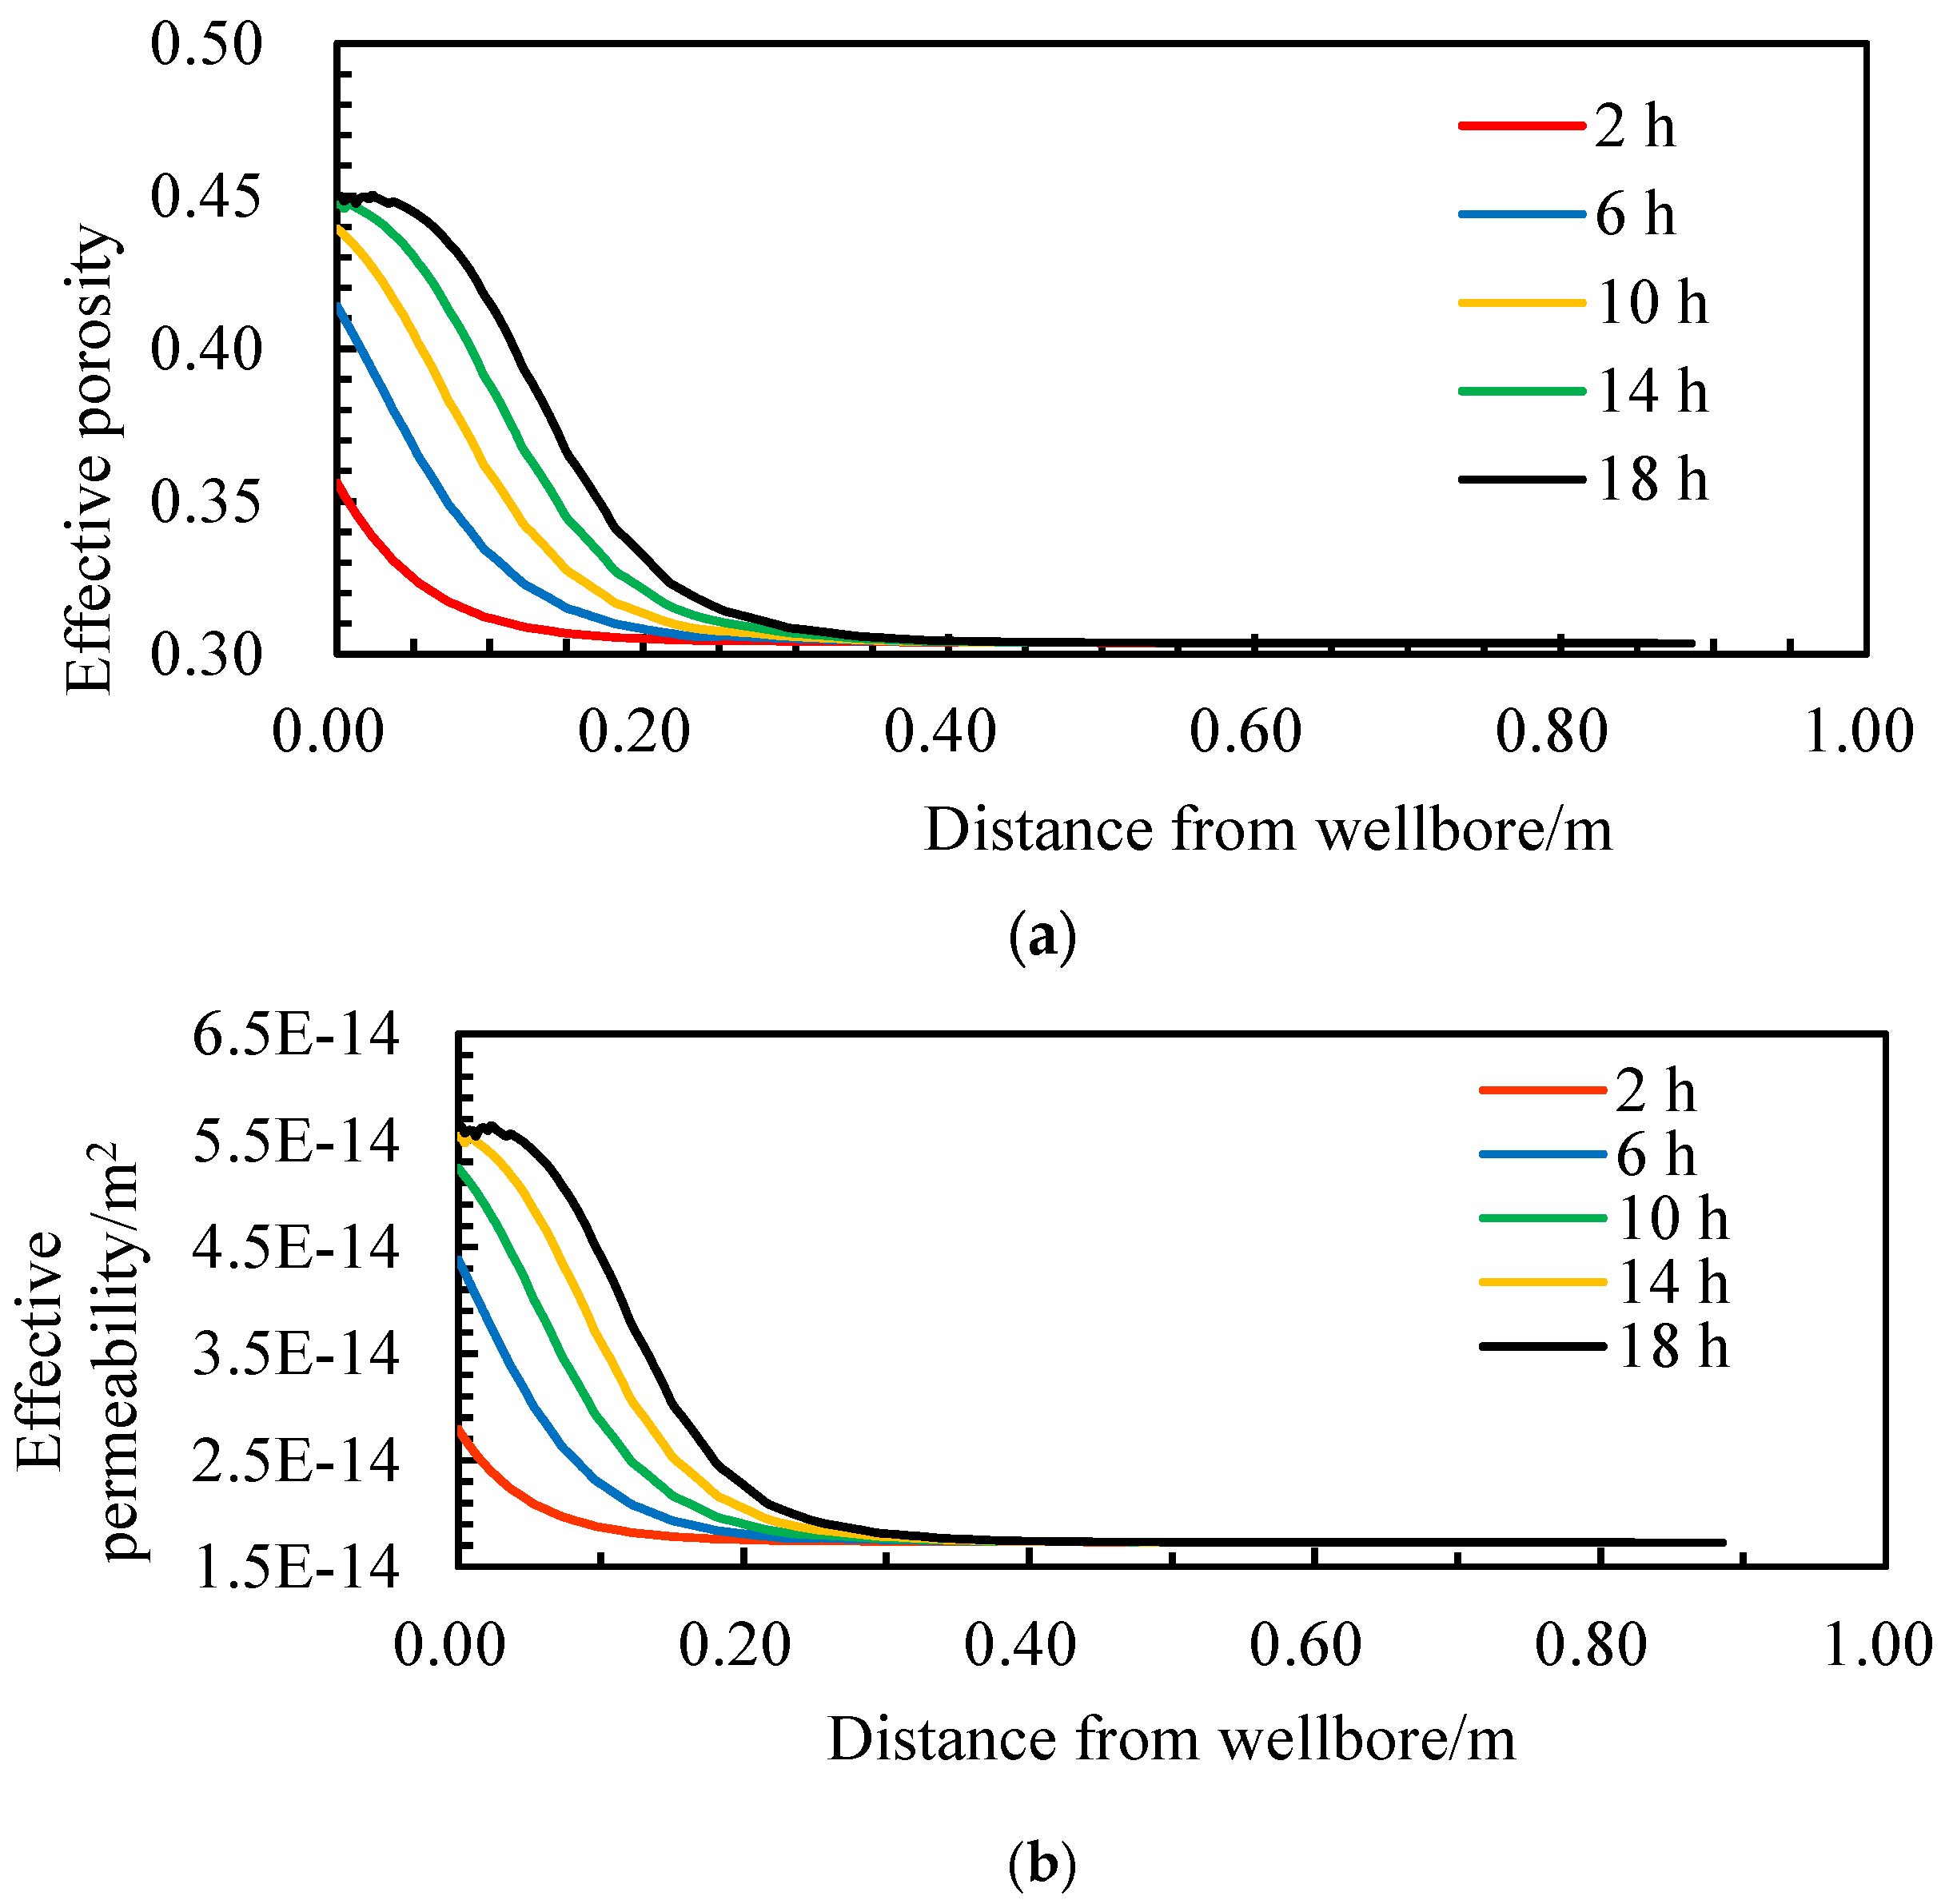
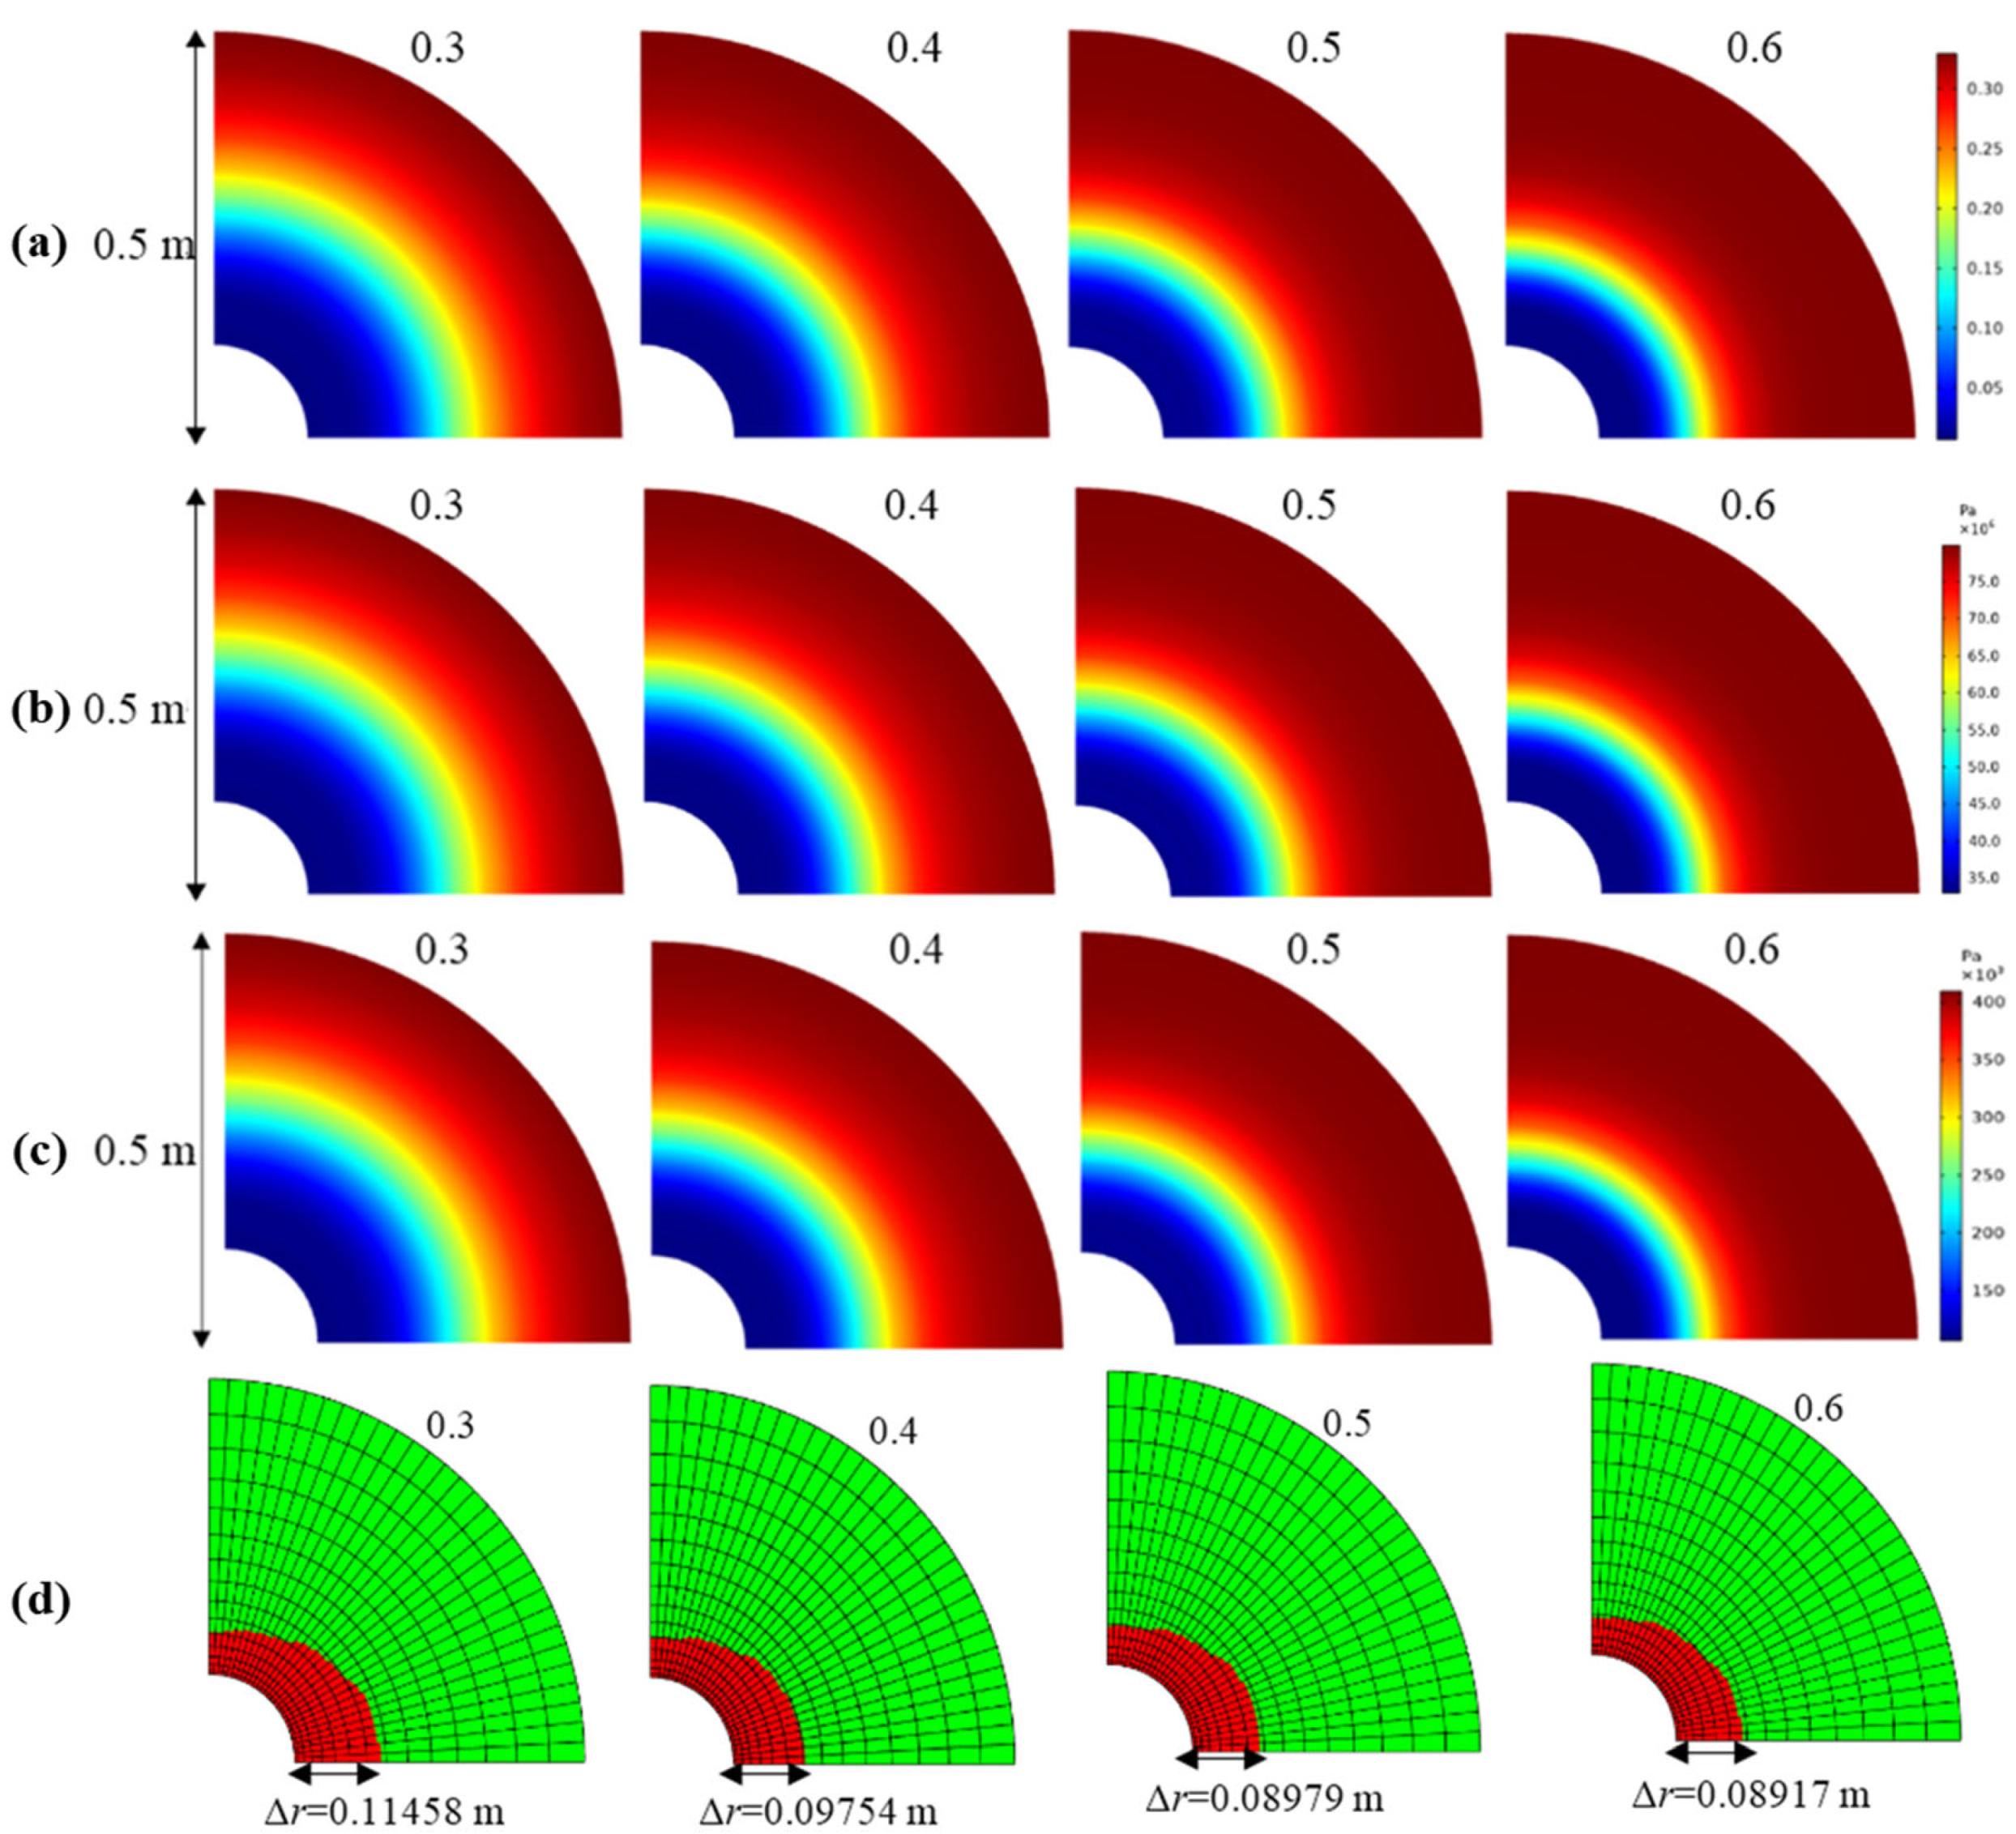
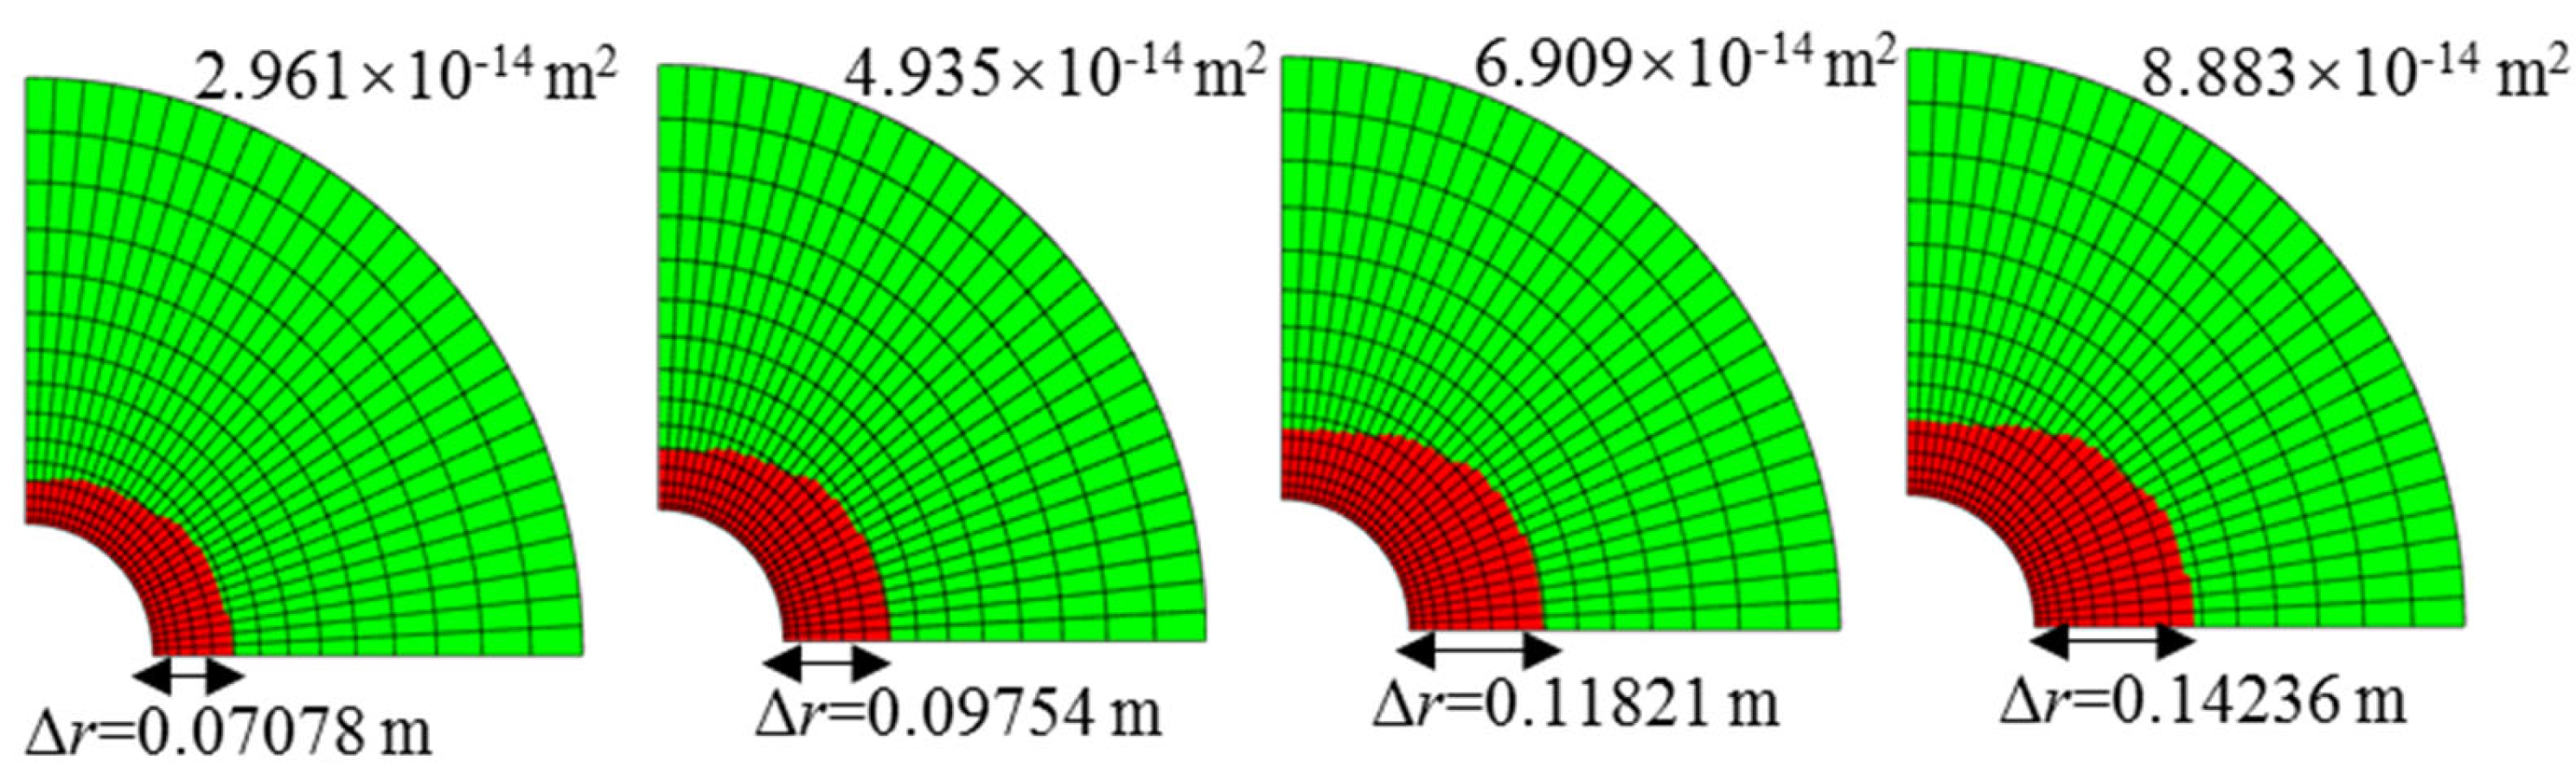
4.1.4. Distribution Patterns of Porosity and Permeability
4.2. Sensitivity Analysis
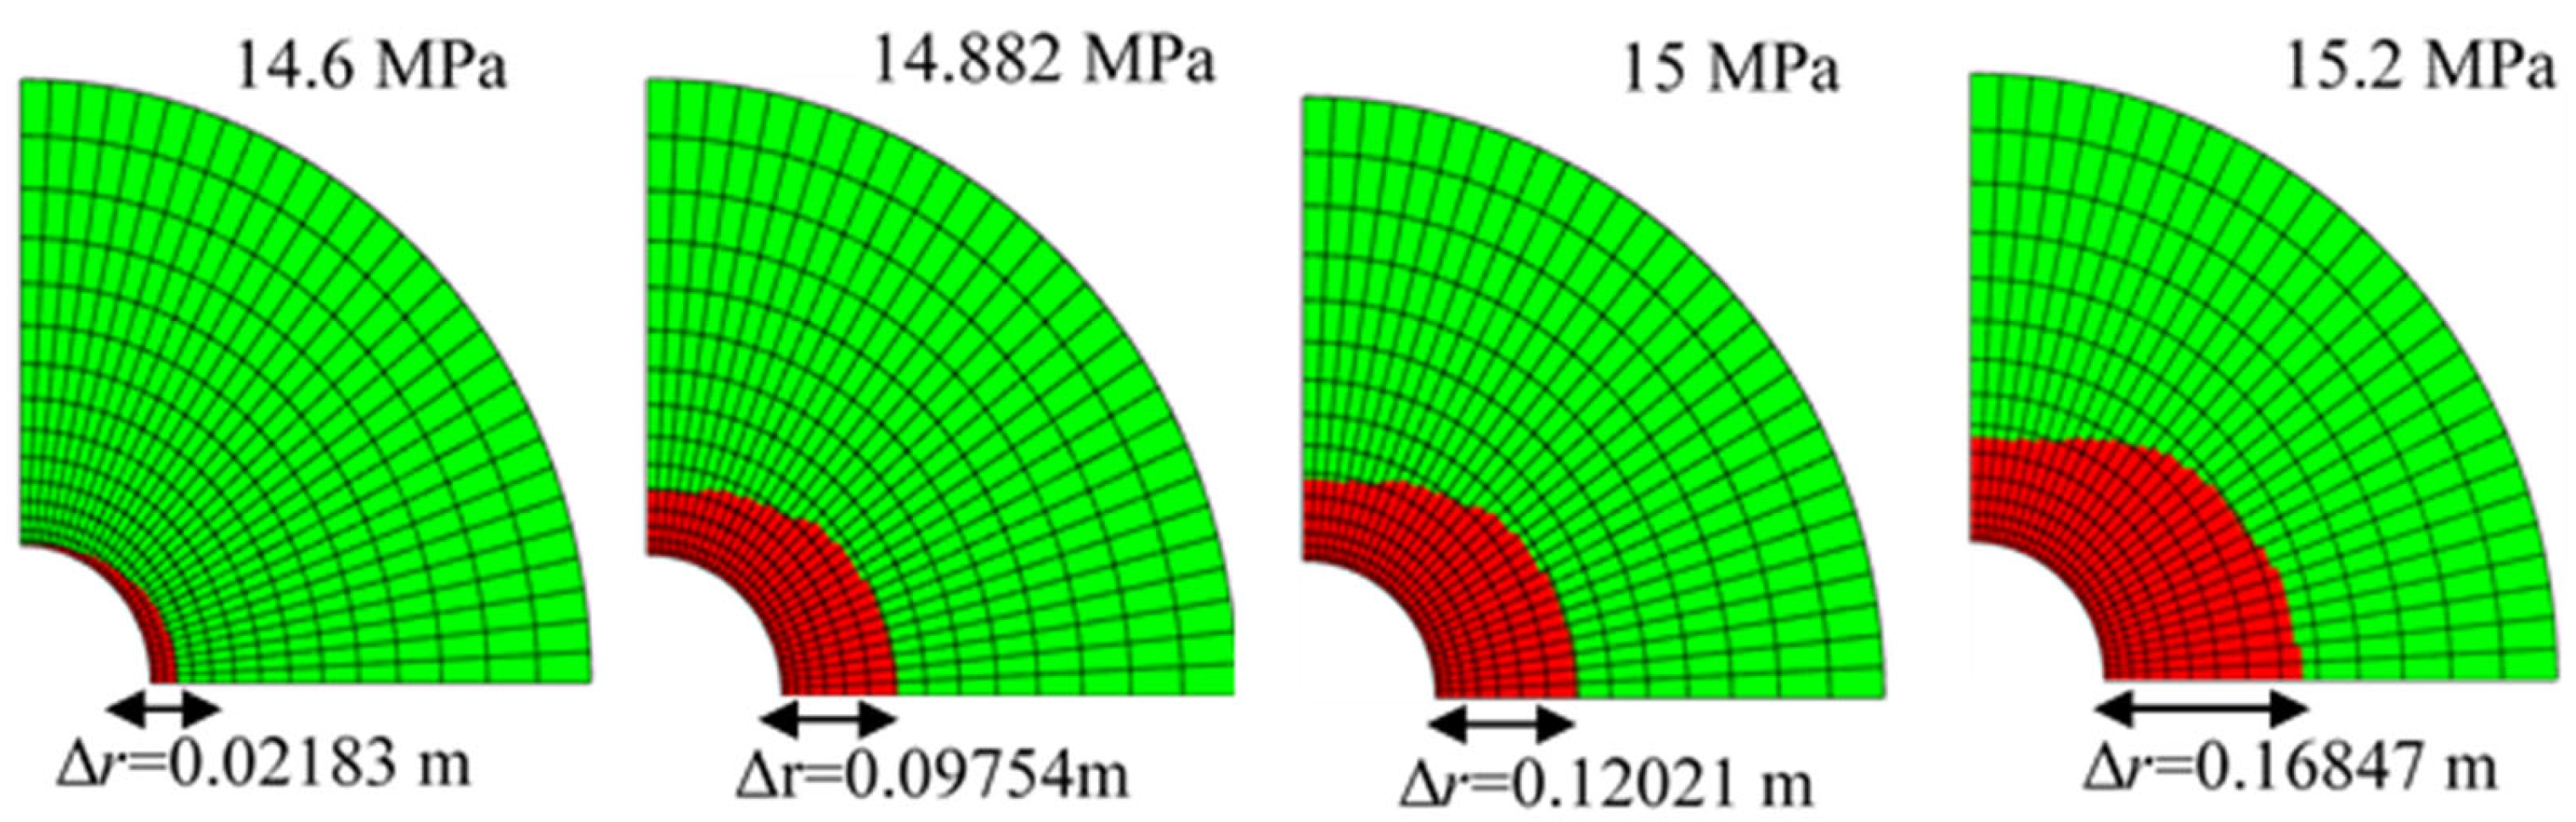
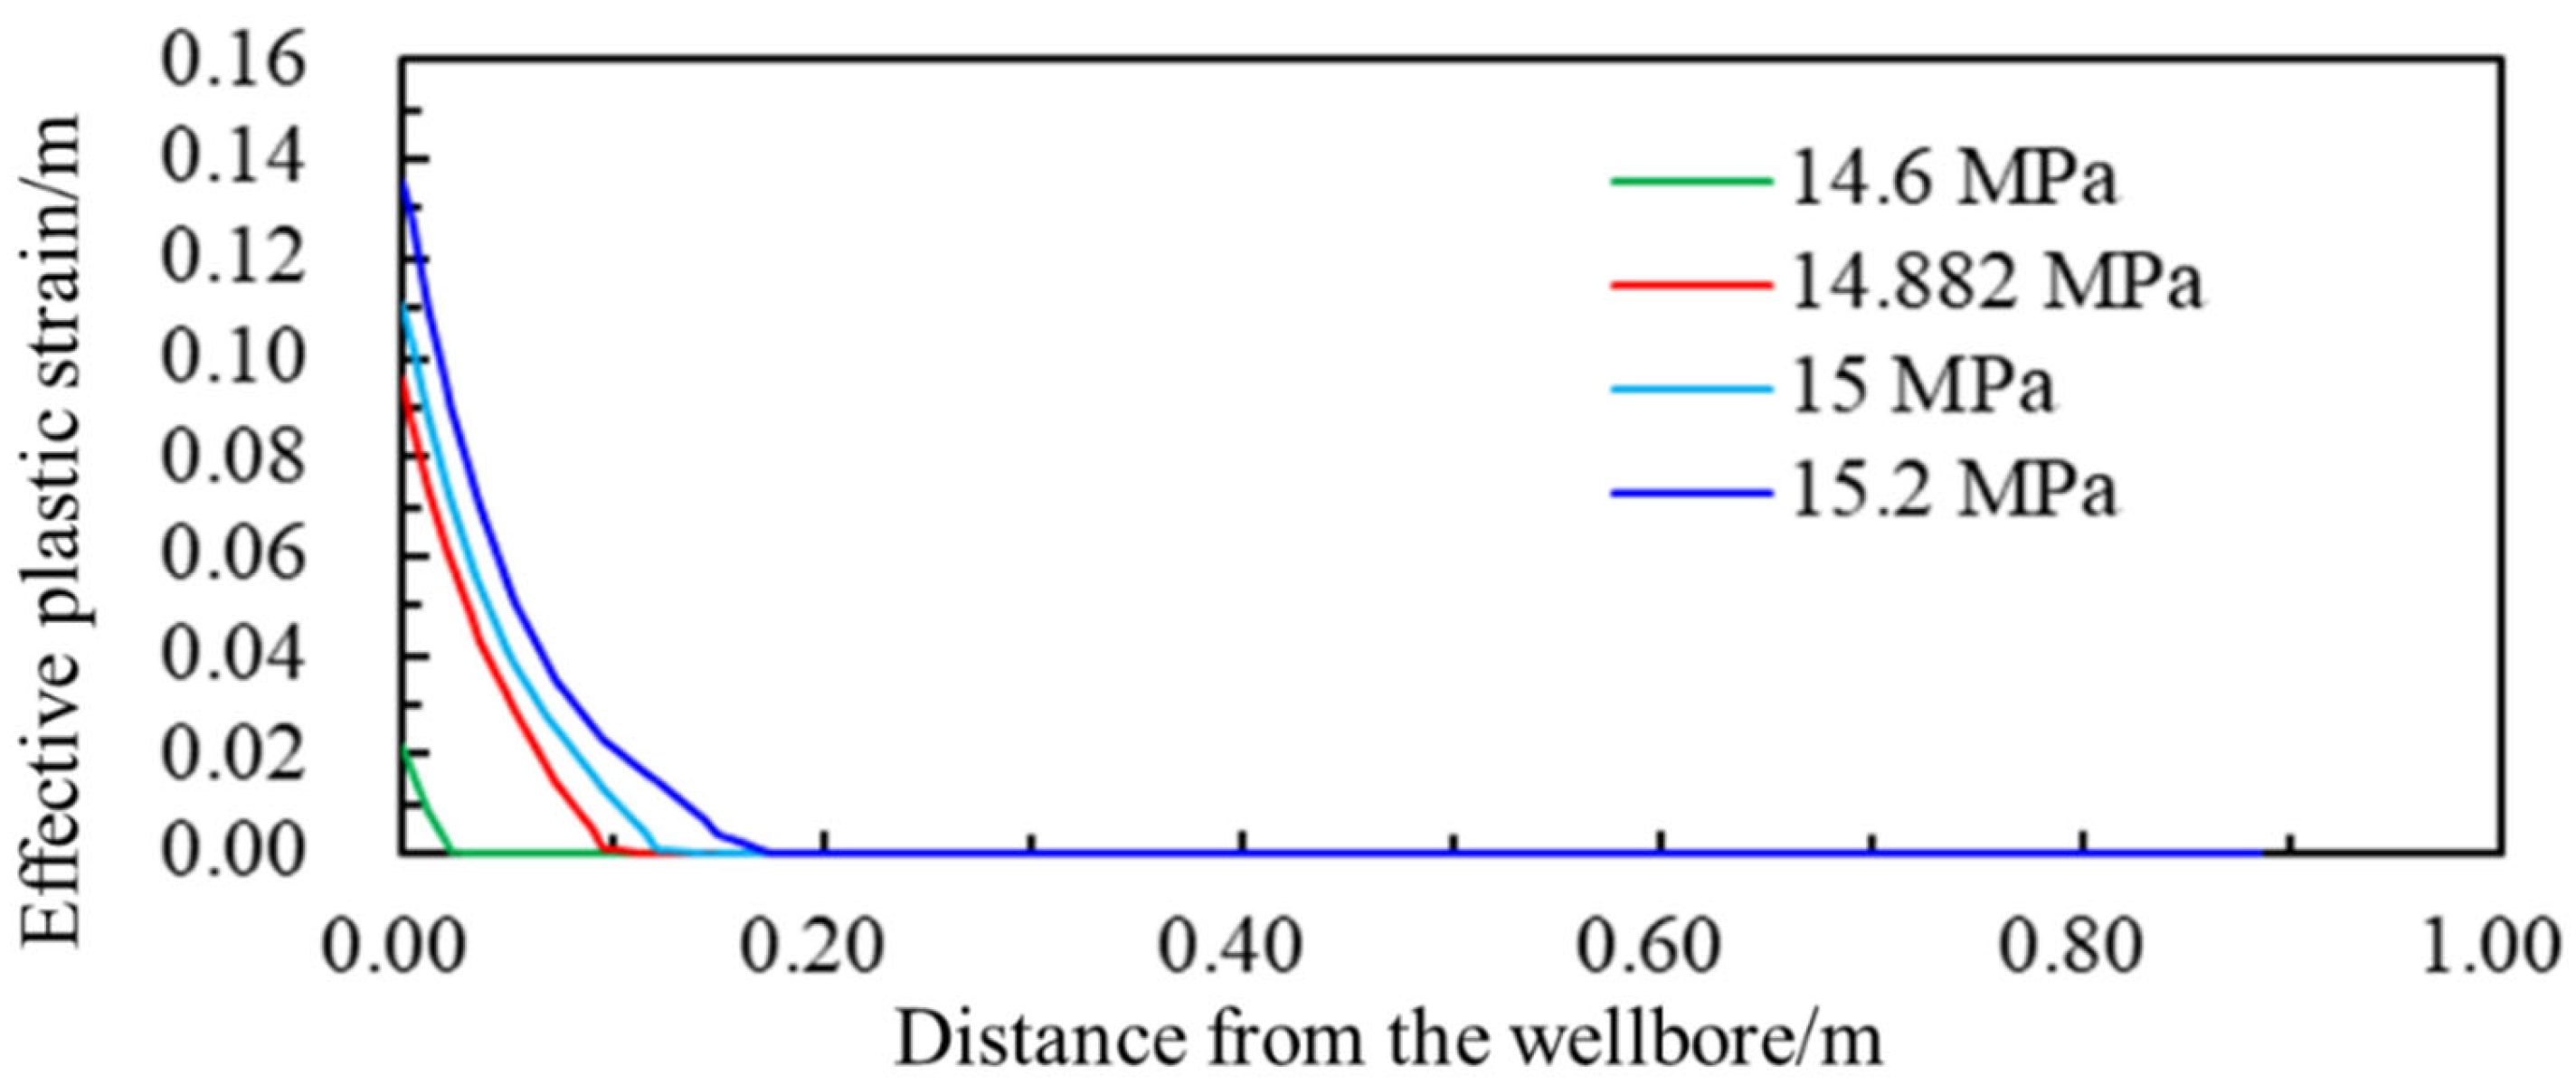
4.2.1. Pressure
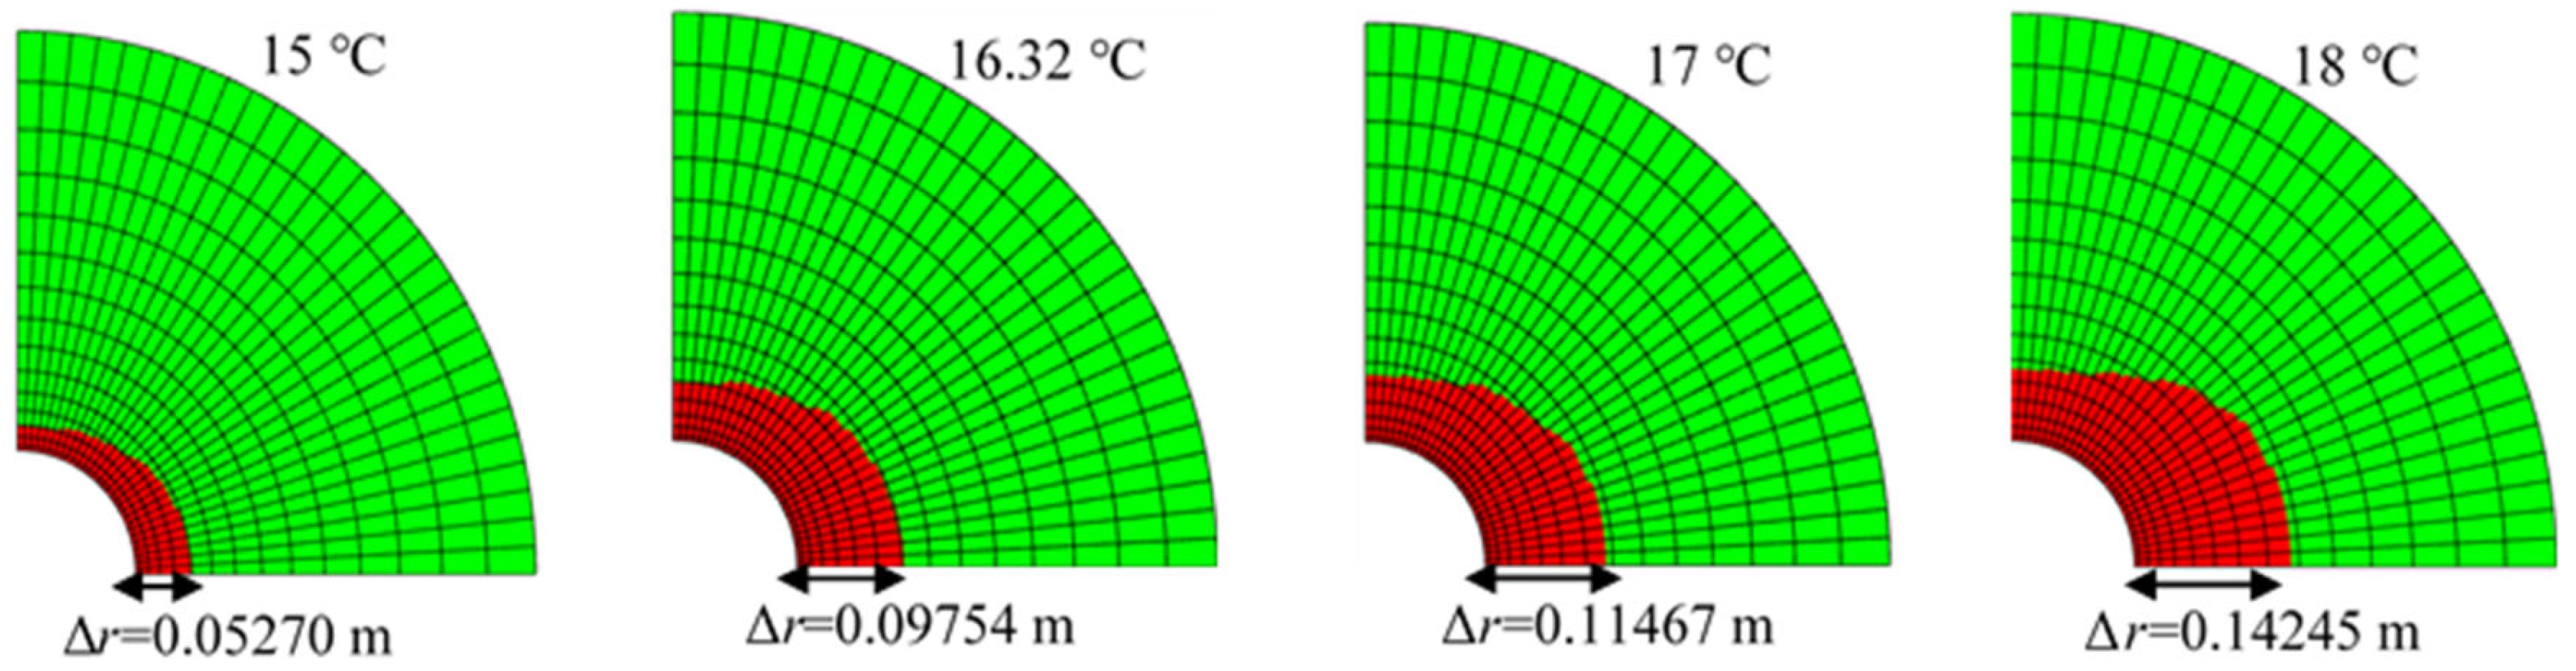
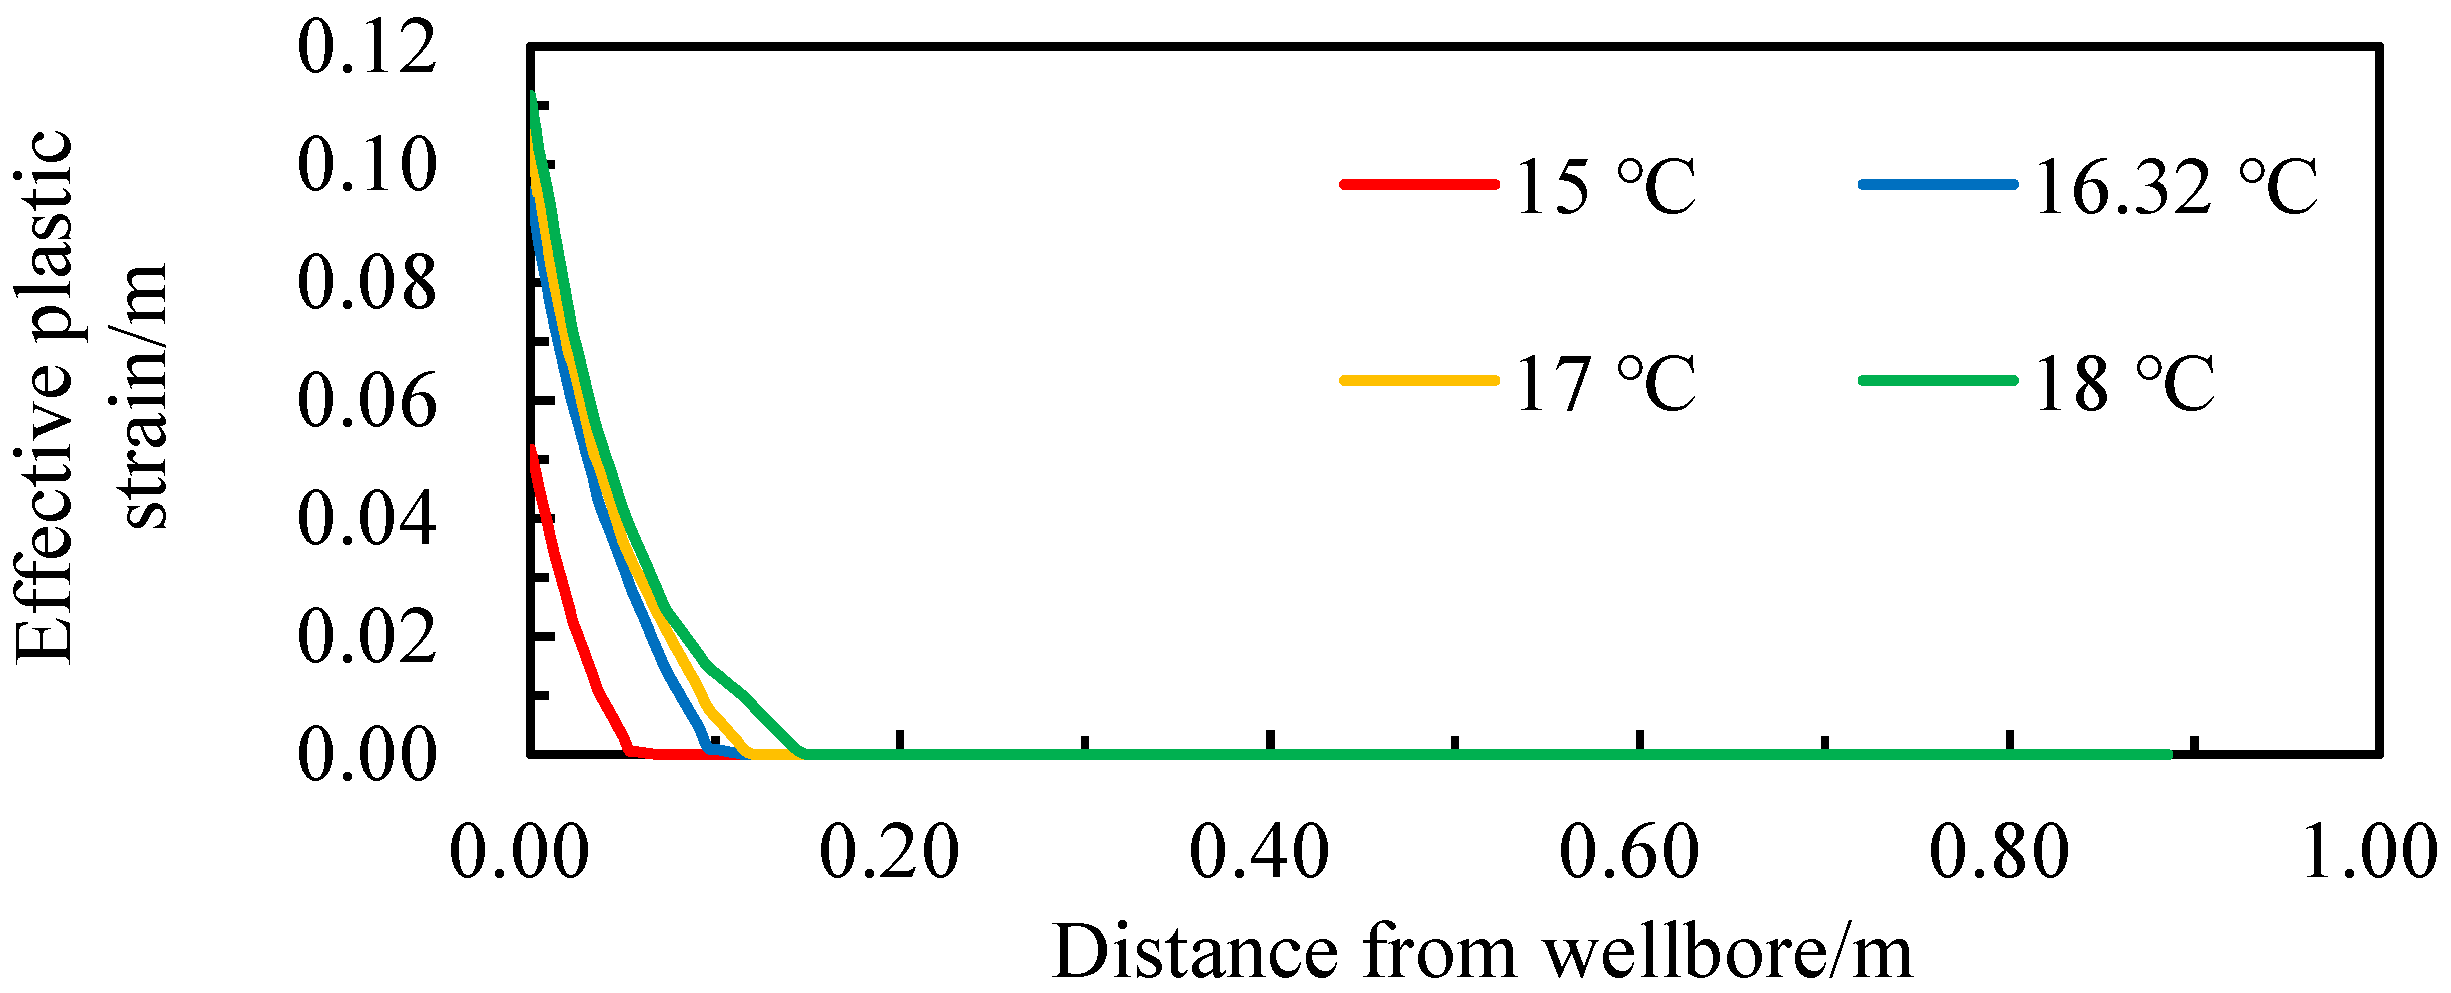
4.2.2. Temperature
4.2.3. Reservoir Porosity
4.2.4. Reservoir Permeability
5. Conclusions
- (1)
- The intrusion of drilling fluid into the hydrate reservoir under differential pressures is the main factor leading to the decrease in the mechanical strength of the formation. Gases and liquids generated by hydrate decomposition in the formation increase the pore pressure in the formation, thereby reducing the effective stress in the formation. The combination of the two causes the risk of wellbore destabilization to rise sharply in weakly cemented, poorly diagenetic hydrate reservoirs.
- (2)
- Since the stress distribution around horizontal wells is different from that around vertical wells, the plastic yield zone of horizontal wells is no longer in the shape of a regular fan ring but is unevenly distributed. The closer the formation is to the wellbore, the more complete the decomposition of hydrates in the formation is, and the greater the effective plastic strain is.
- (3)
- All other conditions being held constant, increases in drilling fluid intrusion pressure, temperature, and reservoir permeability will lead to an expansion of the range of decline in formation mechanical strength around the wellbore and the wellbore yield area. The wellbore production area will decrease with increasing reservoir porosity, which is beneficial for wellbore stability during drilling, but the risk of wellbore destabilization may increase dramatically once prolonged production occurs and the hydrates around the wellbore are fully decomposed.
- (1)
- Considering computational efficiency and accuracy, this article only established a two-dimensional numerical simulation model. In subsequent research, a three-dimensional physical model can be established to obtain more accurate research rules.
- (2)
- This article simplifies the influence of formation heat transfer, and in the future, research on the effects of formation heat transfer on rock skeleton and formation fluid properties can be considered.
Author Contributions
Funding
Institutional Review Board Statement
Informed Consent Statement
Data Availability Statement
Conflicts of Interest
References
- Kvenvolden, K.A.; Ginsburg, G.D.; Soloviev, V.A. Worldwide distribution of subaquatic gas hydrates. Geo-Mar. Lett. 1993, 13, 32–40. [Google Scholar] [CrossRef]
- Wang, W.; Zhang, C.; Wu, Y.; Zhang, S.; Xia, X. Prospects on technology for combining deep-sea geothermal energy with exploitation of natural gas hydrate. Mod. Chem. Ind. 2021, 41, 17–21. [Google Scholar]
- Ran, Q.; Gu, X. Coupling Analysis of Multiphase Flow and Stress for Oil Reservoir. Chin. J. Geotech. Eng. 1998, 20, 69–73. [Google Scholar]
- Hong, H.; Pooladi-Darvish, M.; Bishnoi, P.R. Analytical Modelling of Gas Production From Hydrates in Porous Media. J. Can. Pet. Technol. 2003, 42, 45–56. [Google Scholar] [CrossRef]
- Xu, D.; Chen, Y.; Han, X.; Hao, G.; Lu, J.; Lan, Q. Prospects on combined technology for CO2 replacement and exploitation of natural gas hydrate in sea. Mod. Chem. Ind. 2021, 41, 22–26, 32. [Google Scholar]
- Zhang, R. Study on Risk of Deepwater Gas Hydrate Formation Instability and Well Integrity during Drilling and Production; China University of Petroleum (East China): Qingdao, China, 2017. [Google Scholar]
- Li, G.; Moridis, G.J.; Zhang, K.; Li, X.-S. The use of huff and puff method in a single horizontal well in gas production from marine gas hydrate deposits in the Shenhu Area of South China Sea. J. Pet. Sci. Eng. 2011, 11, 49–68. [Google Scholar] [CrossRef]
- Shen, H. Fluid-Solid Coupling Numerical Simulation on Natural Gas Production from Hydrate Reservoirs by Depressurization; China University of Petroleum (East China): Qingdao, China, 2009. [Google Scholar]
- Liao, Y.; Wang, Z.; Chao, M.; Sun, X.; Wang, J.; Zhou, B.; Sun, B. Coupled wellbore–reservoir heat and mass transfer model for horizontal drilling through hydrate reservoir and application in wellbore stability analysis. J. Nat. Gas Sci. Eng. 2021, 95, 104216. [Google Scholar] [CrossRef]
- Yun, T.S.; Santamarina, J.C.; Ruppel, C. Mechanical properties of sand, silt, and clay containing tetrahydrofuran hydrate. J. Geophys. Res. Solid Earth 2007, 112, 1–13. [Google Scholar] [CrossRef]
- Hyodo, M.; Li, Y.; Yoneda, J. Mechanical behavior of gas-saturated methane hydrate-bearing sediments. J. Geophys. Res. Solid Earth 2013, 118, 5185–5194. [Google Scholar] [CrossRef]
- Komatsu, Y.; Suzuki, K.; Fujii, T. Sedimentary facies and paleoenvironments of a gas-hydrate-bearing sediment core in the eastern Nankai Trough, Japan. Mar. Pet. Geol. 2015, 66, 358–367. [Google Scholar] [CrossRef]
- Wang, X.H.; Sun, Y.F.; Wang, Y.F.; Li, N.; Sun, C.Y.; Chen, G.J.; Liu, B.; Yang, L.Y. Gas production from hydrates by CH4-CO2/H2 replacement. Appl. Energy 2017, 188, 305–314. [Google Scholar] [CrossRef]
- Sun, J.; Ning, F.; Lei, H.; Gai, X.; Sánchez, M.; Lu, J.; Li, Y.; Liu, L.; Liu, C.; Wu, N.; et al. Wellbore stability analysis during drilling through marine gas hydrate-bearing sediments in Shenhu area: A case study. J. Pet. Sci. Eng. 2018, 170, 345–367. [Google Scholar] [CrossRef]
- Rutqvist, J.; Moridis, G.J.; Grover, T.; Silpngarmlert, S.; Collett, T.S.; Holdich, S.A. Coupled multiphase fluid flow and wellbore stability analysis associated with gas production from oceanic hydrate-bearing sediments. J. Pet. Sci. Eng. 2012, 92, 65–81. [Google Scholar] [CrossRef]
- Yamini, O.A.; Movahedi, A.; Mousavi, S.H.; Kavianpour, M.R.; Kyriakopoulos, G.L. Hydraulic performance of seawater intake system using CFD modeling. J. Mar. Sci. Eng. 2022, 10, 988. [Google Scholar] [CrossRef]
- Lei, L.; Santamarina, J.C. Laboratory strategies for hydrate formation in fine-grained sediments. J. Geophys. Res. Solid Earth 2018, 123, 2583–2596. [Google Scholar] [CrossRef]
- Hyodo, M.; Li, Y.; Yoneda, J.; Nakata, Y.; Yoshimoto, N.; Nishimura, A. Effects of dissociation on the shear strength and deformation behavior of methane hydrate-bearing sediments. Mar. Pet. Geol. 2014, 51, 52–62. [Google Scholar] [CrossRef]
- Freij-Ayoub, R.; Tan, C.; Clennell, B.; Tohidi, B.; Yang, J. A wellbore stability model for hydrate bearing sediments. J. Pet. Sci. Eng. 2007, 57, 209–220. [Google Scholar] [CrossRef]
- Jin, G.; Lei, H.; Xu, T.; Xin, X.; Yuan, Y.; Xia, Y.; Juo, J. Simulated geomechanical responses to marine methane hydrate recovery using horizontal wells in the Shenhu area, South China Sea. Mar. Pet. Geol. 2017, 92, 424–436. [Google Scholar] [CrossRef]
- Sun, J. Characteristics of Reservoir Response to Drilling and Production in Gas Hydrate-Bearing Sediments in the South China Sea; China University of Geosciences: Beijing, China, 2018. [Google Scholar]
- Li, X.; Sun, B.; Ma, B.; Li, H.; Liu, H.; Cai, D.; Wang, X.; Li, X. Study on the Evolution Law of Wellbore Stability Interface during Drilling of Offshore Gas Hydrate Reservoirs. Energies 2023, 16, 7585. [Google Scholar] [CrossRef]
- Wang, X.; Wang, Z.; Gong, Z.; Fu, W.; Liu, P.; Zhang, J. Study on Stability of Horizontal Wellbore Drilled in Marine Natural Gas Hydrate Reservoir. In International Technical Symposium on Deepwater Oil and Gas Engineering; Springer Nature: Singapore, 2023; pp. 523–535. [Google Scholar]
- Wang, S.; Sun, Z. Current Status and Future Trends of Exploration and Pilot Production of Gas Hydrate in the World. Mar. Geol. Front. 2018, 34, 24–32. [Google Scholar]
- Fung, L.S.K. A Coupled Geomechanic-Multiphase Flow Model For Analysis Of In Situ Recovery In Cohesionless Oil Sands. J. Can. Pet. Technol. 1992, 31, 56–67. [Google Scholar] [CrossRef]
- Selim, M.S.; Sloan, E.D. Heat and mass transfer during the dissociation of hydrates in porous media. AIChE J. 1989, 35, 1049–1052. [Google Scholar] [CrossRef]
- Nazridoust, K.; Ahmadi, G. Computational modeling of methane hydrate dissociation in a sandstone core. Chem. Eng. Sci. 2007, 62, 6155–6177. [Google Scholar] [CrossRef]
- Cheng, Y.F.; Li, L.D.; Mahmood, S.; Cui, Q. Fluid-solid coupling model for studying wellbore instability in drilling of gas hydrate bearing sediments. Appl. Math. Mech. (Engl. Ed.) 2013, 34, 1421–1432. [Google Scholar] [CrossRef]
- Wang, H.N.; Chen, X.P.; Jiang, M.J.; Guo, Z.Y. Analytical investigation of wellbore stability during drilling in marine methane hydrate-bearing sediments. J. Nat. Gas Sci. Eng. 2019, 68, 102885. [Google Scholar] [CrossRef]
- Kim, H.C.; Bishnoi, P.R.; Heidemann, R.A.; Rizvi, S.S. Kinetics of methane hydrate decomposition. Chem. Eng. Sci. 1985, 42, 1645–1653. [Google Scholar] [CrossRef]
- Fjaer, E.; Holt, R.M.; Horsrud, P.; Raaen, A.M.; Risnes, R. Petroleum Related Rock Mechanics; Elsevier: Amsterdam, The Netherlands, 2008. [Google Scholar]


| Parameter | Unit | Value | Parameter | Unit | Value |
|---|---|---|---|---|---|
| Depth | m | 1420–1464 | Horizontal section length | m | 400 |
| Absolute porosity | - | 0.4 | Poisson’s ratio | - | 0.35 |
| Initial hydrate saturation | - | 0.33 | Absolute permeability | m2 | 4.935 × 10⁻¹⁴ |
| Sea level temperature | °C | 25 | Pore pressure | MPa | 14.508 |
| Internal friction angle | ° | 12 | Initial temperature of reservoir | °C | 13.373 |
| Vertical depth | m | 1435.1 | Minimum horizontal principal stress | MPa | 15.47 |
| Sea water depth | m | 1235 | Ultimate horizontal principal stress | MPa | 15.47 |
| Elastic modulus | MPa | Sh = 0:32 | Vertical stress | MPa | 16.36 |
| Cohesion | MPa | Sh = 0:0.1 | Temperature of injected drilling fluid | °C | 25 |
| Depth of Seabed/m | Formation Pressure/MPa | Formation Temperature/°C | Hydrate Saturation |
|---|---|---|---|
| 200.1 | 14.508 | 13.357 | 0.33 |
| 217.5 | 14.689 | 14.178 | 0.27 |
| Drilling fluid pressure/MPa | Drilling fluid temperature/°C | Horizontal stress/MPa | Vertical stress/MPa |
| 14.771 | 14.35 | 15.47 | 16.36 |
| 14.975 | 15.2 | 15.74 | 16.70 |
| Serial No. | Depth of Seabed/m | Measured Well Caliper Enlargement/mm | Simulated Well Caliper Enlargement/mm | Error/% |
|---|---|---|---|---|
| 1 | 200.1 | 18.181 | 19.96 | 9.78 |
| 2 | 217.5 | 22.473 | 23.82 | 5.99 |
| Pressure of Injected Drilling Fluid/MPa. | Temperature of Injected Drilling Fluid/°C | Absolute Porosity | Absolute Permeability/m2 | Initial Hydrate Saturation |
|---|---|---|---|---|
| 14.6 | 15 | 0.3 | 2.961 × 10⁻¹⁴ | 0.33 |
| 14.882 | 16.32 | 0.4 | 4.935 × 10⁻¹⁴ | 0.4 |
| 15 | 17 | 0.5 | 6.909 × 10⁻¹⁴ | 0.5 |
| 15.2 | 18 | 0.6 | 8.883 × 10⁻¹⁴ | 0.6 |
Disclaimer/Publisher’s Note: The statements, opinions and data contained in all publications are solely those of the individual author(s) and contributor(s) and not of MDPI and/or the editor(s). MDPI and/or the editor(s) disclaim responsibility for any injury to people or property resulting from any ideas, methods, instructions or products referred to in the content. |
© 2024 by the authors. Licensee MDPI, Basel, Switzerland. This article is an open access article distributed under the terms and conditions of the Creative Commons Attribution (CC BY) license (https://creativecommons.org/licenses/by/4.0/).
Share and Cite
Shan, Z.; Wang, X.; Li, Z.; Gong, Z.; Ma, N.; Zhang, J.; Wang, Z.; Sun, B. Research on Key Parameters of Wellbore Stability for Horizontal Drilling in Offshore Hydrate Reservoirs. Appl. Sci. 2024, 14, 10922. https://doi.org/10.3390/app142310922
Shan Z, Wang X, Li Z, Gong Z, Ma N, Zhang J, Wang Z, Sun B. Research on Key Parameters of Wellbore Stability for Horizontal Drilling in Offshore Hydrate Reservoirs. Applied Sciences. 2024; 14(23):10922. https://doi.org/10.3390/app142310922
Chicago/Turabian StyleShan, Zhengfeng, Xiansi Wang, Zeqin Li, Zhenggang Gong, Nan Ma, Jianbo Zhang, Zhiyuan Wang, and Baojiang Sun. 2024. "Research on Key Parameters of Wellbore Stability for Horizontal Drilling in Offshore Hydrate Reservoirs" Applied Sciences 14, no. 23: 10922. https://doi.org/10.3390/app142310922
APA StyleShan, Z., Wang, X., Li, Z., Gong, Z., Ma, N., Zhang, J., Wang, Z., & Sun, B. (2024). Research on Key Parameters of Wellbore Stability for Horizontal Drilling in Offshore Hydrate Reservoirs. Applied Sciences, 14(23), 10922. https://doi.org/10.3390/app142310922