Abstract
In recent years, the number of safety accidents in new-energy electric vehicles due to lithium-ion battery failures has been increasing, and the lithium-ion battery fault diagnosis technology is particularly important to ensure the safe operation of electric vehicles. This paper proposes a method for lithium-ion battery fault diagnosis based on the historical trajectory of lithium-ion battery remaining discharge capacity in medium and long time scales. The method first utilizes the sparrow search algorithm (SSA) to identify the parameters of the second-order equivalent circuit model of the lithium-ion battery, and then estimates the state of charge (SOC) of the lithium-ion battery using the extended Kalman filter (EKF). The remaining discharge capacity is estimated according to the SOC, and finally the feature vectors are used to diagnose the faults using box plots on the medium and long time scales. Experimental results verify that the root mean squared error (RSME) and mean absolute error (MAE) of the proposed SOC estimation method are 0.0049 and 0.0034, respectively. This method can accurately identify the faulty single cell in a battery pack with low-capacity single cells and promptly detect any abnormalities in the single cell when a micro-short circuit fault occurs.
1. Introduction
In the development of new-energy electric vehicles, lithium-ion batteries, as the main power source, have attracted much attention for their safety and reliability [1,2,3]. The rapid popularization of new-energy electric vehicles in response to frequently occurring lithium-ion battery failure caused by safety accidents creates widespread concern about the safety of electric vehicles. In this context, lithium-ion battery fault diagnosis technology has become an important part of ensuring the safe operation of electric vehicles, and the development of fault diagnosis technology is crucial to ensure the safe operation of electric vehicles [4,5]. There are many kinds of fault diagnosis, and common faults include over-charge, over-discharge, over-temperature, thermal, etc. Among them, an internal short circuit is one of the main causes of lithium battery failure. An internal short circuit may lead to serious consequences such as overheating and explosion of the battery, so timely and accurate detection is crucial.
In the intricate world of battery technology, lithium-ion batteries have garnered considerable attention due to their high energy density and extended lifespan. However, these batteries are also susceptible to internal short-circuit faults, which pose a serious safety issue impacting battery performance, safety, and service life. The evolution of internal short-circuit faults can be divided into the initial stage, mid-stage, and final stage. During the initial stage of lithium-ion batteries, since their internal structure has not undergone significant damage, there are virtually no noticeable electrical or thermal anomalies even when a short circuit occurs. At this point, the battery’s status may appear normal, and without meticulous inspection and analysis, it is difficult to detect underlying issues. As time progresses, if the battery begins to exhibit electrical characteristics or temperature elevations that deviate from its usual behavior, this typically signifies that the internal short circuit has entered the mid-stage. Entering the mid-to-late stages, internal short-circuit faults lead to excessive heat generation within the battery, with these temperatures rising sharply over a short period, placing the battery in extreme danger. At this stage, traditional preventive measures such as cooling systems may fail to provide sufficient support to control battery thermal runaway, as the rapid accumulation of internal heat has pushed the battery to the brink of runaway. At this point, more timely and effective measures, such as immediately disconnecting the power supply, are required to prevent further damage. Therefore, early diagnosis and warning mechanisms are particularly crucial for any form of internal short-circuit faults in lithium-ion batteries. By precisely monitoring and analyzing the battery’s behavior patterns, signs of internal short circuits can be identified early, allowing for corresponding protective measures to be taken to reduce battery damage and fire risks. This not only enhances battery safety but also ensures reliability and longevity in practical applications. In summary, for lithium-ion batteries, early diagnosis of internal short-circuit faults is pivotal in maintaining their health and extending their lifecycle [6,7].
In the field of lithium-ion battery fault diagnosis, in order to cope with the challenges, many scholars have devoted themselves to seeking more accurate and reliable methods for battery fault diagnosis. Among them, E. Mouncef et al. [8] explored the comparison between the optimization-seeking algorithm and the adaptive least-squares method with a forgetting factor (forgetting factor recursive least square, FFRLS), highlighting the advantages of the optimization-seeking algorithm in model parameter identification. In addition, G. Wu et al. [9] emphasized the superiority of the second-order model over the first-order model, especially in describing the dynamic characteristics of lithium-ion batteries. Wang, Z. et al. [10] used the second-order circuit equivalent model to detect the internal short circuits in short-circuit fault detection and quantitative analysis based on the variational modal decomposition mean value difference model, which proved the practicality and reliability of the second-order equivalent circuit model. In regard to the advantages of the optimization-seeking algorithm in model parameter identification, Xu, D. et al. [11] further compared the sparrow search algorithm with the genetic algorithm and the particle swarm algorithm, and verified the efficiency and accuracy of the sparrow search algorithm. Therefore, this paper adopts the SSA algorithm to accurately identify the parameters of the second-order equivalent circuit model of the lithium-ion battery. The SSA algorithm, with its powerful nonlinear solving ability, can provide accurate parameter values for the complex circuit model to ensure the accuracy of the model, so that a model that accurately describes the operating state of the lithium-ion battery can be obtained, laying a solid foundation for the subsequent fault diagnosis. In the joint estimation of the SOC and state of health (SOH) of lithium batteries for pure electric vehicles based on the EKF algorithm by Li Yu et al. [12], the EKF algorithm is able to accurately estimate the SOC of lithium batteries with a small error, which proves the reliability of the EKF algorithm. X. Zhao et al. [13] demonstrated in micro-short circuit fault diagnostic tests that the smaller the short circuit resistance, the greater the deviation of the voltage profile between the short circuit and standard conditions. Qin Huan et al. [14], in the study of diagnosing micro-short circuits according to the change of relative charging time of monomer, take the monomer which reaches the cut-off voltage first as the benchmark to calculate the difference of other monomers in the relative charging time, and then use a box plot to visualize and statistically analyze the relative charging time of each monomer and accurately identify the micro-short-circuited batteries by the detected outliers, which proves the reliability and accuracy of the box plot in the diagnostic method. Therefore, this paper applies the box plot principle to anomaly identification. It serves as a powerful auxiliary tool to visualize the data distribution in graphical form, which helps us to identify the anomalies and thus the abnormal cells in the battery pack.
Based on the above research results, the aim of this paper is to propose a novel fault diagnosis method that analyzes lithium-ion batteries based on the historical trajectory of their remaining discharge capacity at long time scales to identify potential faults. The method first utilizes SSA to identify the parameters of the second-order equivalent circuit model of the lithium-ion battery. Then, the EKF is employed to estimate the SOC of the Li-ion battery, which in turn calculates the remaining discharge capacity of the battery. Finally, the feature vectors are fault diagnosed on a long time scale using box plots to identify outliers and locate the battery that has failed.
The various parts of this paper are organized as follows: Section 2 discusses the second-order model of lithium-ion batteries and describes how the SSA algorithm is used in the model to identify the model parameters. Section 3 provides an in-depth discussion on how the state of charge (SOC) of the battery is estimated by the extended Kalman filtering algorithm. Section 4 presents the fault diagnosis methodology, which skillfully incorporates the box plot theory to identify potential faults. Section 5 is the experimental validation, where the previous sections experimentally test the proposed method to ensure its validity and reliability. Section 6 concludes the paper.
2. Model Parameter Identification
2.1. Second-Order RC Equivalent Circuit Models
Based on the comparison between the first-order and second-order equivalent circuit models used by G. Wu et al. in the application of SOC estimation for electric vehicle batteries, this paper compares the estimation results of SOC using the second-order model and the first-order model, respectively. The estimation results prove the superiority of the second-order model over the first-order model, especially in terms of describing the dynamic characteristics of lithium-ion batteries. Therefore, this paper uses the second-order equivalent circuit model.
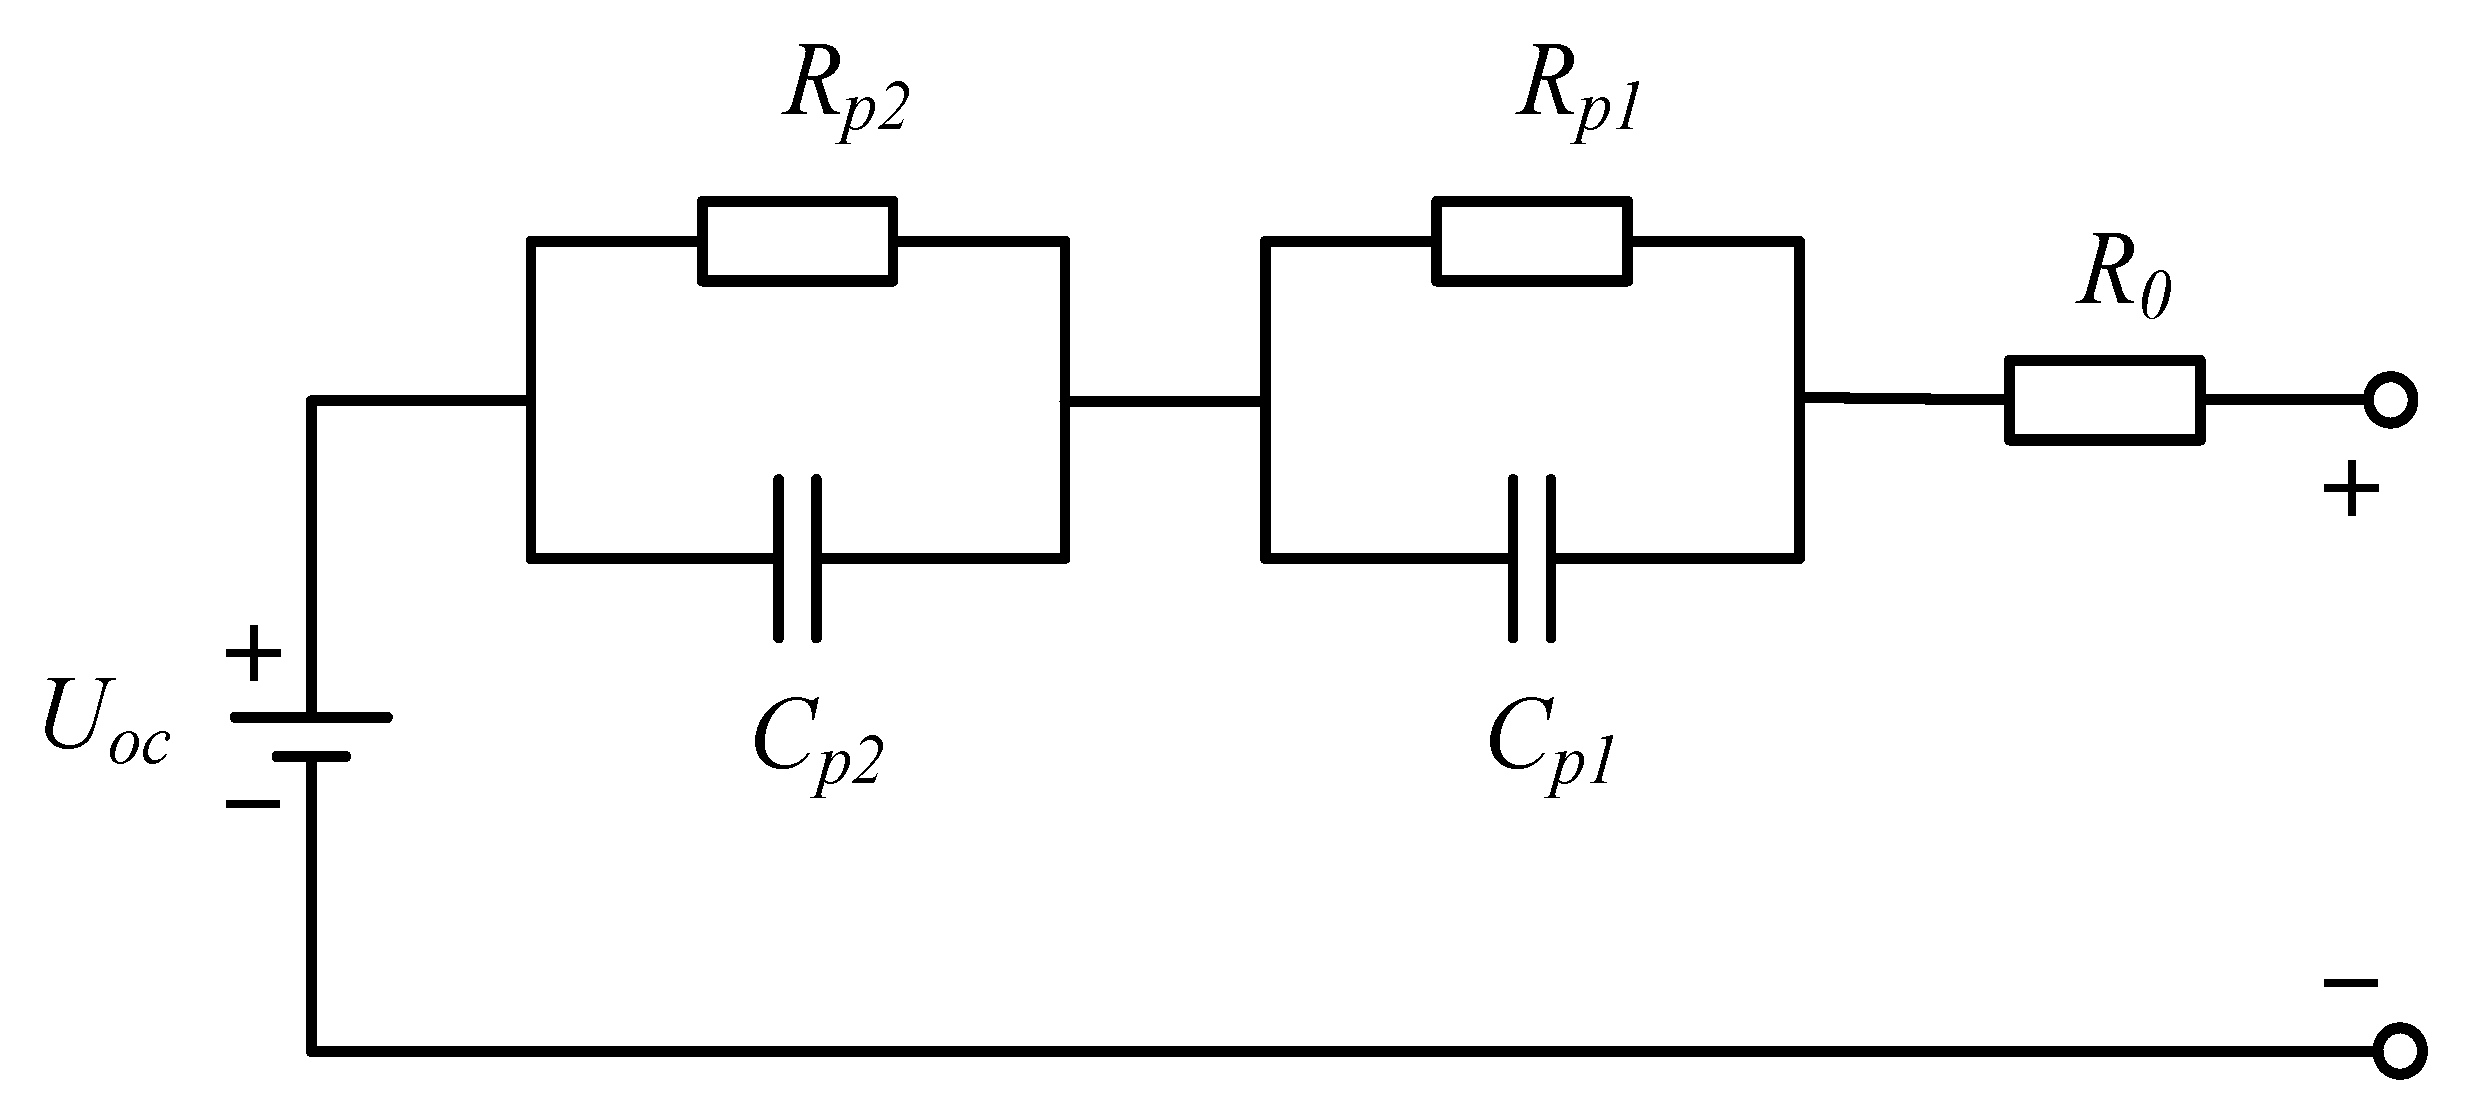
The second-order RC equivalent circuit model of lithium-ion battery is shown in Figure 1; according to Figure 1, it can be obtained by using Kirchhoff’s voltage law (KVL):
where U is the terminal voltage; UOC is the open-circuit voltage, which is polynomial about SOC; Up1 and Up2 simulate multiple electrochemical processes inside the battery; R0 is the ohmic internal resistance; and I is the current.
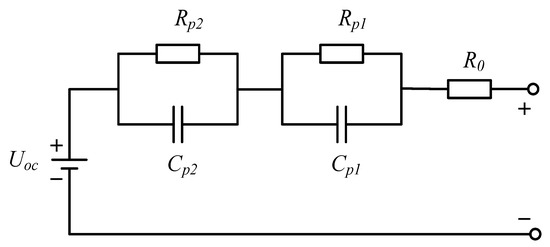
Figure 1.
Second-order RC equivalent circuit model.
represents the ohmic resistance, while and denote the polarization resistances of the battery, and Cp1 and Cp2 represent the capacitances of the battery.
Its discretization formula can be expressed as the following [9]:
where , are the values of and at the (k + 1)th moment; , are the polarization resistances generated by electrochemical polarization and concentration difference polarization; Cp1, Cp2 are the polarization capacitances; τ1, τ2 are the time constants.
The SOC is calculated by the ampere-time integration method as shown below [12]:
where SOCAH is the SOC value calculated by the ampere-time integration method, SOC0 is the initial SOC value, c0 is the rated capacity, and η is the Coulomb efficiency.
2.2. SSA Identification Model Parameters
The sparrow search algorithm is an optimization algorithm developed to simulate the foraging and anti-predator behavior of sparrows; the basic idea of the algorithm is to divide the search space into a number of particles, with each particle representing a potential solution, and then to update the position of the discoverer and the follower, and warn through iteration, which finally makes the fitness function of the particles in the population reach the optimal solution. The formula for calculating the fitness function is shown in Equation (4) [11]:
where n is the total number of sampling points; Uk denotes the kth sampling point end voltage; Uek is the kth sampling point estimated end voltage.
The steps of the SSA algorithm are as follows:
- (1)
- Randomly initialize the population.
- (2)
- Divide the population into discoverers and followers.
- (3)
- Update the position of the discoverer with the formula shown in (5) [11]:
- (4)
- Update the follower position, which is calculated as shown in (6) [11]:
- (5)
- Randomly select the early warning person and update the position with the formula shown in (7) [11]:
- (6)
- Determine whether the group fitness value is the minimum, if not reached, then return to step (2).
3. Extended Kalman Filter Estimated SOC
The SOC estimation of lithium-ion batteries by the ampere-time integration method will be affected by the initial state of SOC, and the estimation result has a systematic error, and the error accumulates with the operation process of the power system, but the Kalman filtering algorithm can solve the problem of the accumulation of the error of the ampere-time integration method [15]. The Kalman filter algorithm is applicable to linear systems, whereas lithium-ion batteries have nonlinear characteristics, so estimating the SOC using the Kalman filter produces large errors. To solve this problem, the extended Kalman filter expands the nonlinear system equations using the first-order Taylor’s formula to linearize the original system. Then, the linear system is filtered using the standard Kalman filtering algorithm. Combined with the second-order RC equivalent circuit model selected in this paper, the state-space equations are obtained as follows [12]:
The observation equation is as follows [12]:
The state variables are as follows [12]:
The coefficient matrices , , and are obtained by taking partial derivatives of the state equation and the observation equation, as follows [12]:
The recurrence formula is as follows [12]:
4. Fault Diagnosis Method
4.1. Principle of Box Diagram
Using the SOC obtained from the EKF to calculate the remaining discharge capacity, the calculation formula is shown in Equation (15):
where is the remaining discharge capacity of the ith battery cell, is the extended Kalman estimation value of the ith battery cell, and is the rated capacity.
Using the remaining discharge capacity as a fault feature, compare the inconsistency of battery cells on a medium to long time scale using a box plot. The specific formula is as follows:
where and are the upper and lower quartiles in the data, respectively, and is the internal distance; and are the lower and upper bounds of the observations, respectively, and when the data value is outside of the interval of and , then the data is judged as an outlier.
4.2. Block Diagram of Fault Diagnosis Process
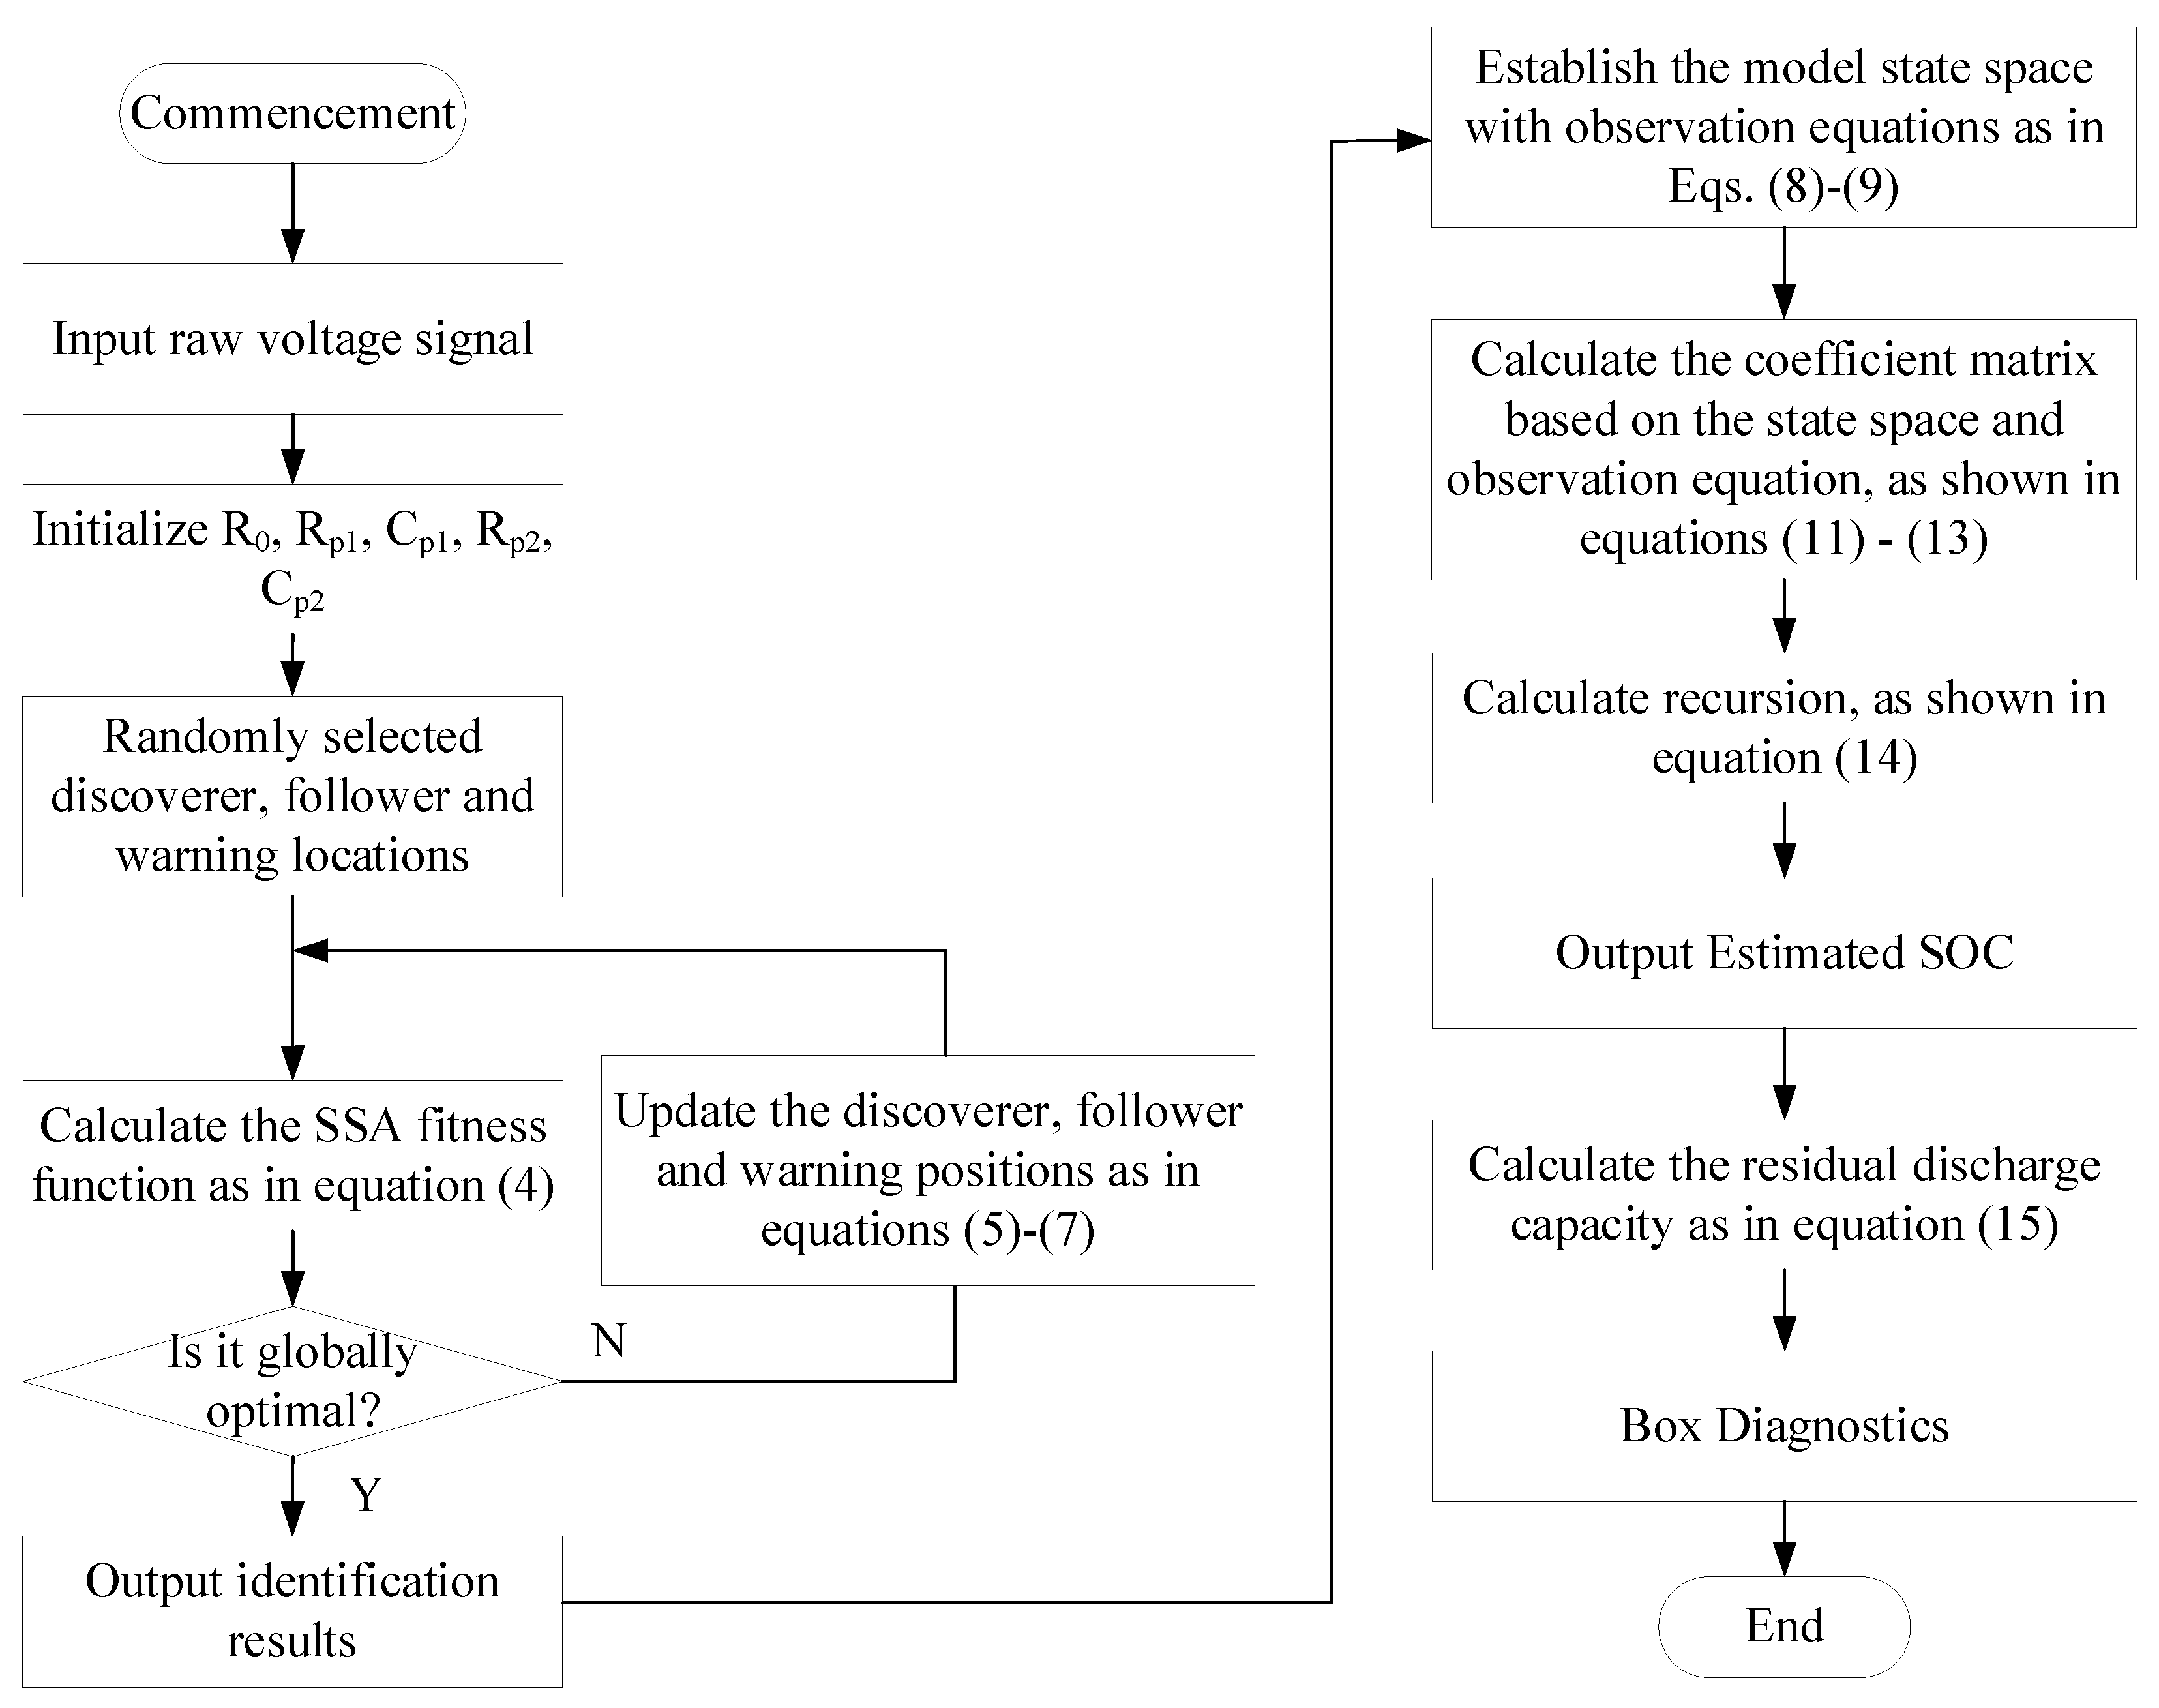
The block diagram of the fault diagnosis process is shown in Figure 2. First, the battery pack identifies the second-order equivalent circuit model parameters of the battery monomer by SSA every 5% SOC, and the data with smaller cumulative errors are screened for analysis according to the fitness function; second, the parameter identification results are fed into the EKF algorithm to estimate the SOC; and lastly, the remaining discharge capacity is computed based on the estimated SOC, and the remaining discharge capacity is calculated with the medium to long term time scales by using the box plots to compare the inconsistency of the battery cells.

Figure 2.
Block diagram of troubleshooting process.
5. Experimental Validations
5.1. Experimental Platform Construction
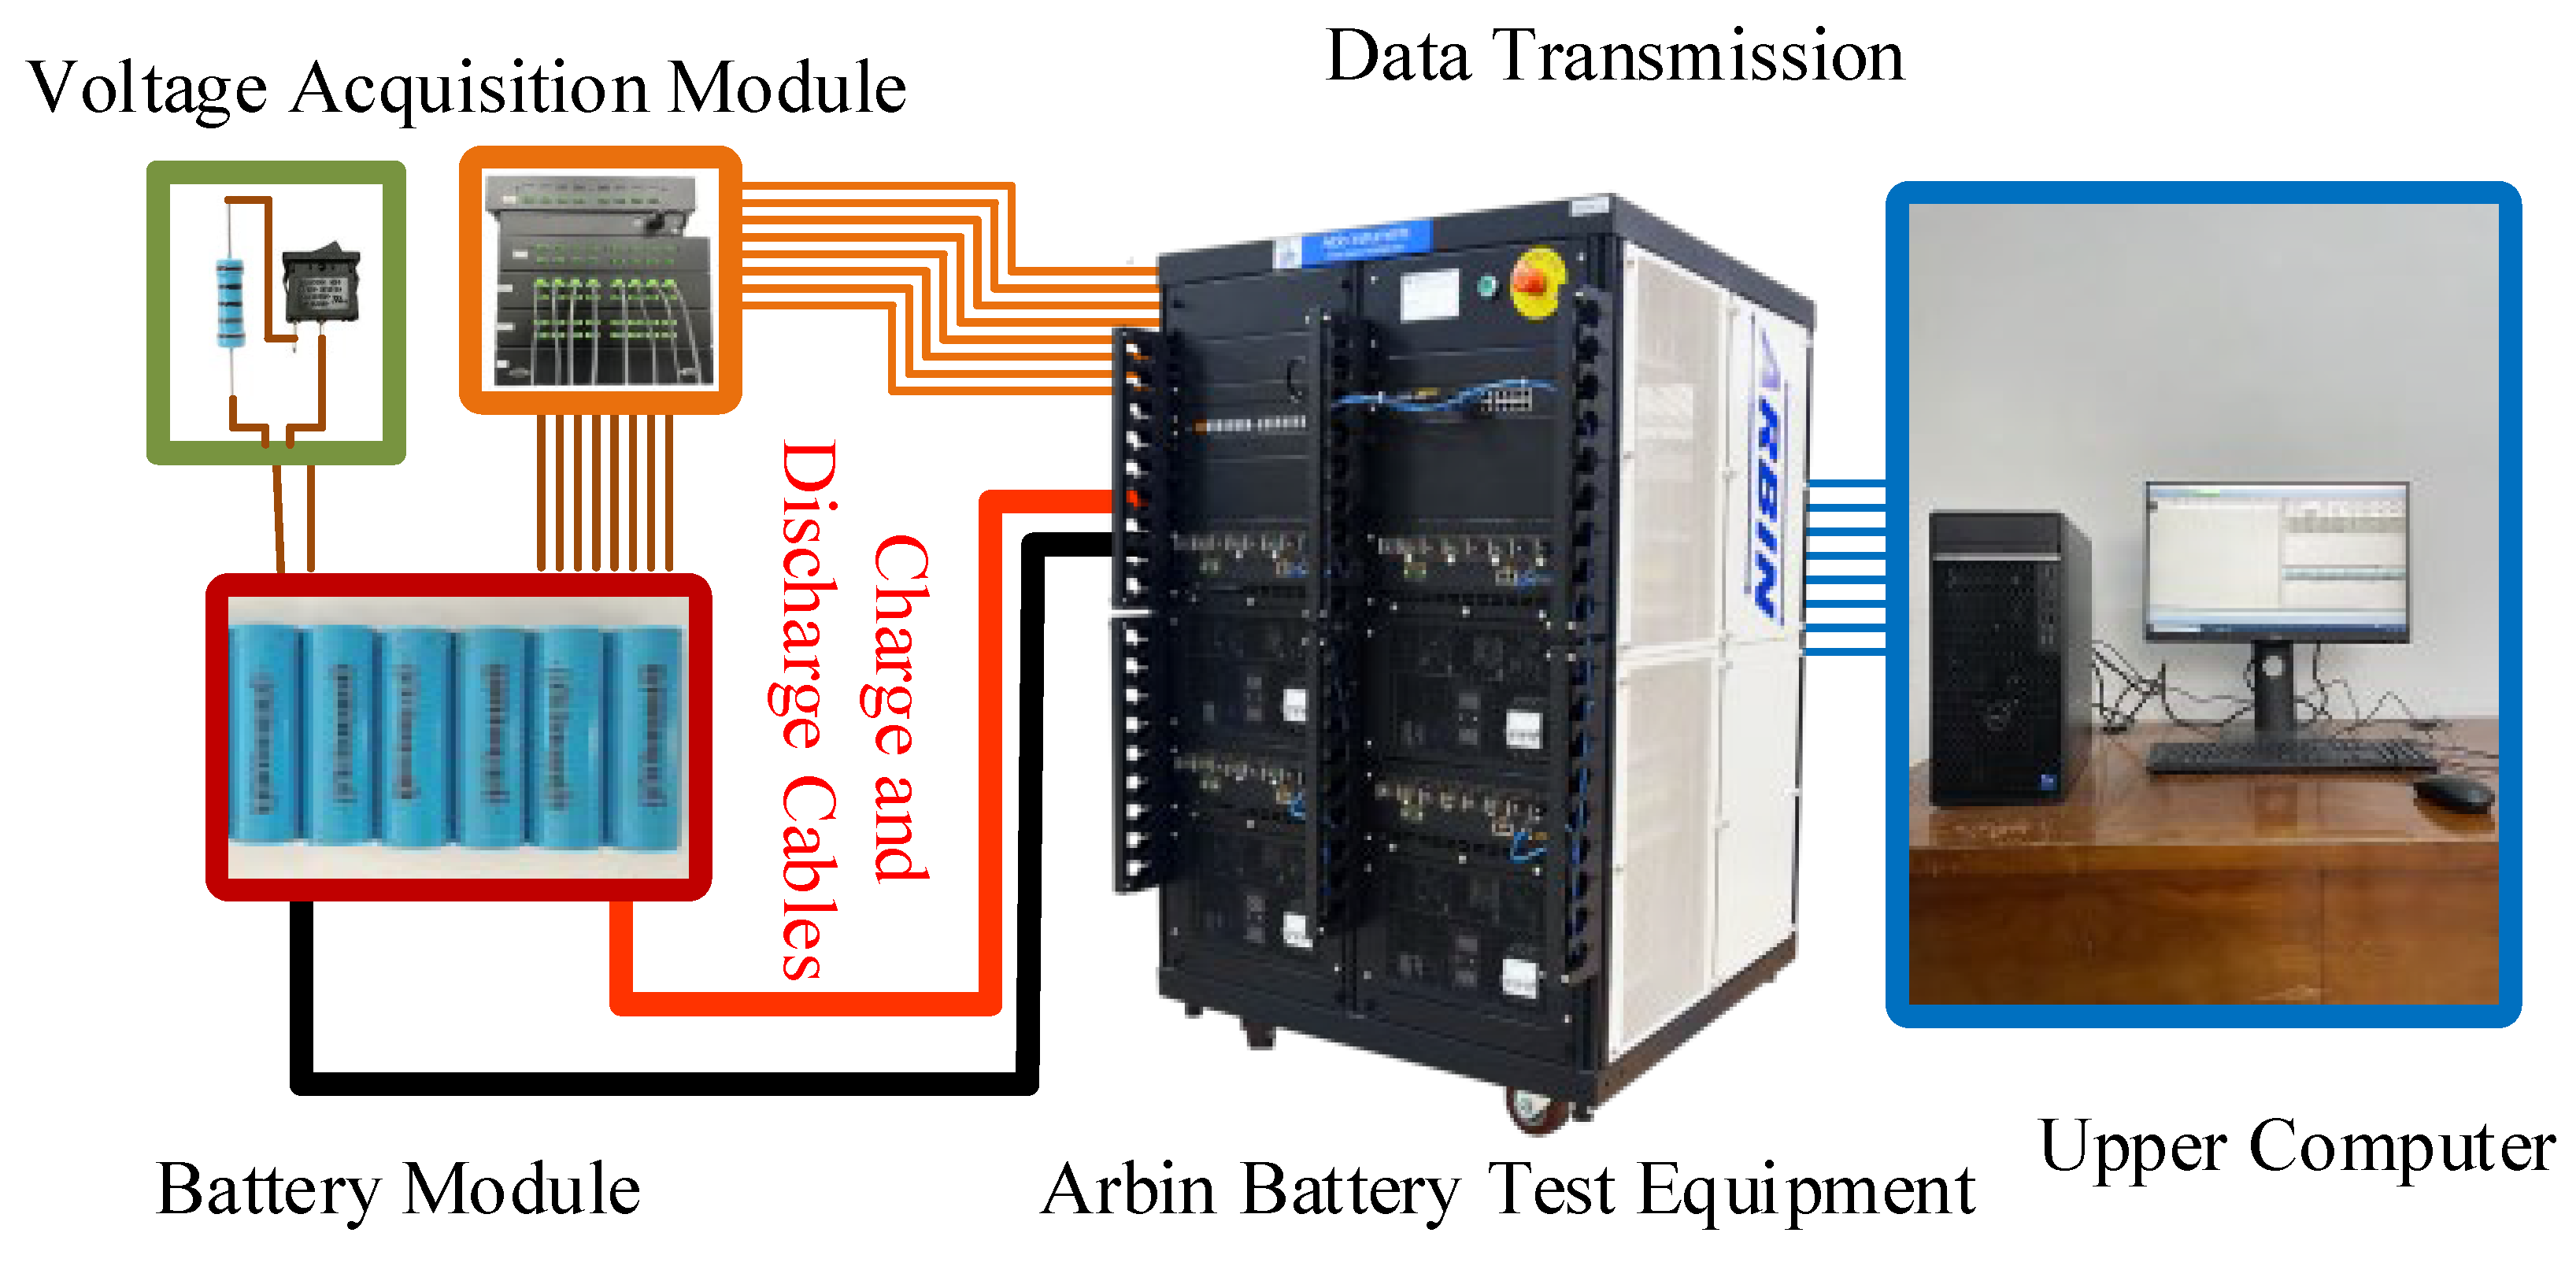
In order to verify the feasibility of the method proposed in this paper, this paper uses seven 2.55 Ah lithium-ion batteries (18,650) connected in series to conduct the U.S. federal city driving conditions cycling experiments in which cell 7 is a lower-capacity battery, and the first six experiments of the battery pack involve normal cycling, while the seventh to ninth experiments involve the static phase of cell 6, respectively, with the parallel connection of 3000 Ω, 1000 Ω, and 500 Ω resistors at both ends of the simulated internal short-circuit process. The experimental platform is shown in Figure 3 (where the manufacturer of the Arbin battery tester is Arbin Corporation, headquartered in University Town, TX, USA), and the voltage data of seven batteries in nine cycles are shown in Figure 4. The voltage curves of the seven batteries are nearly identical, indicating strong consistency among the batteries used. Additionally, this observation suggests that when a slight internal short circuit occurs in the batteries, no abnormalities can be detected solely through voltage variations. Therefore, it further emphasizes the need to identify features that can better reflect battery abnormalities. In the following text, an algorithm combined with experimental data will be introduced to verify the use of the historical trajectory of remaining discharge capacity as a feature for the fault diagnosis of lithium-ion batteries.
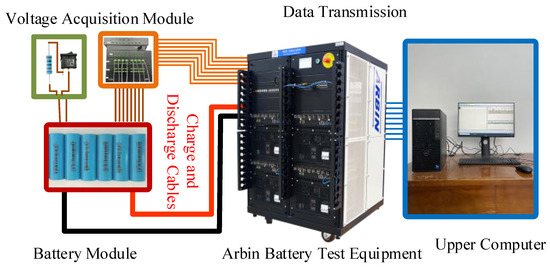
Figure 3.
Experimental platform construction.
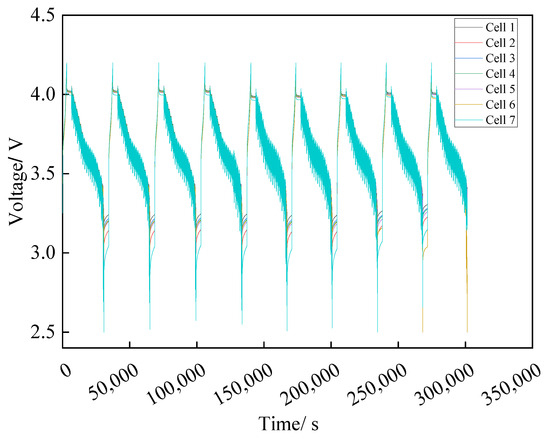
Figure 4.
Raw voltage profile.
5.2. Model Parameter Identification Results
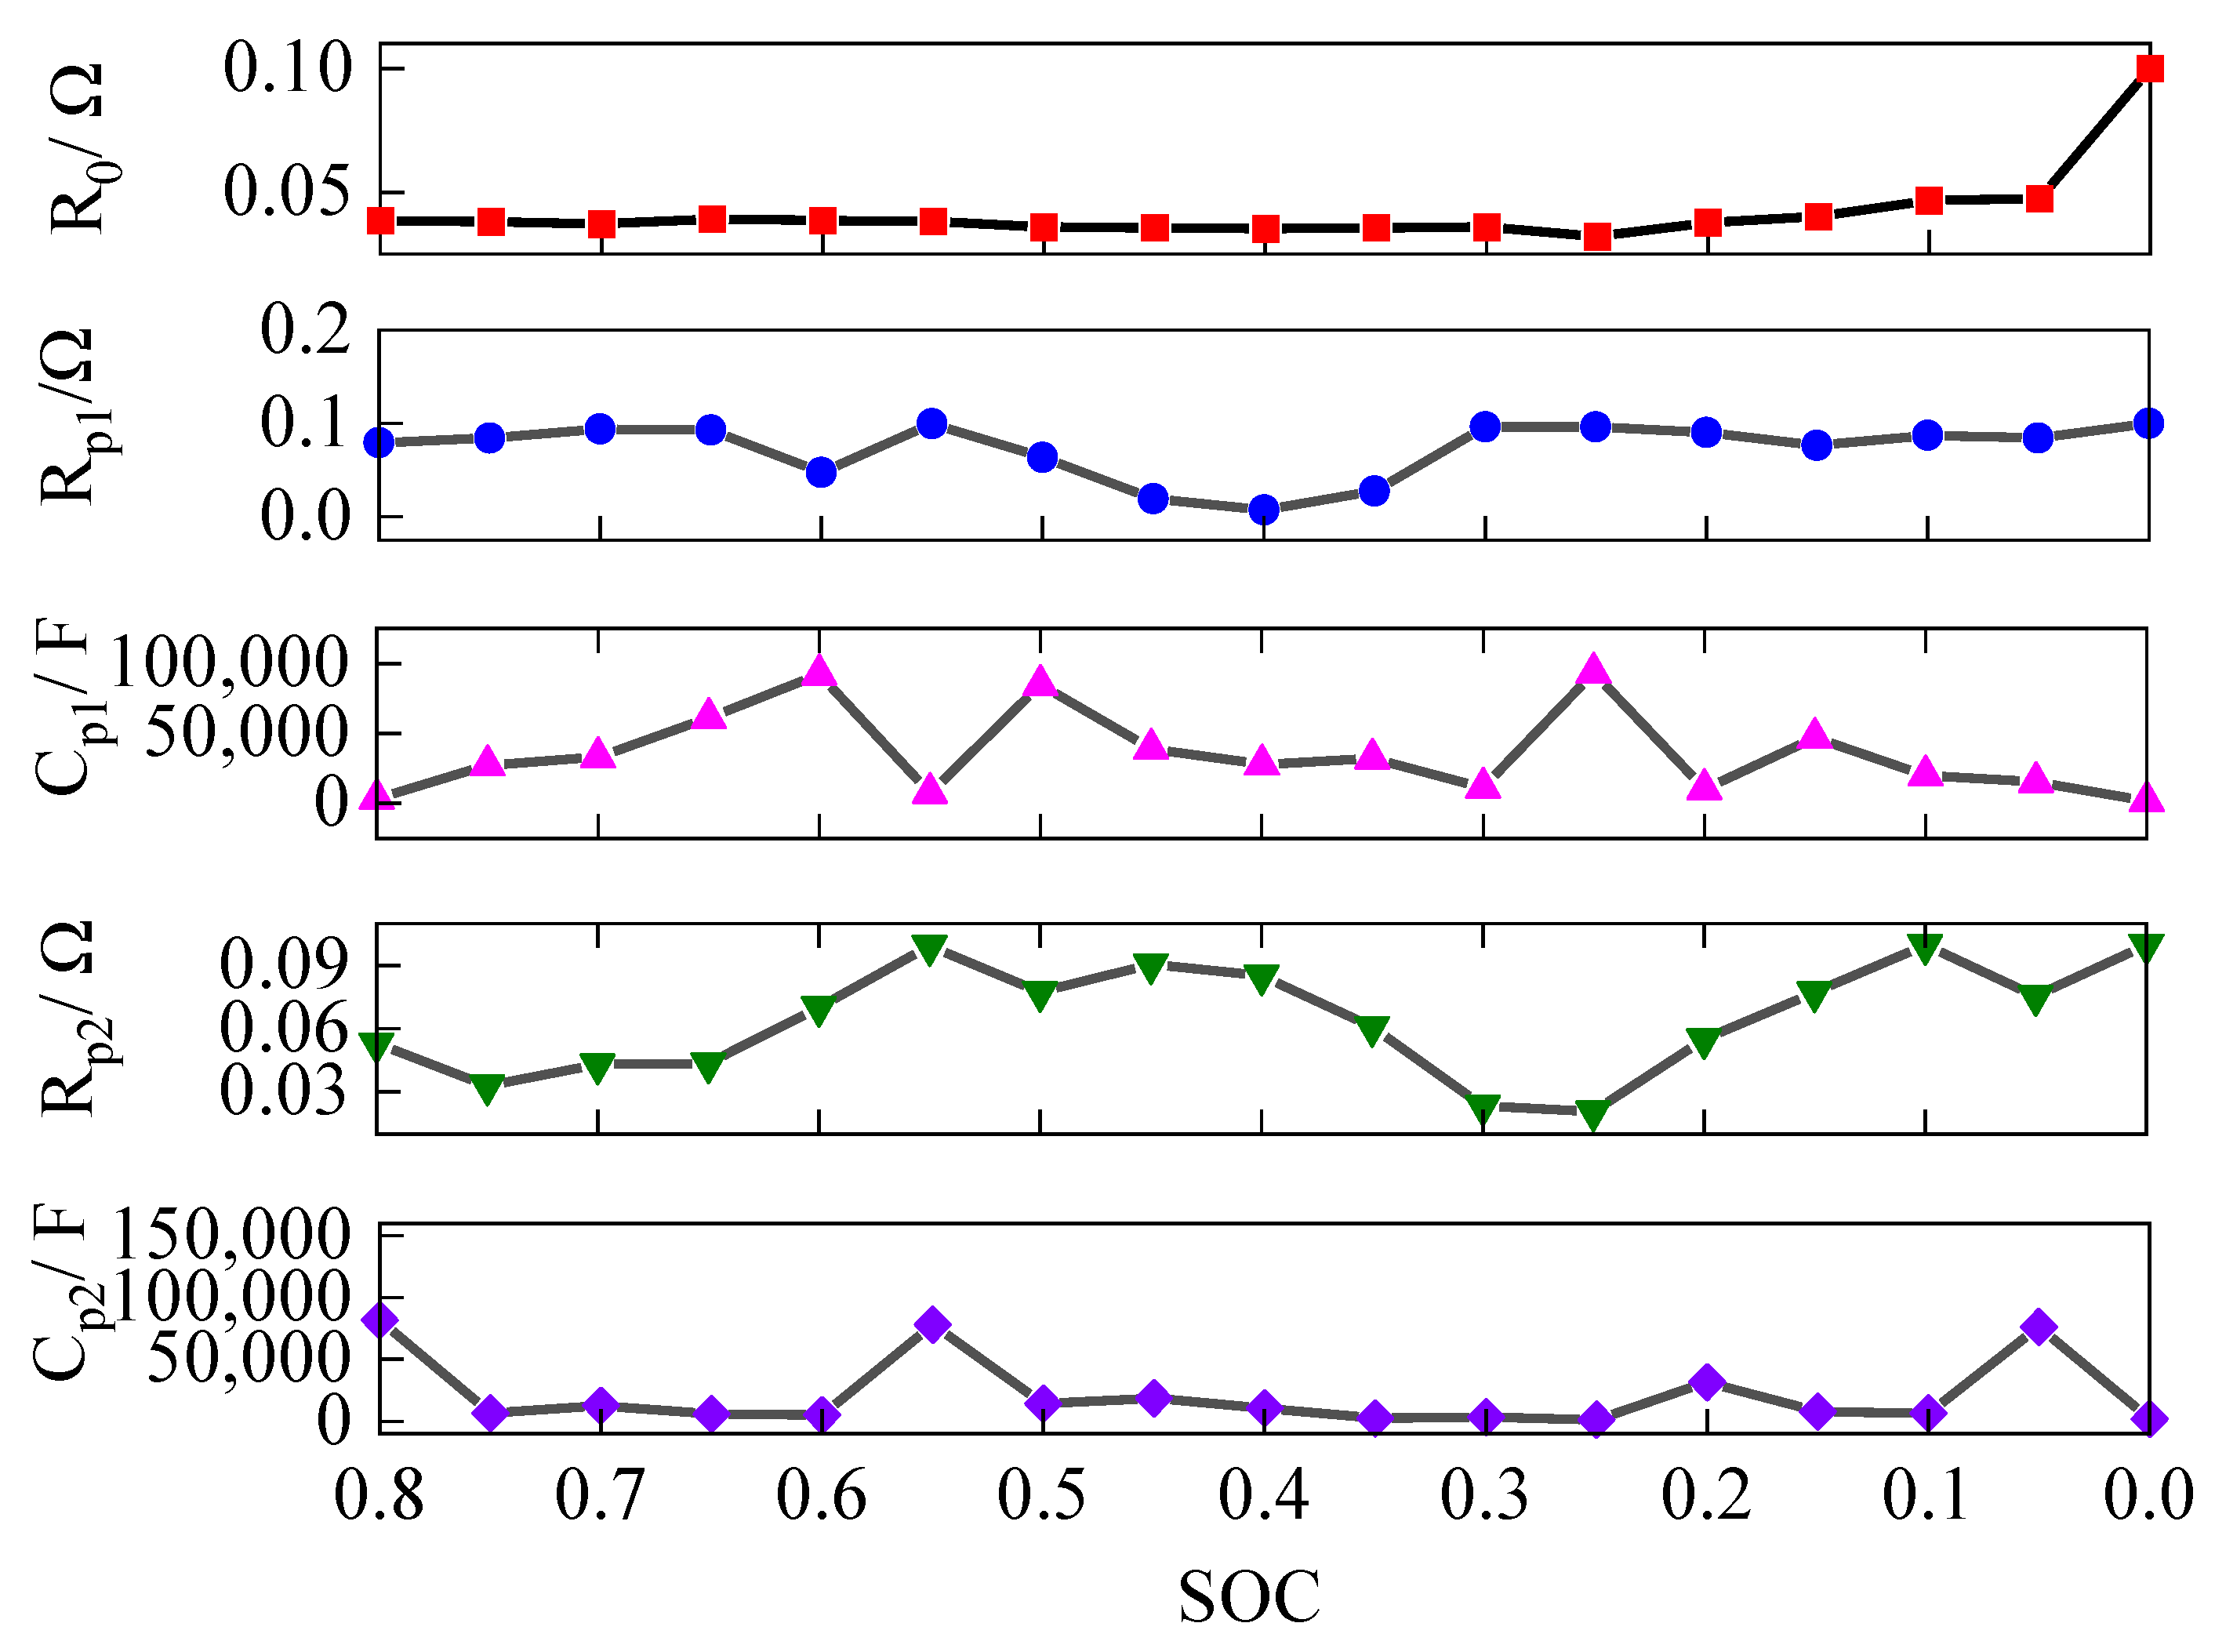
An experimental analysis was conducted using the algorithm introduced in Section 4, as shown in Figure 5. The results depict the parameter identification of the second-order equivalent circuit model for cell 1 during the first cycle using SSA. The five subfigures correspond to the variation of the parameters R0, Rp1, Cp1, Rp2, and Cp2 at every 5% SOC of the battery pack, respectively. R0 stays relatively smooth throughout the discharge process, the two parameters Rp1 and Rp2 show some fluctuations at different SOCs, and the two capacitance parameters Cp1 and Cp2 also show fluctuations during SOC variations, which indicate that the dynamic characteristics of the battery changes with the change of SOC [16].
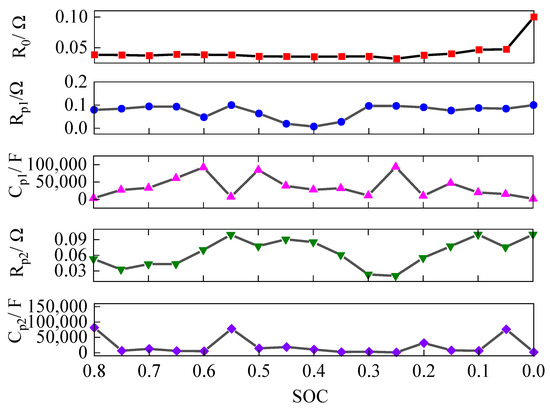
Figure 5.
Parameter identification results.
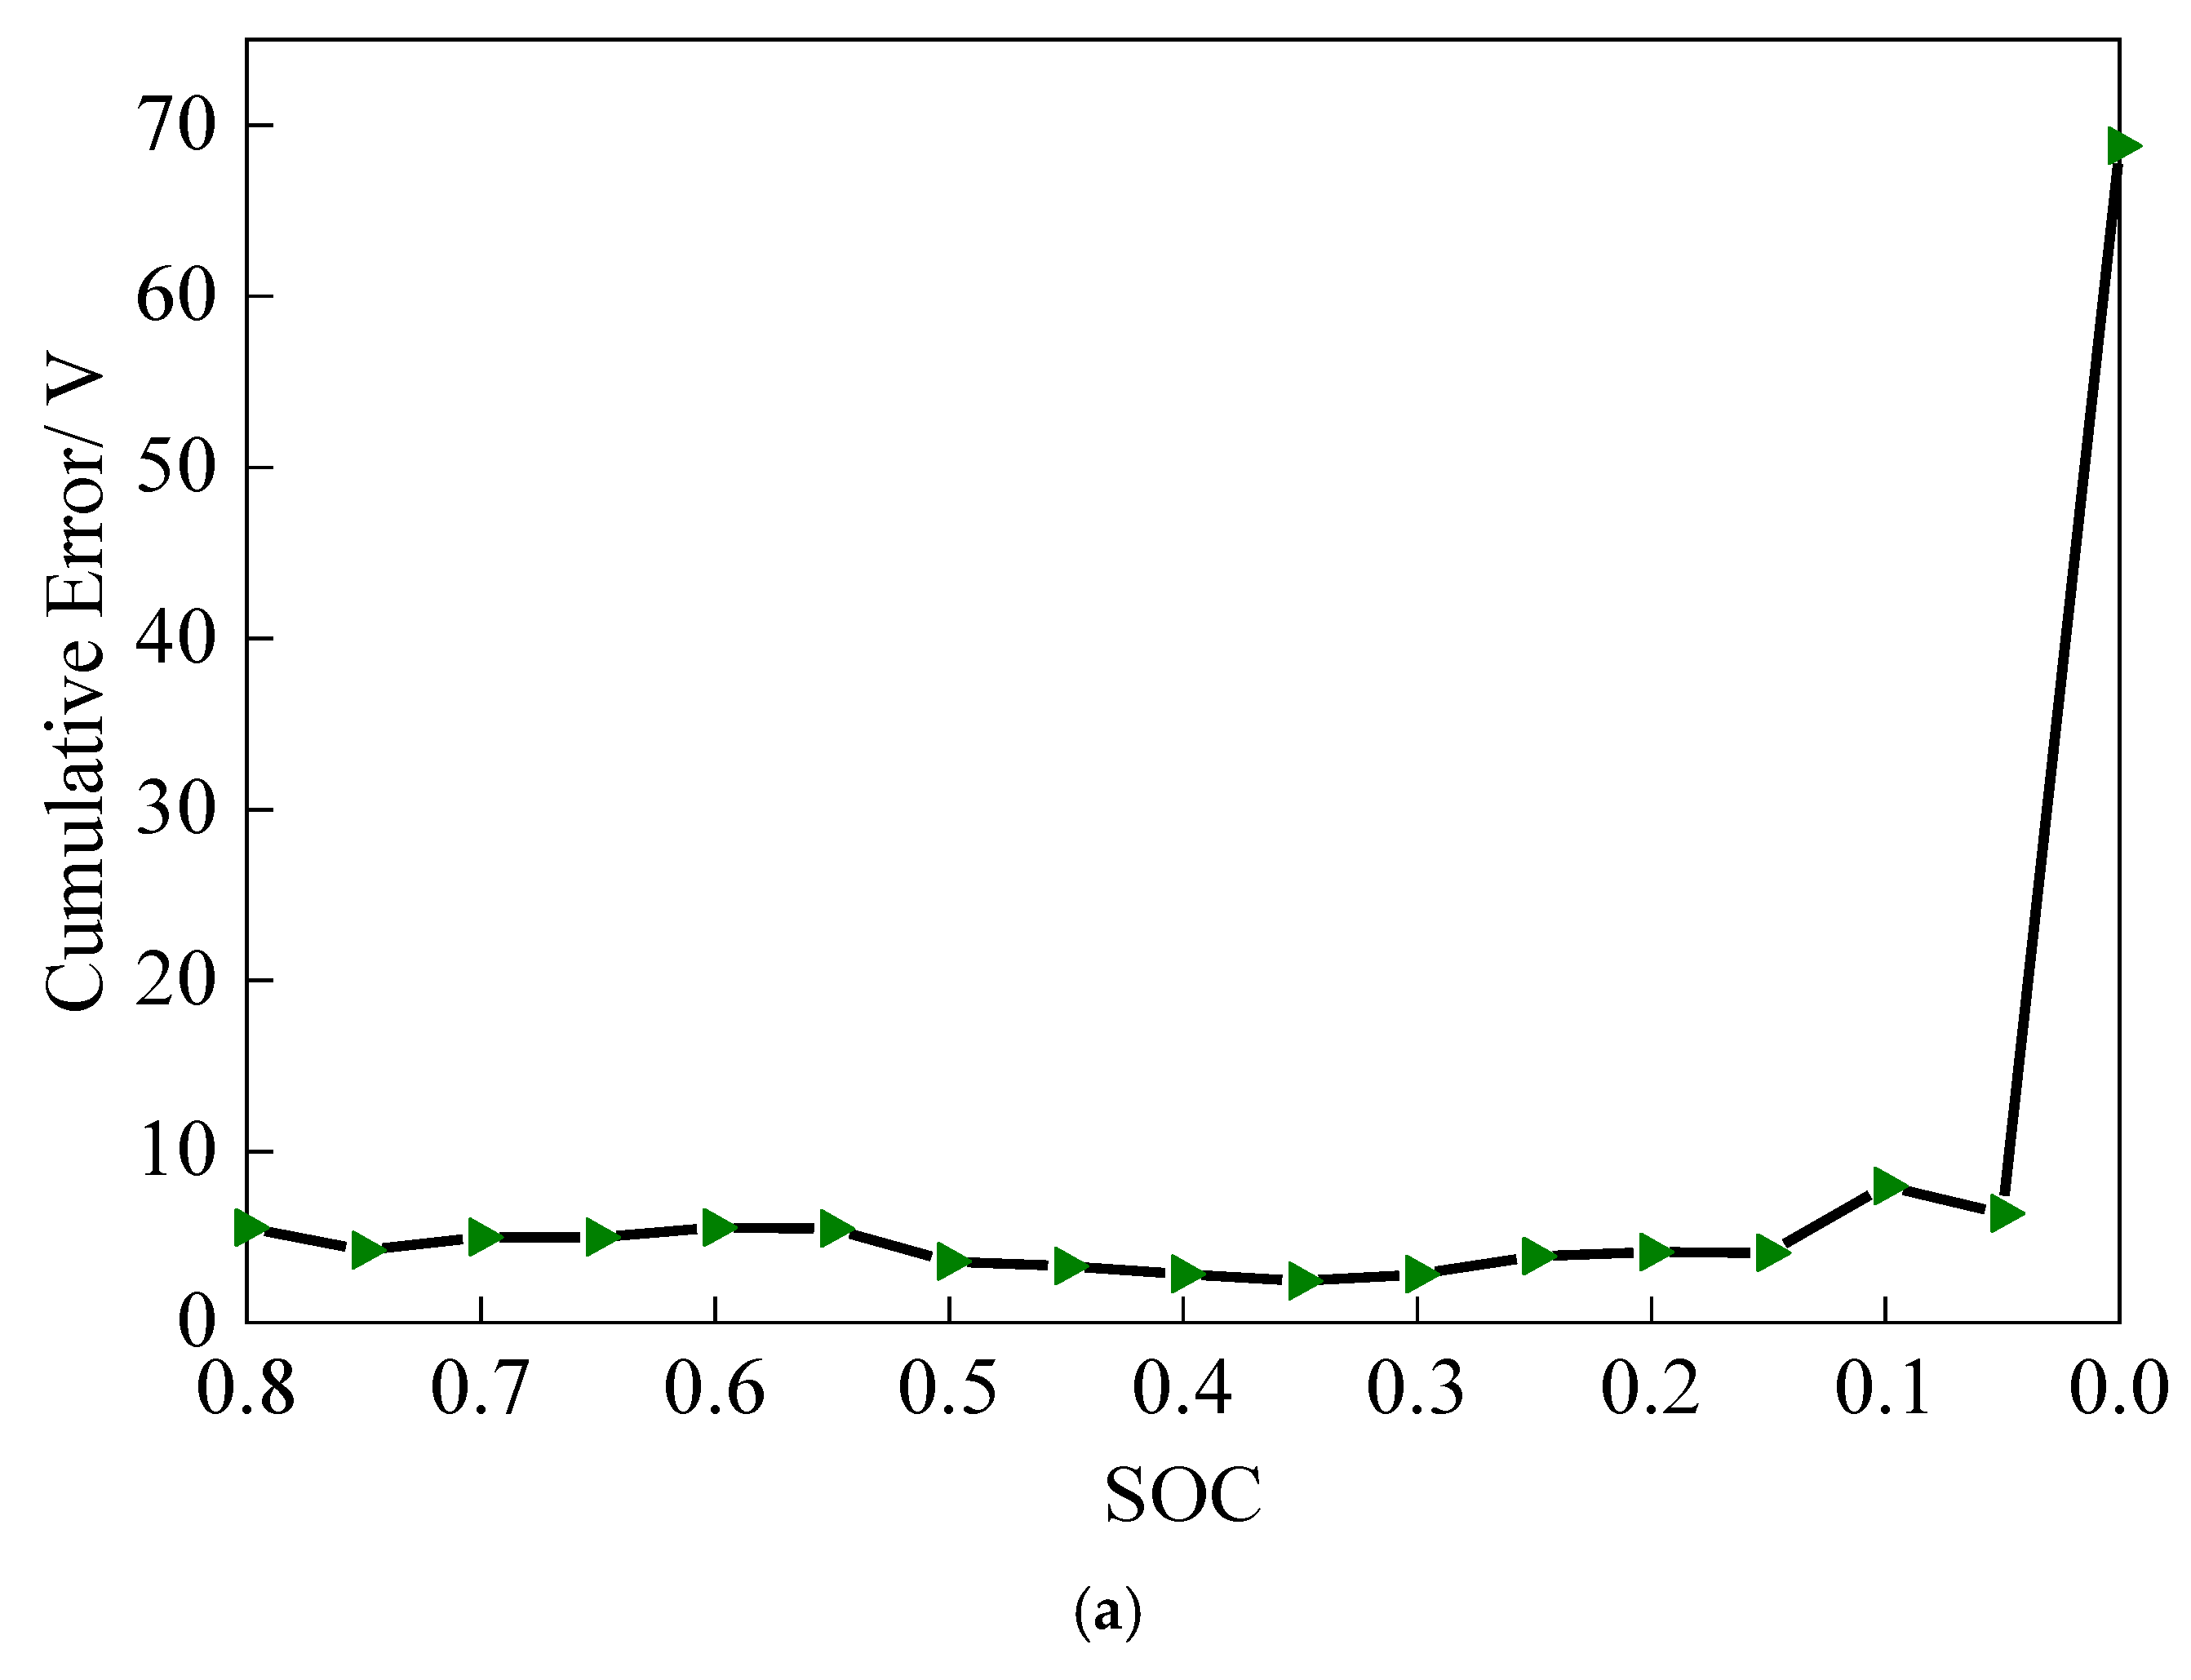
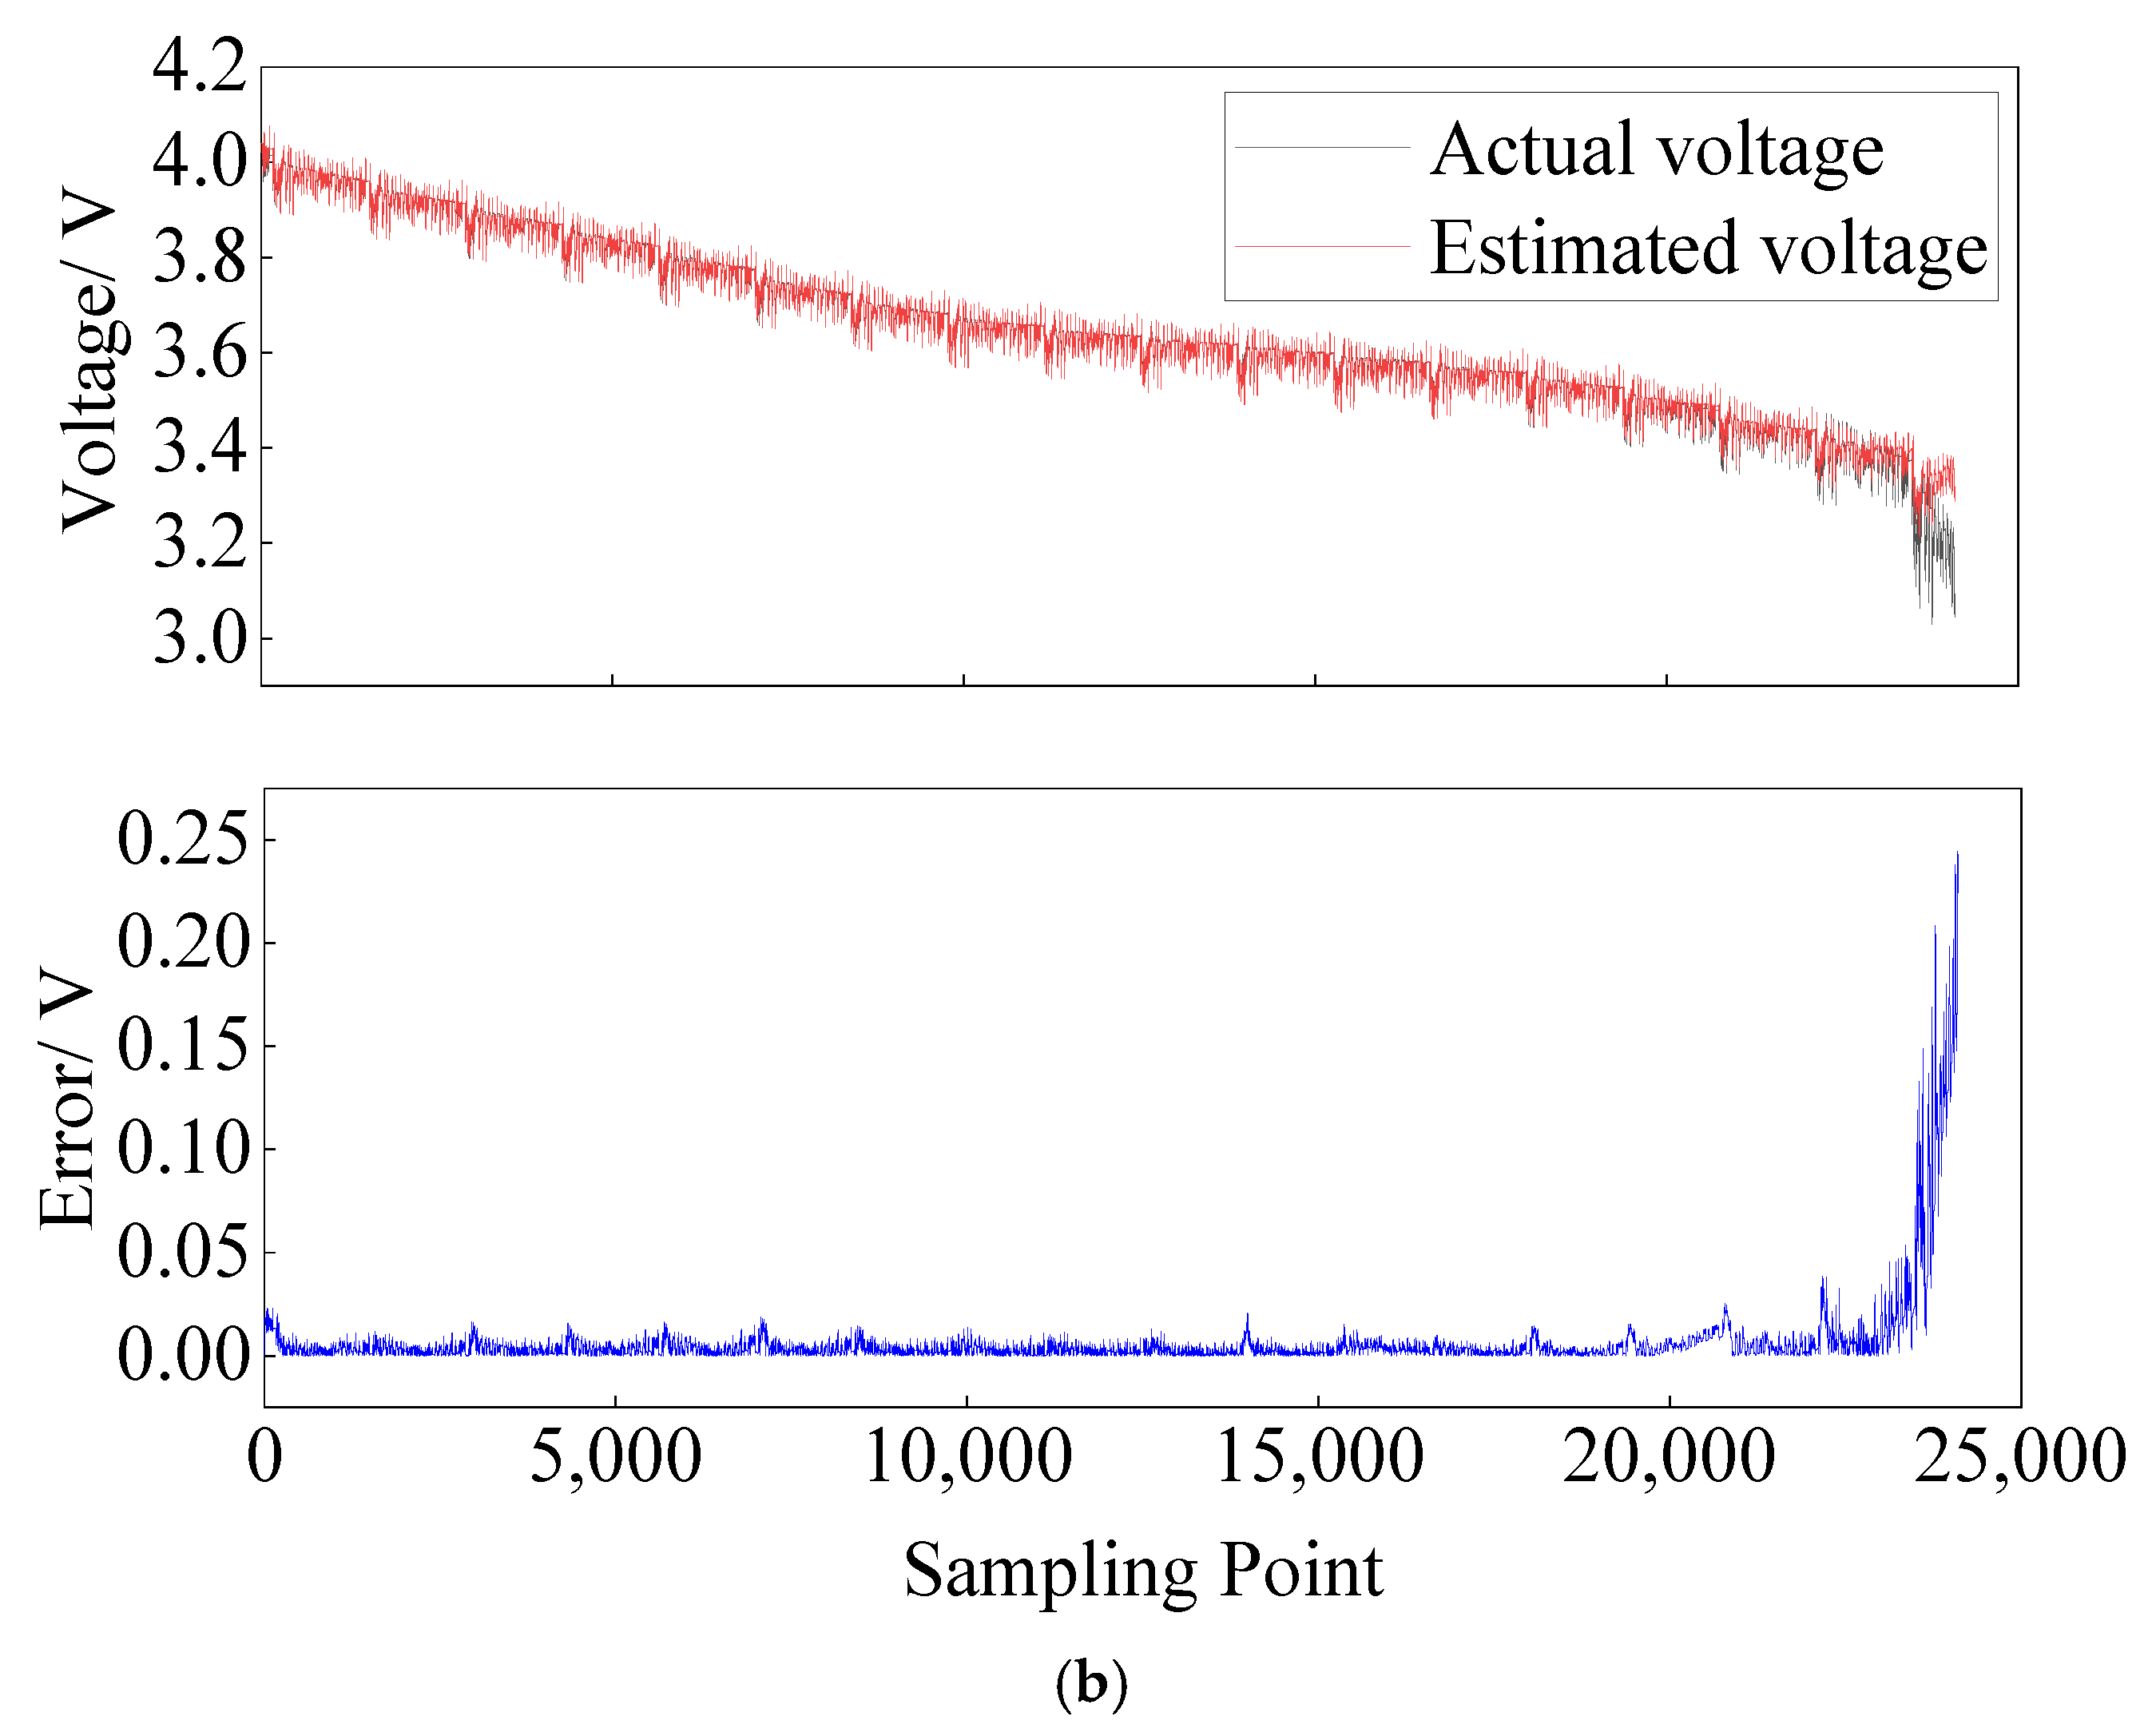
Figure 6a shows the cumulative error during parameter identification at every 5% SOC of the battery pack. The cumulative error is generally at a low level in the range of 8% to 5% SOC, staying within 10 V. However, it rises sharply at the last 5% SOC, and the cumulative error reaches 68.79 V. This is consistent with the sharp change of the R0 parameter at a low SOC in Figure 5, which indicates that the identification of the model parameters becomes more difficult, and the error increases when the battery is discharged too close to 0%. This is due to the instability of the battery performance at a low SOC [17].
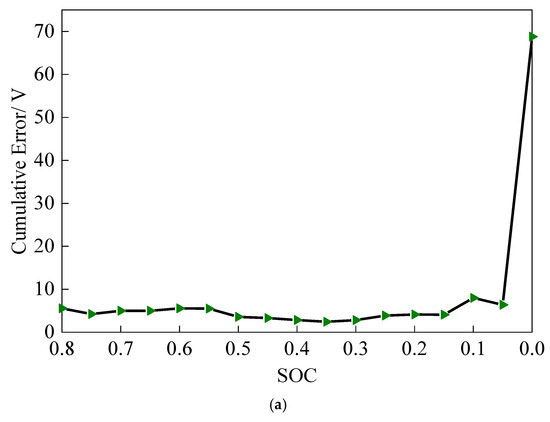

Figure 6.
(a) Cumulative error of parameter identification. (b) End voltage estimation results and error.
Based on the results of parameter identification, the second-order model terminal voltage under each sampling point is calculated on the second-order model of the lithium-ion battery and compared with the actual voltage, and the absolute value in the error between the two is also given, as shown in Figure 6b. The small error between the calculated model terminal voltages and the actual voltages indicates that the parameters identified using SSA for the second-order equivalent circuit model of the lithium-ion battery are able to better characterize the voltage characteristics of the battery. The error plot shows that the error is small at most sampling points, and the error is kept around 0.01 V. However, the error increases significantly during the low SOC discharge process, especially near the end of the discharge, which is consistent with the error trend of the parameter identification at low SOC. Therefore, this paper intercepts the data of the battery pack with SOC greater than 5% for analysis.
5.3. EKF Estimation Results
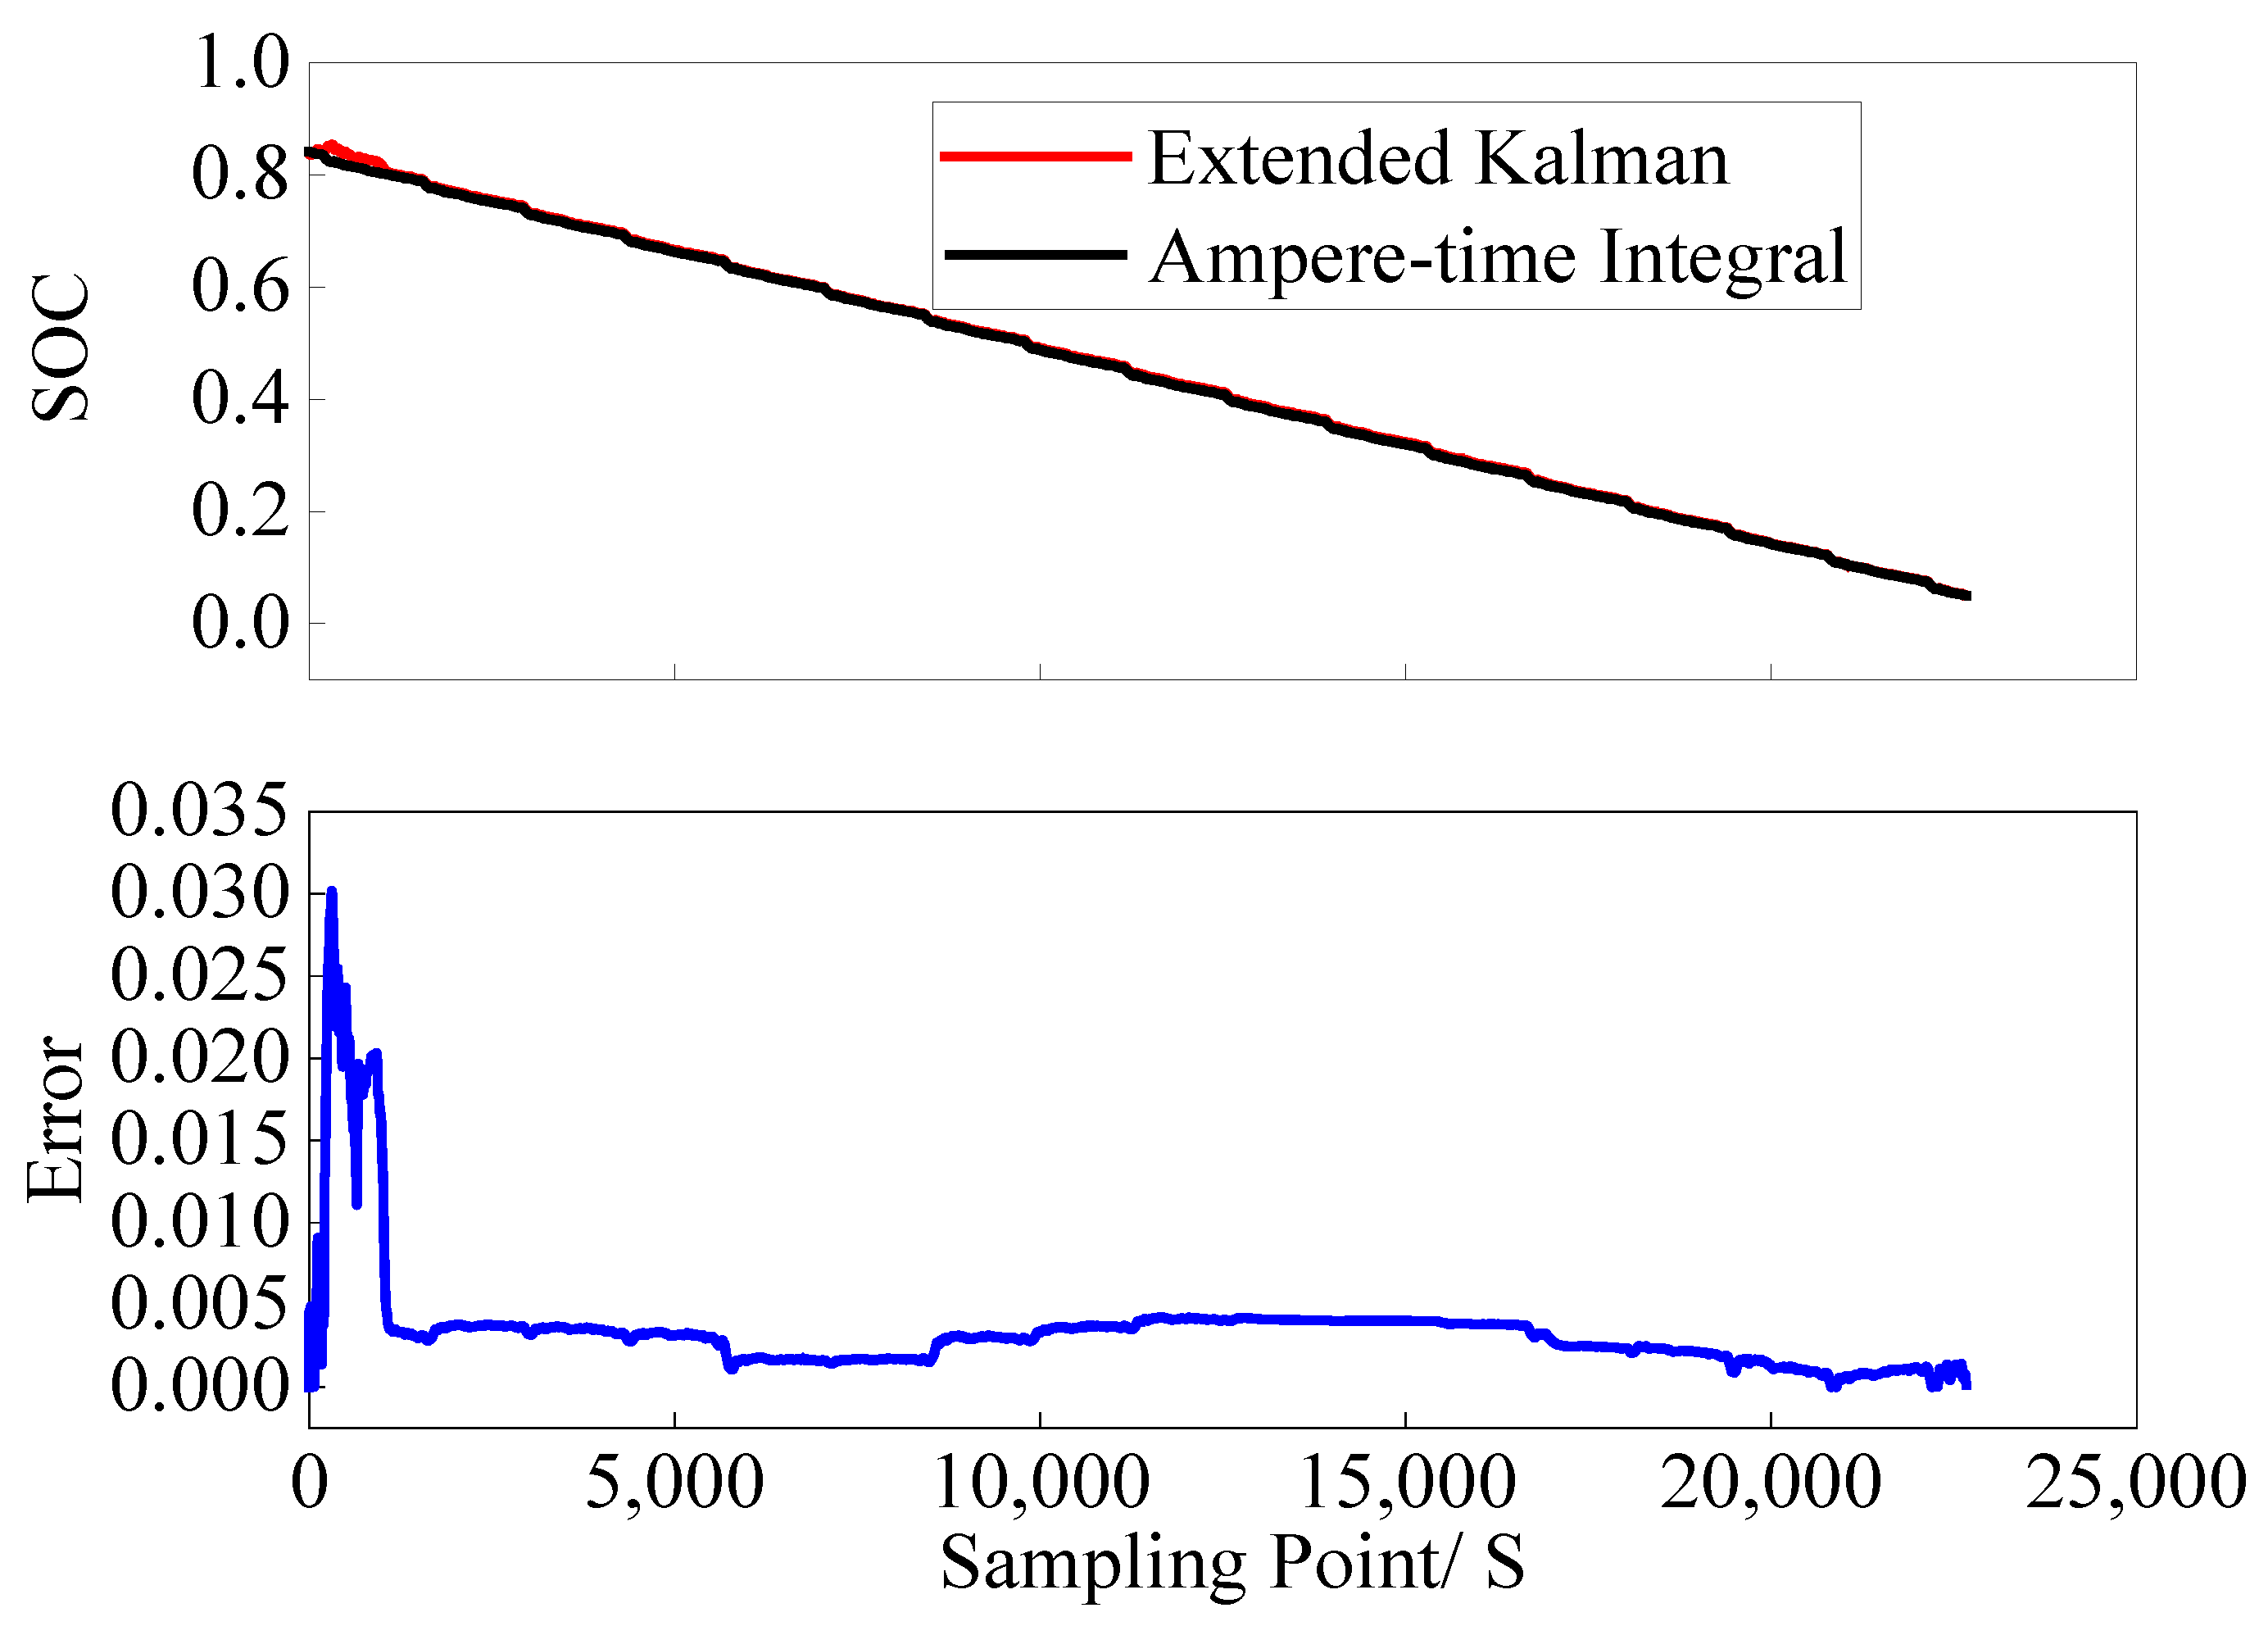
In Section 5.2, the results of SOC estimation for lithium-ion batteries using the EKF obtained by using the algorithm introduced in Section 4 are presented, as shown in Figure 7. The data where the SOC of the battery pack is greater than 5% is truncated and compared with the SOC obtained by the ampere-hour integration method. At the same time, the error between the two is presented. The SOC estimation results of the EKF method and the ampere-hour integration method have small errors. The error graph shows that the EKF method has a large error at the beginning of discharge, but the SOC gradually converges in the subsequent discharge estimation, and the error gradually decreases, remaining within 0.05. The RSME is 0.0049, and the MAE is 0.0034. As shown in Table 1, the RSME of the GA + EKF algorithm is 0.0063, and the MAE is 0.0051. In comparison, it proves the effectiveness of SSA and EKF in SOC estimation, and that the EKF can accurately track the changes in SOC.
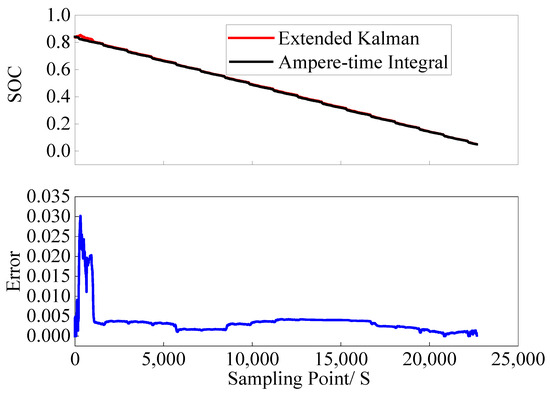
Figure 7.
EKF estimation results and errors.

Table 1.
Comparison of SOC estimation accuracy between SSA and GA.
5.4. Fault Diagnosis Results
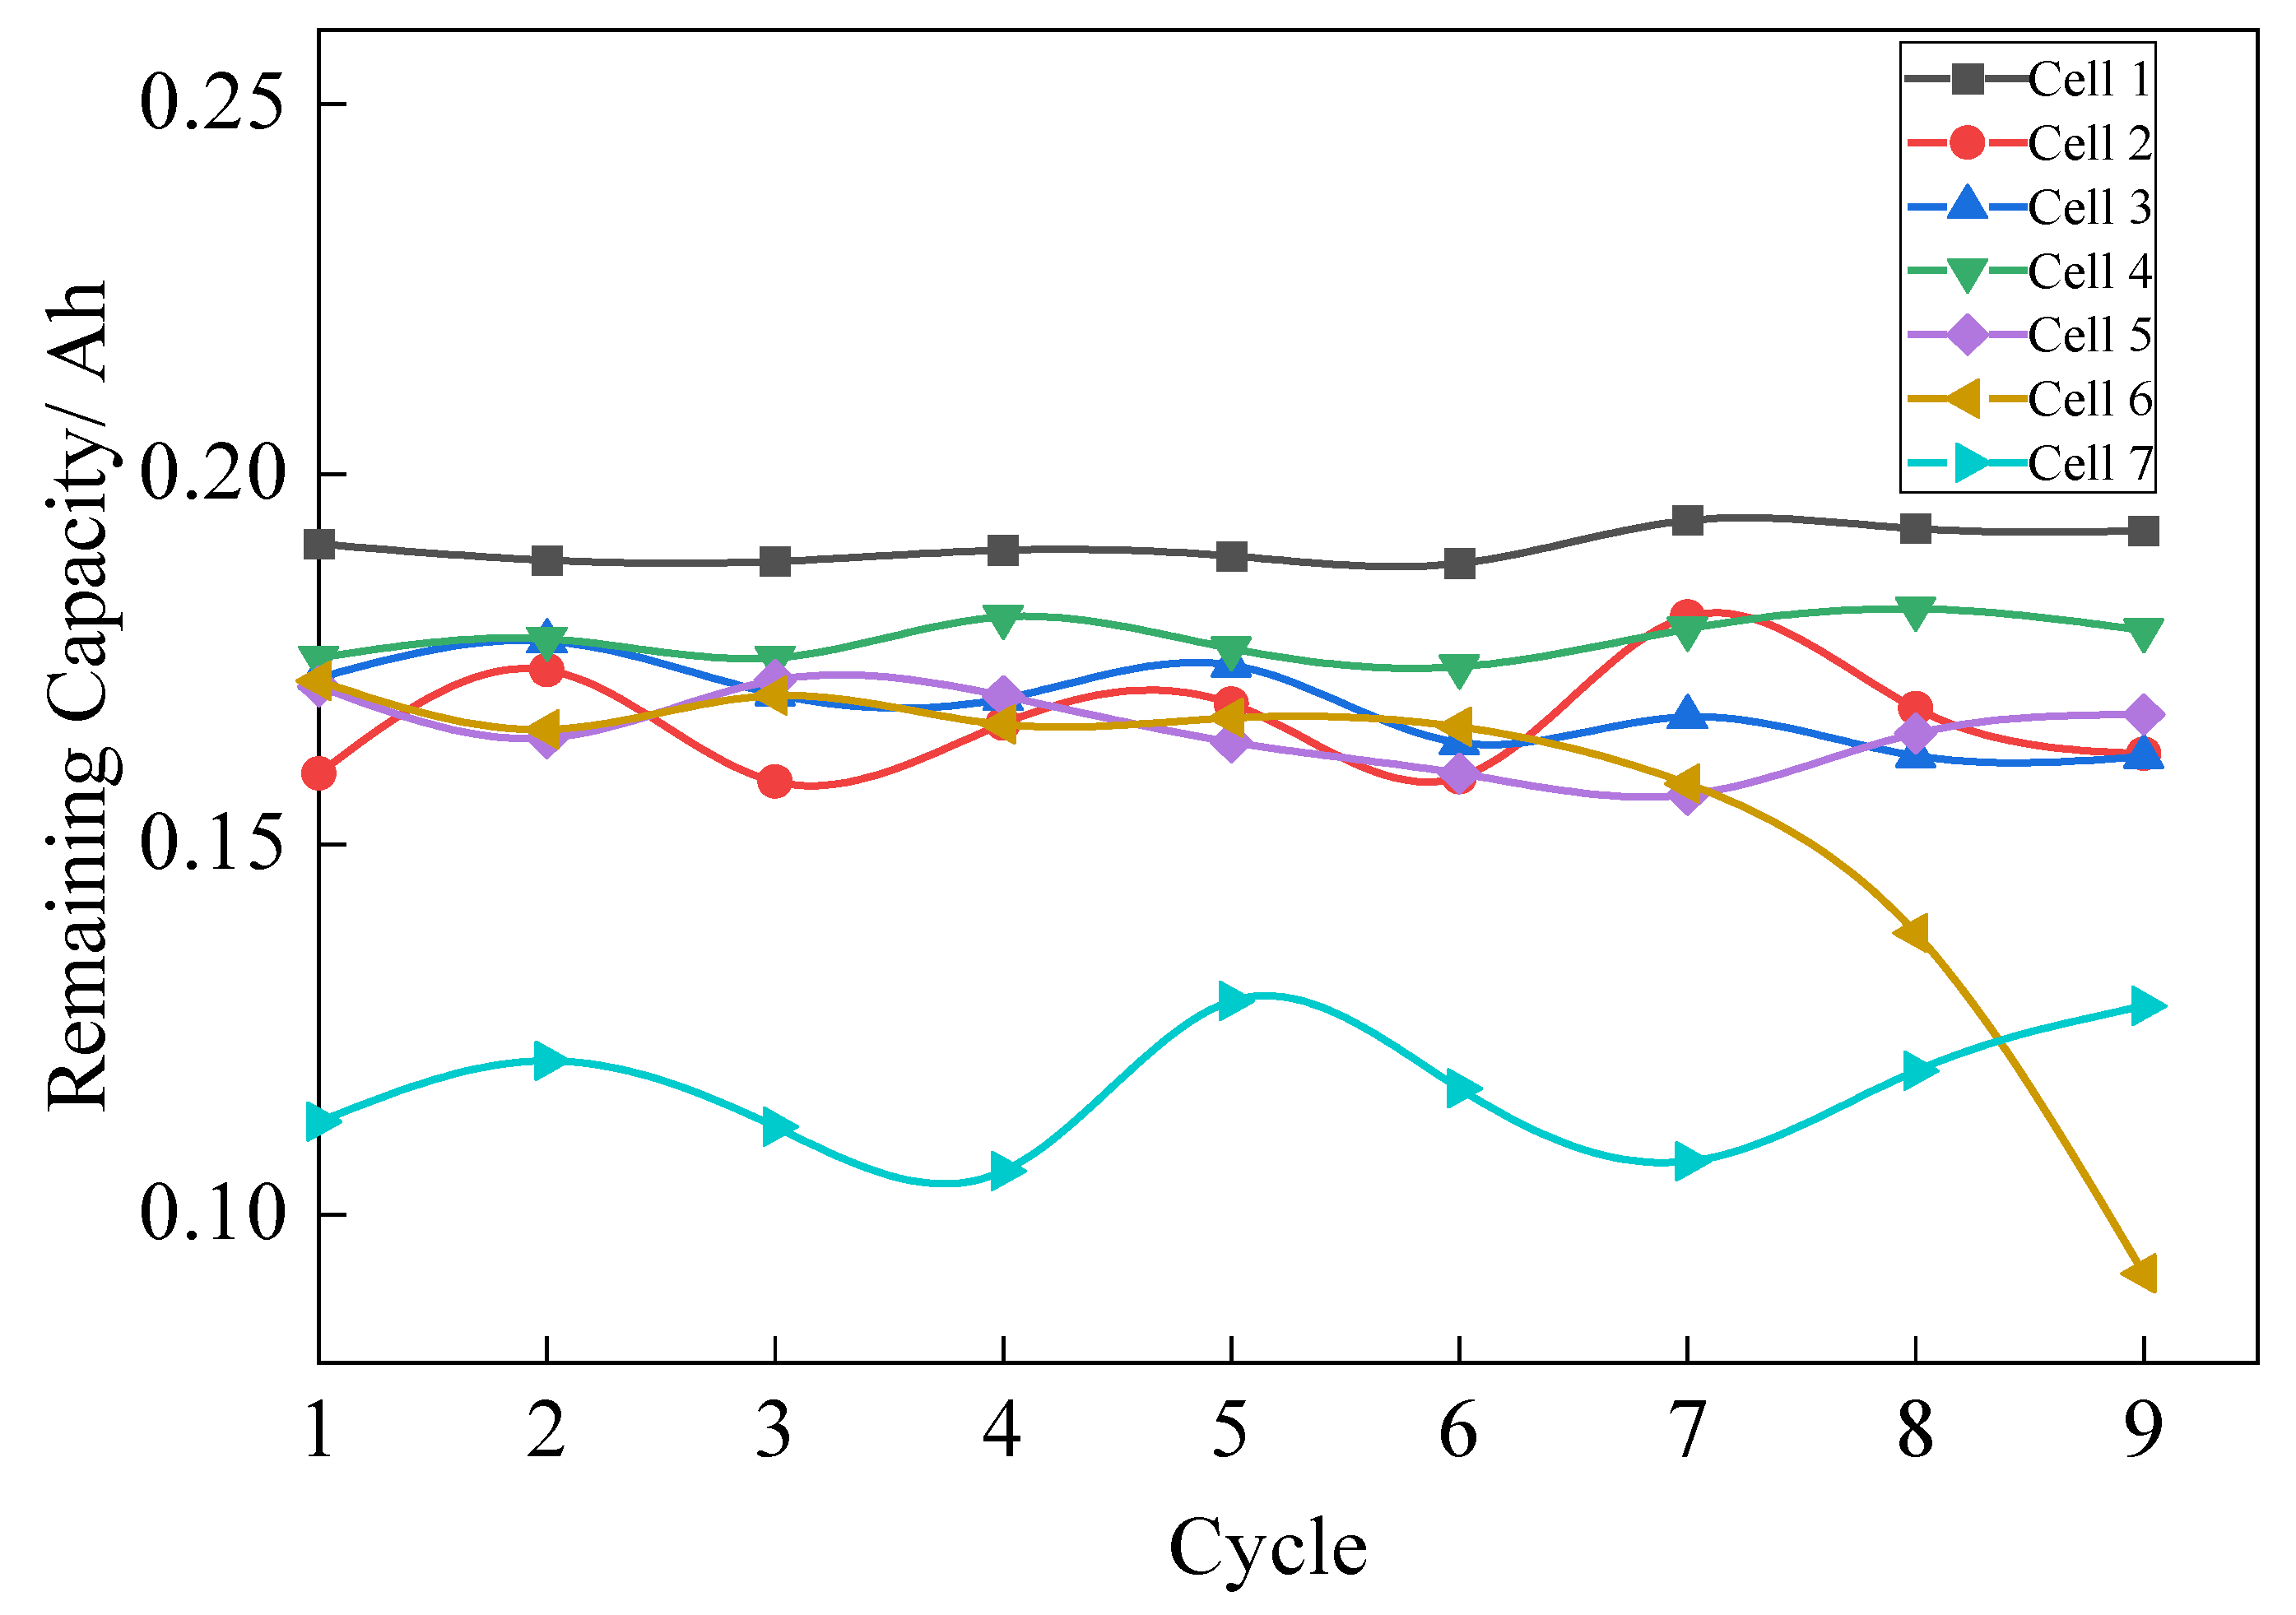
Shown in Figure 8 is the remaining discharge capacity change curve, which depicts the remaining discharge capacity under different cycles from cell 1 to cell 7. Among them, cell 7 is a lower-capacity battery, and observing the change in the remaining discharge capacity of cell 6, it can be seen that there are fluctuations in the remaining discharge capacity of cell 6 in the first 6 cycles, and the remaining discharge capacity of cell 6 decreases significantly in the 7th–9th cycles, which is precisely due to the occurrence of an internal short circuit in cell 6. This corresponds to the parallel connection of the 3000 Ω, 1000 Ω and 500 Ω resistors on both ends of cell 6 in the static stage of the experiments of the 7th–9th cycles, respectively. Overall, 3000 Ω, 1000 Ω, and 500 Ω resistors were connected in parallel at both ends of cell 6 during the resting phase of the 7th–9th cycle experiments to simulate the occurrence of an internal short circuit. The significant reduction in the remaining discharge capacity is consistent with the fact that the lower the parallel resistance of the battery, the more severe the occurrence of internal short circuits. After the 9th cycle, the remaining discharge capacity of cell 6 is lower than that of cell 7 with lower capacity. This proves that the internal short-circuit fault of cell 6 is becoming more and more obvious. Therefore, in this paper, the remaining discharge capacity of the battery is used as the feature vector to do the fault diagnosis analysis of lithium-ion battery.

Figure 8.
Remaining Capacity Change.
This paper utilizes box plots to perform fault diagnosis on feature vectors, with the feature value being the remaining discharge capacity of the battery, as shown in Figure 9. For each cell, the remaining discharge capacity after 9 cycles is analyzed in combination with the box plot. The box plot principle divides the data into four parts, so this paper starts the analysis with the first four cycles and performs a box plot analysis for each additional cycle. From the fourth to the sixth cycle, no abnormalities were observed. However, starting from the seventh cycle, an abnormal value appeared in the box plot of cell 6, which was precisely the remaining discharge capacity of cell 6 (connected in parallel with a 3000 Ω resistor) after the seventh cycle. Cell 6 also showed abnormal values after the eighth cycle (connected in parallel with a 1000 Ω resistor) and the ninth cycle (with two abnormal values). The abnormal value from the eighth cycle was at the upper side, while the abnormal value from the ninth cycle was precisely the remaining discharge capacity of cell 6 (connected in parallel with a 500 Ω resistor). Other cells, including cell 7 of low capacity, showed abnormal values.
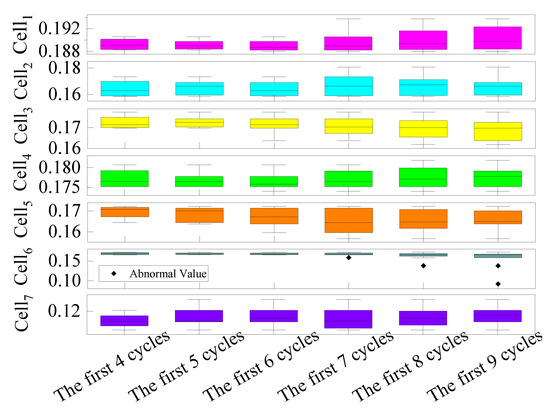
Figure 9.
Fault diagnosis results.
Graphical results demonstrate that all internal short-circuit abnormalities of the No. 6 monomer can be fully displayed in the box plot, indicating the effectiveness and accuracy of the box plot in detecting short circuit abnormalities. This proves the effectiveness of the fault diagnosis of lithium-ion batteries based on the historical trajectory of residual discharge capacity proposed in this paper. The experiments verify that the proposed method in this paper can accurately locate the failed monomer in the battery pack containing low-capacity monomers and can detect the abnormal situation of the monomer battery in time when the monomer battery has a micro-short-circuit fault.
6. Conclusions
This paper proposes a method for diagnosing lithium-ion batteries based on their historical trajectories of remaining discharge capacity over medium to long time scales. Firstly, the SSA algorithm is utilized for parameter identification of the second-order equivalent circuit model of lithium-ion batteries. Then, the EKF algorithm is employed for SOC estimation of lithium-ion batteries. The SOC obtained from the EKF algorithm is used to calculate the remaining discharge capacity of each cell. This remaining discharge capacity is utilized as a diagnostic feature. Lastly, box plots are employed to identify abnormalities in the features, thereby achieving fault diagnosis. Experimental validation demonstrates that the proposed method can accurately identify the cell 6 with internal shorts, even when there are low-capacity batteries in the battery pack. As soon as a micro-short circuit is simulated by connecting a 3000 Ω resistor in parallel with the sixth battery, the method identifies its abnormality. The effectiveness of the proposed lithium-ion battery fault diagnosis method based on the historical trajectories of remaining discharge capacity is also proven in battery packs containing both low-capacity and faulty batteries, as it can still accurately locate the internally shorted battery. The proposed lithium-ion battery fault diagnosis method has good practical application prospects. It not only improves the accuracy of battery fault diagnosis but also demonstrates great potential in battery management systems. In future fault diagnosis methods, more sensor data (such as temperature, pressure, etc.) and external environmental factors will be attempted to be introduced for multi-dimensional data fusion. This will help to gain a more comprehensive understanding of the battery’s operating state and thereby improve the accuracy of fault prediction.
Author Contributions
Methodology; J.J.; Validation; B.Q.; Supervision; S.L.; Writing—Original Draft; B.Q., Z.Z. and H.Y.; Writing—Review; S.L. and C.C.; Funding Acquisition; J.J. All authors have read and agreed to the published version of the manuscript.
Funding
National Key Research and Development Program of China (2022YFB2404300).
Institutional Review Board Statement
Not applicable.
Informed Consent Statement
Not applicable.
Data Availability Statement
The raw data supporting the conclusions of this article will be made available by the authors on request.
Conflicts of Interest
The authors declare no conflicts of interest.
References
- Chombo, P.V.; Laoonual, Y. A review of safety strategies of a Li-ion battery. J. Power Sources 2020, 478, 228649. [Google Scholar] [CrossRef]
- An, Z.; Jia, L.; Ding, Y.; Dang, C.; Li, X. A review on lithium-ion power battery thermal management technologies and thermal safety. J. Therm. Sci. 2017, 26, 391–412. [Google Scholar] [CrossRef]
- Jaguemont, J.; Bardé, F. A critical review of lithium-ion battery safety testing and standards. Appl. Therm. Eng. 2023, 231, 121014. [Google Scholar] [CrossRef]
- Xu, G.; Han, Q.; Chen, H.; Xia, Y.; Liu, Z.; Tian, S. Safety warning analysis for power battery packs in electric vehicles with running data. J. Energy Storage 2022, 56, 105878. [Google Scholar] [CrossRef]
- Lamb, J.; Jeevarajan, J.A. New developments in battery safety for large-scale systems. MRS Bull. 2021, 46, 395–401. [Google Scholar] [CrossRef]
- Shang, Y.; Wang, S.; Tang, N.; Fu, Y.; Wang, K. Research progress in fault detection of battery systems: A review. J. Energy Storage 2024, 98, 113079. [Google Scholar] [CrossRef]
- Khaneghah, M.Z.; Alzayed, M.; Chaoui, H. Fault detection and diagnosis of the electric motor drive and battery system of electric vehicles. Machines 2023, 11, 713. [Google Scholar] [CrossRef]
- Mouncef, E.; Mostafa, B.; Naoufl, E. Online parameter estimation of a lithium-ion battery based on sunflower optimization algorithm. In Proceedings of the 2020 2nd Global Power, Energy and Communication Conference (GPECOM), Izmir, Turkey, 20–23 October 2020; pp. 53–58. [Google Scholar]
- Wu, G.; Zhu, C.; CC, C. Comparison of the first order and the second order equivalent circuit model applied in state of charge estimation for battery used in electric vehicles. J. Asian Electr. Veh. 2010, 8, 1357–1362. [Google Scholar] [CrossRef]
- Chang, C.; Wang, Z.; Zhang, Z.; Jiang, J.; He, X.; Tian, A.; Jiang, Y. Short-circuit fault detection and quantitative analysis based on mean-difference model with variational modal decomposition. J. Electrochem. Energy Convers. Storage 2024, 21, 021007. [Google Scholar] [CrossRef]
- Xu, D.; Liu, J.; Liu, D.; Fu, Q.; Li, M.; Faiz, M.A.; Liu, S.; Li, T.; Cui, S.; Yan, G. Indicator system optimization model for evaluating resilience of regional agricultural soil–water resource composite system. Water Supply 2021, 21, 3251–3266. [Google Scholar] [CrossRef]
- Li, Y.; Cai, Y.; Zeng, K.; Ma, Y.; Li, M. Joint estimation of SOC and SOH of lithium battery for pure electric vehicles based on EKF algorithm. J. Shaoyang Coll. (Nat. Sci. Ed.) 2024, 21, 45–55. [Google Scholar]
- Zhao, X.; Wang, J.; Zhao, M.; Pan, B.; Wang, R.; Wang, L.; Yan, X. Micro-short circuit fault diagnosis of the parallel battery module based on increment capacity curve. J. Energy Storage 2024, 86, 111201. [Google Scholar] [CrossRef]
- Qin, H.; Huang, B.; Yan, X.; Wang, Y.; Xu, S.; Liu, S. Research on the diagnosis method of micro-short circuit of lithium iron phosphate battery pack. Energy Storage Sci. Technol. 2021, 10, 664–670. [Google Scholar]
- Shrivastava, P.; Soon, T.K.; Idris, M.Y.I.B.; Mekhilef, S. Overview of model-based online state-of-charge estimation using Kalman filter family for lithium-ion batteries. Renew. Sustain. Energy Rev. 2019, 113, 109233. [Google Scholar] [CrossRef]
- Awadallah, M.A.; Venkatesh, B. Accuracy improvement of SOC estimation in lithium-ion batteries. J. Energy Storage 2016, 6, 95–104. [Google Scholar] [CrossRef]
- Zheng, Y.; Cui, Y.; Han, X.; Dai, H.; Ouyang, M. Lithium-ion battery capacity estimation based on open circuit voltage identification using the iteratively reweighted least squares at different aging levels. J. Energy Storage 2021, 44, 103487. [Google Scholar] [CrossRef]


Disclaimer/Publisher’s Note: The statements, opinions and data contained in all publications are solely those of the individual author(s) and contributor(s) and not of MDPI and/or the editor(s). MDPI and/or the editor(s) disclaim responsibility for any injury to people or property resulting from any ideas, methods, instructions or products referred to in the content. |
© 2024 by the authors. Licensee MDPI, Basel, Switzerland. This article is an open access article distributed under the terms and conditions of the Creative Commons Attribution (CC BY) license (https://creativecommons.org/licenses/by/4.0/).