Article

Evaluating Petrophysical Properties Using Digital Rock Physics Analysis: A CO2 Storage Feasibility Study of Lithuanian Reservoirs

1
Department of Mathematical Modelling, Kaunas University of Technology, 44249 Kaunas, Lithuania
2
Department of Earth Sciences, Indian Institute of Technology Roorkee, Roorkee 247667, India
*
Author to whom correspondence should be addressed.
Appl. Sci. 2024, 14(23), 10826; https://doi.org/10.3390/app142310826
Submission received: 9 October 2024 / Revised: 9 November 2024 / Accepted: 19 November 2024 / Published: 22 November 2024
(This article belongs to the Special Issue CCUS: Paving the Way to Net Zero Emissions Technologies)

Abstract

:
As the global concern over greenhouse gas emissions grows, CO2 storage in deep saline aquifers and depleted reservoirs has become crucial for climate change mitigation. This study evaluates the feasibility of Lithuanian deep saline aquifers, specifically, Syderiai and Vaskai, for effective CO2 storage. Unlike previous theoretical analyses, it provides experimental data on static and dynamic reservoir parameters that impact CO2 injection and retention. Using micro X-ray computed tomography (MXCT) and multi-resolution scanning at 8 µm and 22 µm, digital rock volumes (DRVs) from core samples were created to determine porosity and permeability. The method, validated against analogous samples, identified a representative element volume (REV) within sub-volumes, showing a homogeneous distribution of petrophysical properties in the Lithuanian samples. The results show that DRVs can accurately reflect pore-scale properties, achieving 90–95% agreement with lab measurements, and offer a rapid, efficient means for analyzing storage potentials. These insights confirm that Lithuanian aquifers are promising for CO2 sequestration, with recommendations for further long-term monitoring and applications of this technique across the region.

1. Introduction

Among greenhouse gases, CO2 is considered the primary contributor to global warming. According to NASA (2023) [1], CO2 levels remained relatively stable for the past 800,000 years, not exceeding 300 ppm until the last 60–70 years. During this recent period, CO2 levels have increased 100 times faster, highlighting the urgent need to reduce these rising levels and mitigate the effects of climate change, thereby maintaining the goal of keeping the global temperature increase to below 1.5 °C, as discussed at the COP27 meeting in Egypt [1].
In response to this challenge, Carbon Capture and Storage (CCS) has emerged as an effective method. CCS primarily focusses on the storage aspect, involving the containment of captured CO2 within various geological formations. These geological formations encompass different reservoirs that serve as suitable CO2 storage sites, such as depleted hydrocarbon reservoirs, considered the most reliable due to their well-understood conditions [2], and deep saline aquifers are considered the most suitable due to their wide availability and proximity to CO2 emission sources. Other potential storage-site options include salt accumulations and coal beds [3,4,5,6].
The Baltic basin, encompassing the countries of Estonia, Latvia, and Lithuania, has a thickness ranging from 100 m in Estonia to up to 1900 m in Latvia and 2300 m in Lithuania [7]. To effectively store CO2 in a supercritical state, specific conditions must be met, including a minimum depth of 800 m and the presence of porous and permeable reservoir rocks with impermeable caprocks. Therefore, only Latvia and Lithuania have reservoirs suitable for CO2 sequestration, such as depleted hydrocarbon reserves and saline aquifers (Figure 1), located at depths of more than 800 m [7,8,9,10].
The effective and secure storage of injected CO2 in subsurface reservoirs necessitates a thorough understanding of the distribution of pores and grains within these reservoirs, particularly at the microscopic scale. Porosity and permeability are the two important parameters that influence the injectivity and storage of CO2 in geological formations. High porosity provides ample space for CO2 containment, while high permeability allows for the efficient injection and distribution of CO2 into reservoirs. These factors directly impact the feasibility, efficiency, long-term stability, and security of stored CO2.
Numerous studies have sought to understand the efficiency and suitability of a reservoir for the storage of CO2, including the utilization of reservoirs for the enhanced recovery of hydrocarbons. Various key factors that play a crucial role in the storage of CO2 includes porosity, permeability, rock–brine–CO2 interactions, wettability, and trapping mechanisms. Table 1 presents recent advancements of the work conducted by various researchers around the globe for the safe and efficient storage of CO2, including the utilization of scanned images in evaluating the efficacy of a reservoir.
The studies summarized in Table 1 demonstrate the global efforts to understand and improve CCS techniques. Many researchers have employed MXCT imaging to assess reservoir efficiency and estimate storage potentials [24]. While factors like wettability and secondary imbibition play significant roles in CO2 storage, petrophysical properties—especially porosity and permeability—are the most critical determinants of a reservoir’s suitability for CCS. This study addresses a research gap in the literature by providing the results of an experimental analysis of core samples from Lithuanian deep saline aquifers, which have not previously been studied. Existing studies on CO2 storage in Lithuanian formations have primarily focused on theoretical models, leaving a gap in understanding the specific petrophysical characteristics of the formations.
In this research, MXCT imaging was used to analyze key petrophysical parameters, such as porosity and permeability, at the pore scale [25,26]. The methodology was benchmarked using core samples from analogous formations that are representative of Lithuanian aquifers. This study then applied the same analysis to actual core samples from the Lithuanian reservoirs. This approach ensures robust and accurate data that can inform future CO2 injection and storage efforts in this region. A major contribution of this work is the estimation of representative element volumes (REVs), which reduces the time required to assess reservoir properties. This is particularly important, as reservoir changes due to CO2 injections occur at the pore scale. By providing a pore-scale analysis and validated petrophysical data, this study establishes a framework for assessing CO2 storage efficiency and integrity in Lithuanian aquifers.
This paper is organized as follows: the Introduction is presented in Section 1. Section 2 describes the geology of the formations. Section 3 gives a description of the materials and methods used in the present study, including the adopted methodology. The results obtained are presented in Section 4. Section 5 discusses the results. A review of the CO2 storage capacity estimation of Lithuanian saline aquifers is presented in Section 6. Finally, a summary and conclusions are presented in Section 7.

2. Geological Setting

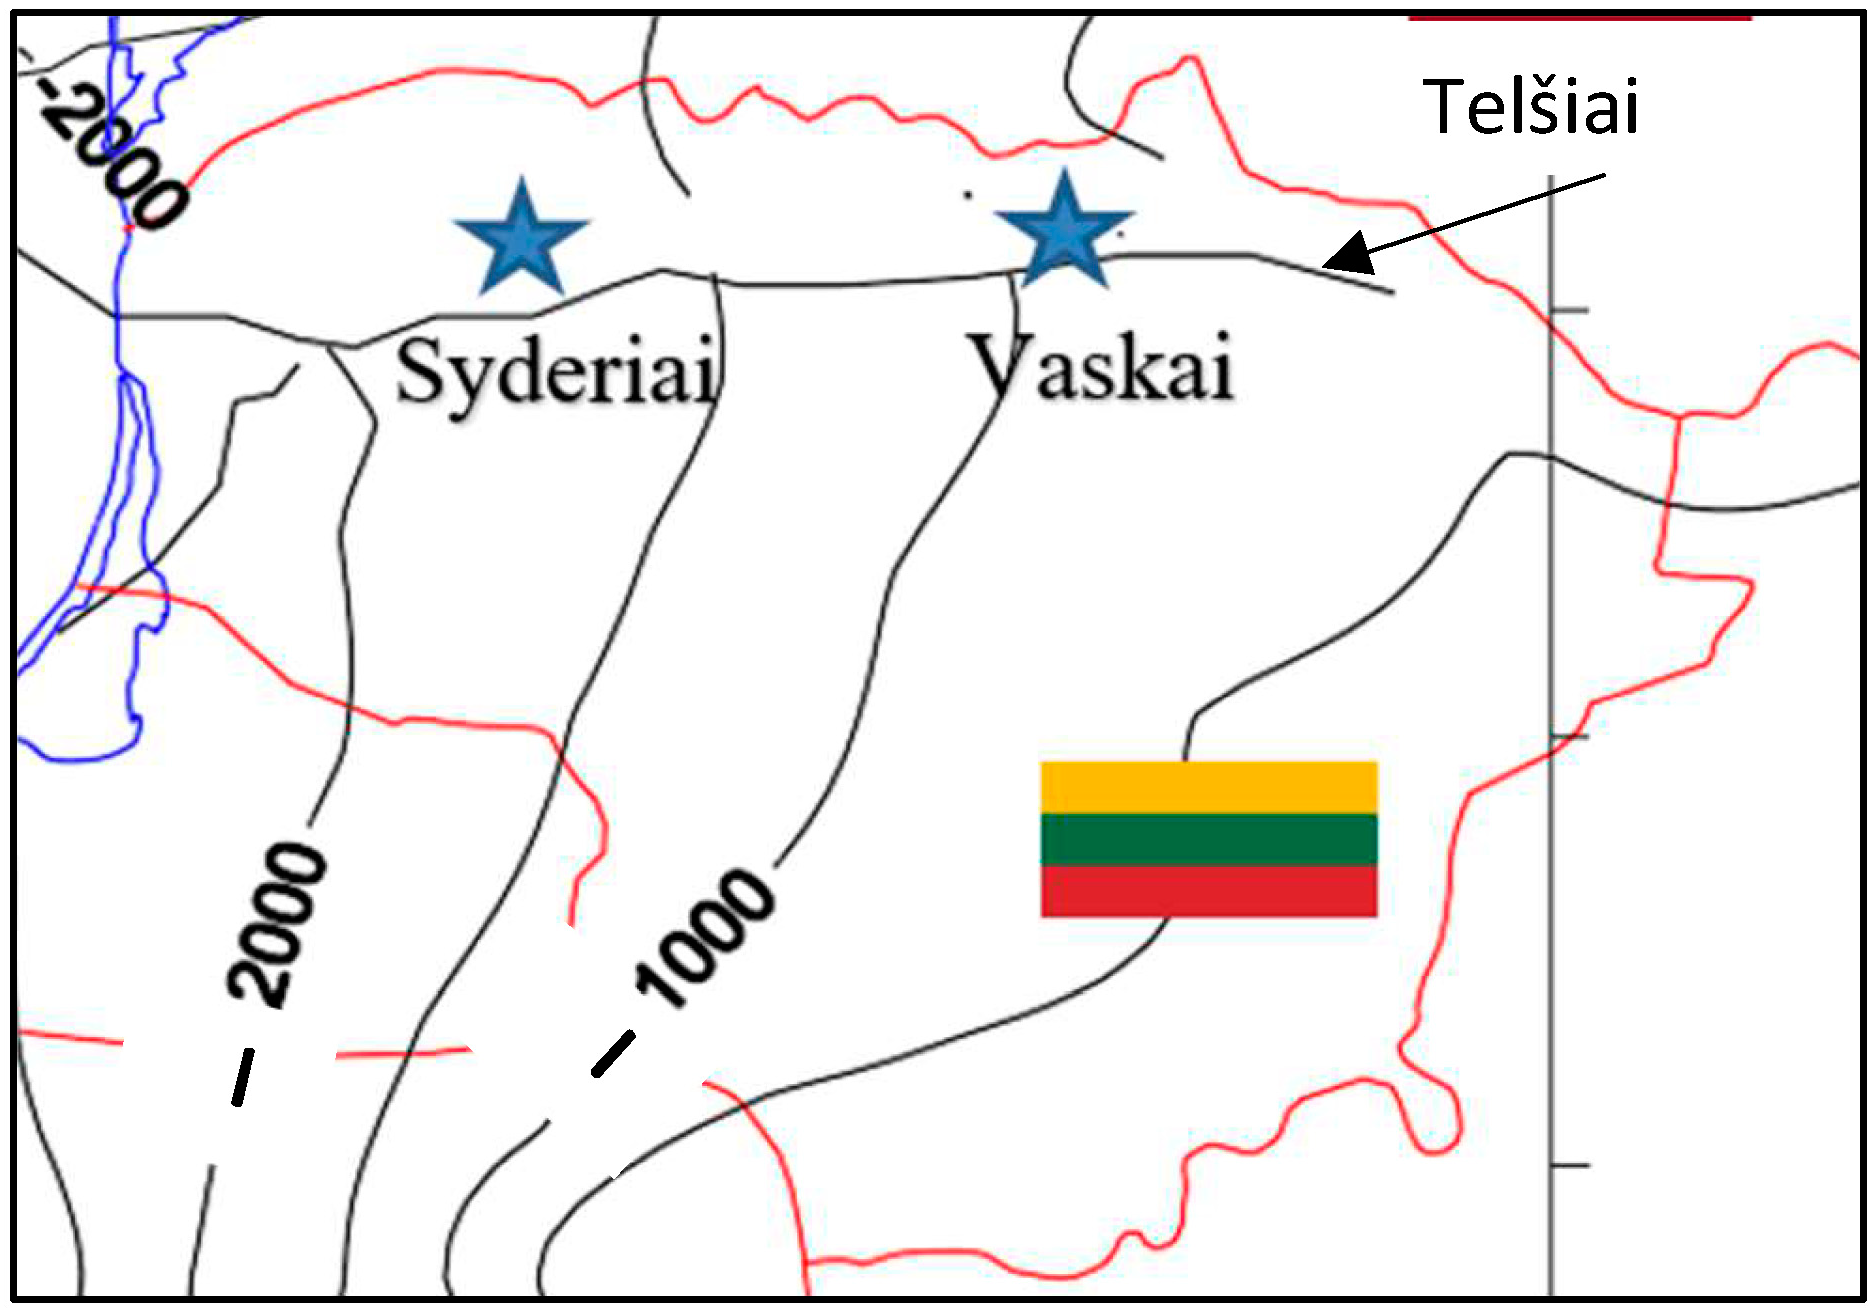
Lithuanian basins comprise a number of subsurface reservoirs for the safe storage of CO2, and earlier studies [7,27,28] point to two most prominent reservoirs, namely, the Syderiai and Vaskai onshore aquifers. This study focuses on these two saline aquifers: Syderiai and Vaskai (Figure 2). These are sandstone aquifers of the Cambrian age, and the formation type is a Deimena formation. Mineralogically, the Deimena formation sandstone is identified as a mature rock, classified within the quartz arenite group due to the predominance of detrital quartz, constituting 90–99% of framework grains. The detrital quartz grains exhibit a size range of fine to medium, typically measuring between 0.15 and 0.5 mm, with occasional observations of coarse grains [7,29].
Syderiai structure: According to the findings of both 2D and 3D seismic surveys, the Syderiai structure exhibits a northeast–southwest elongated dome, associated with the Telšiai fault zone. The complex Telšiai fault zone and its branching faults are situated within the southern region of the structure. Porosity estimates derived from seismic data inversions indicate a range of 14–18 percent for the Deimena series, exhibiting a gradual distribution. The thickness of this series varies from 20 to 60 m, with the maximum thickness observed in the southeast. According to Neutron Gamma Ray (NGR) logging data [7], the average porosity of the Middle Cambrian sandstone is 16%, and the average permeability is 400 mD.
The oblong-shaped Syderiai structure spans an area of 12 × 8 km2, reaching a height of 80 m. Comprising sandstones from the Middle Cambrian Deimena series, the structure includes a Middle Cambrian layer situated around 1320 m deep at the structure’s center. Towards the western part, the depth increases, reaching 1380 m. The aquifer’s thickness measures 57 m and is sealed on top by a 560 m thick Ordovician–Silurian shale layer [7,29].
Vaskai structure: The Vaškai structure extends in the west–east direction and is bordered by two smaller faults in the north and the Telšiai fault in the south, covering a length of 12 km. The sandstone’s porosity within this structure varies from 19.5% to 24.5%, while the permeability ranges from 90 to 1628 mD. According to sonic logging data, the average porosity of the sandstone corresponds to 23%, and the average permeability corresponds to 280 mD [7].
Encompassing an area of 11 × 3.2 km2, the Vaskai structure has a brachy anticlinal shape with a height of 36 m. The primary aquifer horizon consists of fine-grained-to-medium-grained sandstones from the Lower Cambrian Virbaliai suite (Cm1vr), alongside clayey sand siltstones [7,29]. The Cambrian aquifer’s thickness is 60 m, located at a depth of 900 m, and is overlaid by Ordovician–Silurian clay layers with a thickness of about 360 m.

3. Materials and Methods

3.1. Description of Samples

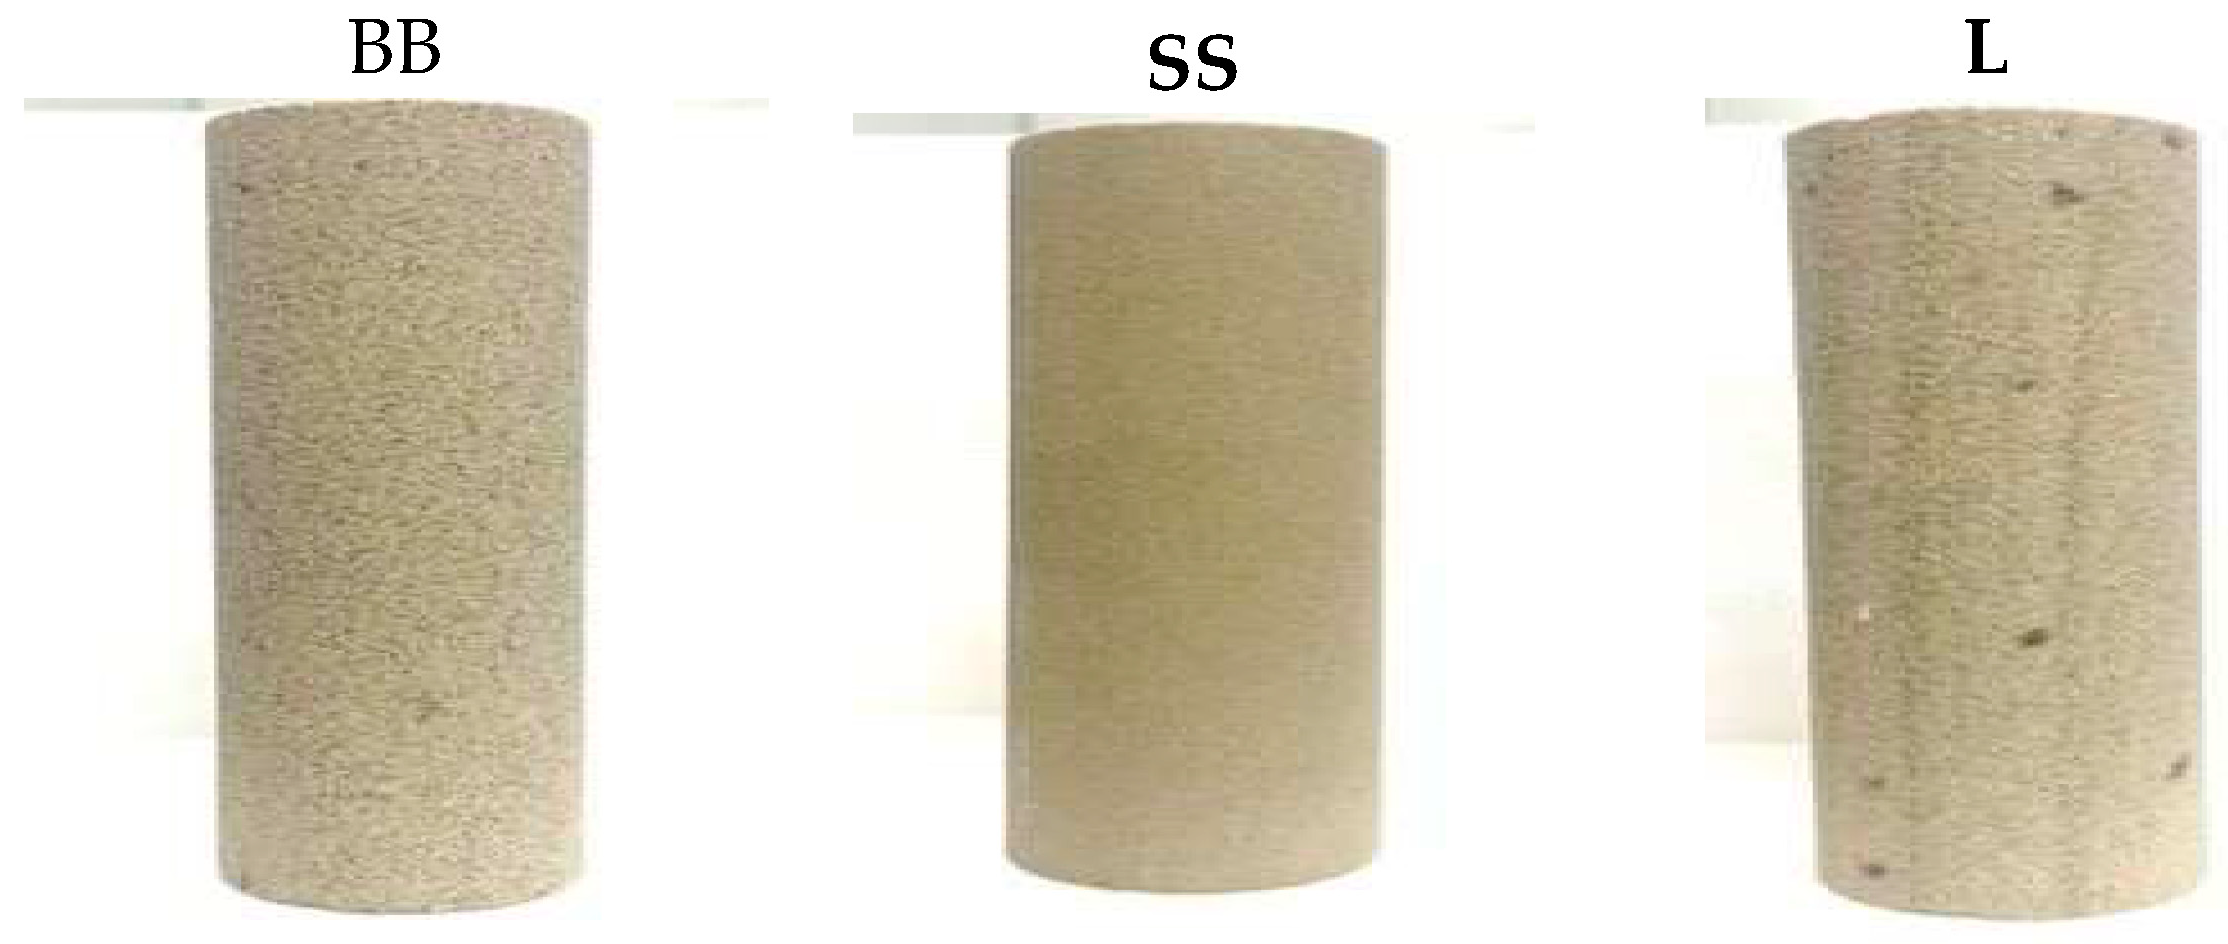
In this study, two sets of sandstone samples were used. Set 1 comprises three (03) rock samples (Figure 3), primarily composed of quartz as the dominant mineralogy with minor occurrences of clay minerals. These samples are from formations which are analogous to Lithuanian formations. The samples were selected based on their mineralogical distributions and petrophysical properties, which resemble those of Lithuanian saline aquifers. The laboratory-measured petrophysical properties are mentioned in Table 2.
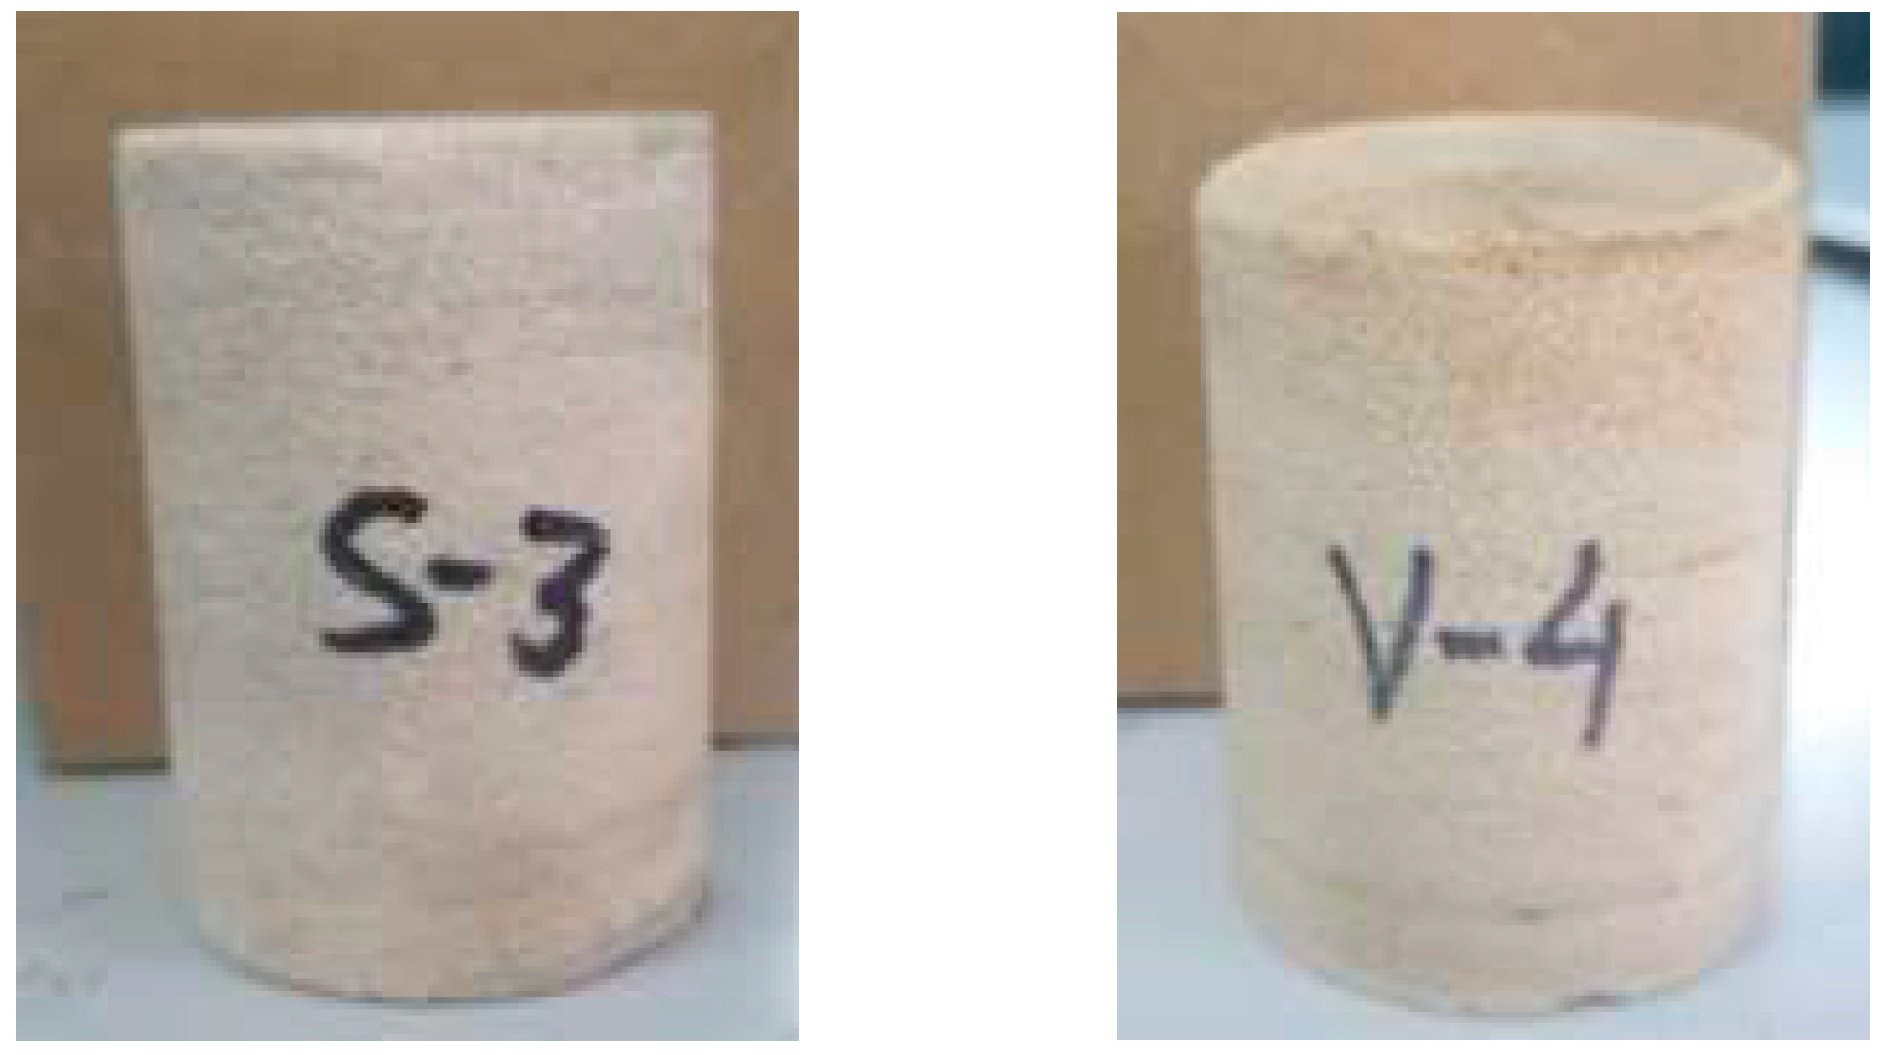
Set 2 comprises two (02) rock samples (Figure 4) from Lithuanian saline aquifer formations, Syderiai and Vaskai. The petrophysical properties of the rock samples from these two reservoirs are given in Table 3. Table 3 shows the mean porosity and permeability values of rock samples taken from the specific depth ranges.

3.2. Laboratory Measurements

Porosity and Permeability Measurements: The porosity and permeability of the rock samples were measured using the gas expansion method, based on Boyle’s law. Helium gas is allowed to pressurize and expand to determine the pore volume and permeability of the rock samples [30].
Micro X-ray computed tomography (MXCT) scanning: The rock core samples were scanned using the micro X-ray computed tomography (MXCT) scanning machine SKYSCAN 1275 (©Bruker, Billerica, MA, USA). The samples are placed in a holder, which rotates, ensuring a 360° coverage, and X-rays are emitted from the source. The X-rays interact with the rock sample, either being absorbed, reflected, refracted, or transmitted, depending upon the mineral composition or pore space. When encountering voids, X-rays pass through, resulting in black regions in the produced image. Quartz, prevalent in our samples, reflects X-rays, appearing as bright white areas, while other minerals manifest as varying shades of gray in the images.
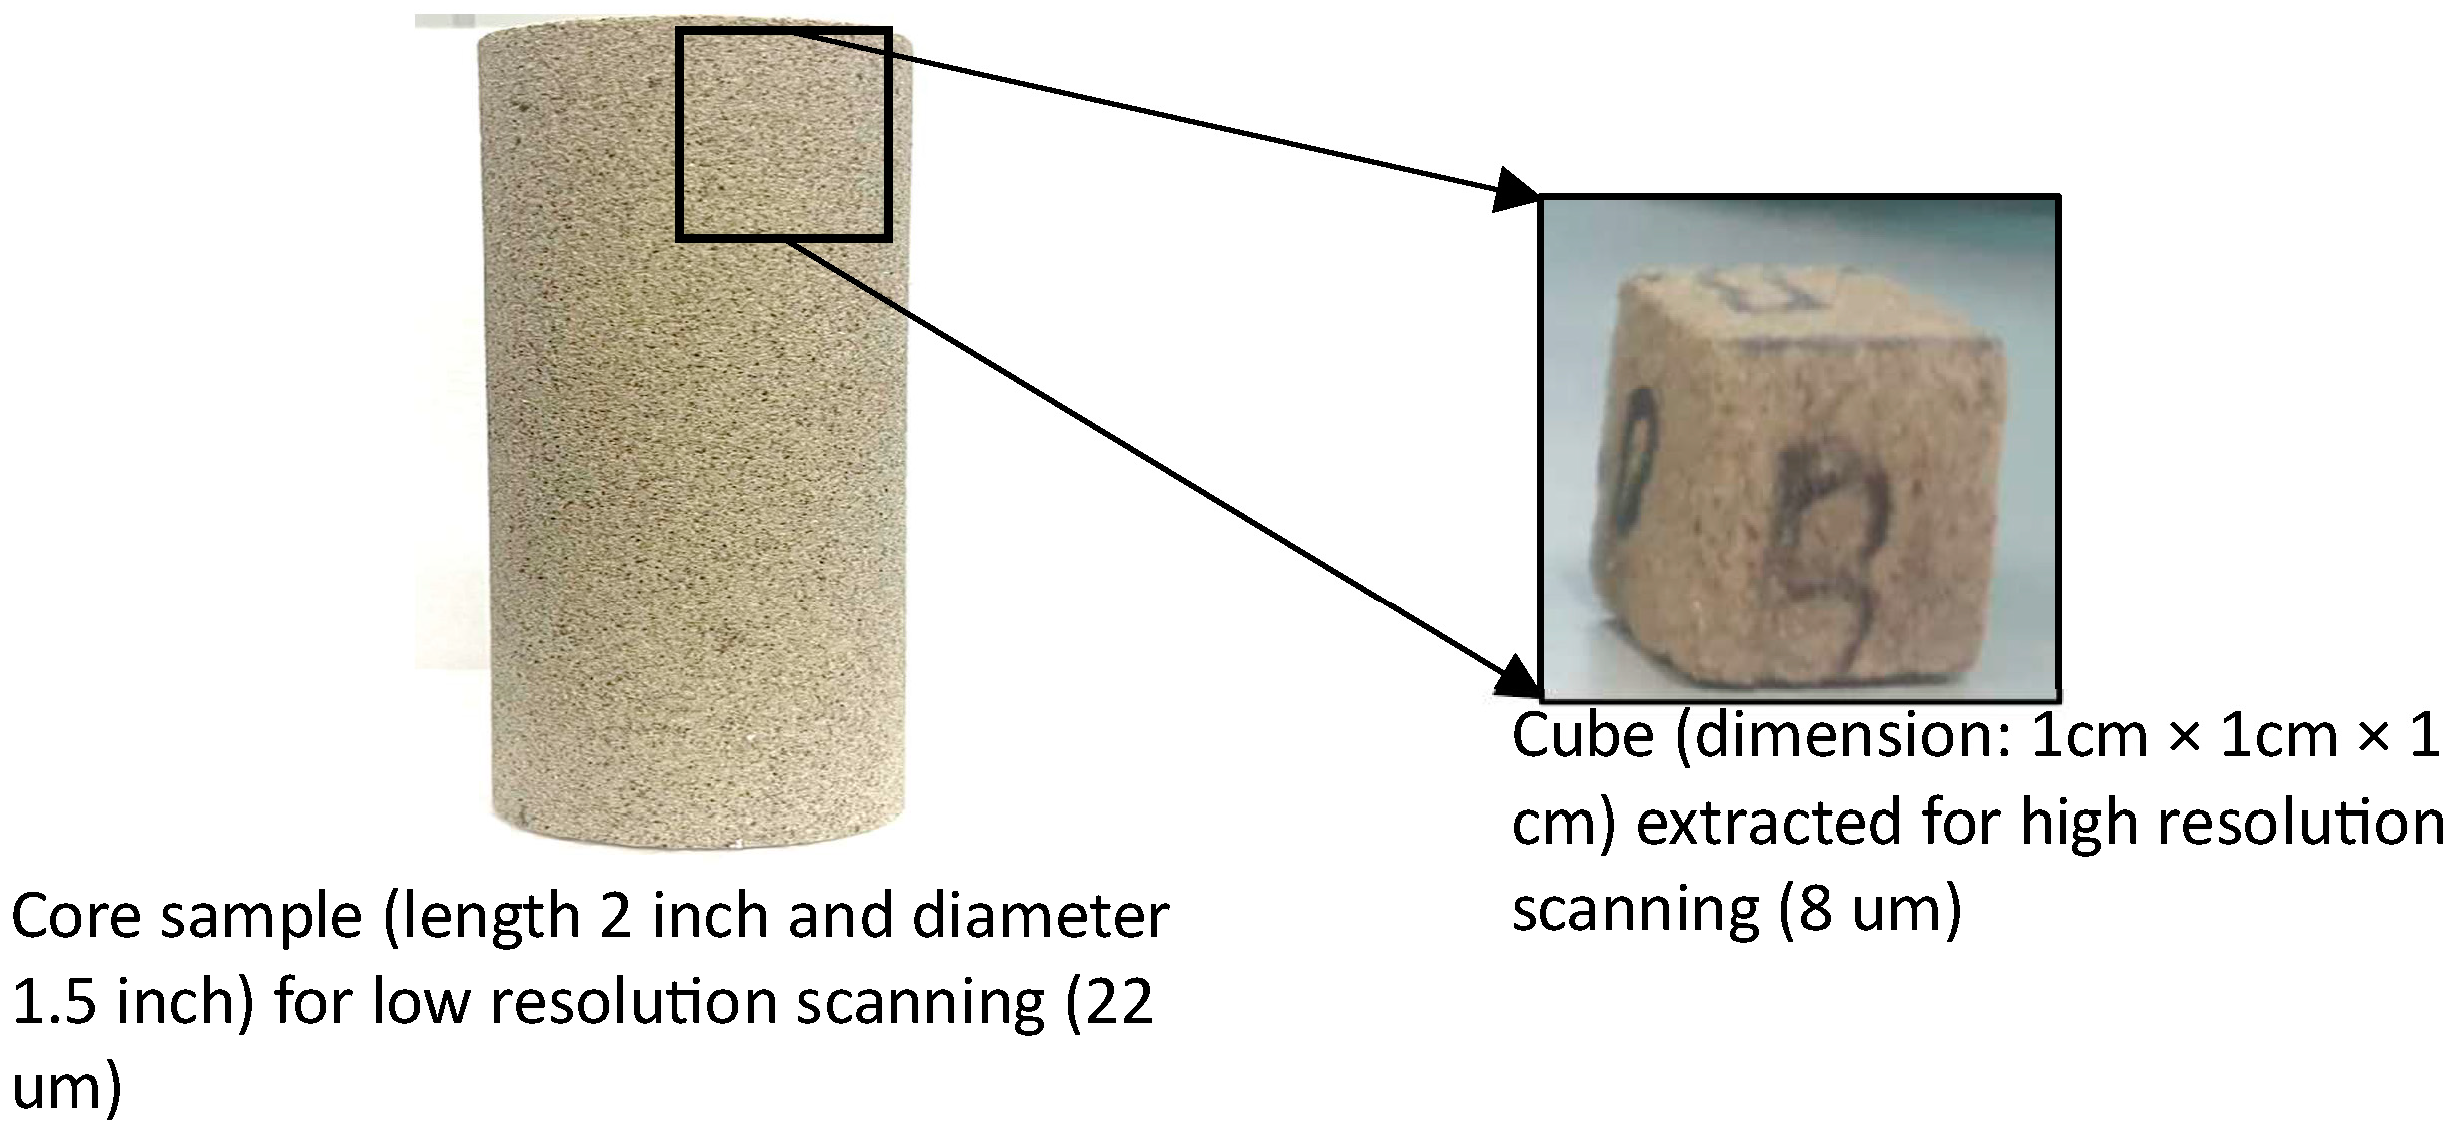
In this study, the samples are scanned at two different resolutions, a low resolution (22 µm) and a high resolution (8 µm) (Figure 5). Multi-resolution scanning is performed to map the heterogeneity within the rock samples by capturing detailed information about variations in properties such as porosity and permeability across different scales.

3.3. Methods Used

To precisely assess porosity using digital rock volume measurements, it is crucial to optimize existing methods and identify the most resilient approach that aligns with our specific dataset. The image processing and segmentation algorithms used in this paper are described below.
Contrast Adjustment: Image quality was enhanced through contrast adjustments using the Contrast Limited Adaptive Histogram Equalization (CLAHE) method. This technique divides the image into small, overlapping tiles and applies histogram equalization independently within each tile. CLAHE’s adaptive nature ensures localized contrast enhancements, preserving relative contrasts across different image regions. To prevent noise amplification in low-contrast areas, CLAHE employs a contrast limiting parameter, restricting the maximum enhancement per tile. Pixels exceeding this limit are redistributed to prevent excessive amplification. After equalization, tiles are merged to produce the final enhanced image [31,32].
Image Segmentation: After contrast adjustment, segmentation was performed to segregate the pore space from grains. The k-means unsupervised machine learning algorithm is used to segment the images into different elements and has proven to be an efficient method for image segmentation [25,33,34]. K-means is a clustering algorithm that assumes ‘k’ number of clusters based on the objective and initializes ‘k’ centroids, assigning one centroid to each cluster. It then groups elements into different clusters on the basis of their proximity to the nearest centroid. This distance is calculated using the Euclidean distance, defined in Equation (1) [35].
Z = i = 1 n j = 1 k x ( i ) C j 2
where x ( i ) C j 2 is the Euclidean distance between the data point x ( i ) .
K-means is an iterative procedure, where the centroids are recalculated as the mean of the elements in their respective clusters during each iteration, defined in Equation (2) [35]. This process continues until the element stops moving from one cluster to another or until a predefined convergence criteria is met.
C j = 1 n i = 1 n x j ( i )
where n is the number of data points in the jth cluster, and x j ( i ) is the ith data point.
Flow Simulations: The open-source Parallel Lattice Boltzmann Solver (Palabos) software (https://palabos.unige.ch/, accessed on 12 January 2023) [36], based on the Lattice Boltzmann method (LBM), was used to perform single-phase flow simulations and to determine the permeability of the samples. When performing LBM simulations using segmented rock images, the image is divided into a regular grid or lattice of cells. Each cell in the lattice corresponds to a pixel of the image, and a node is created at the center of every pixel. Within each cell, there are discrete velocity directions or vectors that are defined. These velocities represent the possible particle motion directions within the fluid. The number of discrete velocities and their specific directions depend on the chosen LBM variant. In this paper, the D3Q19 (three dimensions with 19 velocities) lattice arrangement (Figure 6) is used [37].
At each lattice node, there are distribution functions ‘ f x , t (also known as particle distribution functions at position x a n d t i m e   t ) associated with each velocity direction. These functions describe the probability of particles traveling in a particular direction with a particular velocity ‘ v within the cell. During each simulation time step, particles from one lattice node move to neighboring nodes, according to their distribution functions and velocity directions. This step represents the movement of particles within the fluid and is called a streaming step in LBM. After propagation, a collision step occurs, where particles within each cell interact with each other based on simplified collision rules, defined in Equation (3). These rules can be derived from the Boltzmann equation, which is a fundamental equation in kinetic theory that describes the behavior of particles in a gas [38].
f x + v t , t + t = f x , t f x , t f e q ( x , t ) τ
Here, f e q ( x , t ) is the equilibrium distribution function (dimensionless), τ is the relaxation time (seconds), v is velocity (m/s), and t is the time step (seconds).
In Equation (3), “ f x + v t , t + t = f x , t ” defines the streaming part, and f x , t f e q ( x , t ) τ defines the collision part [39].
From the distribution functions, macroscopic properties of the fluid, such as density and velocity, can be calculated for each cell in the lattice. By iterating through these steps over time, LBM simulates the behavior of a fluid.

3.4. Adopted Methodology

Once the rock samples were collected, they were prepared for laboratory measurements. This was followed by the MXCT scanning of the rock samples at two different resolutions, 22 µm and 8 µm. In the present work, two workflows were employed based on the sample mineralogy at the 22 µm resolution. The first involves samples with a minor or negligible amount of clay present in them and second involves samples with clay of a relatively higher amount, such that it affects the pore space. The first workflow involves an application of the CLAHE method for contrast adjustments, followed by image segmentation using the k-means algorithm (Figure 7).
In the second workflow, an additional step of edge detection is performed after contrast adjustment [25]. This edge detection method marks the boundaries of different pores and grains, thus helping in accurately segmenting the images. So, the second workflow first involves an application of the CLAHE contrast-adjustment procedure; followed by the edge detection method; and then, finally, segmentation using the k-means algorithm (Figure 8).
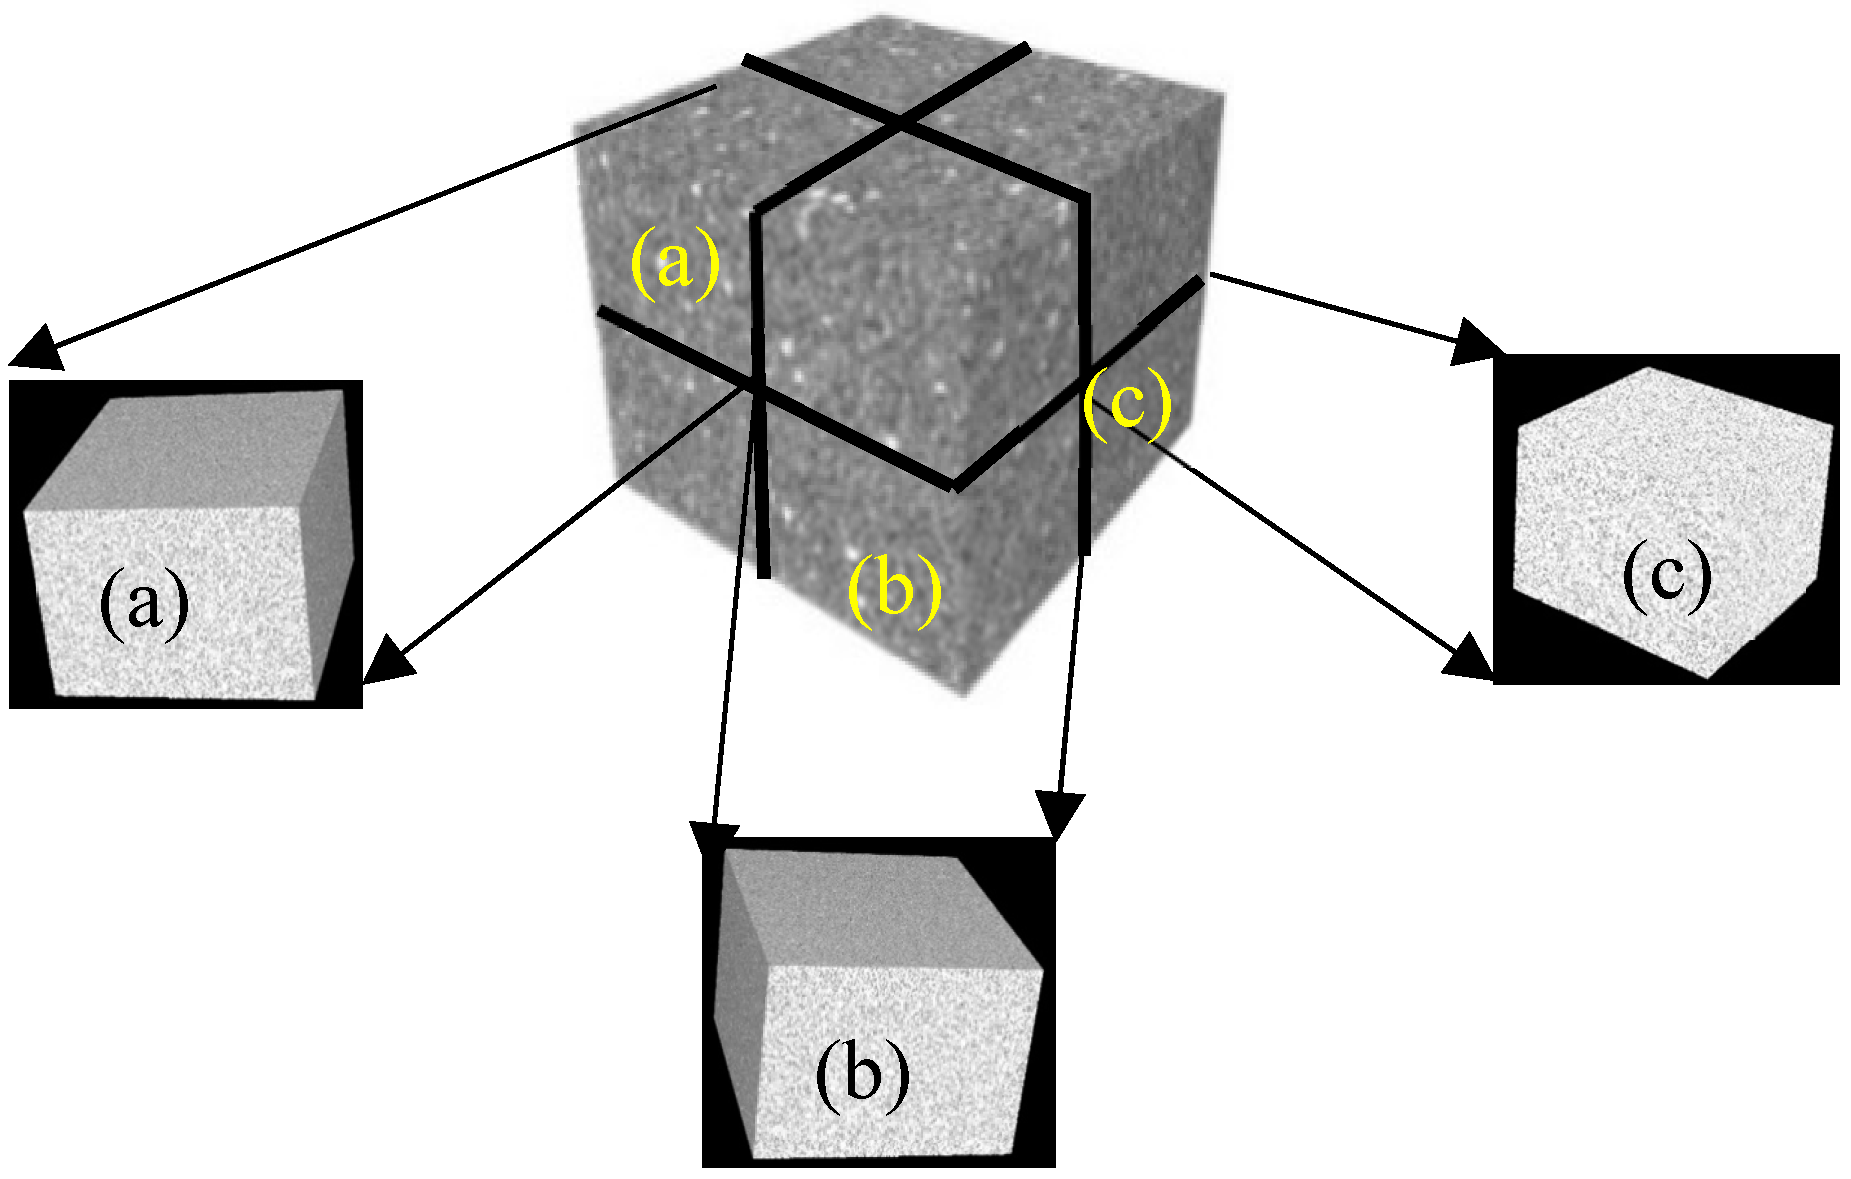
The segmented volume is then used to determine the porosity of the rock samples by calculating the total pore volume of the 3D digital volumes. These porosity values are then validated with the laboratory-measured values. This is followed by the extraction of different sub-volumes in order to determine a volume that is representative of the whole core (Figure 9). The porosity is determined for each of the sub-volumes, and LBM simulations are performed to determine the permeability of each sub-volume. These permeability values were also validated with laboratory-measured values and data from the published literature.
The entire workflow, from image processing to flow simulation, was first benchmarked on the samples in set 1, i.e., the analogous samples. Afterwards, the entire workflow was applied to the samples in set 2, i.e., the Lithuanian reservoir samples.

4. Results

4.1. Benchmarking on Analogous Formation Samples

To ensure the reliability and precision of our approach, we initiated our workflow by benchmarking it on analogous samples. The porosity values obtained for the set 1 samples were validated with the laboratory values, as shown in Table 4.
It can be observed from Table 4 that the k-means-derived porosity is comparable with the laboratory-measured values. In sample BB, the observed high error percentage can be attributed to the presence of the comparatively higher content of clay in that set of samples. Clay minerals have a tendency to occupy the pore space and reduce the overall porosity or rock. Additionally, the different mineral compositions and densities of clays compared to the surrounding matrix results in variations in the grayscale values in the scanned images. This contrast in the images makes it challenging to accurately quantify the pore space.
Initially, workflow 1 was implemented, which includes contrast adjustment followed by segmentation using the k-means algorithm on all samples. It was observed that the samples with a higher clay content tend to yield very low permeability values as compared to the laboratory-measured values. In response to this observation, workflow 2 was introduced. This refined approach incorporates an additional step: edge detection, following the initial contrast adjustment. This edge detection step serves to delineate the boundaries of pores and grains within the samples, thereby enhancing the reliability of the segmentation procedure. Subsequently, segmentation was performed. The results of workflow 2 indicate that for clay-rich samples, the permeability values align more closely with the laboratory measurements, providing a more accurate representation of the samples’ petrophysical properties.
This was followed by the extraction of sub-volumes and the estimation of porosity for each sub-volume. Subsequently, the LBM simulations were performed in each sub-volume, and their permeability was estimated (Table 5).
It can be observed from Table 5 that the permeability of each sub-volume and also the average permeability of each sample is comparable to the laboratory-derived value. When dealing with digital images, it is expected that values may differ from laboratory-measured values, which is attributed to the resolution at which the sample is scanned. The resolution is inversely related to the field of view. As the resolution increases, the field of view decreases. In this study, we compared the order of magnitude of permeability, and thus, the error percentage, calculated using the average value of all the sub-volumes, can be considered to be within the acceptable limit [40,41].

4.2. Property Estimation of Lithuanian Samples

Once we established the effectiveness and robustness of our workflow on analogous formation samples, we proceeded to apply this methodology to actual reservoir samples, thereby providing a well-validated foundation for our research into CO2 storage capabilities. The core samples from the Syderiai and Vaskai structures were utilized to estimate their petrophysical properties using their digital volumes obtained at two different resolutions (22 µm and 8 µm). The obtained porosity values are shown in Table 6 for both the samples at different resolutions.
The porosity values obtained from the k-means algorithm were compared with the laboratory values. It was observed that the samples scanned at a higher resolution (8 µm) resulted in higher porosity values as compared to those of the lower-resolution samples (22 µm). This difference was attributed to the presence of smaller pores that are not adequately captured at a lower resolution (22 µm). The finer features, including the smaller pores, are revealed at a higher resolution.
The segmented volumes of S3 and V4 were then used to extract different sub-volumes, each measuring 251 × 251 × 251 voxels in size. From each of the two resolutions, a total of 12 sub-volumes were extracted from each sample, resulting in a grand total of 24 sub-volumes from each sample. The objective of this sub-volume extraction was to understand the distribution of the pores within the digital volume comprehensively and to identify a sub-volume that most accurately represents the core (Figure 10). The average permeability value was computed to serve as a representative value for the core, shown in Table 7.
The average permeability value was subsequently compared with the laboratory-measured permeability value. An analysis of the results in Table 7 revealed that the error in permeability values was notably lower in the 8 μm-resolution volume when compared to the 22 μm-resolution samples. This reduction in error can be attributed to the enhanced level of detail achieved when scanning at a higher resolution (8 μm).

5. Discussion

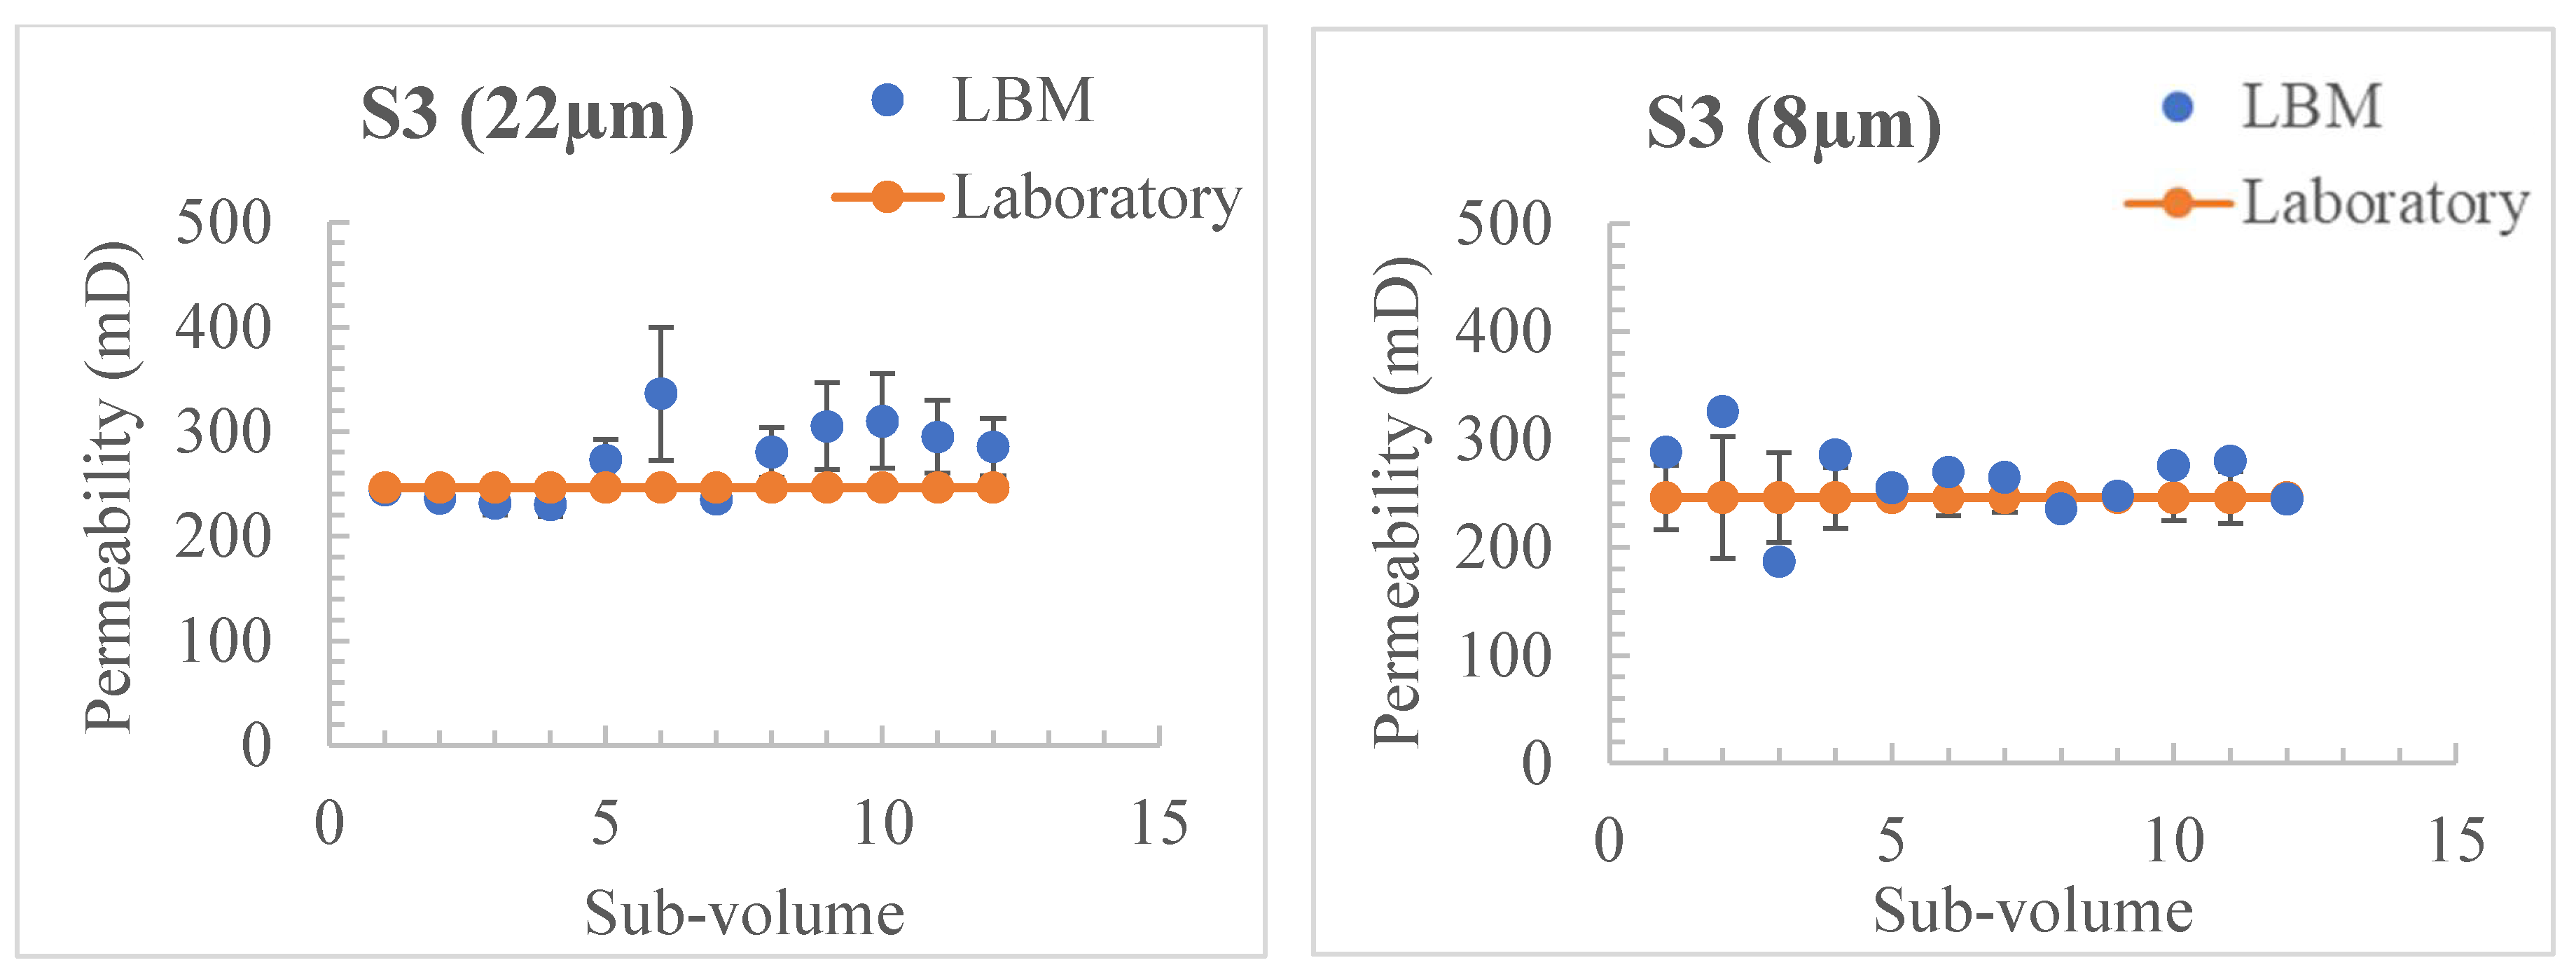
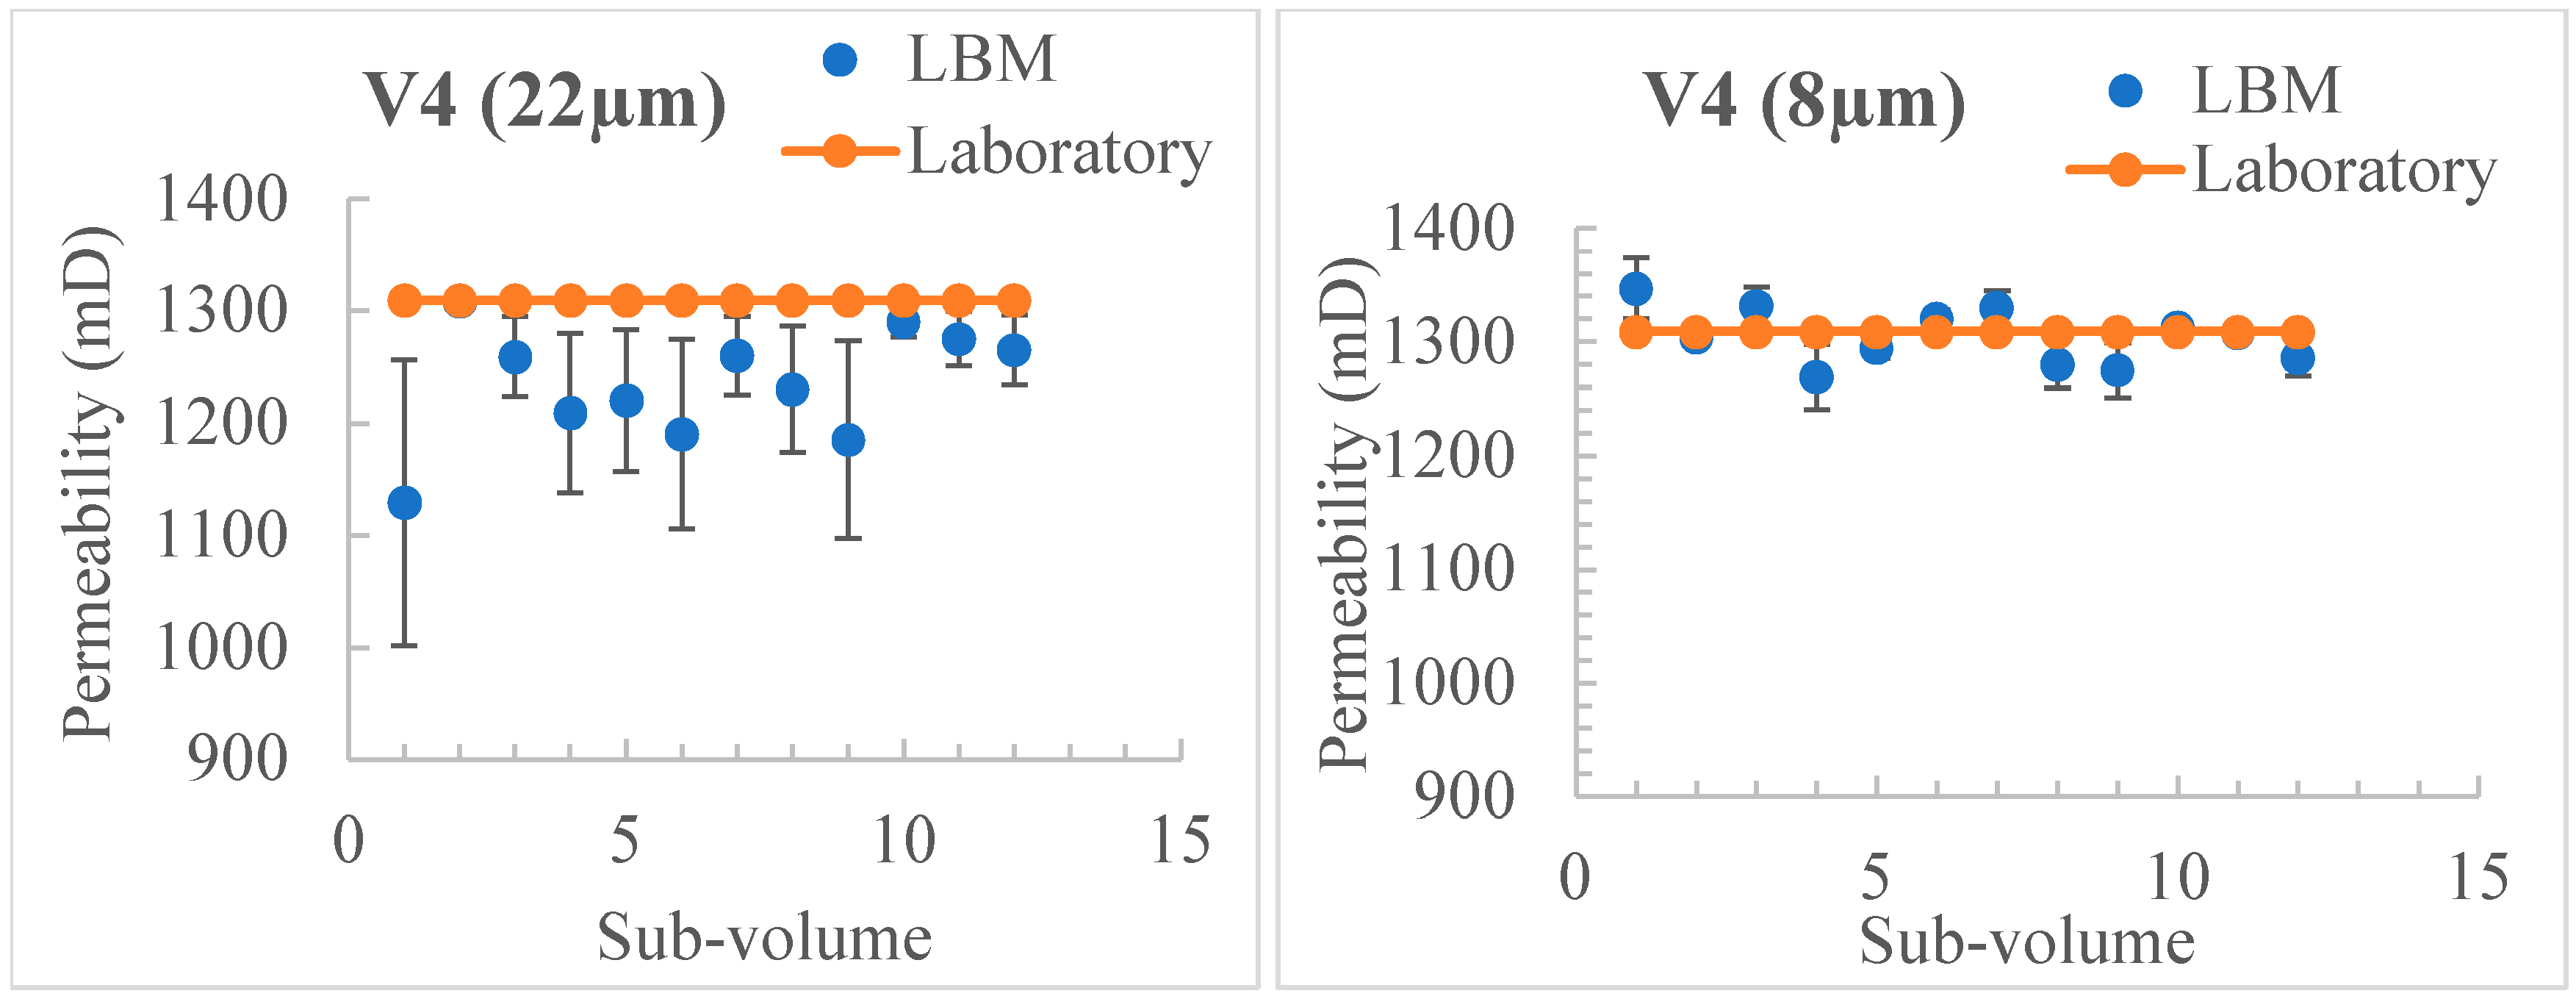
The permeability values obtained from each sub-volume are presented in Figure 11 and Figure 12. These figures illustrate the standard deviation of permeability derived from the LBM simulation method when compared to the laboratory-measured values.
It can be observed from Figure 11 and Figure 12 that the permeability values of the sub-volumes are relatively close to those of the laboratory values. This suggests that on average, the sub-volume measurements are in good agreement with the laboratory measurements, and the same can be observed in Table 6. The variations in sub-volume permeability indicate the natural variability in the rock samples, primarily attributed to the variation in pore size and distribution. These sub-volume measurements, while exhibiting some variability, are still within a reasonable range of the laboratory values.
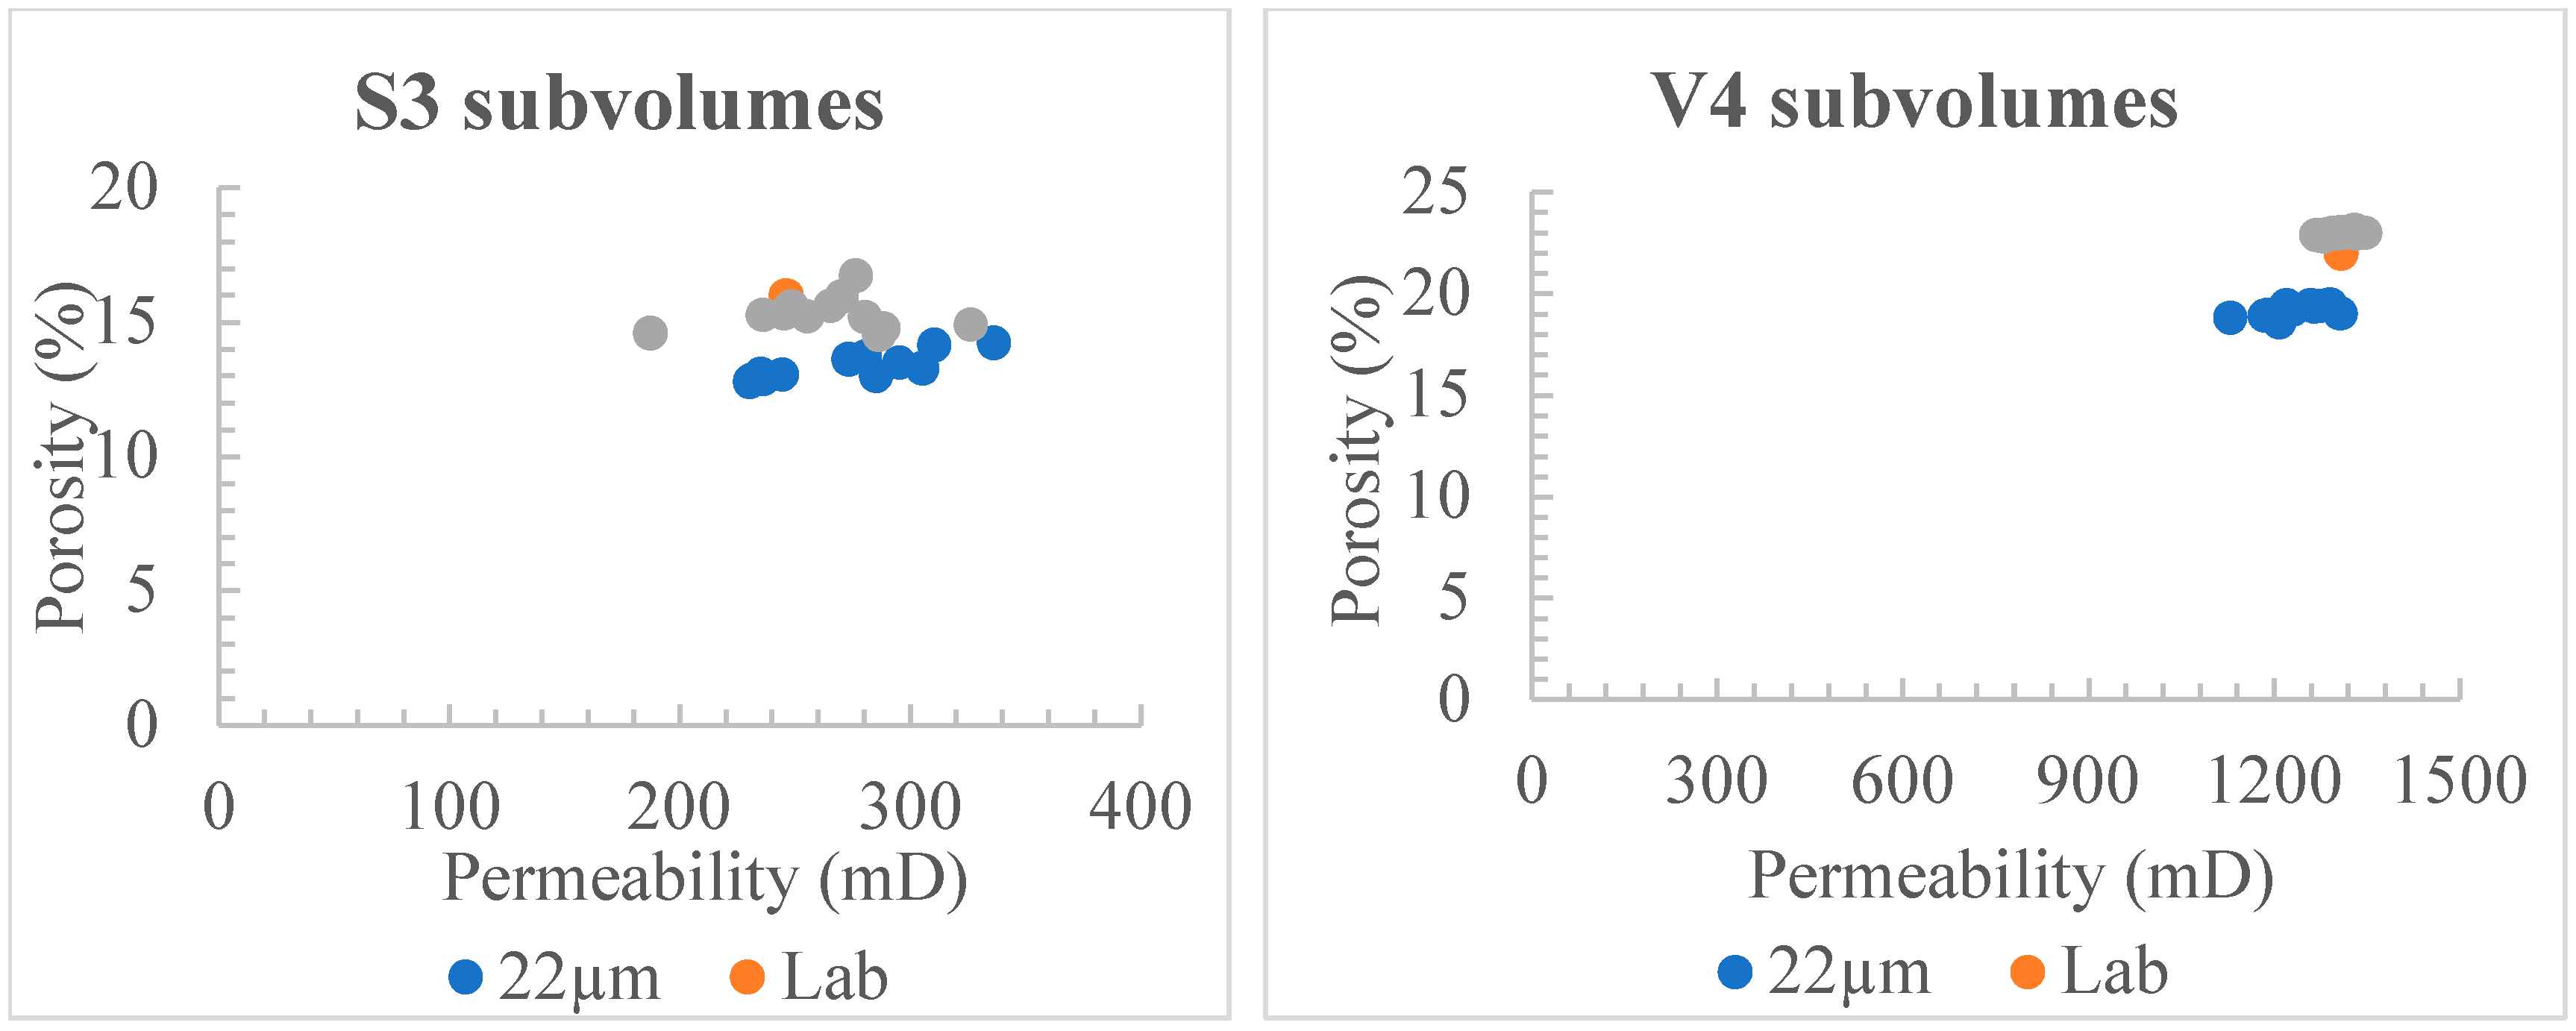
Porosity vs permeability plots are shown in Figure 13 for both the samples, showing variations for each sub-volume at different resolutions.
An observation of Figure 13 reveals that the high-resolution data yield more precise and consistent permeability measurements. This phenomenon can be attributed to the fact that in LBM simulations, the voxel size determines the computational mesh. A higher resolution results in a finer mesh, thus providing a better resolution of the boundaries between different phases within the porous medium. Consequently, it accurately captures small-scale features and irregularities.
At both resolutions, the porosity and permeability values closely align with the laboratory values. This consistency across sub-volumes implies that the rock sample exhibits relative uniformity in terms of its porosity and permeability characteristics.
The results highlight that the distribution of the petrophysical properties of the Lithuanian saline aquifers is uniform, reducing the uncertainties associated with the storage capacity estimation. An analysis of parameters at the pore scale helps to understand the processes occurring in the porous media [42,43,44]. This also facilitates uniform CO2 distribution and storage throughout the reservoir, maximizing storage efficiency. So, formations with well-sealed caprock layers can enhance the long-term security of CO2 storage by minimizing the risk of leakage or migration through preferential pathways.

6. Storage Capacity Estimation: A Review

This section provides a review of the storage capacity estimation of Lithuanian saline aquifers using numerical modeling [28]. This approach takes into consideration the inherent uncertainties in determining petrophysical reservoir properties, applying the uncertainty principle. Three distinct cases are defined: the mid case utilizes properties from the published literature [7], the low case assumes values 10% below the mid case, and the high case assigns values 30% higher than the mid case. These parameters are detailed in Table 8.
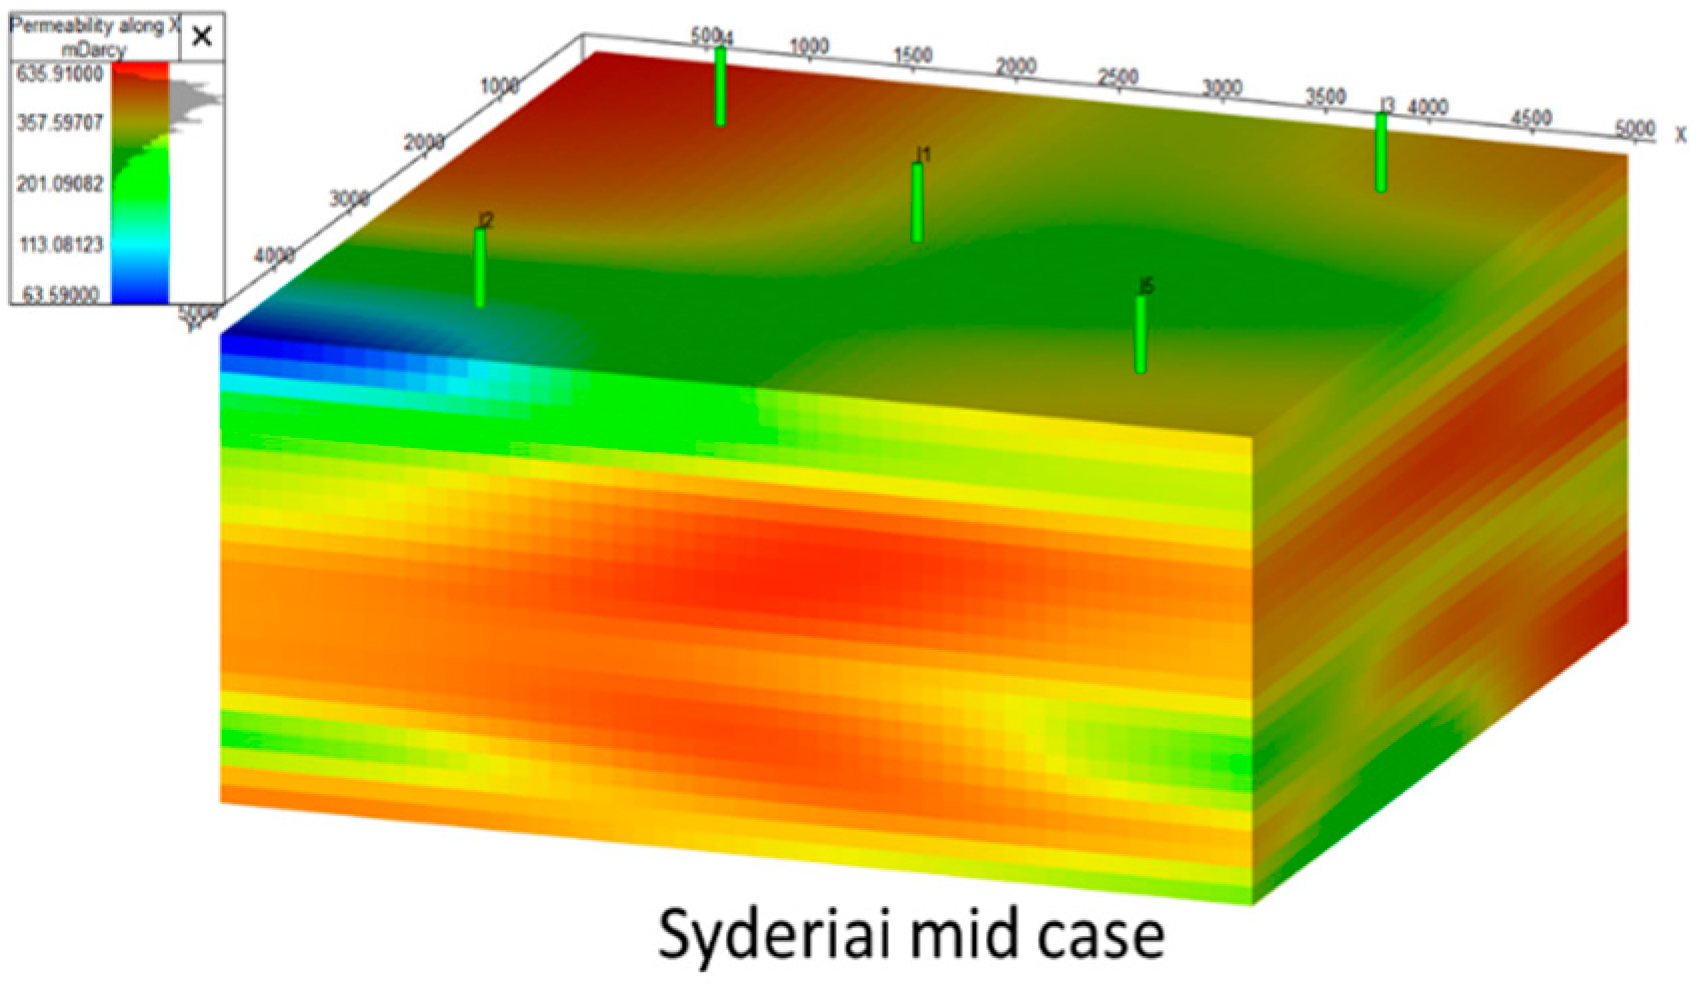
The injection process is conducted through five interconnected wells (Figure 14), with the injections constrained by the bottom hole pressure. Injection continues until a pressure differential of 80 bars is maintained between the reservoir and the well. Mechanistic models were developed to facilitate numerical simulations, covering various combinations of parameters. Consequently, a total of three simulations were conducted for each of the saline aquifers. The numerical simulations were executed using tNavigator, employing the CO2SOL modeling option, which accounts for CO2 solubility. The results yield a range of storage capacity estimates, spanning from the low-case to the high-case values, shown in Table 9 [27,28].
The results suggest that the saline aquifers exhibit the capability to store CO2 within a considerable capacity range. The total capacity spans from a minimum estimate of 79 Mt to a maximum of 338 Mt. In other words, these saline aquifers have the potential to sequester CO2 within this broad range, providing a substantial reservoir for carbon storage initiatives.
However, there are risks and challenges associated with the long-term storage of CO2, including the risk of leakage, the creation of cracks and fractures due to changes in mechanical properties during injection, and the impacts of the injection and storage process on the integrity of the caprock [27,28].

7. Conclusions

The present study explored the utility of digital rock volumes (DRVs) in evaluating a reservoir’s capacity for effective CO2 storage, focusing on two pivotal parameters: porosity and permeability. Recognizing that subsurface fluid storage and flow processes occur at the pore scale, this research used DRVs to examine the pore distribution and flow characteristics of Lithuanian deep saline aquifers (Syderiai and Vaskai) and similar formations. Notably, this work fills a gap in the literature by providing experimental data for a region where such information was previously unavailable. The findings show that employing a combination of algorithms for pore space segmentation achieves accuracy levels of 90–95% compared to laboratory measurements, validating the reliability of the DRV method. Clay-related image-segmentation challenges were addressed effectively within the workflow. This novel application of DRVs provides new insights into Lithuanian reservoirs, offering valuable data for CO2 storage efficiency and long-term reservoir stability.
This study also acknowledges scale-related limitations, particularly in heterogeneous samples, suggesting future work with diverse samples and tailored segmentation algorithms. Upscaling petrophysical properties and evaluating geo-mechanical and geochemical effects are recommended to support safe, long-term CO2 storage. This research offers a methodological framework for future CO2 storage studies in the Baltic Basin and similar regions, benefiting academic and industry applications.

Author Contributions

Conceptualization, S.M., R.S. and M.P.; methodology, S.M., P.M., R.S. and M.P.; software, S.M. and P.M.; validation, R.S. and M.P.; investigation, S.M. and M.P.; resources, S.M., R.S. and M.P.; data curation, S.M., R.S. and M.P.; all authors contributed equally to writing—original draft preparation; all authors contributed equally to writing—review and editing; visualization, S.M., P.M. and M.P.; supervision, R.S. and M.P.; project administration, M.P.; funding acquisition, S.M. and M.P. All authors read and agreed to the published version of the manuscript.

Funding

This research was supported by the Lithuanian Research Council Funding for postdoctoral research fund grant no. P-PD-22-022.

Institutional Review Board Statement

Not applicable.

Informed Consent Statement

Not applicable.

Data Availability Statement

The raw data supporting the conclusions of this article will be made available by the corresponding author on request.

Acknowledgments

The authors would like to acknowledge the Rock and Fluid Multiphysics Group, Department of Earth Sciences, IIT Roorkee, India, for facilitating the acquisition of computational resources and the Head Gemmologist and Director at the IIGJ-Research & Laboratories Centre, Jaipur, for their support in scanning the samples.

Conflicts of Interest

The authors declare no conflicts of interest.

References

  1. NASA. Global Climate Change: Vital Signs of the Planet. October 2024. Available online: https://climate.nasa.gov/vital-signs/carbon-dioxide/?intent=121 (accessed on 9 October 2024).
  2. Zhuge, X.; Hong, J.; Wang, C.; Wang, J.; Xia, H. Dynamic Evaluation of Sealing and Site Optimization for Underground Gas Storage in Depleted Gas Reserve: A Case Study. Appl. Sci. 2024, 14, 298. [Google Scholar] [CrossRef]
  3. Shogenova, A.; Sliaupa, S.; Shogenov, K.; Vaher, R.; Sliaupiene, R. Geological storage of CO2–prospects in the Baltic states. In Proceedings of the 69th EAGE Conference and Exhibition Incorporating SPE EUROPEC, cp–27, London, UK, 11–14 June 2007. [Google Scholar]
  4. Niemi, A.; Bear, J.; Bensabat, J. Geological Storage of CO2 in Deep Saline Formations; Springer: Berlin/Heidelberg, Germany, 2017; Volume 29. [Google Scholar]
  5. Šliaupa, S.; Šliaupiene, R. Prospects of geological storage of CO2 in Lithuania. In Proceedings of the Baltic Carbon Forum, Online, 15 October 2021. [Google Scholar]
  6. Pal, M.; Karaliute, V.; Malik, S. Exploring the potential of carbon capture, utilization, and storage in Baltic Sea region countries: A review of CCUS patents from 2000 to 2022. Processes 2023, 11, 605. [Google Scholar] [CrossRef]
  7. Šliaupiene, R.; Šliaupa, S. Prospects for CO2 geological storage in deep saline aquifers of Lithuania and adjacent territories. Geologija 2011, 53, 17–19. [Google Scholar] [CrossRef]
  8. Anthonsen, K.; Christensen, N. EU Geological CO2 Storage Summary. In Geological Survey of Denmark and Greenland for Clean Air Task Force; Tech. Rep.; Geological Survey of Denmark and Greenland; Danish Ministry of Climate Energy and Utilities: Copenhagen, Denmark, 2021. [Google Scholar]
  9. Shogenova, A.; Šliaupa, S.; Shogenov, K.; Šliaupiene, R.; Pomeranceva, R.; Vaher, R.; Uibu, M.; Kuusik, R. Possibilities for geological storage and mineral trapping of industrial CO2 emissions in the Baltic region. Energy Procedia 2009, 1, 2753–2760. [Google Scholar] [CrossRef]
  10. Šliaupa, S.; Michelevičius, D.; Šliaupiene, R.; Liugas, J. Assessment of the potential for CO2 storage and utilization in the fractured and porous reservoir of the Cambrian sandstones in West Lithuania’s Baltic Basin. Minerals 2024, 14, 1112. [Google Scholar] [CrossRef]
  11. Ali, M.; Jha, N.K.; Pal, N.; Keshavarz, A.; Hoteit, H.; Sarmadivaleh, M. Recent advances in carbon dioxide geological storage, experimental procedures, influencing parameters, and future outlook. Earth-Sci. Rev. 2022, 225, 103895. [Google Scholar] [CrossRef]
  12. Kumar, N.; Verma, A.; Ahmad, T.; Sahu, R.K.; Mandal, A.; Mubashir, M.; Ali, M.; Pal, N. Carbon capture and sequestration technology for environmental remediation: A CO2 utilization approach through EOR. Geoenergy Sci. Eng. 2024, 234, 212619. [Google Scholar] [CrossRef]
  13. Izadpanahi, A.; Blunt, M.J.; Kumar, N.; Ali, M.; Tassinari, C.C.G.; Sampaio, M.A. A review of carbon storage in saline aquifers: Mechanisms, prerequisites, and key considerations. Fuel 2024, 369, 131744. [Google Scholar] [CrossRef]
  14. Bashir, A.; Ali, M.; Patil, S.; Aljawad, M.S.; Mahmoud, M.; Al-Shehri, D.; Hoteit, H.; Kamal, M.S. Comprehensive review of CO2 geological storage: Exploring principles, mechanisms, and prospects. Earth-Sci. Rev. 2024, 249, 104672. [Google Scholar] [CrossRef]
  15. Hosseini, M.; Ali, M.; Fahimpour, J.; Keshavarz, A.; Iglauer, S. Energy storage in carbonate and basalt reservoirs: Investigating secondary imbibition in H2 and CO2 systems. Adv. Geo-Energy Res. 2024, 11, 132–140. [Google Scholar] [CrossRef]
  16. Baban, A.; Hosseini, M.; Keshavarz, A.; Ali, M.; Hoteit, H.; Amin, R.; Iglauer, S. Robust NMR Examination of the Three-Phase Flow Dynamics of Carbon Geosequestration Combined with Enhanced Oil Recovery in Carbonate Formations. Energy Fuels 2024, 38, 2167–2176. [Google Scholar] [CrossRef]
  17. Al-Khdheeawi, E.A.; Mahdi, D.S.; Ali, M.; Iglauer, S.; Barifcani, A. Reservoir Scale Porosity-Permeability Evolution in Sandstone due to CO2 Geological Storage. In Proceedings of the 15th International Conference on Greenhouse Gas Control Technologies, Abu Dhabi, United Arab Emirates, 15–18 March 2021. [Google Scholar]
  18. Liu, Y.; Wang, H.; Shen, Z.; Song, Y. Estimation of CO2 storage capacity in porous media by using X-ray micro-ct. Energy Procedia 2013, 37, 5201–5208. [Google Scholar] [CrossRef]
  19. Soong, Y.; Howard, B.H.; Hedges, S.W.; Haljasmaa, I.; Warzinski, R.P.; Irdi, G.; McLendon, T.R. CO2 sequestration in saline formation. Aerosol Air Qual. Res. 2014, 14, 522–532. [Google Scholar] [CrossRef]
  20. Han, J.; Han, S.; Kang, D.H.; Kim, Y.; Lee, J.; Lee, Y. Application of digital rock physics using X-ray CT for study on alteration of macropore properties by CO2 EOR in a carbonate oil reservoir. J. Pet. Sci. Eng. 2020, 189, 107009. [Google Scholar] [CrossRef]
  21. Aradóttir, E.; Sonnenthal, E.; Björnsson, G.; Jónsson, H. Multidimensional reactive transport modeling of CO2 mineral sequestration in basalts at the hellisheidi geothermal field, iceland. Int. J. Greenh. Gas Control. 2012, 9, 24–40. [Google Scholar] [CrossRef]
  22. Callow, B.; Falcon-Suarez, I.; Ahmed, S.; Matter, J. Assessing the carbon sequestration potential of basalt using X-ray micro-ct and rock mechanics. Int. J. Greenh. Gas Control. 2018, 70, 146–156. [Google Scholar] [CrossRef]
  23. Haselton, T. Minijos nafta clean energy project. In Proceedings of the Baltic Carbon Forum, Tallinn, Estonia, 22–23 October 2019. [Google Scholar]
  24. Gan, M.; Zhang, L.; Miao, X.; Oladyshkin, S.; Cheng, X.; Wang, Y.; Shu, Y.; Su, X.; Li, X. Application of computed tomography (CT) in geologic CO2 utilization and storage research: A critical review. J. Nat. Gas Sci. Eng. 2020, 83, 103591. [Google Scholar] [CrossRef]
  25. Sharma, R.; Malik, S.; Shettar, A.S. Sensitivity of Digital Rock Method for Pore-Space Estimation to Heterogeneity in Carbonate Formations. SPE J. 2021, 26, 2914–2927. [Google Scholar] [CrossRef]
  26. Malik, S.; Makauskas, P.; Sharma, R.; Pal, M. Exploring CO2 storage potential in Lithuanian deep saline aquifers using digital rock volumes: A machine learning guided approach. In Proceedings of the Baltic Carbon Forum, Riga, Latvia, 12–13 October 2023; Volume 2, pp. 13–14. [Google Scholar] [CrossRef]
  27. Pal, M.; Malik, S.; Karaliute, V.; Makauskas, P.; Sharma, R. Assessing the feasibility of carbon capture and storage potential in Lithuanian geological formations: A simulation-based assessment. In Proceedings of the 84th European Association of Geoscientists & Engineers (EAGE) Annual Conference & Exhibition, Vienna, Austria, 5–8 June 2023; Volume 1, pp. 1–5. [Google Scholar]
  28. Malik, S.; Makauskas, P.; Karaliute, V.; Pal, M.; Sharma, R. Assessing the geological storage potential of CO2 in Baltic basin: A case study of Lithuanian hydrocarbon and deep saline reservoirs. Int. J. Greenh. Gas Control. 2024, 133, 104097. [Google Scholar] [CrossRef]
  29. Šliaupa, S.; Satkunas, J.; Šliaupiene, R. Prospects of geological disposal of CO2 in lithuania. Geologija 2005, 51, 20–31. [Google Scholar]
  30. API. Recommended Practices for Core Analysis, 2nd ed.; API: Washington, DC, USA, 1998. [Google Scholar]
  31. Althaf, S.; Basha, J.; Shaik, M. A study on histogram equalization techniques for underwater image enhancement. Int. J. Sci. Res. Comput. Sci. Eng. Inf. Technol. 2017, 2, 210–212. [Google Scholar]
  32. Shaik, M.A.; Meena, P.; Basha, S.J.; Lavanya, N. Color Balance for Underwater Image Enhancement. Int. J. Res. Appl. Sci. Eng. Technol. 2018, 6, 571–581. [Google Scholar] [CrossRef]
  33. Purswani, P.; Karpyn, Z.T.; Enab, K.; Xue, Y.; Huang, X. Evaluation of image segmentation techniques for image-based rock property estimation. J. Pet. Sci. Eng. 2020, 195, 107890. [Google Scholar] [CrossRef]
  34. Deeparani, K.; Sudhakar, P. Efficient image segmentation and implementation of K-means clustering. Mater. Today Proc. 2021, 45, 8076–8079. [Google Scholar] [CrossRef]
  35. Cortina-Januchs, M.; Quintanilla-Dominguez, J.; Vega-Corona, A.; Tarquis, A.; Andina, D. Detection of pore space in CT soil images using artificial neural networks. Biogeosciences 2011, 8, 279–288. [Google Scholar] [CrossRef]
  36. Latt, J.; Malaspinas, O.; Kontaxakis, D.; Parmigiani, A.; Lagrava, D.; Brogi, F.; Belgacem, M.B.; Thorimbert, Y.; Leclaire, S.; Li, S.; et al. Palabos: Parallel Lattice Boltzmann Solver. Comput. Math. Appl. 2021, 81, 334–350. [Google Scholar] [CrossRef]
  37. Timm, K.; Kusumaatmaja, H.; Kuzmin, A.; Shardt, O.; Silva, G.; Viggen, E. The lattice Boltzmann method: Principles and Practice; Springer International Publishing AG: Cham, Switzerland, 2016. [Google Scholar]
  38. Mohamad, A. Lattice Boltzmann Method; Springer: Berlin/Heidelberg, Germany, 2011; Volume 70. [Google Scholar]
  39. Sukop, M.C.; Thorne, D.T. Lattice Boltzmann Modeling: An Introduction for Geoscientists and Engineers; Springer: Berlin/Heidelberg, Germany, 2006. [Google Scholar]
  40. Dvorkin, J.; Walls, J.; Tutuncu, A.; Prasad, M.; Nur, A.; Mese, A.I. Rock property determination using digital rock physics. In SEG Technical Program, Expanded Abstract; Society of Exploration Geophysicists (SEG): Houston, TX, USA, 2023. [Google Scholar] [CrossRef]
  41. Dvorkin, J.; Derzhi, N.; Diaz, E.; Fang, Q. Relevance of computational rock physics. Geophysics 2011, 76, E141–E153. [Google Scholar] [CrossRef]
  42. Wray, M.; Amrouche, F.; Aiouache, F. Modeling CO2 Adsorption in a Thin Discrete Packing. Ind. Eng. Chem. Res. 2024, 63, 7321–7334. [Google Scholar] [CrossRef] [PubMed] [PubMed Central]
  43. Purswani, P.; Guiltinan, E.J.; Chen, Y.; Kang, Q.; Mehana, M.Z.; Neil, C.W.; Germann, T.C.; Gross, M.R. Pore-scale modeling of carbon dioxide and hydrogen transport during geologic gas storage. Geophys. Res. Lett. 2024, 51, e2024GL109216. [Google Scholar] [CrossRef]
  44. Alhosani, A.; Lin, Q.; Scanziani, A.; Andrews, E.; Zhang, K.; Bijeljic, B.; Blunt, M.J. Pore-scale characterization of carbon dioxide storage at immiscible and near-miscible conditions in altered-wettability reservoir rocks. Int. J. Greenh. Gas Control 2021, 105, 103232. [Google Scholar] [CrossRef]
Figure 1. Locations of CO2 emission sources, hydrocarbon fields, and saline aquifers in Baltic countries.
Applsci 14 10826 g001
Figure 2. Location of saline aquifers of Lithuania, Syderiai and Vaskai. The depth contours indicate the top depth of the Cambrian structures.
Applsci 14 10826 g002
Figure 3. Set 1 of the rock samples.
Applsci 14 10826 g003
Figure 4. Set 2 of the rock samples.
Applsci 14 10826 g004
Figure 5. The samples used for low- and high-resolution scanning.
Applsci 14 10826 g005
Figure 6. D3Q19 lattice arrangement.
Applsci 14 10826 g006
Figure 7. First segmentation workflow applied to rock samples.
Applsci 14 10826 g007
Figure 8. Second workflow applied to samples with comparatively higher clay content.
Applsci 14 10826 g008
Figure 9. (ac) Illustration of sub-volume extraction for fluid flow simulations.
Applsci 14 10826 g009
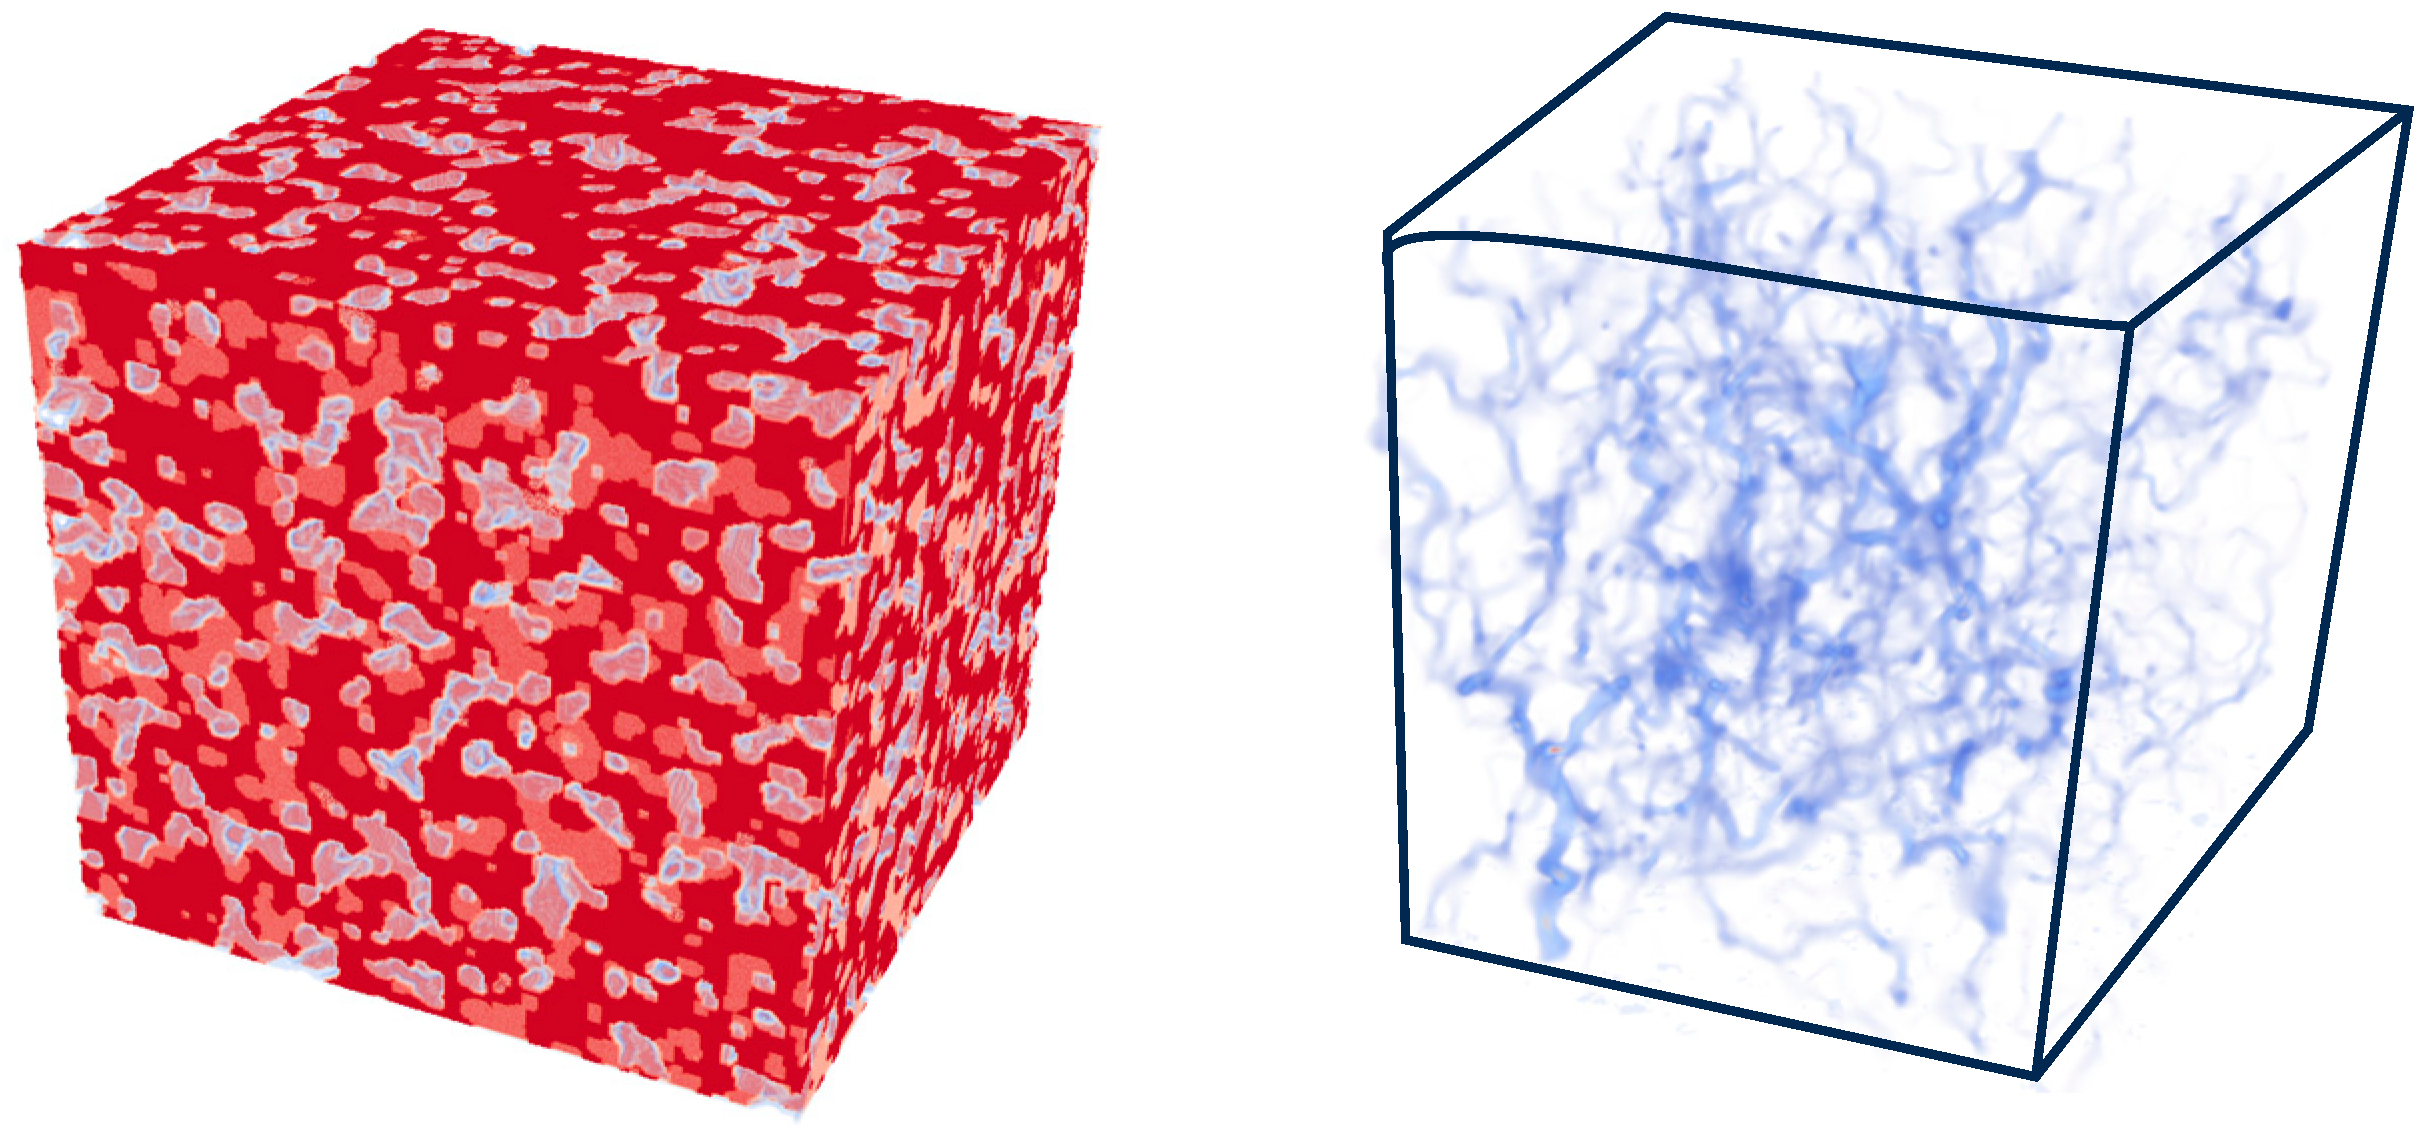
Figure 10. Segmented 3D digital sub-volume (left) and corresponding simulated flow volume (right) for sample S3. In the segmented volume (left), the solid matrix is represented in a dark (red) color, the pore space is depicted in a light (white) color, and the pink color shows the different mineral phases. In the simulated volume (right), the flow of fluid through the pore space is indicated by blue lines.
Applsci 14 10826 g010
Figure 11. Permeability values for each sub-volume of sample S3 at 22 µm (left) and 8 µm (right) resolutions. The error bars represent the deviation of permeability for each sub-volume from the laboratory-derived values.
Applsci 14 10826 g011
Figure 12. Permeability values for each sub-volume of sample V4 at 22 µm (left) and 8 µm (right) resolutions. The error bars represent the deviation of permeability for each sub-volume from the laboratory-derived values.
Applsci 14 10826 g012
Figure 13. Porosity vs permeability plots comparing sub-volumes at 22 µm and 8 µm with laboratory values for samples S3 (left) and V4 (right).
Applsci 14 10826 g013
Figure 14. Mechanistic models for mid-case permeability distribution for Syderiai.
Applsci 14 10826 g014
Table 1. A review of the current advancements in CCS studies.
Study Type/Sample TypeStudy ObjectivesKey FindingsReferences
Review studyAddressed the impact of organic materials on the containment and security of CO2 storageFactors such as wettability and the presence of organic materials can impact the long-term safety of CO2.[11]
Review studyReview study of CO2 utilization through enhanced oil recovery (EOR) approachThis review emphasized understanding the rock–fluid interactions and wettability behaviors in EOR studies.[12]
Review studyReview of mechanism, requirements, and key aspects of CO2 storageThis study suggested ways to improve the efficiency and storage capability of reservoirs, such as, to increase trapping, co-injection can be performed, including the injection of nano particles and microbes and to increase injectivity, hydraulic fracturing can be conducted.[13]
Review studyReview of mechanism and prospects of CO2 storageThis study identified factors, such as the depth of a reservoir, the trapping mechanism, the absence of faults and fractures, and the utilization of microbes, for increasing the efficiency of CO2 storage.[14]
Carbonate and basalt reservoirsAssessed secondary imbibition dynamics under varying pressure and temperature levels for underground hydrogen storage (UHS) and CO2 storageThis study found that an increase in the lateral secondary imbibition of water increases the gas trapping, which is useful for CO2 storage but can be challenging for UHS due to the poor recovery of hydrogen. Low secondary imbibition in basalts makes them more suitable for UHS than CO2 storage.[15]
Carbonate reservoirsTo understand the pore scale physics of three phase flows using Nuclear Magnetic Resonance (NMR) measurements with coreflooding experiments for EOR studiesThese authors observed that 16% of CO2 was trapped, and 71% of oil was recovered, with 34% of this occurring during CO2 flooding and 37% during subsequent water flooding.[16]
Sandstone reservoirStudied the impact of mineral interactions on porosity–permeability evolution during CO2 storageThese authors performed simulations using TOUGHREACT and observed an increase in porosity and permeability during the storage period, impacting the storage capacity of the reservoir.[17]
Glass bead bed: quartz beads filled and packed tightly in a vesselStorage capacity assessment using core flooding and micro X-ray computed tomography (MXCT) imagesThese authors found that downward core flooding increased the trapping capacity of CO2 compared to an upward injection. MXCT images captured the CO2 distribution.[18]
Mount Simon sandstone and Illinois basin To understand geochemical changes due to CO2 injectionDigital volumes were analyzed pre- and post-flooding, shedding light on mineral dissolution and precipitation as parameters affecting the permeability of the samples after 6 months of exposure.[19]
Carbonate rockStudied changes in rock and flow properties due to CO2 injectionMXCT and MICP data were used to study the changes in the pore network, affecting the injectivity of CO2.[20]
Basaltic reservoir of the CarbFix site in Iceland Evaluated storage capacity using MXCT images alongside hydro-mechanical experimentsThis study estimated the CO2 storage capacity of 0.33 Gt of CO2 at the CarbFix site (Iceland) by multiplying values of the connected porosity and reactive surface area obtained from MXCT data by the volume of the basalt formation and mineral carbonation fixation per unit surface area from [21].[22]
Gargzdai depleted oil zone, LithuaniaField trial of CO2 injection in Lithuanian reservoirsThese authors injected 1000 tons of CO2 into the producing zone of the Degliai-1 reservoir, resulting in the permanent storing of CO2 and the production of oil. The success of this field trial indicates that CO2 can be used to enhance the hydrocarbon recovery of Lithuanian reservoirs.[23]
Saline aquifer and depleted hydrocarbon zoneStorage capacity estimation of Lithuanian reservoirsThis study estimated the CO2 storage capacity of Lithuanian reservoirs, showing maximum potential in the Syderiai deep saline aquifer.[7]
Table 2. Laboratory-measured porosity and permeability values of the rock samples of set 1.
Sample NameFormation TypePorosity (%)Permeability (mD)
BBUpper Devonian21.60275
SSPaleozoic19.9062
LPaleozoic20.22327
Table 3. Petrophysical properties of the rock samples of set 2.
Reservoir TypeReservoir NameSample NamePorosity (%)Permeability (mD)
Deep saline aquiferSyderiaiS316246
VaskaiV4221309
Table 4. Comparison of the porosity values obtained using the k-means algorithm with the laboratory-measured values (sample size: 940 × 940 × 1014 voxels).
Sample NamePorosity Using K-Means (%)Laboratory (%)Error (%)
BB19.9821.67.50
SS19.7119.91.00
L19.9920.221.11
Table 5. Comparison of permeability obtained for each sub-volume (size: 201 × 201 × 201 voxels) using LBM with laboratory-measured values.
SampleSub-VolumesPermeability Using LBM (mD)Average Permeability (mD)Laboratory (mD)Error (%)
BB128231727515
2307
3360
4320
SS183916247
2105
3100
477
L144537032713
2334
3370
4330
Table 6. Comparison of the obtained porosity values obtained from k-means with laboratory-measured values (sample size: 1020 × 1020 × 1014 voxels).
SampleSample TypePorosity Using K-Means Algorithm (%)Laboratory-Measured Porosity (%)Porosity Error (%)
S3Core (22 µm)14.381610
Cube (8 µm)15.175
V4Core (22 µm)19.742210
Cube (8 µm)234.5
Table 7. A comparison of the average permeability obtained from 12 sub-volumes of each sample (size: 251 × 251 × 251 voxels), scanned at two different resolutions with laboratory-measured values.
SampleSample TypeAverage Porosity of Sub-Volumes (%)Average Permeability of Sub-Volumes (mD)Laboratory-Measured Permeability (mD)Permeability Error (%)
S3Core (22 µm)13.3527224611.0
Cube (8 µm)15.32647.3
V4Core (22 µm)19.2123513095.6
Cube (8 µm)22.913050.3
Table 8. Uncertainty ranges used for storage capacity estimation for the Syderiai and Vaskai saline aquifers of Lithuania.
SyderiaiVaskai
LowMidHighLowMidHigh
Porosity0.1440.160.2080.2070.230.299
Perm X360400520252280364
Perm Y360400520252280364
Perm Z119.7133172.98493.33121.33
Thickness51.35774.151.35774.1
NTG0.6750.750.9750.450.50.65
AREA23.42633.811.0712.315.99
Table 9. CO2 storage potential of the Syderiai and Vaskai saline aquifers for low, mid, and high cases, after 30 years of injection.
ReservoirLowMidHigh
Syderiai (Mt)5480232
Vaskai (Mt)2537106
Disclaimer/Publisher’s Note: The statements, opinions and data contained in all publications are solely those of the individual author(s) and contributor(s) and not of MDPI and/or the editor(s). MDPI and/or the editor(s) disclaim responsibility for any injury to people or property resulting from any ideas, methods, instructions or products referred to in the content.