
The Environmental Stake of Bitcoin Mining: Present and Future Challenges

 , ,
, ,  ,
,  ,
,  and
and
Abstract
1. Introduction
1.1. Climate Change and Cryptocurrencies
1.2. Reaching Net Zero and Carbon Capturing
2. Materials and Methods
2.1. Goal and Scope Definition
2.2. Life Cycle Inventory
2.2.1. Cryptocurrencies
2.2.2. Electricity
2.2.3. Electricity for Hashrate
2.2.4. Heat Recovered from Mining
2.2.5. CO2 Sorbents
2.3. Life Cycle Impact Assessment
Breakeven Electricity
Hypothesis 1 (H1)
Hypothesis 2 (H2)
Hypothesis 3 (H3)
Hypothesis 4 (H4)
3. Results and Discussion
3.1. Carbon Emission Estimations
- (1)
- The GWP estimated for the baseline scenario of 51.7 Mt CO2 eq for 2022 is more than double with respect to the predictions as of November 2018 (22.0–22.9 Mt CO2) by Stoll et al. [34], in agreement with the increase in the yearly electricity consumption, which moves from 45.8 TWh [34] to 95.5 TWh in 2022 (from ref. [24]) considered in this study.
- (2)
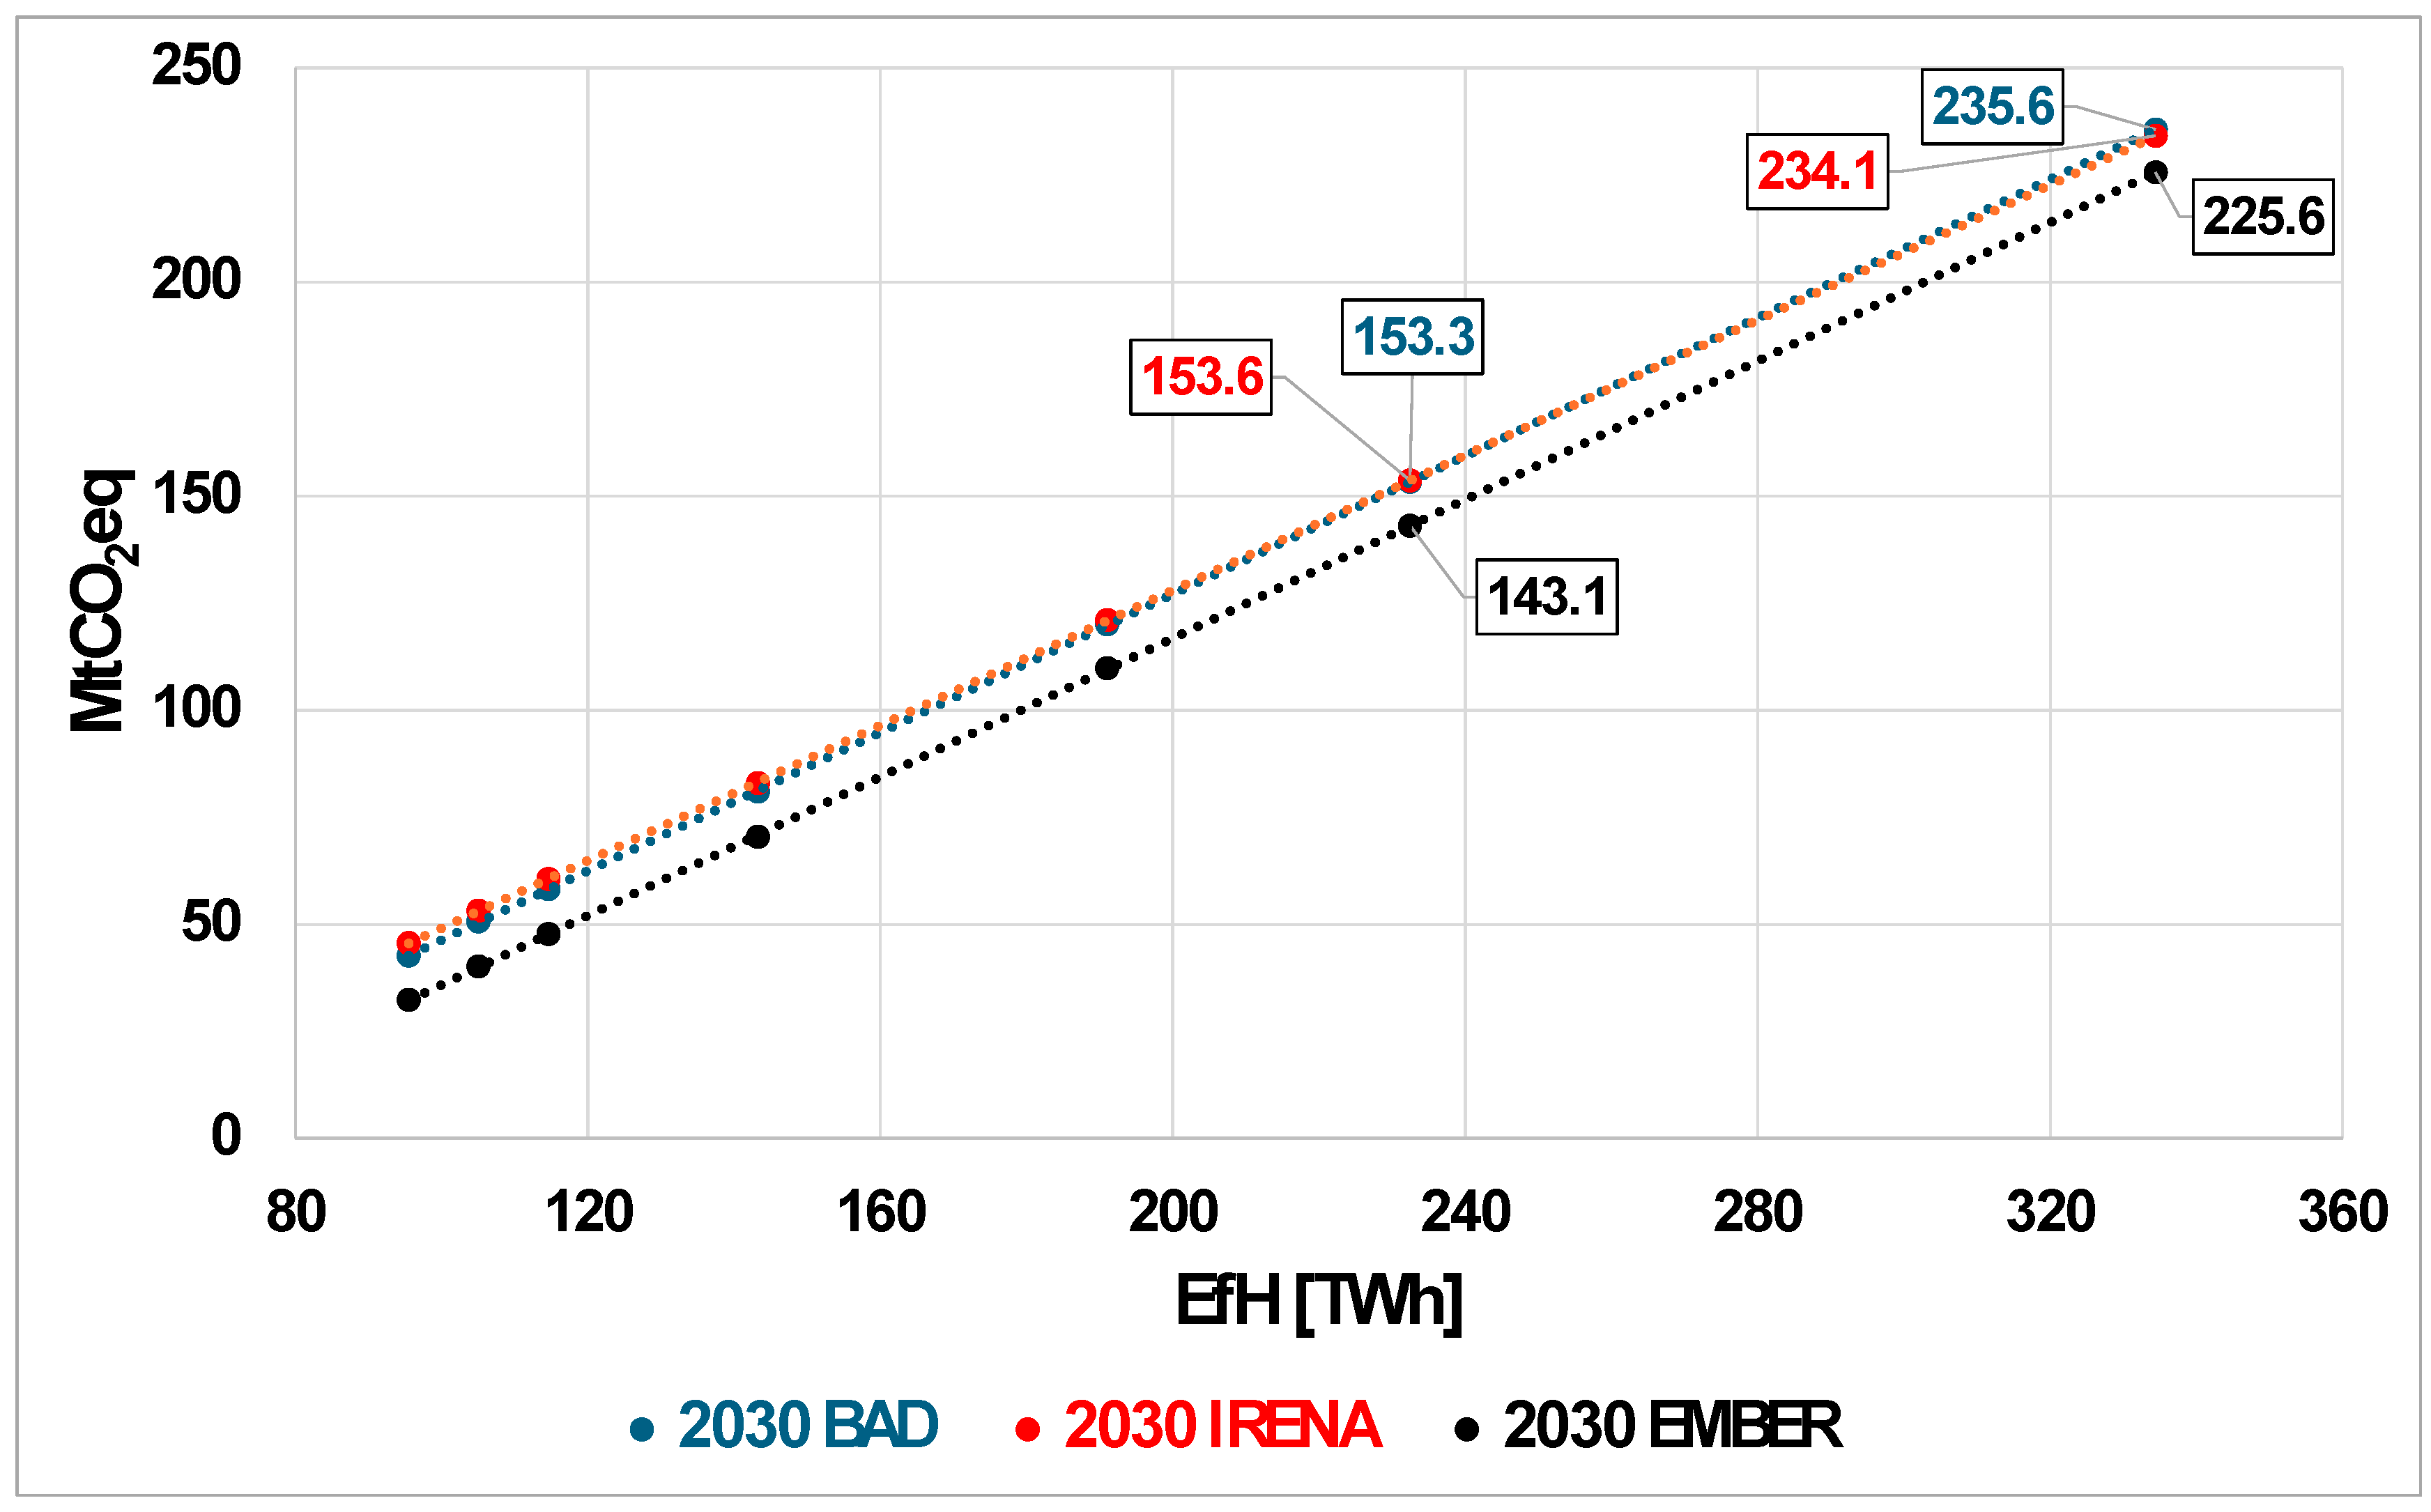
- While the carbon emission projections to 2030, extrapolating values of EfH (see Figure 4), are estimated within the range 117.03–331.90 Mt CO2 provided by Shi et al. [35] in their PoW carbon projection logistic model, only values of the 2030 BAD and 2030 IRENA scenarios for an EfH value increased by +100% (120.0 Mt CO2 and 121.0 Mt CO2, respectively, see Figure 3), remain within such a range.
3.2. CO2 Sorbents
3.3. Breakeven Electricity
3.4. Limits of the Study
4. Conclusions and Future Perspectives
Supplementary Materials
Author Contributions
Funding
Institutional Review Board Statement
Informed Consent Statement
Data Availability Statement
Acknowledgments
Conflicts of Interest
Abbreviations
| BAD | Best Available Data | HCE | High Carbon Electricity |
| BEE | Breakeven Electricity | IRENA | International Renewable Energy Agency |
| EfH | Electricity for Hashrate | LCE | Low Carbon Electricity |
| GHG | Green House Gas | LCI | Life Cycle Inventory |
| GWP | Global Warming Potential | LCIA | Life Cycle Impact Assessment |
References
- Abbass, K.; Qasim, M.Z.; Song, H.; Murshed, M.; Mahmood, H.; Younis, I. A Review of the Global Climate Change Impacts, Adaptation, and Sustainable Mitigation Measures. Environ. Sci. Pollut. Res. 2022, 29, 42539–42559. [Google Scholar] [CrossRef] [PubMed]
- Romanello, M.; Di Napoli, C.; Drummond, P.; Green, C.; Kennard, H.; Lampard, P.; Scamman, D.; Arnell, N.; Ayeb-Karlsson, S.; Ford, L.B.; et al. The 2022 Report of the Lancet Countdown on Health and Climate Change: Health at the Mercy of Fossil Fuels. Lancet 2022, 400, 1619–1654. [Google Scholar] [CrossRef] [PubMed]
- Rocque, R.J.; Beaudoin, C.; Ndjaboue, R.; Cameron, L.; Poirier-Bergeron, L.; Poulin-Rheault, R.A.; Fallon, C.; Tricco, A.C.; Witteman, H.O. Health Effects of Climate Change: An Overview of Systematic Reviews. BMJ Open 2021, 11, e46333. [Google Scholar] [CrossRef] [PubMed]
- Esquivel-Muelbert, A.; Baker, T.R.; Dexter, K.G.; Lewis, S.L.; Brienen, R.J.W.; Feldpausch, T.R.; Lloyd, J.; Monteagudo-Mendoza, A.; Arroyo, L.; Álvarez-Dávila, E.; et al. Compositional Response of Amazon Forests to Climate Change. Glob. Change Biol. 2019, 25, 39–56. [Google Scholar] [CrossRef]
- Oliver, E.C.J.; Benthuysen, J.A.; Darmaraki, S.; Donat, M.G.; Hobday, A.J.; Holbrook, N.J.; Schlegel, R.W.; Gupta, A. Marine Heatwaves. Annu. Rev. Mar. Sci. 2021, 13, 313–342. [Google Scholar] [CrossRef]
- Pascual, L.S.; Segarra-Medina, C.; Gómez-Cadenas, A.; López-Climent, M.F.; Vives-Peris, V.; Zandalinas, S.I. Climate Change-Associated Multifactorial Stress Combination: A Present Challenge for Our Ecosystems. J. Plant Physiol. 2022, 276, 153764. [Google Scholar] [CrossRef]
- Chen, L.; Msigwa, G.; Yang, M.; Osman, A.I.; Fawzy, S.; Rooney, D.W.; Yap, P.S. Strategies to Achieve a Carbon Neutral Society: A Review. Environ. Chem. Lett. 2022, 20, 2277–2310. [Google Scholar] [CrossRef]
- International Energy Agency. Net Zero Roadmap: A Global Pathway to Keep the 1.5 °C Goal in Reach—2023 Update; IEA: Paris, France, 2023. [Google Scholar]
- Fankhauser, S.; Smith, S.M.; Allen, M.; Axelsson, K.; Hale, T.; Hepburn, C.; Kendall, J.M.; Khosla, R.; Lezaun, J.; Mitchell-Larson, E.; et al. The Meaning of Net Zero and How to Get It Right. Nat. Clim. Change 2022, 12, 15–21. [Google Scholar] [CrossRef]
- Davis, S.J.; Lewis, N.S.; Shaner, M.; Aggarwal, S.; Arent, D.; Azevedo, I.L.; Benson, S.M.; Bradley, T.; Brouwer, J.; Chiang, Y.M.; et al. Net-Zero Emissions Energy Systems. Science 2018, 360, eaas9793. [Google Scholar] [CrossRef]
- Chen, L.; Chen, Z.; Zhang, Y.; Liu, Y.; Osman, A.I.; Farghali, M.; Hua, J.; Al-Fatesh, A.; Ihara, I.; Rooney, D.W.; et al. Artificial Intelligence-Based Solutions for Climate Change: A Review. Environ. Chem. Lett. 2023, 21, 2525–2557. [Google Scholar] [CrossRef]
- Hegab, H.; Shaban, I.; Jamil, M.; Khanna, N. Toward Sustainable Future: Strategies, Indicators, and Challenges for Implementing Sustainable Production Systems. Sustain. Mater. Technol. 2023, 36, e00617. [Google Scholar] [CrossRef]
- Dincer, I.; Aydin, M.I. New Paradigms in Sustainable Energy Systems with Hydrogen. Energy Convers. Manag. 2023, 283, 116950. [Google Scholar] [CrossRef]
- Liu, Z.; Deng, Z.; Davis, S.J.; Ciais, P. Global Carbon Emissions in 2023. Nat. Rev. Earth Environ. 2024, 5, 253–254. [Google Scholar] [CrossRef]
- Statista. Average Monthly Carbon Dioxide (CO2) Levels in the Atmosphere Worldwide from 1990 to 2024; Statista: Hamburg, Germany, 2024. [Google Scholar]
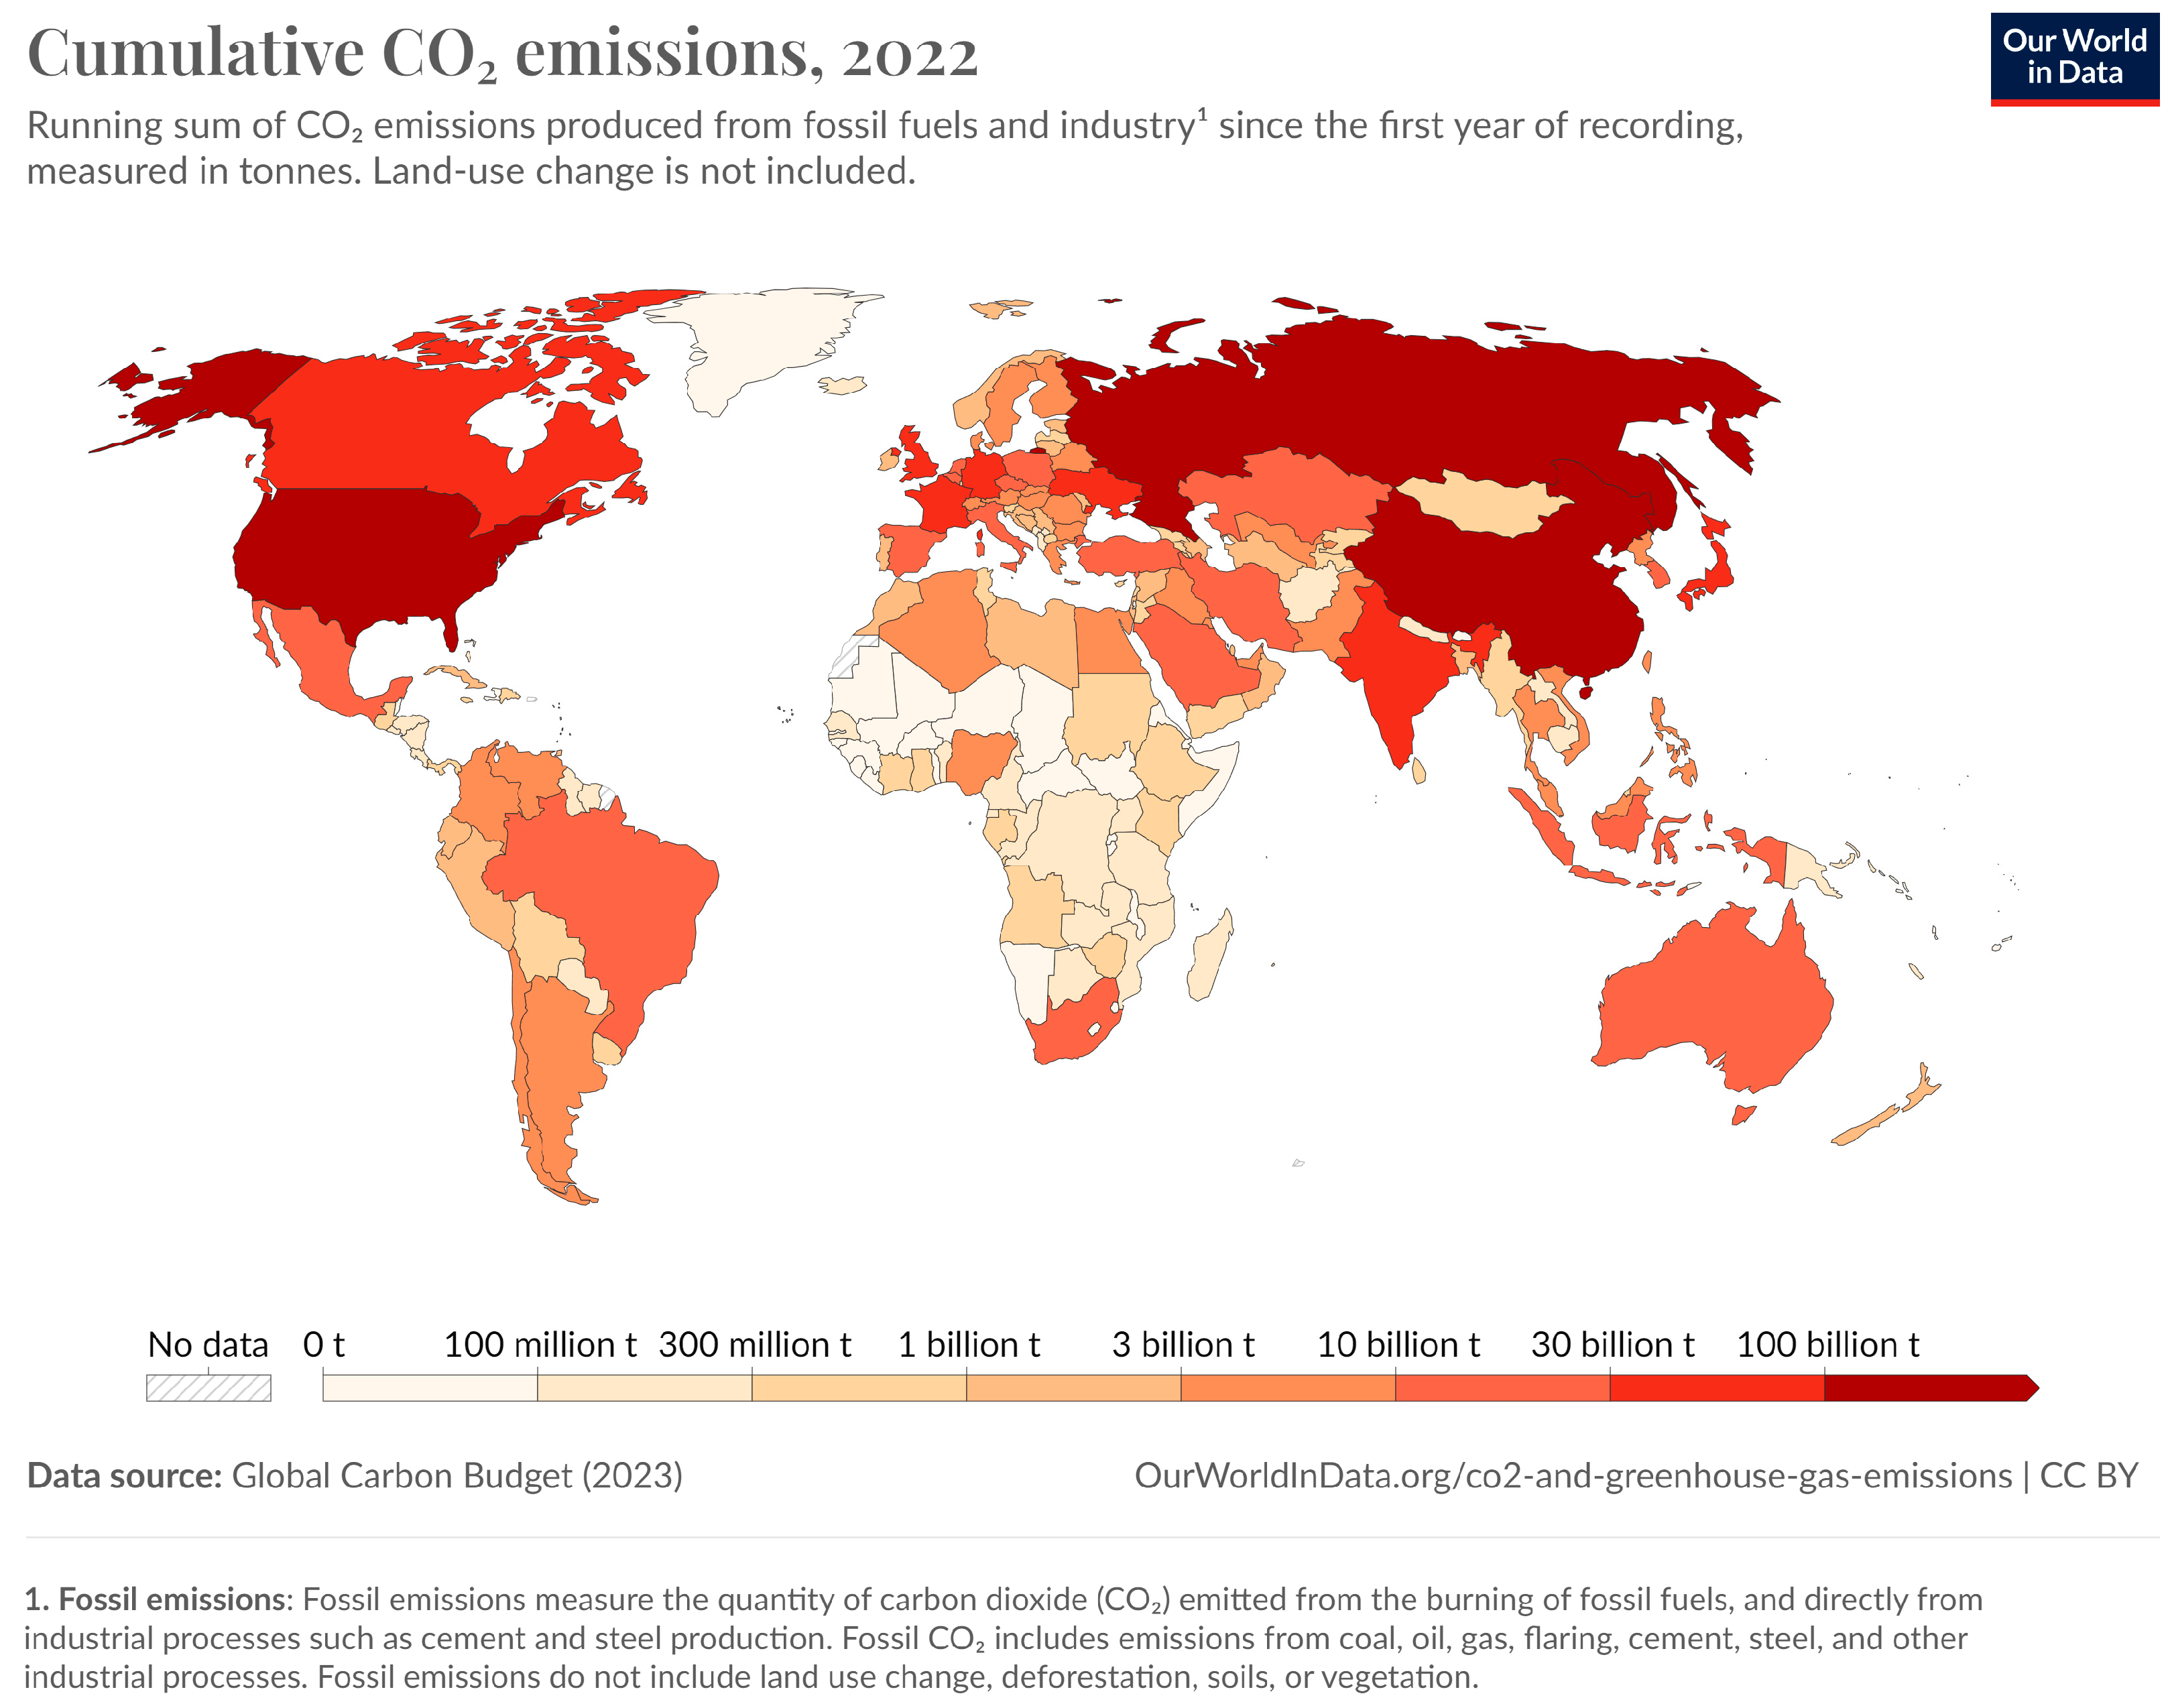
- Ritchie, H.; Rosado, P.; Roser, M. Data Page: Cumulative CO2 Emissions. 2023. Available online: https://ourworldindata.org/grapher/cumulative-co-emissions (accessed on 14 October 2024).
- Kshetri, N. Blockchain’s Roles in Meeting Key Supply Chain Management Objectives. Int. J. Inf. Manag. 2018, 39, 80–89. [Google Scholar] [CrossRef]
- Atzori, M. Blockchain Technology and Decentralized Governance: Is the State Still Necessary? J. Gov. Regul. 2017, 6, 45–62. [Google Scholar] [CrossRef]
- Marsal-Llacuna, M.L. Future Living Framework: Is Blockchain the next Enabling Network? Technol. Forecast. Soc. Change 2018, 128, 226–234. [Google Scholar] [CrossRef]
- Bano, S.; Sonnino, A.; Al-Bassam, M.; Azouvi, S.; McCorry, P.; Meiklejohn, S.; Danezis, G. Consensus in the Age of Blockchains. arXiv 2017, arXiv:1711.03936. [Google Scholar]
- Adams, R.; Parry, G.; Godsiff, P.; Ward, P. The Future of Money and Further Applications of the Blockchain. Strateg. Change 2017, 26, 417–422. [Google Scholar] [CrossRef]
- Köhler, S.; Pizzol, M. Life Cycle Assessment of Bitcoin Mining. Environ. Sci. Technol. 2019, 53, 13598–13606. [Google Scholar] [CrossRef]
- Chamanara, S.; Ghaffarizadeh, S.A.; Madani, K. The Environmental Footprint of Bitcoin Mining Across the Globe: Call for Urgent Action. Earths Future 2023, 11, e2023EF003871. [Google Scholar] [CrossRef]
- University of Cambridge Cambridge Blockchain Network Sustainability Index (CBECI). 2022. Available online: https://ccaf.io/cbnsi/cbeci (accessed on 14 October 2024).
- Statista. Net Electricity Consumption Worldwide in Select Years from 1980 to 2022; Statista: Hamburg, Germany, 2024. [Google Scholar]
- Qin, M.; Wu, T.; Ma, X.; Albu, L.L.; Umar, M. Are Energy Consumption and Carbon Emission Caused by Bitcoin? A Novel Time-Varying Technique. Econ. Anal. Policy 2023, 80, 109–120. [Google Scholar] [CrossRef]
- Maiti, M. Dynamics of Bitcoin Prices and Energy Consumption. Chaos Solitons Fractals X 2022, 9, 100086. [Google Scholar] [CrossRef]
- Polemis, M.L.; Tsionas, M.G. The Environmental Consequences of Blockchain Technology: A Bayesian Quantile Cointegration Analysis for Bitcoin. Int. J. Financ. Econ. 2023, 28, 1602–1621. [Google Scholar] [CrossRef]
- De Vries, A.; Gallersdö, U.; Klaaßen, L.; Stoll, C. Revisiting Bitcoin’s Carbon Footprint. Joule 2022, 6, 498–502. [Google Scholar] [CrossRef]
- Kumari, P.; Mamidala, V.; Chavali, K.; Behl, A. The Changing Dynamics of Crypto Mining and Environmental Impact. Int. Rev. Econ. Financ. 2024, 89, 940–953. [Google Scholar] [CrossRef]
- Zhang, D.; Chen, X.H.; Lau, C.K.M.; Xu, B. Implications of Cryptocurrency Energy Usage on Climate Change. Technol. Forecast. Soc. Change 2023, 187, 122219. [Google Scholar] [CrossRef]
- Liu, F.; Wang, L.; Kong, D.; Shi, C.; Feng, Z.; Zhou, J.; Liu, J.; Li, Z. Is There More to Bitcoin Mining than Carbon Emissions? Heliyon 2023, 9, e15099. [Google Scholar] [CrossRef]
- Sarkodie, S.A.; Ahmed, M.Y.; Leirvik, T. Trade Volume Affects Bitcoin Energy Consumption and Carbon Footprint. Financ. Res. Lett. 2022, 48, 102977. [Google Scholar] [CrossRef]
- Stoll, C.; Klaaßen, L.; Gallersdörfer, U. The Carbon Footprint of Bitcoin. Joule 2019, 3, 1647–1661. [Google Scholar] [CrossRef]
- Shi, X.; Xiao, H.; Liu, W.; Lackner, K.S.; Buterin, V.; Stocker, T.F. Confronting the Carbon-Footprint Challenge of Blockchain. Environ. Sci. Technol. 2023, 57, 1403–1410. [Google Scholar] [CrossRef]
- Roeck, M.; Drennen, T. Life Cycle Assessment of Behind-the-Meter Bitcoin Mining at US Power Plant. Int. J. Life Cycle Assess. 2022, 27, 355–365. [Google Scholar] [CrossRef] [PubMed]
- Lal, A.; Niaz, H.; Liu, J.J.; You, F. Can Bitcoin Mining Empower Energy Transition and Fuel Sustainable Development Goals in the US? J. Clean. Prod. 2024, 439, 140799. [Google Scholar] [CrossRef]
- Bruno, A.; Weber, P.; Yates, A.J. Can Bitcoin Mining Increase Renewable Electricity Capacity? Resour. Energy Econ. 2023, 74, 101376. [Google Scholar] [CrossRef]
- Oxford University. What Is Net Zero? Oxford University: Oxford, UK, 2024.
- Hauschild, M.Z.; Kara, S.; Røpke, I. Absolute Sustainability: Challenges to Life Cycle Engineering. CIRP Ann. 2020, 69, 533–553. [Google Scholar] [CrossRef]
- Metz, B.; Davidson, O.; de Coninck, H.; Loos, M.; Meyer, L. Carbon Dioxide Capture and Storage; Cambridge University Press: Cambridge, UK, 2005. [Google Scholar]
- Hekmatmehr, H.; Esmaeili, A.; Pourmahdi, M.; Atashrouz, S.; Abedi, A.; Ali Abuswer, M.; Nedeljkovic, D.; Latifi, M.; Farag, S.; Mohaddespour, A. Carbon Capture Technologies: A Review on Technology Readiness Level. Fuel 2024, 363, 130898. [Google Scholar] [CrossRef]
- Sorolla-Rosario, D.; Llorca-Porcel, J.; Pérez-Martínez, M.; Lozano-Castelló, D.; Bueno-López, A. Carbon Sorbents for the Retention of Thermodecomposition Compounds from Microplastics. J. Environ. Chem. Eng. 2022, 10, 108970. [Google Scholar] [CrossRef]
- Ayeleru, O.O.; Modekwe, H.U.; Onisuru, O.R.; Ohoro, C.R.; Akinnawo, C.A.; Olubambi, P.A. Adsorbent Technologies and Applications for Carbon Capture, and Direct Air Capture in Environmental Perspective and Sustainable Climate Action. Sustain. Chem. Clim. Action 2023, 3, 100029. [Google Scholar] [CrossRef]
- Leonzio, G.; Fennell, P.S.; Shah, N. Analysis of Technologies for Carbon Dioxide Capture from the Air. Appl. Sci. 2022, 12, 8321. [Google Scholar] [CrossRef]
- IEA. Technology Perspectives Energy Special Report on Carbon Capture Utilisation and Storage CCUS in Clean Energy Transitions; IEA: Paris, France, 2020. [Google Scholar]
- ISO 14040/Amd 1:2020; Environmental Management—Life Cycle Assessment—Requirements and Guidelines. ISO: Geneva, Switzerland, 2006.
- ISO 14044/Amd 1:2017+Amd 2:2020; Environmental Management—Life Cycle Assessment—Requirements and Guidelines. ISO: Geneva, Switzerland, 2006.
- Lei, N.; Masanet, E.; Koomey, J. Best Practices for Analyzing the Direct Energy Use of Blockchain Technology Systems: Review and Policy Recommendations. Energy Policy 2021, 156, 112422. [Google Scholar] [CrossRef]
- Hauschild, M.Z.; Rosenbaum, R.K.; Olsen, S.I. Life Cycle Assessment; Springer: Cham, Switzerland, 2018. [Google Scholar]
- Arfelli, F.; Tosi, C.; Ciacci, L.; Passarini, F. Life Cycle Assessment of a Wood Biomass Gasification Plant and Implications for Syngas and Biochar Utilization. Energies 2024, 17, 2599. [Google Scholar] [CrossRef]
- Arfelli, F.; Cespi, D.; Ciacci, L.; Passarini, F. Application of Life Cycle Assessment to High Quality-Soil Conditioner Production from Biowaste. Waste Manag. 2023, 172, 216–225. [Google Scholar] [CrossRef] [PubMed]
- IEA Electricity Generation by Source, Italy 2022. Available online: https://www.iea.org (accessed on 7 July 2022).
- Wernet, G.; Bauer, C.; Steubing, B.; Reinhard, J.; Moreno-Ruiz, E.; Weidema, B. The Ecoinvent Database Version 3 (Part I): Overview and Methodology. Int. J. Life Cycle Assess. 2016, 21, 1218–1230. [Google Scholar] [CrossRef]
- IRENA. WETO Energy Supply. Available online: https://www.irena.org/Data/View-data-by-topic/Energy-Transition/WETO-Energy-Supply (accessed on 29 May 2024).
- EMBER. Progress Towards 1.5C Power Sector Benchmarks; EMBER: Boston, MA, USA, 2024. [Google Scholar]
- Yazıcı, A.F.; Olcay, A.B.; Arkalı Olcay, G. A Framework for Maintaining Sustainable Energy Use in Bitcoin Mining through Switching Efficient Mining Hardware. Technol. Forecast. Soc. Change 2023, 190, 122406. [Google Scholar] [CrossRef]
- Mining Farm Italia. Mining Farm Italia Website; Mining Farm Italia: Perugia, Italy, 2024. [Google Scholar]
- Parrado-Duque, A.; Dube, Y.; Charrel, S.; Gaden, C.; Henao, N.; Agbossou, K.; Guibault, Y. Potential for Waste Heat Recovery in a Digital Currency Mining Facility: A Building Infrastructure Case Study. In Proceedings of the 2023 IEEE 64th Annual International Scientific Conference on Power and Electrical Engineering of Riga Technical University, Riga, Latvia, 9–11 October 2023; RTUCON 2023—Proceedings. Institute of Electrical and Electronics Engineers Inc.: Piscataway, NJ, USA, 2023. [Google Scholar]
- Shi, X.; Xiao, H.; Azarabadi, H.; Song, J.; Wu, X.; Chen, X.; Lackner, K.S. Sorbents for the Direct Capture of CO2 from Ambient Air. Angew. Chem. Int. Ed. 2020, 59, 6984–7006. [Google Scholar] [CrossRef]
- Panda, D.; Kulkarni, V.; Singh, S.K. Evaluation of Amine-Based Solid Adsorbents for Direct Air Capture: A Critical Review. React. Chem. Eng. 2022, 8, 10–40. [Google Scholar] [CrossRef]
- Ünveren, E.E.; Monkul, B.Ö.; Sarıoğlan, Ş.; Karademir, N.; Alper, E. Solid Amine Sorbents for CO2 Capture by Chemical Adsorption: A Review. Petroleum 2017, 3, 37–50. [Google Scholar] [CrossRef]
- Hamdy, L.B.; Goel, C.; Rudd, J.A.; Barron, A.R.; Andreoli, E. The Application of Amine-Based Materials for Carbon Capture and Utilisation: An Overarching View. Mater. Adv. 2021, 2, 5843–5880. [Google Scholar] [CrossRef]
- Sanz-Pérez, E.S.; Murdock, C.R.; Didas, S.A.; Jones, C.W. Direct Capture of CO2 from Ambient Air. Chem. Rev. 2016, 116, 11840–11876. [Google Scholar] [CrossRef]
- Nguyen, T.S.; Dogan, N.A.; Lim, H.; Yavuz, C.T. Amine Chemistry of Porous CO2 Adsorbents. Acc. Chem. Res. 2023, 56, 2642–2652. [Google Scholar] [CrossRef]
- Coralli, I.; Giuri, D.; Spada, L.; Ortolani, J.; Mazzocchetti, L.; Tomasini, C.; Stevens, L.A.; Snape, C.E.; Fabbri, D. Valorization Strategies in CO2 Capture: A New Life for Exhausted Silica-Polyethylenimine. Int. J. Mol. Sci. 2023, 24, 14415. [Google Scholar] [CrossRef]
- Ritchie, H.; Roser, M. CO2 Emissions; IEA: Paris, France, 2020. [Google Scholar]
- Statista. Production of Methanol Worldwide from 2017 to 2022; Statista: Hamburg, Germany, 2024. [Google Scholar]
- Statista. Production of Ammonia Worldwide from 2010 to 2023; Statista: Hamburg, Germany, 2024. [Google Scholar]
- IEA. Direct Air Capture; IEA: Paris, France, 2024. [Google Scholar]
- 1pointfive. Stratos; 1pointfive: Houston, TX, USA, 2024. [Google Scholar]
- Climeworks. Mammoth: Our Newest Facility; Climeworks: Zürich, Switzerland, 2024. [Google Scholar]
- Zhao, X.; Ye, Q.; Candel, S.; Vignon, D.; Guillaumont, R. A Chinese–French Study on Nuclear Energy and the Environment. Engineering 2023, 26, 159–172. [Google Scholar] [CrossRef]
- Vera, I.; Wicke, B.; Lamers, P.; Cowie, A.; Repo, A.; Heukels, B.; Zumpf, C.; Styles, D.; Parish, E.; Cherubini, F.; et al. Land Use for Bioenergy: Synergies and Trade-Offs between Sustainable Development Goals. Renew. Sustain. Energy Rev. 2022, 161, 112409. [Google Scholar] [CrossRef]
- Ketzer, D.; Weinberger, N.; Rösch, C.; Seitz, S.B. Land Use Conflicts between Biomass and Power Production–Citizens’ Participation in the Technology Development of Agrophotovoltaics. J. Responsible Innov. 2020, 7, 193–216. [Google Scholar] [CrossRef]
- Yang, W.; Pudasainee, D.; Gupta, R.; Li, W.; Wang, B.; Sun, L. An Overview of Inorganic Particulate Matter Emission from Coal/Biomass/MSW Combustion: Sampling and Measurement, Formation, Distribution, Inorganic Composition and Influencing Factors. Fuel Process. Technol. 2021, 213, 106657. [Google Scholar] [CrossRef]
- de Vries, A. Bitcoin’s Growing Water Footprint. Cell Rep. Sustain. 2024, 1, 100004. [Google Scholar] [CrossRef]
- de Vries, A.; Stoll, C. Bitcoin’s Growing e-Waste Problem. Resour. Conserv. Recycl. 2021, 175, 105901. [Google Scholar] [CrossRef]
- Gabbar, H.A.; Abdelsalam, A.A. Energy—Water Nexus: Integration, Monitoring, KPIS Tools and Research Vision. Energies 2020, 13, 6697. [Google Scholar] [CrossRef]
- Walsh, B.P.; Murray, S.N.; O’Sullivan, D.T.J. The Water Energy Nexus, an ISO50001 Water Case Study and the Need for a Water Value System. Water Resour. Ind. 2015, 10, 15–28. [Google Scholar] [CrossRef]
- Arfelli, F.; Ciacci, L.; Vassura, I.; Passarini, F. Nexus Analysis and Life Cycle Assessment of Regional Water Supply Systems: A Case Study from Italy. Resour. Conserv. Recycl. 2022, 185, 106446. [Google Scholar] [CrossRef]
- Font Vivanco, D.; Wang, R.; Hertwich, E. Nexus Strength: A Novel Metric for Assessing the Global Resource Nexus. J. Ind. Ecol. 2018, 22, 1473–1486. [Google Scholar] [CrossRef]


| Hypotheses | Description |
|---|---|
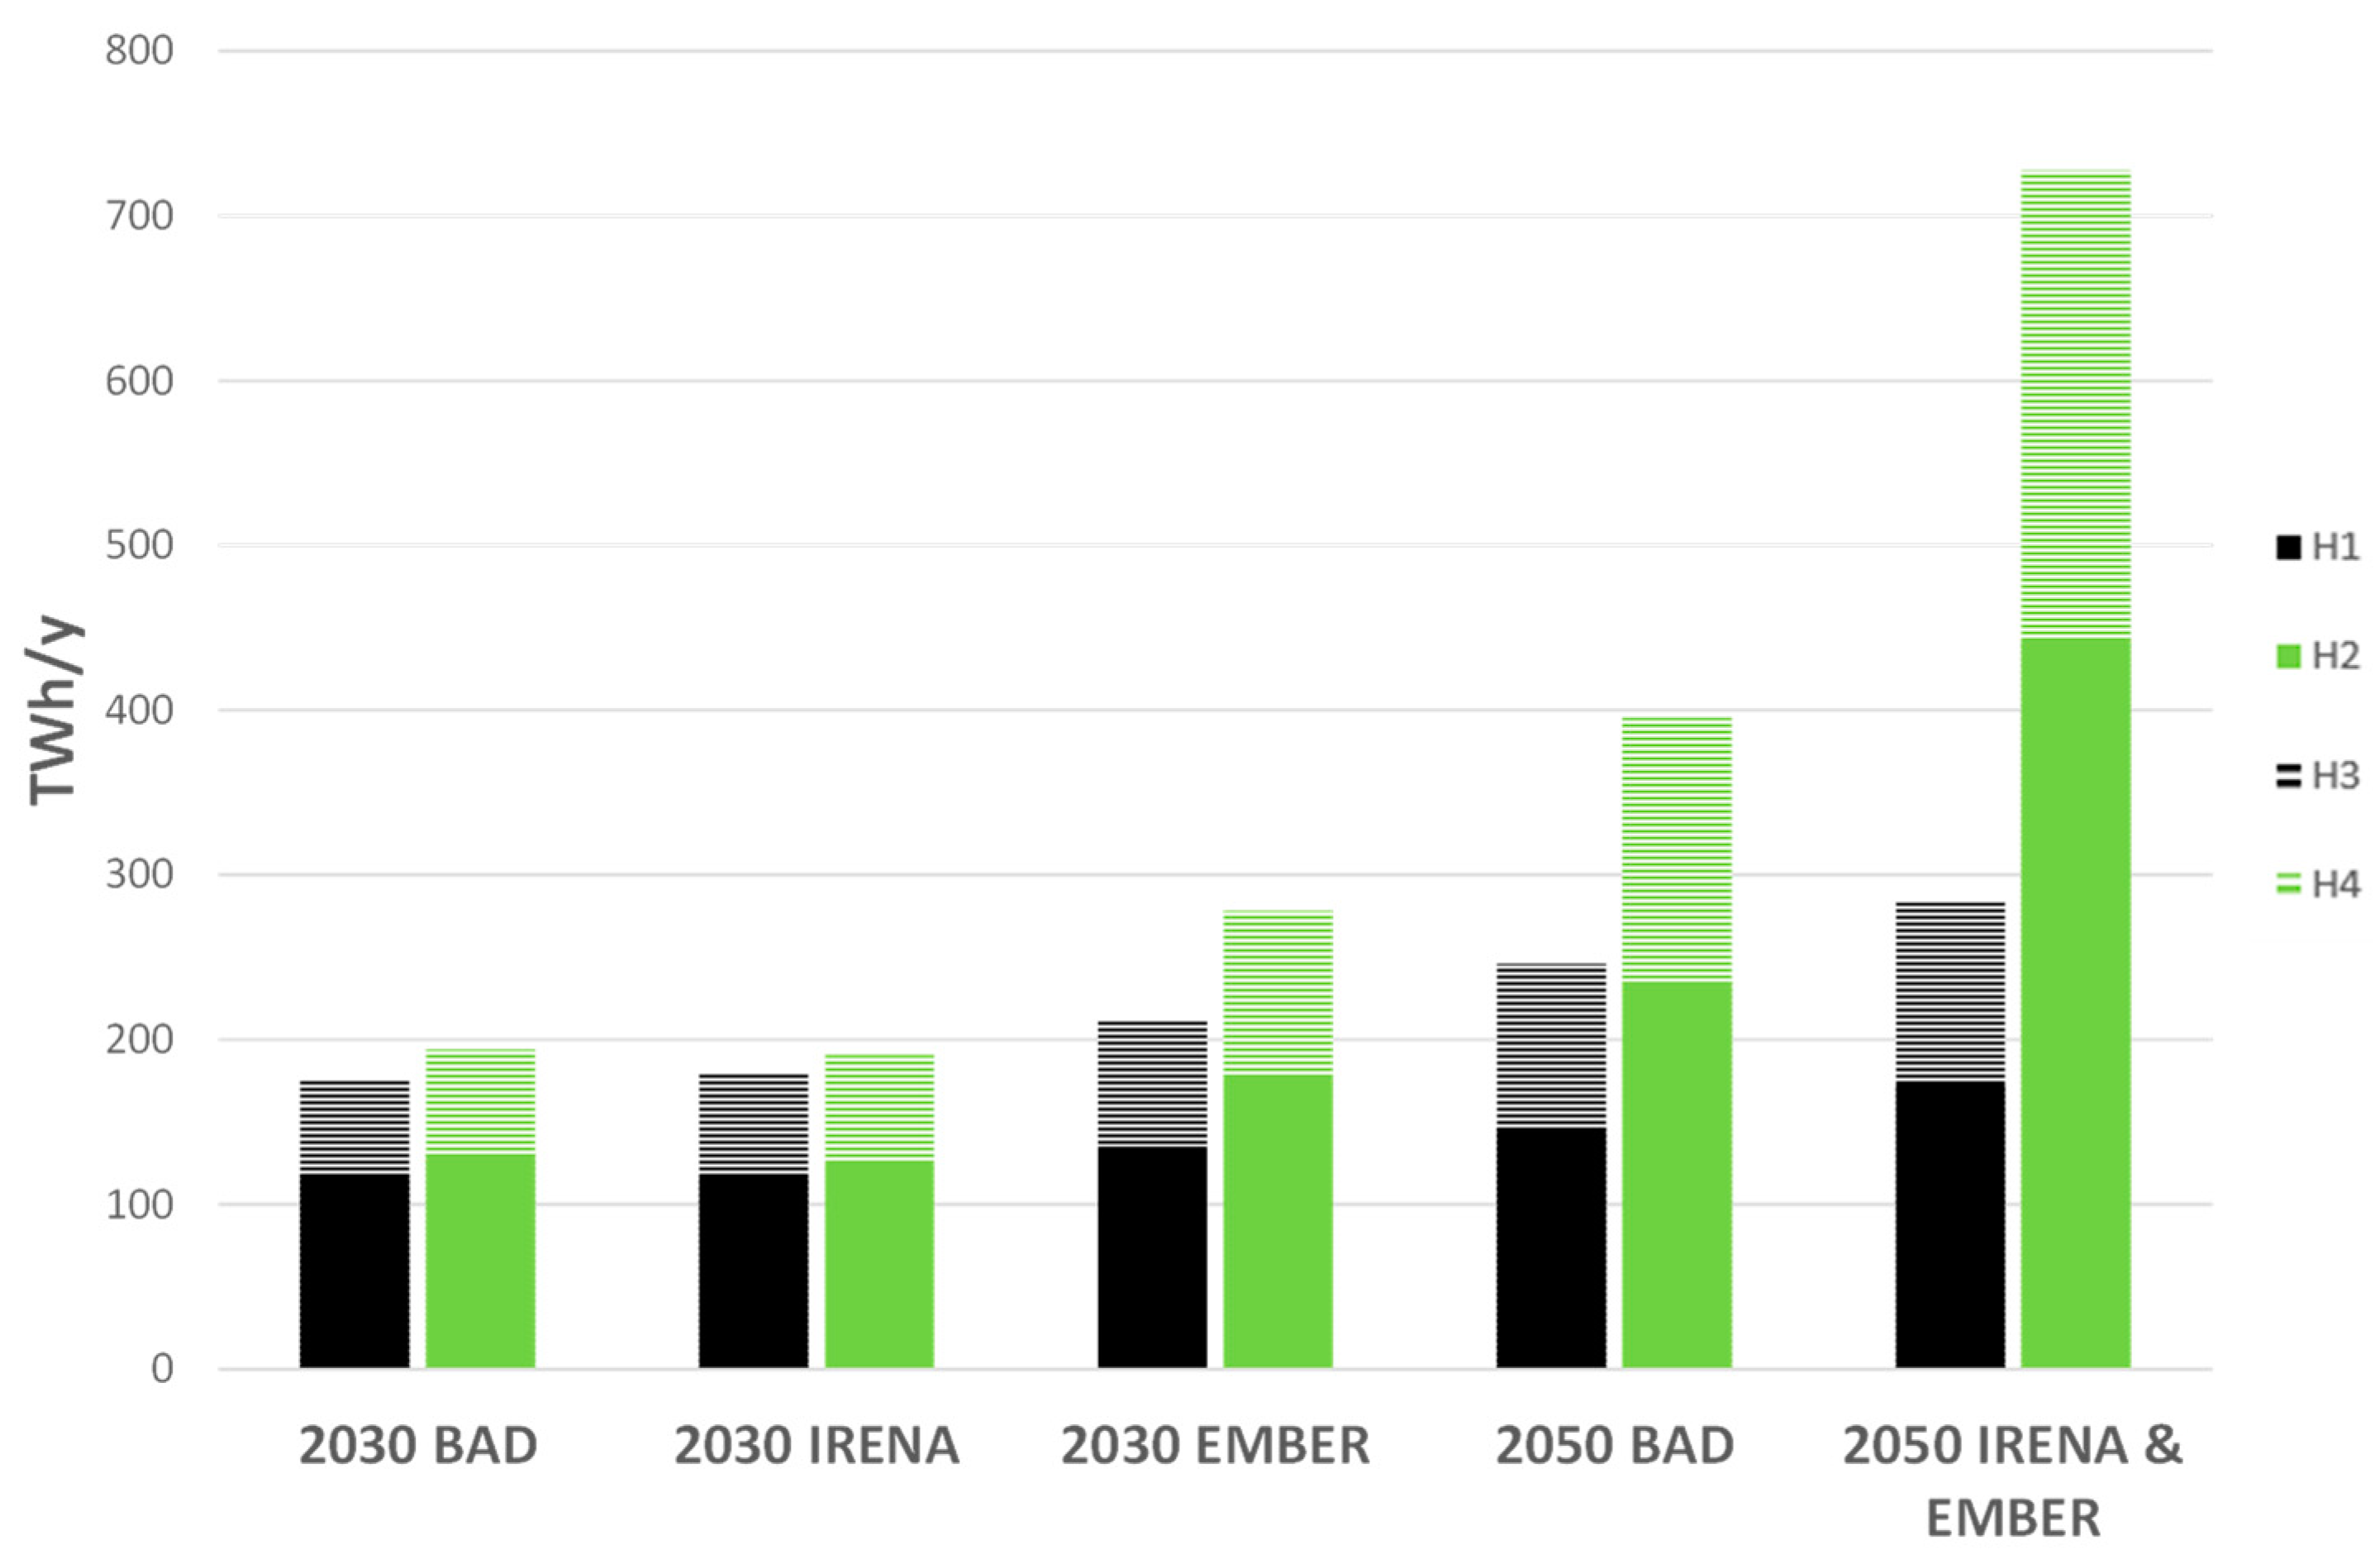
| H1 | Countries will be able to meet the increasing EfH maintaining a constant fraction of LCE in the mix. |
| H2 | The electricity mix of the scenario is maintained constant until the electricity consumption of 2022 is reached. Then the excess of electricity will be produced entirely from HCE sources. |
| H3 | Same as H1, but it includes the credit associated with the heat recovery. |
| H4 | Same as H2, but it includes the credit associated with the heat recovery. |
Disclaimer/Publisher’s Note: The statements, opinions and data contained in all publications are solely those of the individual author(s) and contributor(s) and not of MDPI and/or the editor(s). MDPI and/or the editor(s) disclaim responsibility for any injury to people or property resulting from any ideas, methods, instructions or products referred to in the content. |
© 2024 by the authors. Licensee MDPI, Basel, Switzerland. This article is an open access article distributed under the terms and conditions of the Creative Commons Attribution (CC BY) license (https://creativecommons.org/licenses/by/4.0/).
Share and Cite
Arfelli, F.; Coralli, I.; Cespi, D.; Ciacci, L.; Fabbri, D.; Passarini, F.; Spada, L. The Environmental Stake of Bitcoin Mining: Present and Future Challenges. Appl. Sci. 2024, 14, 9597. https://doi.org/10.3390/app14209597
Arfelli F, Coralli I, Cespi D, Ciacci L, Fabbri D, Passarini F, Spada L. The Environmental Stake of Bitcoin Mining: Present and Future Challenges. Applied Sciences. 2024; 14(20):9597. https://doi.org/10.3390/app14209597
Chicago/Turabian StyleArfelli, Francesco, Irene Coralli, Daniele Cespi, Luca Ciacci, Daniele Fabbri, Fabrizio Passarini, and Lorenzo Spada. 2024. "The Environmental Stake of Bitcoin Mining: Present and Future Challenges" Applied Sciences 14, no. 20: 9597. https://doi.org/10.3390/app14209597
APA StyleArfelli, F., Coralli, I., Cespi, D., Ciacci, L., Fabbri, D., Passarini, F., & Spada, L. (2024). The Environmental Stake of Bitcoin Mining: Present and Future Challenges. Applied Sciences, 14(20), 9597. https://doi.org/10.3390/app14209597