Abstract
In this paper, concrete cracking is investigated in dynamics through finite element modeling. A probabilistic semi-explicit model, previously developed and validated for static loading, is extended for dynamic loading. The model in statics is based on two material mechanical parameters: the tensile strength and the critical strain-energy release rate in mode I, , of the Linear Elastic Fracture Mechanics (LEFM) theory. Concerning the dynamic aspects of the model, the tensile strength rate effect is modeled by an empirical dynamic-to-static strength ratio (Dynamic Increase Factor—DIF) and a similar formulation is proposed for . The structural rate effect is naturally captured when mass and damping are included in the equation of motion. For static and dynamic loading, only macroscopic crack propagation is considered. Some numerical simulations in statics and dynamics are presented in the present paper. The main results related to this work can be summarized as follows: the dispersion of the numerical results related to the load–displacement curves decreases with the loading rate. The crack pattern considerably changes with loading rate (numerically and experimentally); the agreement between the experimental and numerical results (load–displacement curves and crack pattern) indicates the model is promising for engineering applications.
1. Introduction
The mechanical properties derived from quasi-static monotonic loadings are far from being sufficient with regard to the real loadings that concrete structures undergo during their lifespan. Existing structures [1] are very often subjected to dynamic loading, either moderate such as wind loads or high such as explosive charge or vehicle impact. These types of dynamic loadings are becoming more and more frequent due to climate change (floods, coastal flooding, earthquakes, storms, and hurricanes). Their consideration in the design of concrete constructions is, therefore, becoming a major issue. Current regulation codes do not constitute tools to address this issue. They are not sufficiently based on physical foundations. Thus, the literature indicates that concrete responds very differently in case of dynamic loading. Indeed, all experimental research points in the same direction: concrete displays a high strain-rate dependency, especially for tensile loading. Concerning the strain-rate dependency of concrete, previous studies [2,3] support that it has a physical origin: the presence of free water inside the hydrates of the cement paste which could generate the well-known Stefan effect. The present work concerns the development of a numerical model capable of considering dynamic loadings and based on this physical reality evocated above. This numerical model is the extension of a numerical cracking model developed and validated for quasi-static loadings. It is a 3D probabilistic semi-explicit cracking model [4,5,6]. Its design and numerical development in statics have been carried out with a focus on simplicity and physical relevance. In dynamics, the development follows the same approach. The goal is to create a design and analysis tool for concrete structures that can be used by an engineering company (or its academic counterpart). All of the mechanical parameters of the model, in both statics and dynamics, are clearly defined and easily measurable. The use of a Monte Carlo procedure, linked to the probabilistic aspect of the model, could permit performing a statistical analysis of the structural behavior and, in this way, determine the realistic structural safety coefficients.
2. Numerical Models for Concrete Cracking in Statics and Dynamics
2.1. Cracking Model in Statics
The model proposed is based on two material parameters related to the concrete behavior in uniaxial tension: the tensile strength and the post-cracking dissipated energy. The tensile strength () indicates the initiation of the macrocrack propagation (macrocrack localization) and the post-cracking energy () is directly related to the macrocrack propagation. This mode I critical fracture energy comes from the Linear Elastic Fracture Mechanics (LEFM) theory. The macrocrack propagates only when is fully dissipated in a volume element. The use of a damage parameter, in the model, has no physical meaning and its sike objective is to dissipate in the simplest way. So, this model is not a classical damage model. Indeed, in damage models, the zones that are not fully damaged are considered physically relevant and are used to determine some crack propagation and opening. Finally, and are considered to be random parameters. These values depend on the size of the volume elements. They have been determined in the framework of previous experimental and numerical works [4,5,6,7,8,9,10,11]. They are linked to the degree of heterogeneity of the mesh element, , defined by the following relation:
where is the volume of the mesh element and is the volume of the greatest aggregate size of concrete. The probabilistic properties of and depend on its mean value and the standard deviation . For tensile strength, the mean value, , is written as
where MPa. The parameter y is given by the following equation
where represents the concrete compressive strength in MPa and MPa. The compressive strength is determined by performing a standard test on a 160 × 320 mm cylinder specimen. The standard deviation, , is given by
where and d is evaluated as
In the model, does not depend on mesh refinement, but does [4,5,6]. They are written as [4,11]:
where and Finally, it is important to point out that it has been demonstrated that the use of the 3D probabilistic semi-explicit cracking model leads to mesh-independent results in statics [4,5,6]. Equations (2)–(7) have been validated for MPa and a maximum aggregate size mm. The general aspects of the model are schematized in Figure 1.
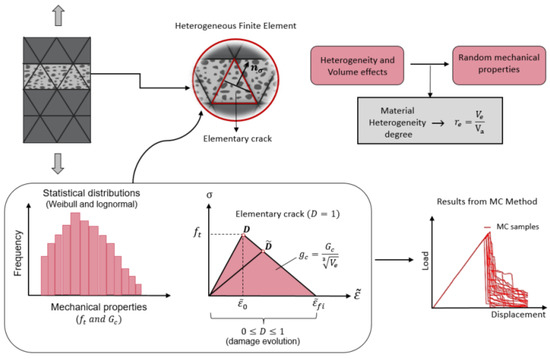
Figure 1.
General aspects of the 3D probabilistic semi-explicit cracking model of concrete.
As shown in Figure 1, the introduction of a damage parameter in the theoretical approach is arbitrary and serves solely as a method to dissipate . This means that, in the proposed model, there is no relation between the nonlinear strain (softening branch of the stress–strain curve in tension) and real crack propagation.
2.2. Strain Rate Effect Related to the Uniaxial Tensile Behavior
Previous works on the rate effect related to the uniaxial tensile strength of concretes detailed the physical mechanisms involved in this mechanical observation [2,3]. It was demonstrated that this rate effect is, at the material level, linked to the water within the nanopores of the concrete hydrates. The physical mechanism proposed is similar to the well known (in physics) Stefan Effect. It involves the water viscosity [2,3] in this way: when a thin film of a viscous liquid is placed between two flat plates, the liquid exerts a restoring force on the plates proportional to the displacement rate of the plates (Equation (8)).
where is the viscosity of the liquid, h is the initial distance between the plates, is the displacement rate, and V is the volume of liquid.
Concrete Youngs’ modulus, which is highly linked to the presence of aggregates, is not very affected by Stefan Effect, as aggregates are not highly influenced by viscous mechanisms [12]. Experimental data [13] appear to show that strength increase does not depend on the water-to-cement (w/c) ratio (Figure 2), that is, on the concrete mix design. This is due to the fact that all concretes have the same quantity of water within their nanopores (hydrates porosity).

Figure 2.
Tensile strength as a function of the loading rate logarithm for w/c = 0.3, 0.5 and 0.7 [13].
Figure 2 shows that the tensile strength increase follows Equation (9), which is graphically depicted in Figure 3.

Figure 3.
Tensile strength increasing as a function of the logarithm of the tensile stress rate.
In the past, tests on a large () Double Cantilever Beam (DCB) specimen have been performed [14,15,16]. Due to the difficulty in performing dynamical tests on this type of specimen, an assumption has been made, which is presented in Equation (10)
It is important to point out that Equation (10) is physically based, because the cracking process inside a specimen in uniaxial tension is the same inside the process zone at the macroscopic crack tip during its propagation. Therefore, the rate effect should be equivalent. Equation (10) leads the stress–strain curve to display the behavior depicted in Figure 4 (for the sake of simplicity, it is considered to be a linear curve, but the same would apply for a general stress–strain curve), indicating that the material becomes more brittle as the loading rate increases.
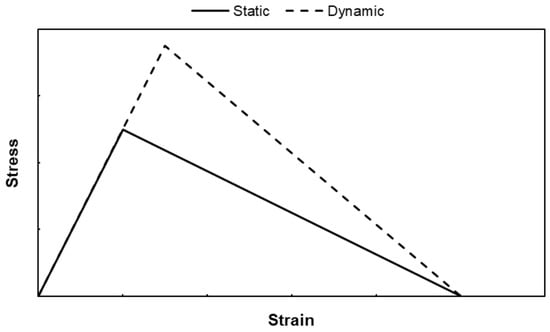
Figure 4.
Evolution of the stress–strain curve with the strain rate.
2.3. Cracking Model in Dynamics
The current literature [2,3,17,18,19,20,21,22,23,24,25,26,27,28,29,30,31] appears to agree that three factors are linked to rate dependency, namely: micro-inertia, moisture effect, and structural inertia. In the present physical and mechanical approach, it is considered that the material inertia integrates the micro-inertia and moisture effect through the Stefan Effect [2,3]. The influence of structural inertia should come automatically from a dynamic analysis [18], being a natural consequence of the inclusion of mass and damping matrices in the equation of motion. Therefore, it should not be considered a priori either through Dynamic Increase Factor (DIF) or by sophisticated constitutive models. This choice is supported by numerical simulations [18,19,20]. It is noteworthy to mention that, at a local (finite element) level, the structural inertia is not able to modify the strength of the material. It has been specified that the model leads to mesh-independent results (validated in the frame of previous studies) in statics, which is linked to the fact that the random distributions of and depend on the volume of the finite element. This dependency has been given by Equations (1)–(7), and has been elaborated and validated in statics. It is very unreasonable and difficult to experimentally determine these relations as a function of the strain rate. Hence, we propose the following assumption: the evolution with the strain rate of the random distributions of the model parameters is not an input but an output of the numerical simulations. By doing so, it is apparent that the standard deviation of both and will be inferior to and . This point is physically relevant. Indeed, it is well-known that high-strength concrete is mechanically more homogeneous than normal concrete. In conclusion, the proposed assumption related to the evolution of the random distributions with strain rates are physically relevant but have to be validated.
2.4. Finite Element Procedure
The numerical development of the 3D probabilistic semi-explicit cracking model has been performed and presented in detail in the framework of a PhD work [32] on an in-house computational routine. This routine was employed in several simulations in the past [33,34,35,36]. Before starting the numerical analysis, it is necessary to assign random properties ( and ) for the each finite element according to a given probabilistic distribution, a procedure which was originally described in [37]. Once probabilistic properties have been assigned to the finite element mesh, boundary and initial conditions are provided, and a typical dynamic analysis is performed, usually adopting the Newmark-beta algorithm for the time-step integration.
3. Numerical Applications
The proposed numerical model has been conceived to analyze macroscopic crack propagation in concrete structures and not to analyze the cracking behavior of laboratory specimens subjected to simple loadings (uniaxial tension or compression, bending on prismatic specimens, etc.). The problem is to find, in the literature, experimental tests on structural elements without any reinforcement (the actual state of the proposed model does not considers rebars or fibers) devoted to the study of strain rate effect. Experimental data from L-shaped specimens [38] were selected in order to validate the model proposed here. These specimens were tested for several loading rates, ranging from quasi-static (0.25 mm/s) to very fast loading (4500 mm/s). Due the specimen geometry and boundary conditions, numerical simulations were performed in the plane stress condition. For each loading rate, 20 specimens were numerically simulated. The specimen’s geometry is shown in Figure 5. The mesh and boundary conditions are in Figure 6. The physical and modeling data are in Table 1. Displacements are applied and read 30 mm away from the free left edge (see Figure 6). The mesh was generated in the Gmsh open-source package [39] and crack patterns are visualized through the Paraview toolkit [40].
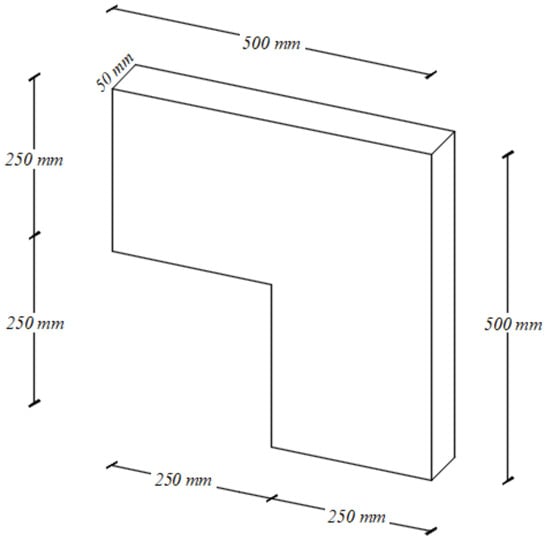
Figure 5.
Geometric data.

Figure 6.
Mesh and boundary conditions adopted.

Table 1.
Physical and modeling parameters for L-shaped specimen.
4. Results and Discussion
Twenty simulations for each loading rate were performed, generating twenty different crack patterns. Only one example of a representative crack pattern by loading rate is presented in this paper. Considering that, at most, one experimental load–displacement curve was provided for each loading rate (except for the loading rate of 3000 mm/s, where two experimental results were given), it can be considered that the proposed model correctly captures the global behavior in dynamics. In the load–displacement curves presented below (see Figure 7, Figure 8, Figure 9, Figure 10 and Figure 11), the black lines represent the experimental results, the gray lines are the results for each numerical specimen, and the red lines are the mean numerical results.

Figure 7.
Load–displacement curves for 0.25 mm/s.

Figure 8.
Load–displacement curves for 500 mm/s.

Figure 9.
Load–displacement curves for 1000 mm/s.

Figure 10.
Load–displacement curves for 3000 mm/s.
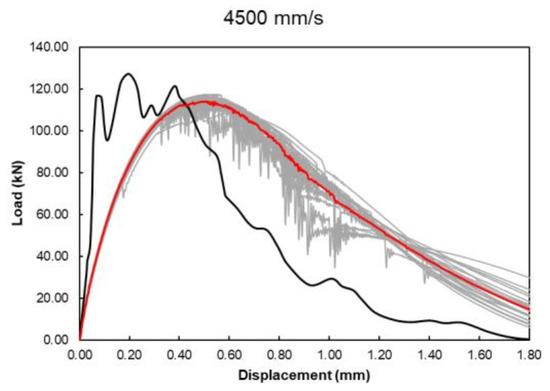
Figure 11.
Load–displacement curve for 4500 mm/s.
For some loading rates (2000 and 2500 mm/s, see [38]), the experimental load–displacement curve has not been recorded. It is probably an indication of the difficulty for the authors of this experimental work to measure the displacement on the specimen. Therefore, the comparison between the numerical and experimental results are not considered for these loading rates. In Figure 6 (quasi-static loading) and Figure 10 (4500 mm/s), the elastic behavior of the specimens is very different when experimental and numerical results are compared. Such a difference is possibly explained by the inappropriate displacement measurement in the experimental test, as displacements were read at the same location where the load was applied. This might have caused material failure in the neighboring region, leading to inaccurate data. Taking this reasoning for granted, it can be stated that the post-peak behavior was correctly reproduced, which is relevant here as the present model is mainly devoted to the propagation of a macroscopic crack.
The crack pattern for three loading rates, 0.25 (quasi-static loading), 500, and 2000 mm/s, are presented in Figure 12, Figure 13 and Figure 14, where missing elements are those completely damaged. These loading rates have been chosen, because they represent significant changes in the crack pattern. It is possible to observe that the crack pattern is highly dependent of the loading rate, both numerically and experimentally (Figure 12, Figure 13 and Figure 14). In the quasi-static regime (Figure 12), one macroscopic crack propagates horizontally from the corner of the L-shaped specimen. In the intermediate regime (Figure 13), the main macroscopic crack starts at the corner, but it is slightly oblique and a branching attempt appears. For a very fast loading rate (Figure 14), a strong change in the crack pattern is observed. The speed of crack propagation becomes so fast that the inertia at the crack tip forces it to split in two.

Figure 12.
Crack pattern for 0.25 mm/s.

Figure 13.
Crack pattern for 500 mm/s.

Figure 14.
Crack pattern for 2000 mm/s.
5. Concluding Remarks
The present work concerns the extension of a numerical cracking model, which was initially developed and validated for quasi-static loading, to also encompass dynamic loading. This model is a 3D probabilistic semi-explicit cracking model. Dynamic analyses were run, taking into account both the actual and apparent rate effect with an increasing loading rate. The actual (material) rate effect is modeled through an empirical Dynamic Increase Factor, which encompasses the effect of both micro-inertia and moisture (Stefan Effect). The apparent (structural) rate effect is naturally captured by including mass and damping matrices in the equation of motion. The main conclusions that can be drawn from the results are summarized as follows:
- The dispersion of the numerical results related to the load–displacement curves globally decreases with the loading rate. This means that the global behavior of the structural element is very dependent on the material rate effects.
- The crack pattern changes a lot of with the loading rate (numerically and experimentally). This means that the structural inertia and the damping effect play an important role on the cracking pattern.
- Globally, the comparison between the experimental and numerical results (load–displacement curves and crack pattern) indicates an acceptable relevancy for the proposed numerical model.
6. Perspectives for Future Works
Even though this first validation of the proposed numerical model in dynamic is encouraging, more validations with other structural experimental results are needed. It is especially important to validate more the assumption concerning the independency of the numerical results with the mesh size. It is also important to develop, in the future, the proposed numerical model to integrate rebars or fibers both in statics and dynamics.
Author Contributions
Conceptualization: P.R.; Methodology: P.R.; Software, G.C. and M.R.; Validation: G.C. and M.R.; Formal Analysis: G.C.; Investigation: P.R. and G.C.; Resources: G.C., E.F., F.R. and M.R.; Data Curation, P.R., G.C. and M.R.; Writing—original draft preparation: P.R. and G.C.; Writing—review and editing: P.R. and G.C.; Visualization: G.C.; Supervision: P.R., E.F. and F.R.; Project Administration: P.R., E.F. and F.R.; Funding Acquisition: P.R., E.F. and F.R. All authors have read and agreed to the published version of the manuscript.
Funding
The authors would like to thank Brazilian National Agency of Petroleum, Natural Gas and Biofuels (ANP) that through Financier of Studies and Projects (FINEP) partially funded this project through a research scholarship. The authors would also like to thank Brazilian National Council for Scientific and Technological Development (CNPq) and Brazilian Federal Agency for Support and Evaluation of Graduate Education (CAPES) for their financial support to this work.
Institutional Review Board Statement
Not applicable.
Informed Consent Statement
Not applicable.
Data Availability Statement
No new data were created or analyzed in this study. Data sharing is not applicable to this article.
Conflicts of Interest
The authors declare no conflicts of interest.
References
- Nilimaa, J.; Nilforoush, R. A direct tensile strength testing method for concrete from existing structures. CivilEng 2023, 4, 333–344. [Google Scholar] [CrossRef]
- Rossi, P. A physical phenomenon which can explain the mechanical behaviour of concrete under high strain rates. Mater. Struct. 1991, 24, 422–424. [Google Scholar] [CrossRef]
- Rossi, P. Dynamic behaviour of concretes: From the material to the structure. Mater. Struct. 1994, 27, 319–323. [Google Scholar] [CrossRef]
- Rita, M.; Rossi, P.; Fairbairn, E.; Ribeiro, F. Determination of the Probabilistic Properties of the Critical Fracture Energy of Concrete Integrating Scale Effect Aspects. Appl. Sci. 2024, 14, 462. [Google Scholar] [CrossRef]
- Rita, M.; Rossi, P.; Fairbairn, E.; Ribeiro, F.; Tailhan, J.; Andrade, H.; Mota, M. Three-Dimensional Probabilistic Semi-Explicit Cracking Model for Concrete Structures. Appl. Sci. 2024, 14, 2298. [Google Scholar] [CrossRef]
- Rita, M.; Rossi, P.; Fairbairn, E.; Ribeiro, F.; Tailhan, J.; Andrade, H.; Mota, M. Parallelization Strategy for 3D Probabilistic Numerical Cracking Model Applied to Large Concrete Structures. Buildings 2024, 14, 2327. [Google Scholar] [CrossRef]
- Rossi, P.; Wu, X.; Le Maou, F.; Belloc, A. Scale effect on concrete in tension. Mater. Struct. 1994, 27, 437–444. [Google Scholar] [CrossRef]
- Phan, T.; Tailhan, J.; Rossi, P. 3D numerical modelling of concrete structural element reinforced with ribbed flat steel rebars. Struct. Concr. 2013, 14, 378–388. [Google Scholar] [CrossRef]
- Nader, C.; Rossi, P.; Tailhan, J. Numerical strategy for developing a probabilistic model for elements of reinforced concrete. Struct. Concr. 2017, 18, 883–892. [Google Scholar] [CrossRef]
- Nader, C.; Rossi, P.; Tailhan, J. Multi-scale strategy for modeling macroscopic cracks propagation in reinforced concrete structures. Cem. Concr. Compos. 2019, 99, 262–274. [Google Scholar] [CrossRef]
- Rossi, P. Determination of Toughness Characteristics of Concretes. Curr. Trends Civ. Struct. Eng. 2023, 10, 1–7. [Google Scholar]
- Rossi, P.; Toutlemonde, F. Effect of loading rate on the tensile behaviour of concrete: Description of the physical mechanisms. Mater. Struct. 1996, 29, 116–118. [Google Scholar] [CrossRef]
- Rossi, P.; Van Mier, J.; Toutlemonde, F.; Le Maou, F.; Boulay, C. Effect of loading rate on the strength of concrete subjected to uniaxial tension. Mater. Struct. 1994, 27, 260–264. [Google Scholar] [CrossRef]
- Rossi, P.; Acker, P.; Francois, D. Measurements of the fracture toughness KIC of concrete. Fracture 1984, 84, 2833–2839. [Google Scholar]
- Rossi, P. Fissuration du béton: Du Matériau à la Structure-Application de la Mécanique Linéaire de la Rupture. Thèse de Doctorate, Laboratoire Central des Ponts et Chaussées, Paris, France, 1986. [Google Scholar]
- Rossi, P.; Coussy, O.; Boulay, C.; Acker, P.; Malier, Y. Comparison between plain concrete toughness and steel fibre reinforced concrete toughness. Cem. Concr. Res. 1986, 16, 303–313. [Google Scholar] [CrossRef]
- Rossi, P. Mode I Crack Propagation in Concrete Structures under Impact Loadings. Curr. Trends Civ. Struct. Eng. 2022, 9. [Google Scholar] [CrossRef]
- Ožbolt, J.; Sharma, A.; Reinhardt, H. Dynamic fracture of concrete–compact tension specimen. Int. J. Solids Struct. 2011, 48, 1534–1543. [Google Scholar] [CrossRef]
- Ožbolt, J.; Riedel, W.; Grunwald, C. Modelling the response of concrete structures from strain rate effects to shock-induced loading. In Understanding the Tensile Properties of Concrete; Woodhead Publishing: Sawston, UK, 2024; pp. 327–378. [Google Scholar]
- Ožbolt, J.; Bošnjak, J.; Sola, E. Dynamic fracture of concrete compact tension specimen: Experimental and numerical study. Int. J. Solids Struct. 2013, 50, 4270–4278. [Google Scholar] [CrossRef]
- Vegt, I. Concrete in Dynamic Tension: The Fracture Process. 2016. Available online: https://repository.tno.nl/SingleDoc?find=UID%20c7ed658d-0179-4d9c-9953-c449b37b151a (accessed on 27 June 2023).
- Bede, N.; Ožbolt, J. Effect of dynamic loading on concrete properties. In Numerički Postupci. Zbornik Radova Mini-Simpozija; Sveučilište u Zagrebu, Građevinski fakultet: Zagreb, Croatia, 2019; pp. 105–115. [Google Scholar]
- Gambarelli, S.; Ožbolt, J. Dynamic fracture of concrete in compression: 3D finite element analysis at meso-and macro-scale. Contin. Mech. Thermodyn. 2020, 32, 1803–1821. [Google Scholar] [CrossRef]
- Mosig, O.; Curbach, M. The crack propagation velocity as a reason for the strain rate effect of concrete: An analytical model. Civ. Eng. Des. 2020, 2, 123–130. [Google Scholar] [CrossRef]
- Ožbolt, J.; Sharma, A.; İrhan, B.; Sola, E. Tensile behavior of concrete under high loading rates. Int. J. Impact Eng. 2014, 69, 55–68. [Google Scholar] [CrossRef]
- Pedersen, R.R. Computational modelling of dynamic failure of cementitious materials. Ph.D. Thesis, Delft University of Technology, Delft, The Netherlands, 2010. [Google Scholar]
- Pereira, L.; Weerheijm, J.; Sluys, L. A new effective rate dependent damage model for dynamic tensile failure of concrete. Eng. Fract. Mech. 2017, 176, 281–299. [Google Scholar] [CrossRef]
- Ayhan, B.; Lale, E. Modeling strain rate effect on tensile strength of concrete using damage plasticity model. Int. J. Impact Eng. 2022, 162, 104132. [Google Scholar] [CrossRef]
- Zhou, W.; Tang, L.; Liu, X.; Ma, G.; Chen, M. Mesoscopic simulation of the dynamic tensile behaviour of concrete based on a rate-dependent cohesive model. Int. J. Impact Eng. 2016, 95, 165–175. [Google Scholar] [CrossRef]
- Knell, S.; Sauer, M.; Millon, O.; Riedel, W. Mesoscale simulation of concrete spall failure. Eur. Phys. J. Spec. Top. 2012, 206, 139–148. [Google Scholar] [CrossRef]
- Hao, Y.; Hao, H.; Zhang, X. Numerical analysis of concrete material properties at high strain rate under direct tension. Int. J. Impact Eng. 2012, 39, 51–62. [Google Scholar] [CrossRef]
- Costa, G.L.X. Modeling Dynamic Concrete Fracture with Applications to Petroleum Industry. Ph.D. Thesis, Federal University of Rio de Janeiro, Rio de Janeiro, Brazil, 2023. [Google Scholar]
- Costa, G.; Faria Telles, J.; Fairbairn, E.; Ribeiro, F. Thermo-chemo-mechanical analysis of concrete structures considering aging and damage. In Proceedings of the XLI Ibero-Latin American Congress on Computational Methods in Engineering, Porto, Portugal, 13–16 November 2020; Volume 2. [Google Scholar]
- Costa, G.; Brant, C.; Andrade, R.; Fairbairn, E. Finite Element Analyses of mesh-objectivity for Smeared, Damage and Discrete models applied to concrete cracking. In Proceedings of the XLII Ibero-Latin American Congress on Computational Methods in Engineering, Alagoas, Brazil, 11–14 November 2021; Volume 3. [Google Scholar]
- Brant, C.; Costa, G.; Andrade, R.; Fairbairn, E. Finite Element modelling of cracking in fiber-reinforced concrete beams. In Proceedings of the XLII Ibero-Latin American Congress on Computational Methods in Engineering, Alagoas, Brazil, 11–14 November 2021; Volume 3. [Google Scholar]
- Costa, G.; Brant, C.; Mota, M.; Andrade, R.; Fairbairn, E.; Rossi, P. Investigating spurious cracking in finite element models for concrete fracture. Comput. Concr. 2023, 31, 151–161. [Google Scholar]
- Rita, M. Implementation of a 3D Macroscopic Probabilistic Model for Semi-Explicit Concrete Cracking. Ph.D. Thesis, Federal University of Rio de Janeiro, Rio de Janeiro, Brazil, 2022. [Google Scholar]
- Ožbolt, J.; Bede, N.; Sharma, A.; Mayer, U. Dynamic fracture of concrete L-specimen: Experimental and numerical study. Eng. Fract. Mech. 2015, 148, 27–41. [Google Scholar] [CrossRef]
- Geuzaine, C.; Remacle, J. Gmsh: A 3-D finite element mesh generator with built-in pre-and post-processing facilities. Int. J. Numer. Methods Eng. 2009, 79, 1309–1331. [Google Scholar] [CrossRef]
- Ahrens, J.; Geveci, B.; Law, C.; Hansen, C.; Johnson, C. Paraview: An end-user tool for large-data visualization. Vis. Handb. 2005, 717, 50038-1. [Google Scholar]
Disclaimer/Publisher’s Note: The statements, opinions and data contained in all publications are solely those of the individual author(s) and contributor(s) and not of MDPI and/or the editor(s). MDPI and/or the editor(s) disclaim responsibility for any injury to people or property resulting from any ideas, methods, instructions or products referred to in the content. |
© 2024 by the authors. Licensee MDPI, Basel, Switzerland. This article is an open access article distributed under the terms and conditions of the Creative Commons Attribution (CC BY) license (https://creativecommons.org/licenses/by/4.0/).