1. Introduction
Fossil fuels that are in use today are primarily characterized by high emissions of CO
2 and other pollutants, which worsen the state of the global climate. Generally, the rate of electricity consumption is significantly greater than the rate of electricity usually produced; thus, appropriate concepts are required to propose solutions. Power-to-X has been the energy chain strategy for transforming electricity into energy carriers such as gas, heat, and fuel, which impact multiple industries [
1,
2,
3,
4,
5,
6]. Currently, a vast amount of research has been focusing on employing an integrated strategy for the development of the reversible solid oxide cell technology [
7,
8,
9,
10,
11]. The dual use both as a fuel cell and as an electrolyzer attracts advancements in the technology. Many studies utilizing advanced techniques have provided insights into the system design aspects so far [
12,
13,
14,
15,
16,
17]. Complex fuel sources such as biomass mixtures with different CO, H
2, CO
2, and CH
4 species can be processed by the r-SOC component internally. However, safe operation requires consistency; thus, the management of impurities from the fed fuel stream including complex hydrocarbons and tar species benefit from a pre-cleaning using an external reformer that has been utilized in several studies [
18,
19,
20,
21,
22,
23,
24]. The pre-reforming process using a suitable pre-reformer component pre-cleans such product streams of varying liquid or gas compositions, resulting in syngas with or without oxygen content that is pure enough to be introduced for SOC operation [
25,
26,
27,
28]. In the past, conventional computational methods and experimental measurements were widely used by the authors to predict the detailed design and thermochemical reforming performance [
29,
30,
31,
32]. In the current research, a combination of so-called traditional methods comprising experimental and numerical means have been blended with artificial intelligence (AI)-based machine learning (ML) modeling where physics-based data have been generated and utilized to systematically evaluate syngas preparation for SOC feed purposes. Recently, it has been demonstrated that AI-based machine learning accurately forecasts energy processes inside the hydrogen economy chain [
33,
34,
35,
36,
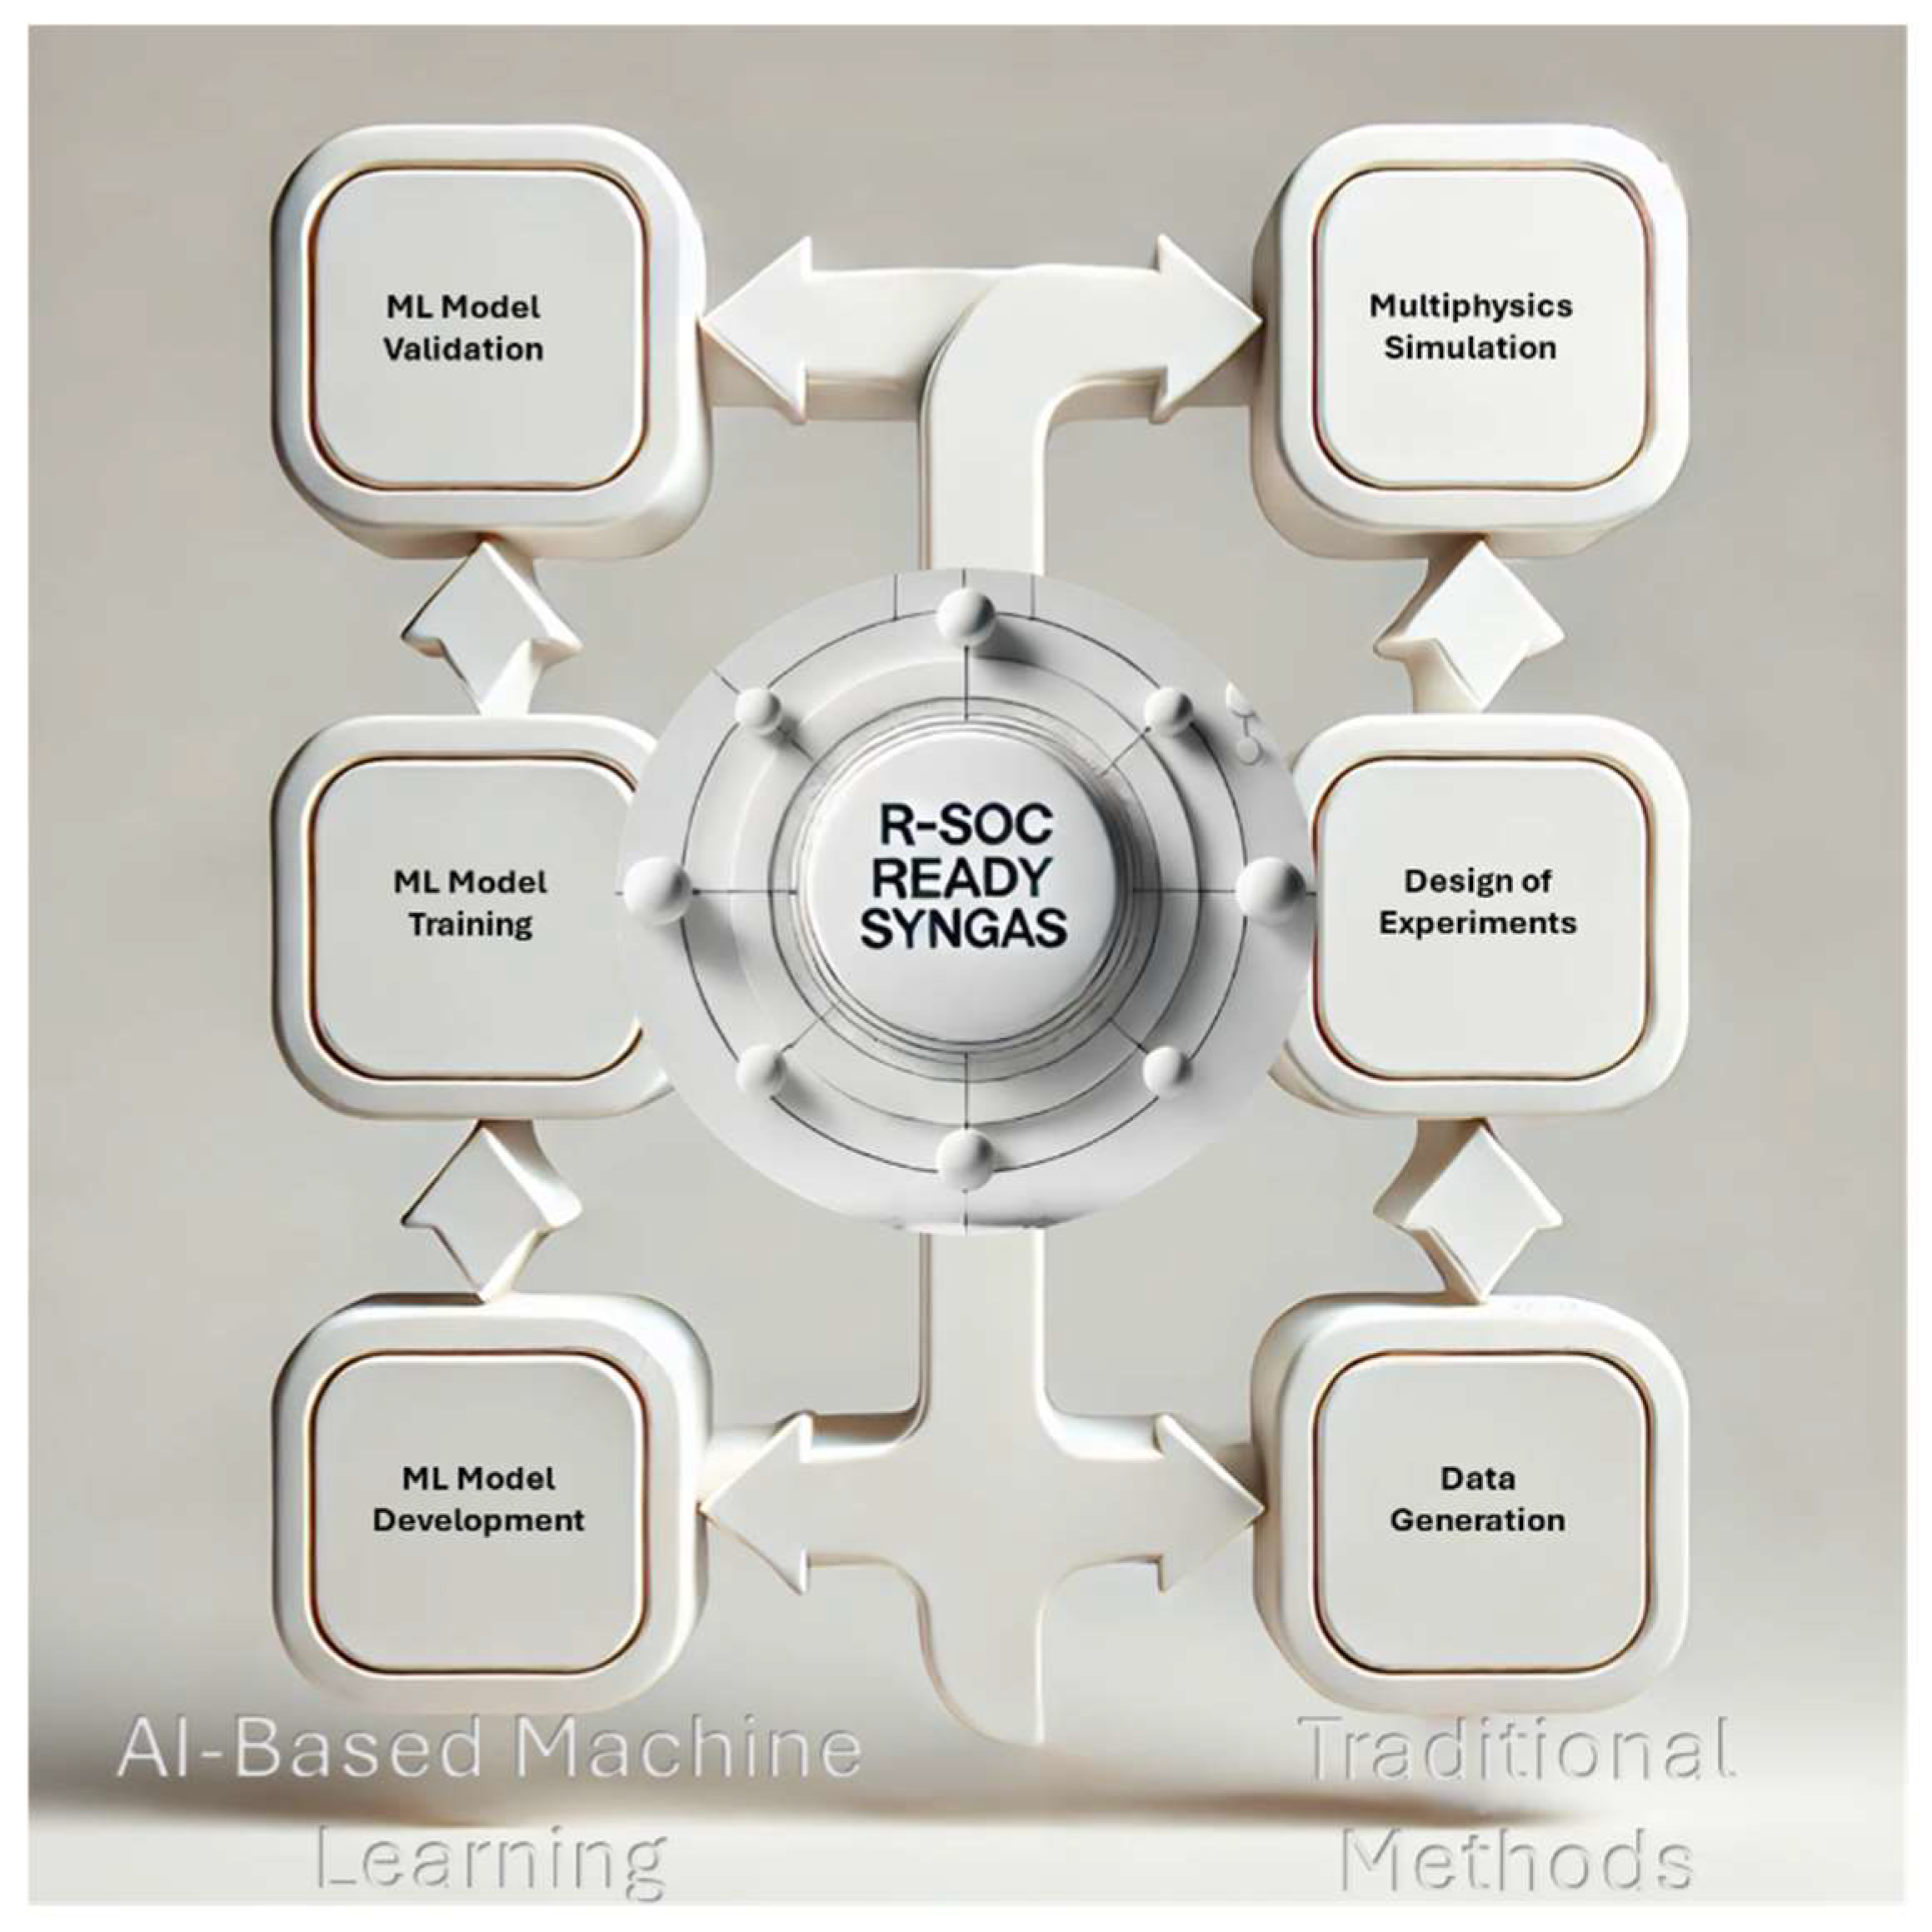
37]. Thus, the integrated use of proven methods simplifies the management of data acquisition and processing, software, and hardware limitation challenges. In this current study, large data sets generated by empirically validated multiphysics simulation models were processed by accelerated AI-based machine learning models that demonstrated excellent scalability and showed a variety of prediction options using the power of machine learning (ML). The approach is depicted in
Figure 1.
To ensure safe SOC operation using syngas variants, the pre-reformed fuel needs to be carefully assessed. The pre-reforming process prior to SOC operation is beneficial as it prevents oxygen-rich fuel from entering the fuel side of a solid oxide cell, which could result in component degradation and safety issues. High temperatures are essential for the steam-reforming process due to the endothermic nature of steam reforming but also to reduce the chances of carbon deposition. The presence of oxygen in the fuel gas composition, for example, also acts as a reforming agent, thus inducing highly exothermic reactions that may produce both heat and the necessary steam for steam methane reforming processes. Hence, syngas containing small amounts of O2 can be favorable. However, the amount of methane that effectively participates in the reforming reaction in the initial process stages will influence the temperature distribution at this inlet vicinity of the SOC component, which will significantly influence the thermomechanically induced stress field of the SOC. In addition, oxygen must already be depleted.
Hence, carefully understanding the solid oxide cell inlet conditions provided by the direct fuel output of the pre-reforming process and the complex thermofluid flow processes coupled with chemically reacting species transport needs to be investigated. The current research aims to address these challenges to enable controlled solid oxide cell operation in practice while determining conditions predicted by a machine learning model developed based on physics-based data. This research demonstrates the power of the used work frame supporting an accelerated and safe assessment of high-quality, cleaned syngas generation for continuous r-SOC operation.
2. Methodology
Computational modeling is becoming more sophisticated in investigating the prohibitive syngas-fed reforming processes, and the demand for detailed descriptions of the flow, thermal, and chemical processes has increased in recent years. The presented study was carried out at the research laboratories of the Chair of Energy Systems at the Technical University of Munich (TUM). For the thorough investigation of the pre-reforming process, the current demonstration used an experimentally validated computational fluid dynamics (CFD) model of a planar-type pre-reformer component designed for both heated and adiabatic operation. The employed physical model is based on a previous study where the details of the full pre-reformer component and experimental measurements are given in references [
31,
32]. Similarly, the governing equations describing the fluid flow, heat transfer, and the chemically reacting species transport are detailed. The component model consists of sub-components including metal plates with air channels, mesh structures, a catalyst, and metal frames. The operating principle is such that metal plates with air channels are used to separate the airflow and the fuel gas to avoid any gas mixing. Hot air is used as the major heating source and flows through the air channels. Two nickel mesh structures are placed between the air channel plates. The fuel gas side uses porous mesh structures to reduce the component manufacturing effort by avoiding an additional channel design on the fuel gas side. A nickel catalyst is sandwiched between the wire mesh structures to enable the chemical reactions to occur. The generated data considered the chemically reacting species transport simulation of the oxygen-containing syngas that involved “mixed reforming” or tri-reforming (TR) reactions [
38].
Thus, the chemically reacting CH
4, CO
2, H
2O, and O
2 transport also encompasses the partial oxidation of methane in addition to the steam reforming, and the water–gas shift reactions, which can be expressed as
Figure 2 illustrates the computational model showing the flow and geometrical symmetry while depicting its constituents, numerical grid, and boundaries. Details of the experimental measurements and deployment and the validation of the results of the CFD model are given in Ref. [
32].
Using the counter-current flow principle, syngas-containing fuel is released into the pre-reformer. As the fuel comes into contact with the catalyst, chemical reactions start. The experimental measurement results from the reference study were used to approve the re-constructed model results to extend and enhance its thermochemistry modeling capability, incorporating oxygen-containing syngas compositions. This allows for a deeper understanding of the reforming processes operating on syngas. The partial oxidation reactions of methane were considered to assess the pre-reformer performance efficiently. Data sets were generated systematically in conjunction with the Design of Experiments (DoE) in the next two steps. In a recent research article [
39], a cost-effective and sustainable artificial intelligence (AI)-based machine learning modeling approach was introduced to predict the syngas-fed pre-reforming process integrated with gasification and solid oxide fuel cell technology. This highlights the next step after the data are generated, as demonstrated in
Figure 1 on the left section of the graphic.
The current demonstration details the generated data assessment for the implementation of the machine learning modeling. This study demonstrates the development and effective use of a supervised machine learning model. After training and using the model for new data generation, the accuracy of the model was evaluated and the relationship between multiple operating parameters influencing the reforming process could be determined, which was the proceeding step. This ensures that all individual and interaction parameters of the examined reformer variables are considered in the most efficient way. As the performance of the reforming process determines the inlet temperature of the solid oxide cell stack, as well as the gas composition, particular attention was given to improving the understanding and optimizing its outlet conditions. In addition, the integrated approach offers a sustainable use of materials and research resources, which is a cost-effective way to assess the potential of quality syngas preparation for SOC operation early in the process. The investigation targeted the assessment of the reformer outlet temperature concerning its dependence on five factors each set at three parameter value levels. In this context, the notation factor refers to a variable, and the result is the quantitative prediction of the parameter of interest. The Design of Experiments application accounts for the interactions and non-linearity of the investigated parameters.
Table 1 illustrates the data parameters used in this current demonstration.
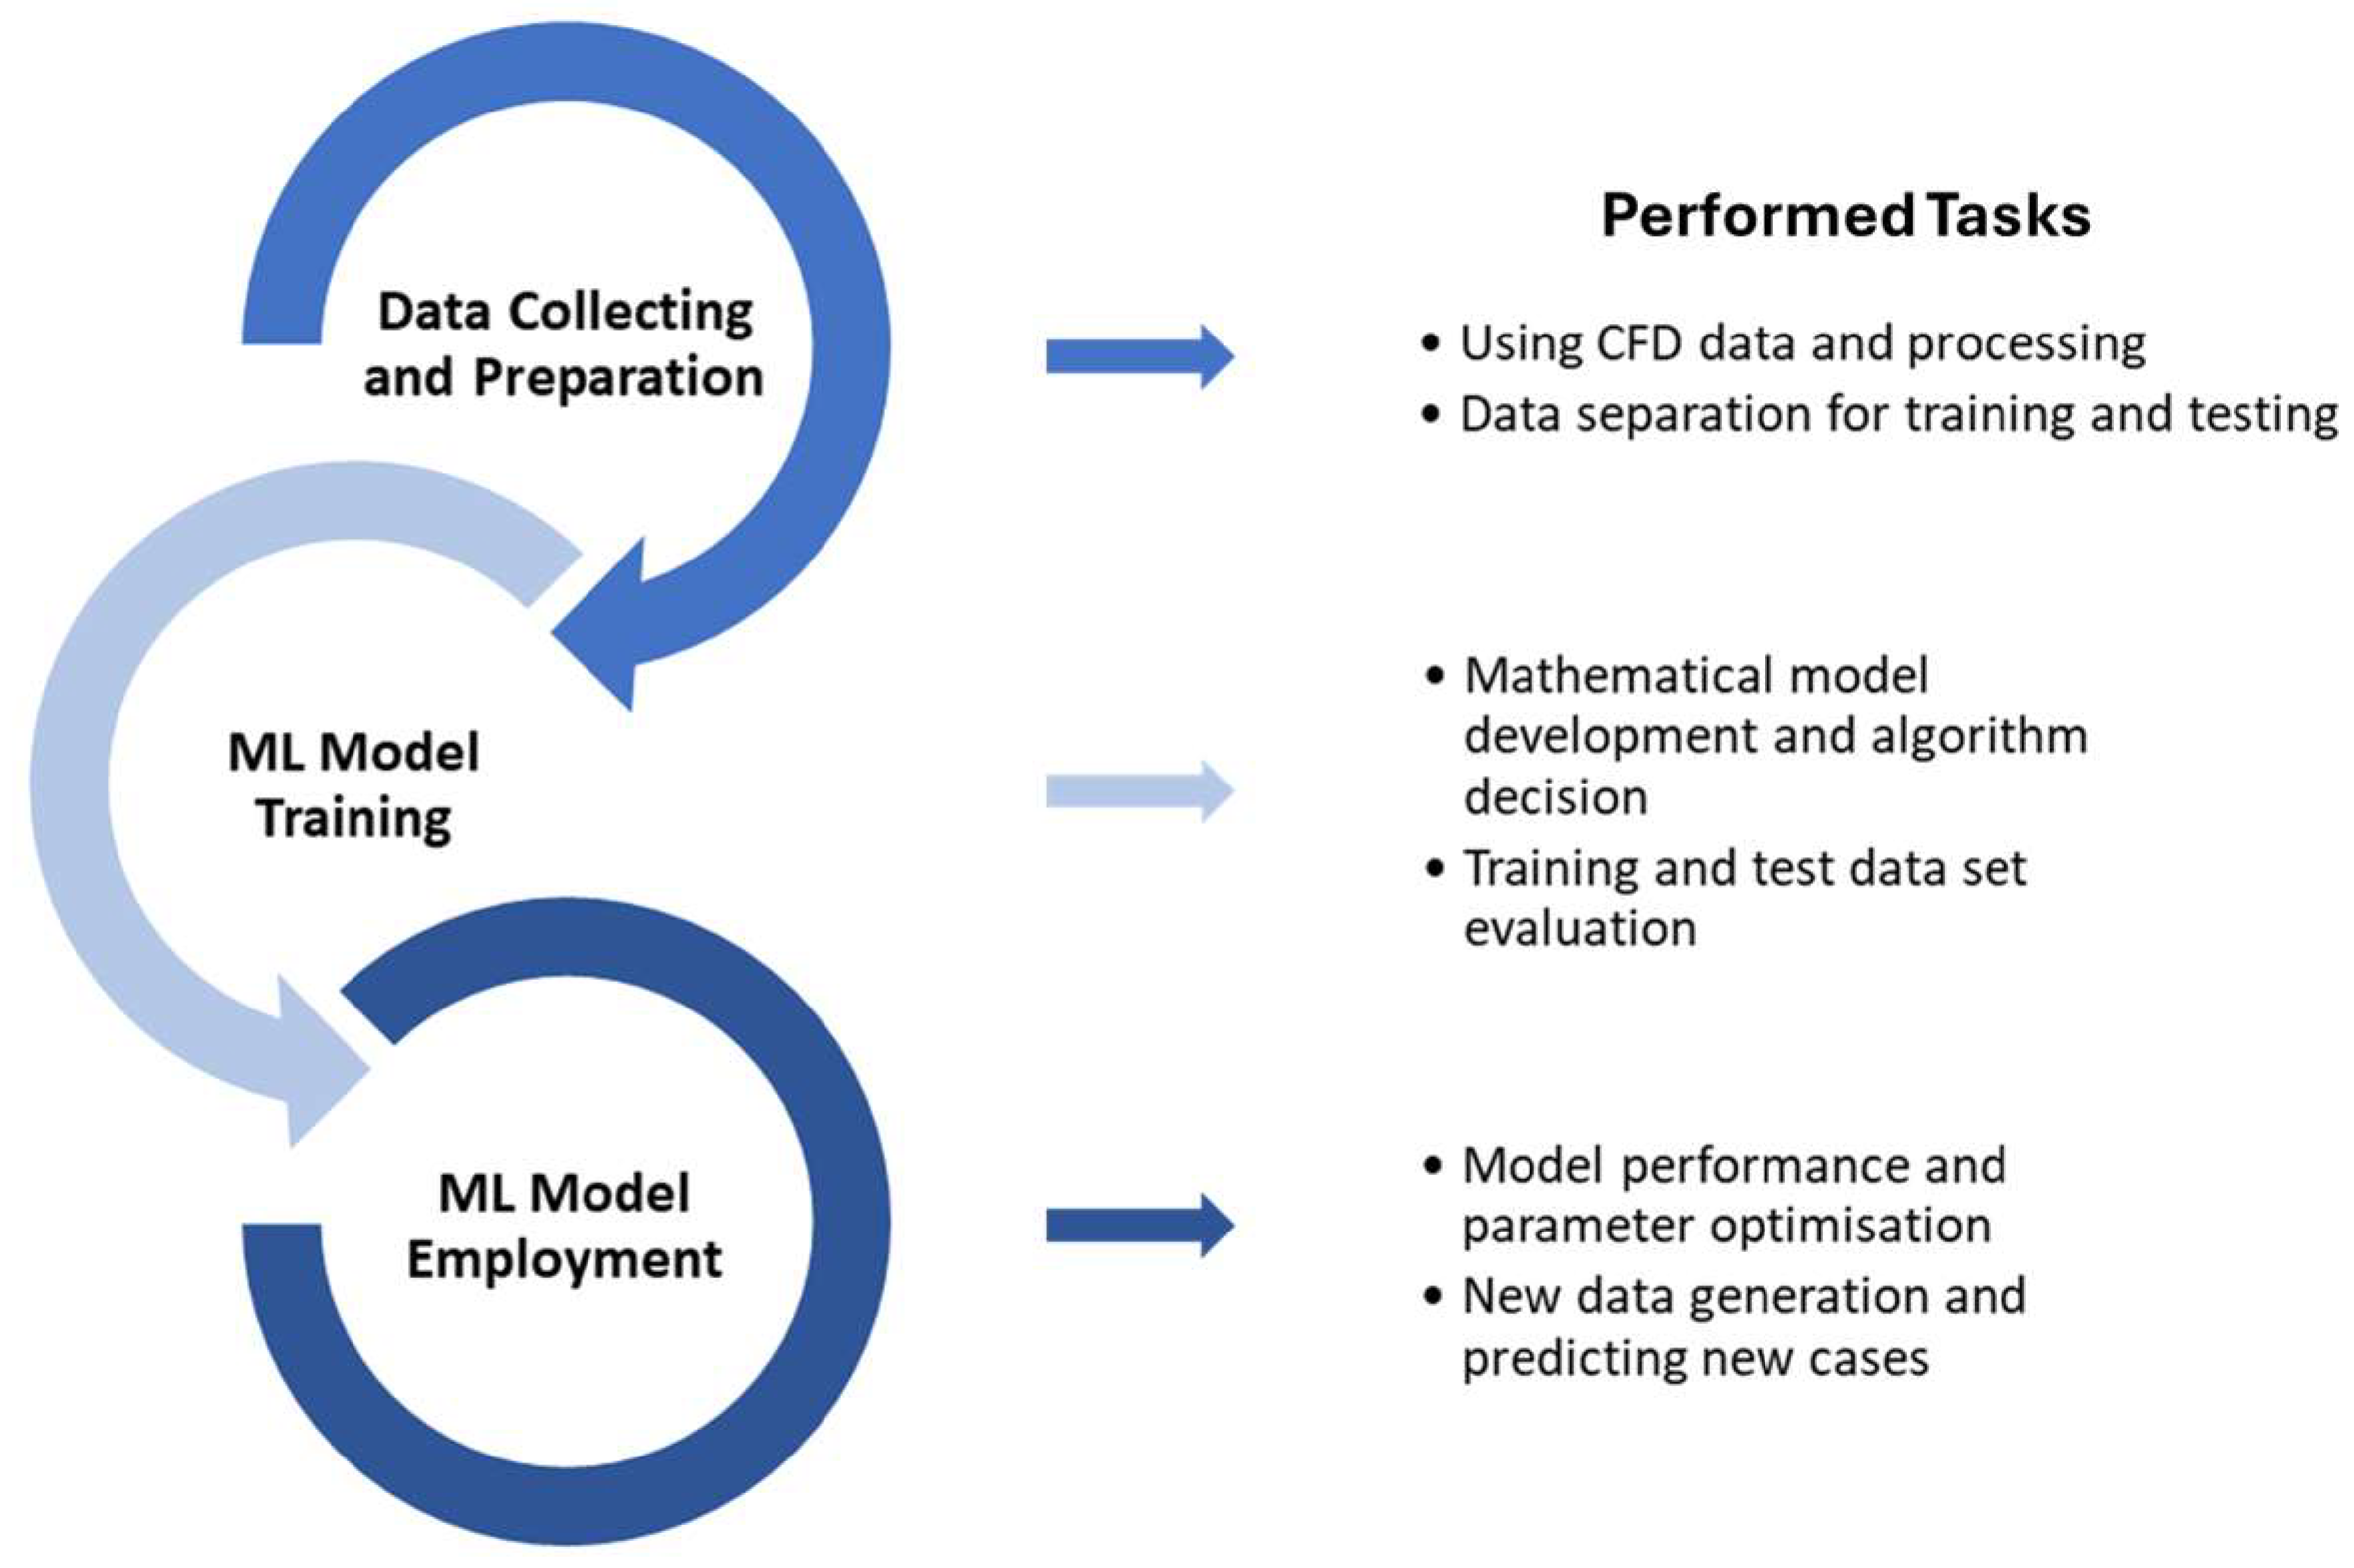
The porosity of the catalyst layer depicts the substrate’s volume void fraction. Three feasible gas compositions were considered, including oxygen contents ranging between 0%, 5%, and 10%. Mass flow rates of air and fuel were also selected as variables denoted as A, B, and C. The catalyst material porosities were chosen based on practical application values. Forty-eight simulation cases considering the parameters and factor levels were calculated using CFD. The results of the predictions were used in three stages for the machine learning (ML) process as depicted in
Figure 3.
3. Results and Discussion
Based on the performed numerical CFD predictions, the collected data are used and assessed thoroughly for ML model development preparation. To understand the best combinations of predicted parameter data interactions, a three-dimensional scatter plot for initial data visualization is used. Three parameters are plotted in x, y, and z directions within a cube considering the fuel outlet temperature as the response variable. The evaluation considers the relationship between the parameters themselves and their collective effects on the pre-reformer fuel outlet temperature.
Figure 4 depicts the results considering the oxygen content in the syngas, fuel, and air flow rates.
There is a visible cluster of data points in the lower left region of the cube, with several points tightly packed together in
Figure 4a indicating a strong correlation between the parameters in this region of the parameter space. The proximity of the points suggests that certain combinations of the variables tend to occur together frequently. This may imply a stable or common operational range for these parameters.
Figure 4b shows that data points are somewhat more scattered compared to the first plot, but a subtle clustering can still be observed toward the center and lower sections of the cube. The wider distribution suggests weaker correlations between the parameters represented here. The system appears to explore a broader range of parameter values without strong dependencies, but the presence of mild clustering in the center may still indicate preferred combinations of values in the middle range of the variables. In the third orientation view of the first set of data, a denser cluster of points toward the center and bottom right of the cube are visible, indicating a region of higher proximity between data points (
Figure 4c).
The relatively dense clustering in the central and bottom right regions points to a notable correlation between the parameters in this region. Similar to the data in
Figure 4a, this could suggest that certain parameter combinations are more likely to occur, potentially indicating a constrained or optimized range of operation for those variables. Considering the second data set where the oxygen content has been substituted with the parameter temperature, the data points depicted in
Figure 4d are more evenly distributed, with only slight clustering toward the edges of the cube. The relatively even distribution suggests a lack of strong correlation between the parameters in this case, suggesting that the variables can vary more independently of each other, with no particular pattern of interaction that leads to clustering. There is a more distinct clustering of points toward the middle region of the cube, with fewer points appearing near the edges as shown in
Figure 4e, where the clustering toward the center suggests that mid-range values for the three parameters are more commonly observed. This indicates that the component operates within a certain range of parameter combinations.
The relatively tight clustering may also suggest a correlation in how the variables interact to achieve certain operational conditions. The last perspective illustrated in
Figure 4f shows that the data points exhibit a wide distribution, with only minor clustering near the top section of the cube. The wide scattering of points implies weaker correlations between the variables in this plot, similar to the data in
Figure 4d. The minor clustering near the top might indicate a slight preference for certain parameter combinations, but overall, the component appears to operate more flexibly across the parameter space. In general, the proximity of data points in the plots suggests that some parameters tend to vary collectively, with certain combinations of values occurring more frequently. In plots with more distinct clusters, this correlation is stronger, meaning that the variables involved likely exhibit some form of dependency or interaction that constrains their values to a narrower range. In contrast, the plots with more evenly distributed points indicate that the parameters in those cases do not exhibit strong correlations. Hence, the presence of clustering in certain plots can also indicate preferred operational conditions for the pre-reformer operation. These clusters may represent optimized ranges where the component performs efficiently or where specific design constraints are met.
Further, main and collective effect analyses were performed to shed light on these aspects.
Figure 5 gives detailed insights into the collective effects of key operational parameters on the fuel outlet temperature (Trefout). These plots, which include bar charts and 3D response surfaces, reveal the relationships between the input air flow, fuel flow, air temperature, catalyst porosity, and oxygen content parameters, highlighting their relative importance in influencing the components’ thermal behavior.
The bar chart given in
Figure 5a quantifies the relative influence of each investigated individual parameter on the fuel outlet temperature. It shows that the air flow rate has the most significant effect on the outlet temperature, with a magnitude far surpassing all other variables. This suggests that managing the air flow rate is the most critical factor in controlling the temperature of the pre-reformer. The dominance of airflow in controlling the temperature is expected, as increased airflow promotes chemical reactions, leading to higher outlet temperatures. Its large effect size indicates that even small adjustments in airflow can result in a substantial temperature change. While the impact of air temperature is considerably less than that of the airflow, it still plays an important role in modulating the outlet temperature. This reflects the fact that higher incoming air temperatures directly contribute to higher thermal energy in the system. The catalyst porosity, oxygen, and fuel flow have a much smaller effect on the fuel outlet temperature, as indicated by the diminished bars. The relatively minor influence of the fuel flow and catalyst porosity may suggest that their impact on temperature is more secondary and indirect, influencing the efficiency of the chemical reactions rather than directly affecting the heat output. The 3D response surface plot in
Figure 5b depicts the relationship between fuel flow and air flow and their combined effect on the outlet temperature. The color gradient represents temperature changes, with darker red corresponding to higher temperatures and deep blue indicating lower temperatures. Their interaction reveals that increasing both fuel and air flow results in a temperature rise, but the air flow rate appears to have a stronger influence. This confirms the finding from the main effects plot that airflow is the dominant factor in temperature control. The steep gradient in temperature as air flow increases suggests that this parameter should be carefully managed to avoid excessive heat, which could lead to overheating or inefficiency in the system. The curvature of the surface indicates a non-linear relationship between these parameters and temperature. While increasing fuel flow at lower air flows results in a moderate temperature rise, combining high air flow and fuel flow rates leads to a more significant increase in temperature, demonstrating how the interaction between these variables can compound their effects.
Figure 5c shows the fuel flow and air temperature interaction effect on the outlet temperature. The surface displays similar non-linear effects, though the gradients are less steep compared to the previous air flow effect. Furthermore, the surface result indicates that air temperature has a moderate effect on fuel outlet temperature, but the changes are smoother than those observed for air flow. This suggests that, while air temperature influences the thermal behavior of the reformer, its effect is less drastic compared to air flow contribution.
The increasing fuel flow also raises the outlet temperature, but the overall gradient is less dominant than in the previous surface. This implies that while fuel flow contributes to temperature control, it does so more gradually, making it a parameter that can be adjusted without causing large, abrupt changes in component’s behavior. The 3D response surface given in
Figure 5d shows the combined effect of air flow and air temperature on the fuel outlet temperature. The color gradient illustrates how changes in these variables affect the outlet temperature. The plot again highlights that air flow has a dominant effect on temperature, as indicated by the steep gradient along the air flow axis. Even at lower air temperatures, increasing the air flow leads to a significant rise in temperature. Interestingly, the combination of high air temperature and high air flow results in the highest outlet temperatures, confirming the superimposed effect of these parameters. This suggests that both factors should be optimized simultaneously to avoid excessive heating that could reduce system efficiency; thus, synergistic effects between parameters need to be accounted for.
3.1. Machine Learning (ML) Model Development
After an extensive data screening and assessment process, reliable data were generated for use in machine learning model development. This data set forms the foundation for building an accurate model, which was enhanced by incorporating new data points that reflect complex relationships between the pre-reformer outlet temperature and five relevant parameters. To capture these relationships, both quadratic and cubic terms were considered in the model development phase, ensuring that non-linear interactions were properly represented. A multi-regression mathematical model was selected due to its ability to account for categorical variables, such as gas composition. In particular, the actual oxygen content was incorporated with specified factor levels to reflect its critical influence on the component’s behavior. This method ensures a more comprehensive understanding of how different factors interact within the process. Given the nature of the problem and the quantitative nature of the response variable (pre-reformer fuel outlet temperature), the regression approach was deemed the most suitable for modeling. It allows for accurate predictions while preserving interpretability, which is critical for practical applications in industrial settings.
3.2. Model Training Based on Machine Learning (ML)
The training process began by splitting the data set into training and testing subsets, where the training set was used to develop the model, and the testing set was reserved for evaluation. This approach ensures that the model is not overfitted to the training data and can generalize to new, unseen data. The multi-regression model, which was built based on the data shown in
Figure 6, was iteratively trained to optimize its coefficients for predicting the pre-reformer outlet temperature.
Figure 6 depicts the relationship between the predicted responses (y-axis) and the true responses (x-axis) for the test data, highlighting the model’s predictive performance. The points are scattered closely along the diagonal line, which represents the ideal case where predicted values perfectly match the actual values. The close proximity of the red data points to this line indicates that the model has been well-trained and is capable of making accurate predictions. This strong alignment between predicted and true values reflects the model’s ability to capture the complex interactions among input variables and translate them into reliable predictions. Minor deviations from the diagonal line show areas where the model may have slightly under- or over-predicted the temperature, but these deviations are small, suggesting high accuracy.
The visualization in
Figure 6 confirms the fact that the machine learning model is effectively predicting the pre-reformer outlet temperature based on the multi-regression framework. It also emphasizes that the model’s predictions generalize well to unseen test data, further supported by the performance metrics obtained through cross-validation. A k-fold cross-validation technique was applied to further refine the model and assess its stability. The data were divided into 10 folds, with the model being trained on 9 folds while the remaining fold was used for validation. This process was repeated 10 times, each time with a different fold as the validation set, which provided a robust estimate of the model’s performance by averaging the results across all iterations. This method not only reduced the risk of overfitting but also helped in assessing how consistently the model performed across different subsets of data. Details of the procedure are given in Ref. [
35].
3.3. ML Model Validation
To evaluate the model’s ability to adapt to new data and identify any issues, validation was carried out. The Root-Mean-Squared Error (RMSE) is derived from the square root of the Mean Squared Error (MSE) and offers an average measure of the absolute difference between predicted and actual values, where a lower RMSE signifies better performance. The developed model reached values of RMS = 18.37; RMS/Ym = 0.035; and MSE of 337.64. The R-squared (R
2) metric was also employed to gauge how much of the variance in the target variable is explained by the model, reaching a value of 0.956 within a confidence interval of 95%. The methodology enhances precision and reliability in estimations, supporting robust conclusions and informed decision making prior to comparing it with the predicted sample CFD results shown in
Table 2.
The comparison between the machine learning model’s predictions and the results from 3D CFD simulations offers a direct validation of the model’s accuracy across multiple operational conditions. The low percentage error across all five cases indicates a strong agreement between the ML model’s predictions and the CFD results, which are traditionally considered highly accurate but computationally expensive. The largest error is only 1.16% in Case 5, with other cases showing errors as low as 0.21% and even negative values, indicating slight over-prediction. This table demonstrates the reliability of the ML model for real-world application assessment, particularly in predicting fuel outlet temperatures under varying conditions of fuel flow rate, air flow rate, air temperature, oxygen content, and catalyst configuration. The minimal errors validate the feasibility of using the machine learning model once established as a design tool in place of more resource-intensive CFD simulations. The model’s high accuracy makes it a viable option for screening and optimizing thermal management strategies in fuel reformers, reducing potential temperature gradients at the fuel cell stack inlet, and achieving process optimization with less computational overhead. In summary, the machine learning model provides a highly accurate, computationally efficient alternative to CFD simulations, as demonstrated by its predictive performance in
Table 2. Its ability to handle varying input parameters and still maintain accuracy makes it a robust tool.
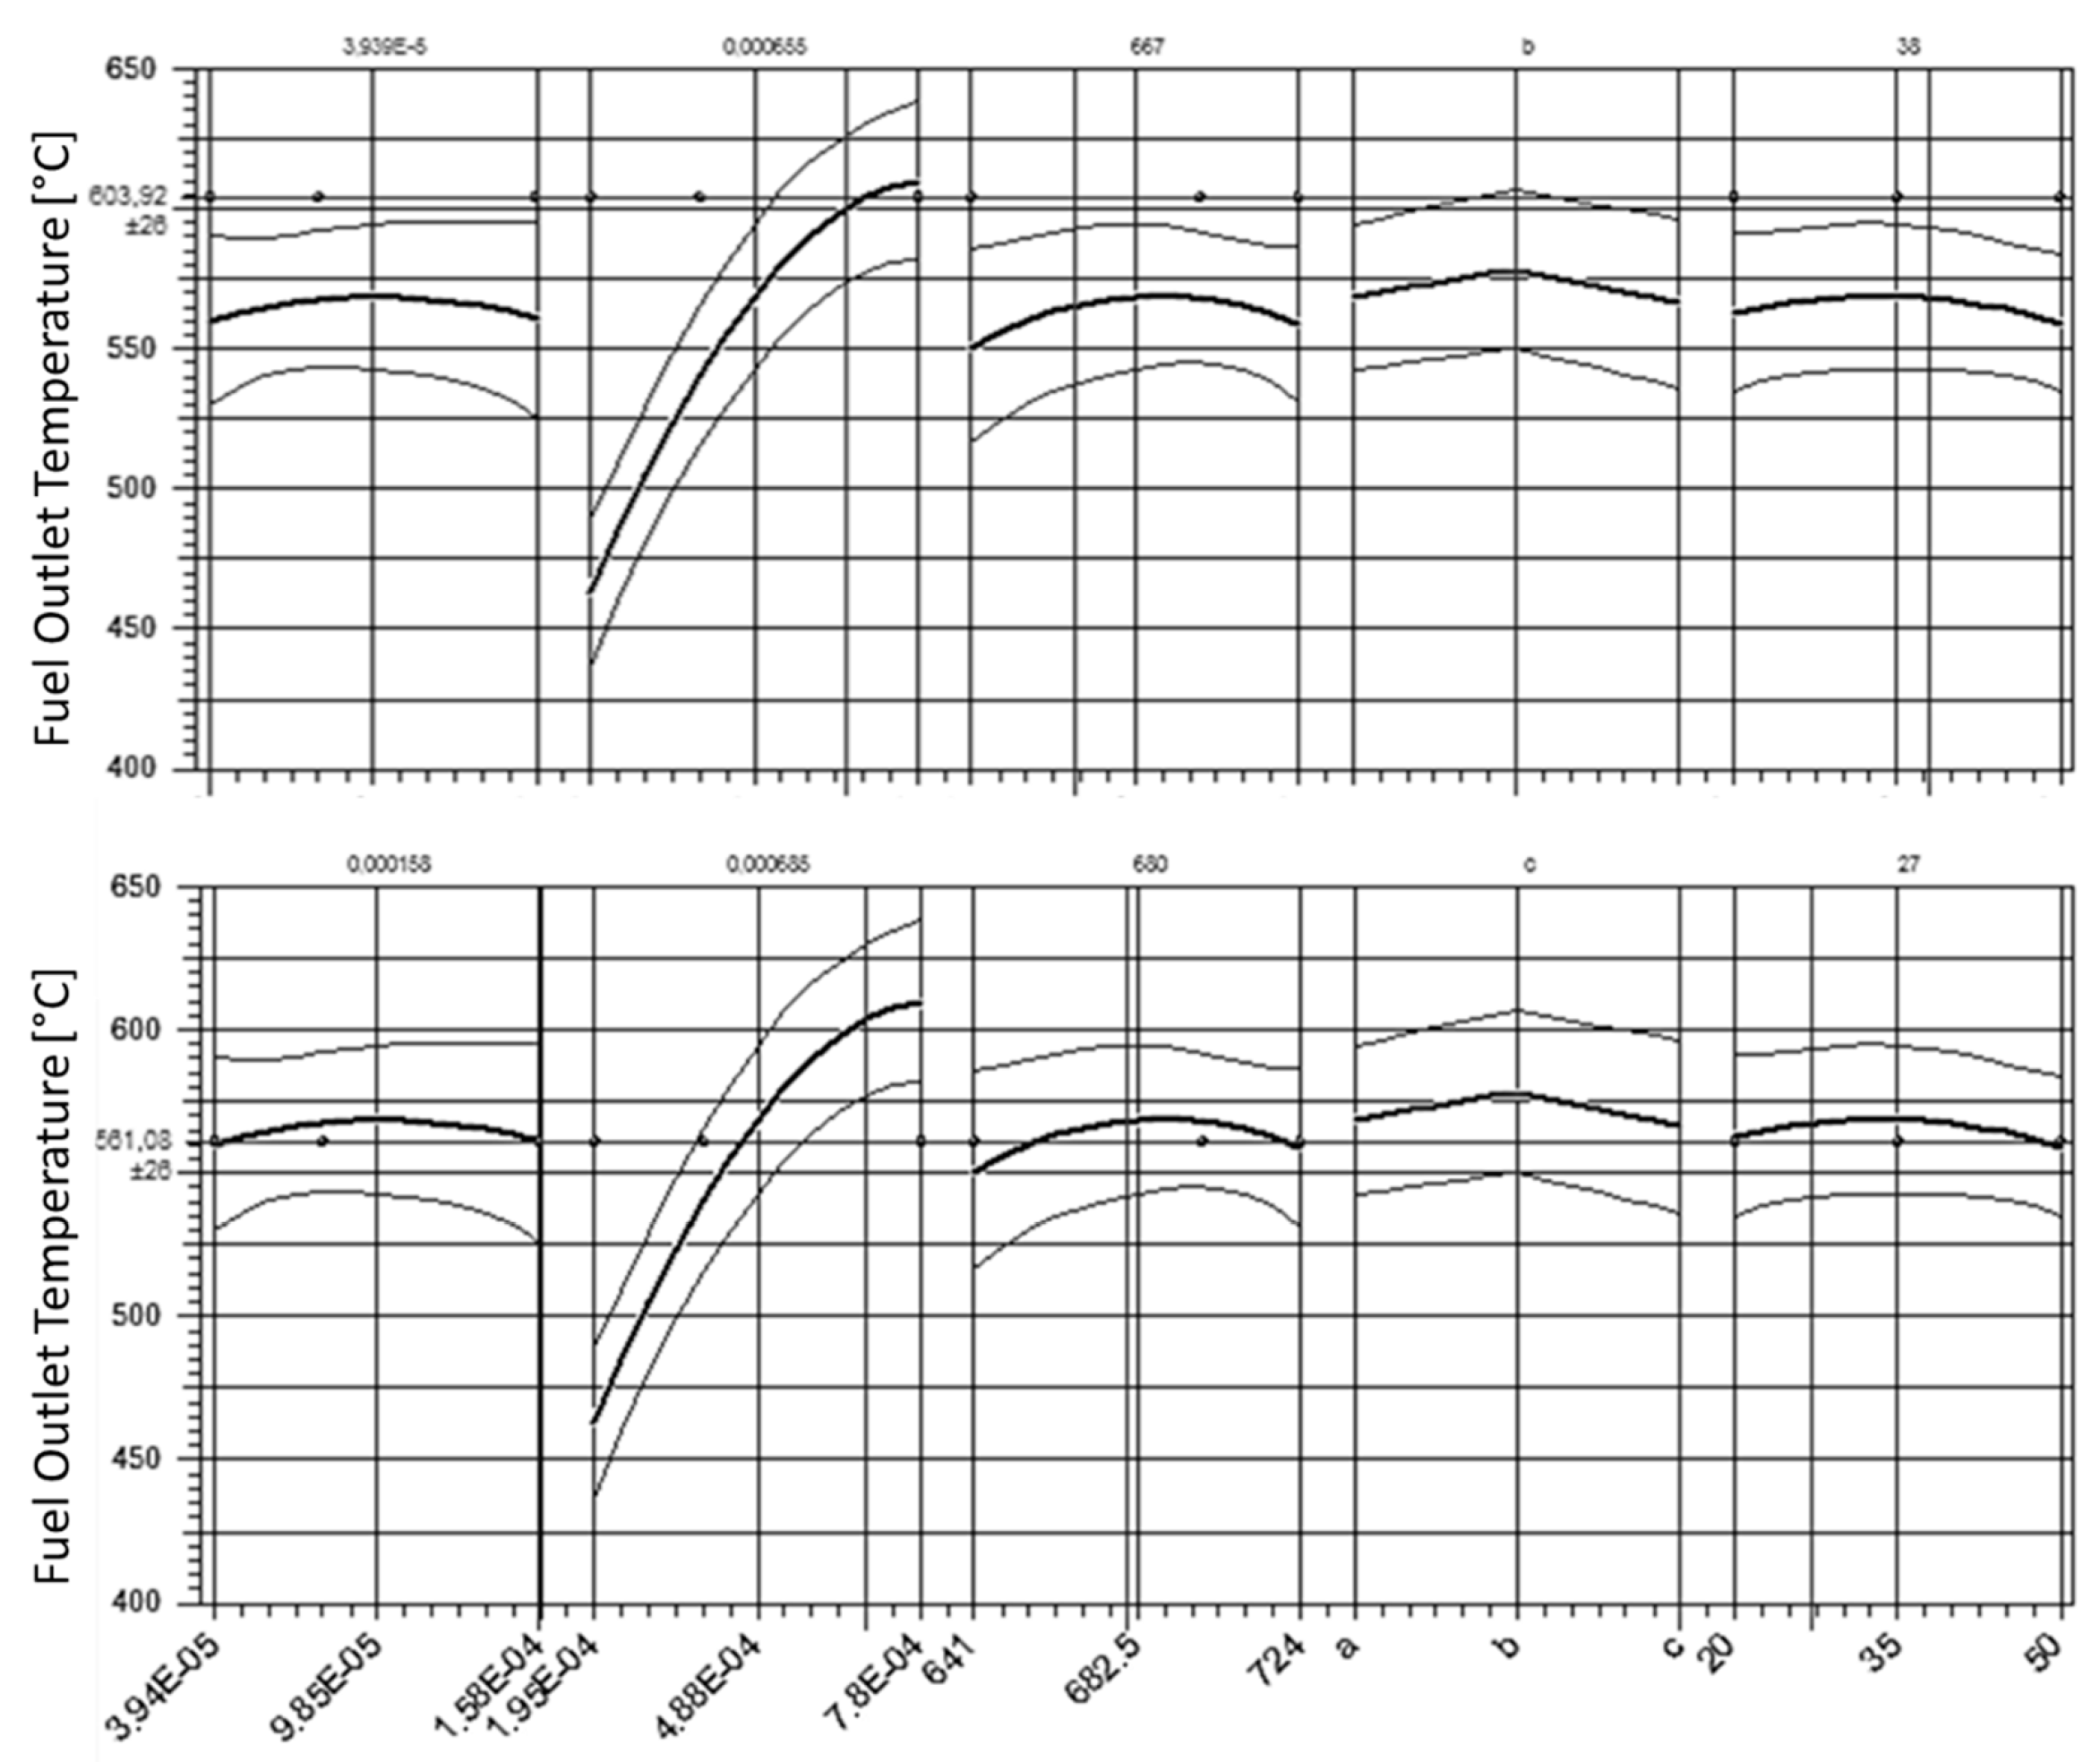
Figure 7 depicts a demonstration of the ML model where two arbitrary but practice-relevant temperature values have been set as targeted outlet temperatures.
The machine learning model predicts the ideal parameter configuration, taking into account the intricate, non-linear correlation between the assessed parameters and the fuel outlet temperature in the pre-reformer unit. Each variable’s gradient indicates its impact level. Notably, the non-linear dynamics play a crucial role, evident when examining the air flow rate parameter. Higher fuel gas quantities available for energy exchange tend to sustain desired temperatures at the outlet zone, such as the depicted target values specified as 600 °C and 560 °C, respectively. From left to right, these parameters represent the fuel flow rate, air flow rate, air temperature, oxygen concentration, and catalyst porosity variables. The y-axis represents the predicted outlet temperature, while the x-axis displays different values of each parameter across the subplots. On the far left, the curve indicates a significant non-linear relationship between fuel flow and temperature. As the fuel flow increases, the outlet temperature initially remains constant, but a steep rise is observed beyond a certain threshold. This suggests that at lower fuel flow rates, the system maintains a stable temperature, but at higher rates, the thermal load on the system increases, leading to a rise in temperature. The second segment shows how increasing the air flow rate initially results in a similar rapid temperature rise, followed by a levelling-off of the curve. This behavior is consistent with an increasing partial oxidation effect as more air is introduced, leading to higher temperatures initially, but eventually reaching an equilibrium point where additional air no longer has a significant impact on the temperature. In the middle of each plot, the curves for air temperature and oxygen content illustrate smoother, less pronounced changes in temperature. The shape of these curves implies that while these factors influence the outlet temperature, their effect is more moderated and less dramatic compared to fuel and air flow rates. This suggests that the system is more sensitive to flow rates than to gas composition changes. The rightmost segment shows the effect of the catalyst condition on the outlet temperature. This curve appears flatter, indicating that changes in the catalyst’s state have a more limited effect on the overall temperature response. This could mean that, under normal operating conditions, the catalyst plays a secondary role in influencing the outlet temperature compared to fuel and air dynamics.
The lower second plot also shows the response of the outlet temperature to variations in multiple parameters. Although similar trends are observed, a few key differences emerge. Some of the curves in this plot exhibit steeper gradients, particularly in the initial stages of the parameter variation. For example, the steep rise in temperature for low air flow rates suggests a more rapid system response in this scenario, possibly due to an interaction effect between parameters that was captured in the model. In certain regions of the lower plot, the temperature response remains more moderate across a broader range of input values. This suggests that the system reaches a stable operating point more quickly under some combinations of parameter settings, which is likely influenced by both the input air temperature and oxygen concentration. Recapping the demonstrated analysis, the process exhibits strong non-linear responses to changes in fuel and air flow rates, with a sharp increase in temperature observed at higher input levels. This highlights the importance of careful control over these parameters to prevent excessive temperatures, which could be thermomechanically damaging to the catalyst and require detailed assessment. The shape of the curves also suggests possible interaction effects between variables. For example, the impact of air temperature or oxygen concentration may be more pronounced when combined with high fuel or air flow rates, as indicated by the steeper gradients observed in certain regions of the plots. The sensitivity of the model’s predictions is evident in how some parameters cause more significant shifts in temperature than others. This suggests that in optimizing the component for stable temperatures, greater attention should be paid to controlling the fuel and air flow rates, while variables like oxygen concentration and catalyst condition play more secondary roles. The plots also reveal that the system reaches equilibrium at certain points where increasing a parameter no longer significantly affects the temperature. These stable regions could be potential targets for process optimization, as they represent conditions under which the system can maintain a consistent output temperature without the risk of overheating. The model capabilities will be further used where different multiphysics is receiving considerable attention in recent research endeavors.
To discuss and recap the section, some key outcomes can be summarized as follows:
The dominant influence of air flow on the fuel outlet temperature, with an estimated contribution of 75%, as depicted in
Figure 5a, emphasizes the strong impact and need for careful control of airflow to manage temperature levels effectively during the reforming process.
In addition to air flow, air temperature also plays a significant role, contributing approximately 10–12% to the fuel outlet temperature. This demonstrates that while airflow remains the primary driver of thermal behavior, adjusting air temperature can still meaningfully influence the reformer’s performance.
Other factors, including catalyst porosity and oxygen content, showed more modest impacts, with contributions of around 5–7% each. These parameters, while important for fine-tuning the chemical reactions within the pre-reformer, have less direct influence on the overall temperature profile compared to airflow and air temperature, but would be an important criterion for improving material performance. Fuel flow exhibited the least influence on the outlet temperature, contributing only 2–3%, suggesting that it plays a more secondary role in the thermochemical process.
The three-dimensional response surface plots in
Figure 5b–d illustrate the non-linear interactions between parameters. For instance,
Figure 5b shows that increasing both air and fuel flow rates leads to higher outlet temperatures, with airflow exerting a particularly pronounced effect. Similarly,
Figure 5c highlights the interaction between fuel flow and air temperature, confirming that while both variables contribute to temperature control, the effects of fuel flow are more gradual compared to airflow.
These findings underscore the importance of optimizing airflow and air temperature to achieve stable and efficient pre-reformer operation, while secondary parameters like catalyst porosity and oxygen concentration offer additional fine-tuning capabilities. The machine learning model trained on these insights provided a reliable predictive framework, closely aligning with the results of traditional CFD simulations, with error margins as low as 0.34% across multiple validation cases, suggesting its significance as an accelerated design and optimization tool that will be utilized in future studies.
4. Conclusions
In using both conventional and accelerated contemporary machine learning techniques, the present research delves into advanced assessments in reversible solid oxide cell (r-SOC) fuel pre-processing technologies. A sophisticated supervised physics-based machine learning model is developed and employed to assess reforming processes pertinent to SOC development. Emphasis within the current study is placed on a holistic approach that integrates the use of an experimentally validated CFD model with machine learning techniques. Data are generated to construct and train the multi-regression-type AI-powered machine learning model. The intricate thermochemistry of the pre-reforming auxiliary SOC component containing syngas is evaluated and systematically assessed using DoE. The devised ML model effectively forecasts and optimizes reforming procedures using various fuel compositions, including oxygen-containing syngas. The verification against traditional CFD predictions demonstrates a high level of agreement in model predictions with an RMS, MSE, and R2 of 18.37, 337.64, and 95%, respectively, contributing significantly to enhanced understanding and qualitative advantages in optimally preparing high-quality syngas. This enhancement promotes improved fuel processing, fostering sustainable research and bolstering the safe and consistent operation of r-SOC technology. The clear non-linear relationships between parameters like fuel flow and air flow emphasize the need for precise control mechanisms, especially in scenarios where the temperature can rapidly rise beyond desired levels. The insights gained from the outcomes can be used to adjust operating conditions to maintain a stable thermal environment at the fuel outlet, thereby improving the overall efficiency and safety of the system.
In particular, the AI-augmented framework allowed the processing of 48 CFD-generated data sets, resulting in highly accurate predictions of fuel outlet temperatures with an error margin as low as 0.34%, compared to conventional experimentally validated CFD simulations. Key parameters such as air flow rate and air temperature were identified as critical influences on pre-reformer thermal behavior, with the air flow rate showing an estimated 75% main effect, the most significant impact on the temperature distribution, followed by air temperature contributing approximately 10–12% to the fuel outlet temperature. The machine learning model also excelled in predicting non-linear interactions between variables like fuel flow rate, oxygen content, and catalyst porosity. This allowed for the precise tuning of operating conditions, reducing excessive temperature spikes and ensuring optimal fuel processing. The model’s scalability further suggests that it can effectively replace computationally expensive CFD methods in future applications, once set and trained with reliable data.
By achieving these quantitative insights, the combined CFD-AI approach not only enhances syngas preparation efficiency but also reduces the need for resource-intensive experimentation, promoting sustainable development in r-SOC technology. These findings highlight the potential for AI-driven machine learning optimization to streamline future energy systems while ensuring safer, more reliable operations. Hence, the integrated approach facilitates the early availability of valuable information in the pre-development stages.


