Abstract
The anisotropy of shear resistance depending on friction direction can be selectively utilized in geotechnical structures. For instance, deep foundations and soil nailing, which are subject to axial loads, benefit from increased load transfer due to greater shear resistance. In contrast, minimal shear resistance is desirable in applications such as pile driving and soil sampling. Previous studies explored the shear resistance by interface between soil and surface asperities of a plate inspired by the geometry of snake scales. In this study, the interface friction anisotropy based on the load direction of cones with surface asperities is evaluated. First, a laboratory model chamber and a small-scale cone system are developed to quantitatively assess shear resistance under two load directions (penetration ⟶ pull-out). A preliminary test is conducted to analyze the boundary effects for the size of the model chamber and the distance between cones by confirming similar penetration resistance values at four cone penetration points. The interface shear behavior between the cone surface and the surrounding sand is quantitatively analyzed using cones with various asperity geometries under constant vertical stress. The results show that penetration resistance and pull-out resistance are increased with a higher height, shorter length of asperity and shearing direction with a decreasing height of surface asperity.
1. Introduction
Pile foundations are essential geotechnical structures supported by the bearing capacity of the pile tip and the interface friction between the pile shaft and the surrounding soil [1,2]. Since the bearing capacity varies based on the construction method and soil displacement, it is crucial to select an appropriate foundation construction technique considering the site scale and geological conditions [3]. In such a case, the weathered and soft rock layers, which serve as end bearing layers, are often shallow, and pile foundations are typically constructed as end bearing piles. However, due to the limited availability of construction sites, there has been a recent shift to regions where the bedrock is over 50 m deep and the upper layers consist of sedimentary deposits [4,5]. In these areas, the application of end bearing piles can encounter technical challenges and a steep rise in construction costs due to the increased pile length, making the use of friction piles more appropriate [6].
To enhance skin friction and facilitate easier pile penetration, various studies have investigated modification of the pile surface. For instance, helical piles, which feature helices attached to steel pipes to increase shaft friction, are installed using rotational devices, unlike traditional driven piles. This method reduces noise and vibration and allows construction with small equipment, making it suitable for various site conditions. The changes in ultimate load according to the rotational speed and the spacing between the helices were studied through full-scale tests [7]. The differences in load behavior based on the geometric conditions of the helices (e.g., the number and diameter) were analyzed through laboratory model tests and numerical analysis [8,9]. They confirmed that the helical piles showed relatively higher compressive and tensile capacities compared to traditional piles. Furthermore, a numerical study for micropiles with a modified waveform shape was conducted and revealed that the shaft friction increased while the overall pile length was reduced by approximately 15% [10]. The load-bearing capacities of waveform-shaped micropiles compared through centrifuge model tests identified the most effective pile shape for increasing resistance [11]. The construction feasibility and load-bearing performance of waveform micropiles in deep ground conditions were validated through field tests conducted in strata composed of reclaimed soil, weathered soil and weathered rock [12].
Recently, the evolution of biological systems in nature has been applied to engineering systems for innovative designs. In particular, asymmetrically shaped snake skin produces the movement-dependent response. Previous studies analyzed the frictional anisotropy of snake skin-inspired surfaces for different sands under monotonic loading conditions and in bidirectional shearing directions using a modified direct shear apparatus. The results of the interface friction tests showed that the shorter asperity lengths and greater heights significantly increased shear strength. In addition, higher interface friction angles were produced when the asperity height decreased in the shearing direction compared to the opposite direction when asperity height increased [13,14,15,16,17,18]. Particle image velocimetry analysis revealed larger soil deformations and dilation induced within the soil when asperity height decreased. This shearing direction enabled soil to latch on scales and increased the contact area and contact soil behind the scales. Eventually, wedges tended to develop at the leading front of the scales where soil displacement, shear strains and volumetric strains are localized. The soil within the wedges developed during shearing experienced a local increase in the mean effective stresses. However, the caudal shearing direction hindered the latching of the soil on the scales and reduces the contact area [13].
Centrifuge cone tests were conducted to investigate the variations in the shaft capacity of bio-inspired piles according to the loading direction (installation and pull-out) and the asperity orientation of the pile surface. Similar to the results of the direct shear tests, the cone resistance during the penetration test was greater in the direction where the protrusion height decreased than in the direction where the protrusion height increased. The cone penetration resistance was greater than the pull-out resistance, regardless of the asperity height of the pile [19,20].
In this study, the anisotropy of interface friction according to the load direction on a cone with surface asperities is evaluated. A laboratory model chamber and small-scale cone system are developed to quantitatively assess the shear resistance and penetration depth of cones under varying load directions (penetration ⟶ pull-out). Preliminary experiments are conducted to verify the boundary effects based on the size of the model chamber and the distance between the cones. In addition, the shear behaviors at the interface between the cone asperities and sand are analyzed under constant vertical stress conditions using cones with different surface asperity geometries.
2. Laboratory Experiments
The test apparatus developed for this study consists of a model chamber, a load application system, a reaction frame, a system for controlling the cone penetration depth and speed and a data acquisition system (Figure 1). The details of each component are explained here.
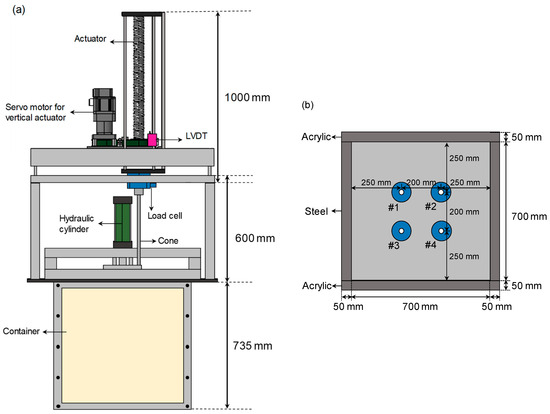
Figure 1.
Schematic diagram of the testing apparatus to measure the resistance of a cone with a textured shaft during penetration and pull-out processes: (a) Entire small-scale cone system; (b) Locations of four cone penetration points.
2.1. Cone Penetration Test Apparatus
A laboratory model chamber and small-scale cone system are developed to quantitatively evaluate the shear resistance according to the load direction and textured shaft. The inner dimensions of the model chamber used in the tests are 700 × 700 × 700 mm (length × width × height). The front and rear of the chamber are made of 50 mm acrylic, while the sides are constructed with 50 mm thick steel to maintain a zero lateral strain condition. Six 8 mm diameter drainage holes are installed at the bottom of the chamber, which are connected to plastic valves and polyurethane hoses to create a drainage system. To avoid the plastic zone formed around the cone during the first penetration test from affecting subsequent tests, the distance between cones (S) is designed to satisfy S/D ≥ 11 (where D is the cone diameter), as suggested in centrifuge model cone penetration tests [21]. A loading plate measuring 40 mm thick and made of steel is manufactured to apply a uniform load, with four 100 mm diameter holes created in the center to allow cone penetration without soil loss. Note that four penetration and pull-out tests are conducted under the same sand conditions. Two hydraulic cylinders with 35 kN capacity and a diameter of 80 mm are installed at opposing ends of the load application plate to apply vertical load without eccentricity. A reaction frame, 600 mm high, is integrated with the model chamber using a bolt-nut system to withstand the resistance forces generated during cone penetration and to provide sufficient space for cone penetration.
2.2. Manufacturing of Cones with Surface Asperities
Figure 2 shows a schematic of the cones used in the experiments, which are designed with a reference cone and textured shaft according to two shearing directions. The cones are made of durable stainless steel and measure 403 mm in length and 14 mm in diameter, with a 60° conical tip. They consisted of three parts: the upper, middle and lower sections. The upper section (120 mm long) is attached directly to the load cell to eliminate eccentricity during cone penetration and pull-out. The middle section (240 mm long) features a continuous array of asperities, and both the upper and lower parts could be changed to reverse the direction of the asperities. The lower section has a 30 mm flat surface and a 13 mm conical tip. No strain gauges within the cone tip are installed inside the cones. The load is measured only at the load cell attached to the upper part of the cone, meaning that the ultimate load, including tip resistance and skin friction, is measured during penetration, while only skin friction is measured during pull-out.
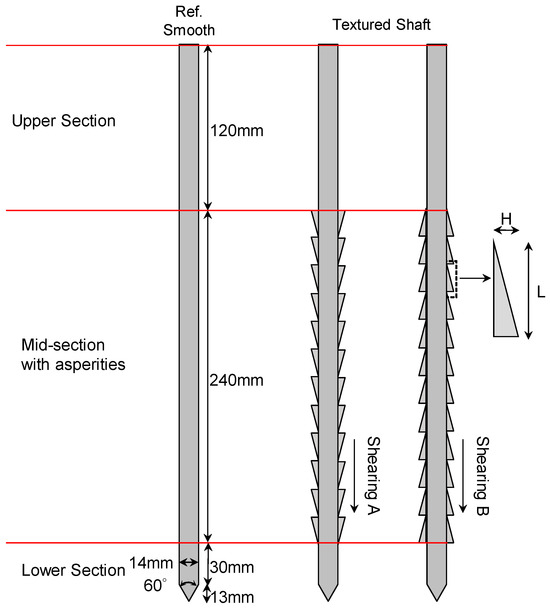
Figure 2.
Schematic diagram of a miniature cone with a textured shaft. The height of surface asperity in shearing direction A is increased during penetration testing. In contrast, shearing direction B decreases the height of surface asperity.
2.3. Experimental Setup
The test samples are prepared using Jumunjin standard sand, and the physical properties of the sand are summarized in Table 1. The initial relative density of approximately 64% and a sample height of 70 cm are achieved using the air-pluviation and layered compaction methods. Figure 3 illustrates the entire process from sample preparation to the assembly of the cone penetration test apparatus. The detailed procedures are explained here.

Table 1.
Basic properties of the Jumunjin sand used in this study.
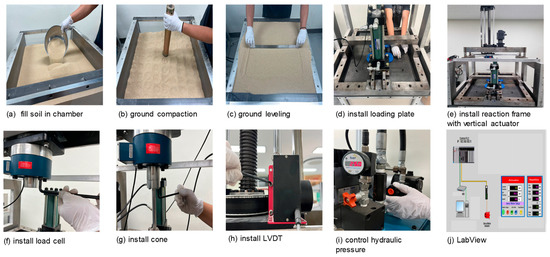
Figure 3.
Cone penetration test procedure and measurement.
- ①
- Sand is placed to a depth of 100 mm using the air-pluviation method, followed by compaction using a 2.5 kg circular tamping rod dropped from a height of 350 mm. The sand is compacted in seven layers, each tamped 100 times. The surface is then leveled to ensure even contact between the sample surface and the bottom of the loading plate [Figure 3a–c].
- ②
- After securing the hydraulic cylinders to the loading plate, the plate is installed on top of the sand sample [Figure 3d].
- ③
- The vertical actuator for cone penetration and pull-out and the hollow load cell for vertical load measurement are attached to the reaction frame, which is secured to the model chamber using a bolt-nut system [Figure 3e,f].
- ④
- An aluminum connecting rod is installed in the center of the hollow load cell, and the upper part of cone is attached using bolts and nuts [Figure 3g]. A wire displacement sensor is installed to the bottom housing cover of the vertical actuator, and then the wire is connected to the upper housing cover [Figure 3h].
- ⑤
- The hydraulic cylinder control device is adjusted to apply a predetermined vertical load by opening the hydraulic cylinder pump [Figure 3i].
- ⑥
- Using the LabVIEW2021 program, the cone penetration depth and speed are controlled, and the load and vertical displacement are monitored in real-time during the test. The data are automatically saved after the experiment [Figure 3j].
3. Experimental Results and Analysis
Cone penetration tests are conducted in two directions: shearing direction A (where the asperity height increases) and shearing direction B (where the asperity height decreases) under constant vertical load conditions. To eliminate the effect of penetration speed, all tests are performed at a constant speed of 10 mm/s. The cone is penetrated to a depth of 300 mm over 30 s, followed by pull-out to a depth of 50 mm over 5 s. The measured force during the cone penetration test is defined by taking the average value between depths of 100 and 300 mm, while the measured pull-out force is the average values between depths of 300 and 250 mm, and all results are summarized in Table 2.
Table 2.
Summary of measured resistance using a textured cone under various surface asperities (L and H) and two shearing directions (shearing direction A and shearing direction B). The height of surface asperity in shearing direction A is increased during penetration testing. In contrast, shearing direction B decreases the height of surface asperity. Note that the vertical stress is fixed at 50 kPa during the shearing process. The measured force during the cone penetration test is defined by taking the average value between depths of 100 and 300 mm, while the measured pull-out force is the average values between depths of 300 and 250 mm.
3.1. Suitability of Model Chamber Size and the Distance Between Cones
A preliminary test is conducted to quantitatively analyze the boundary effects related to the model chamber size and the distance between cones using a smooth cone with no surface asperities. Figure 4 shows the changes in cone resistance according to various penetration depths for cones inserted at four different locations. The change in load is minimal up to an initial penetration depth of 10 mm because compaction near the specimen surface is diminished after leveling the sample. Thereafter, the penetration load is continuously increased, and after reaching a depth of 200 mm, the ultimate cone resistance is observed. However, the cone resistance is decreased during the pull-out process. Similar penetration resistance (≈1.75 kN) and pull-out resistance (≈−0.23 kN) are measured at all four penetration locations. This preliminary test confirms that the model chamber size and the distance between cones are sufficiently large for the tests.
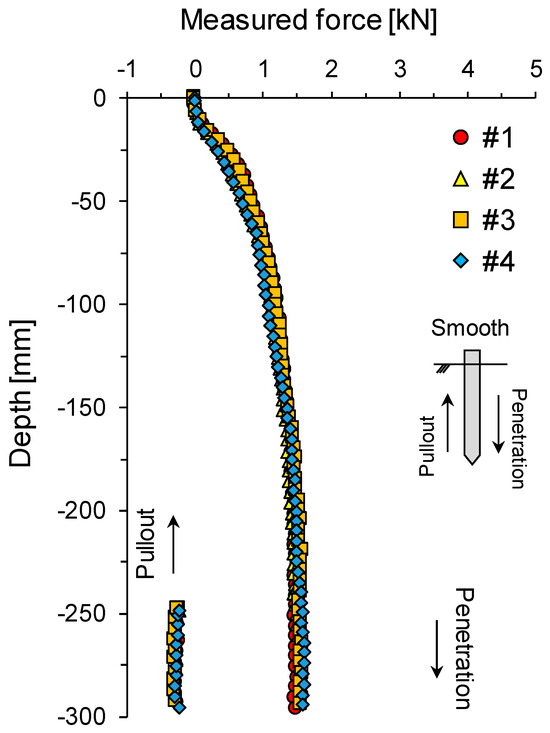
Figure 4.
Experimental repeatability of cone penetration and pull–out testing. The smooth-surface cone is penetrated and pulled out at four different locations in the same test. Note that the negative convention of the measured force indicates the pull-out test.
3.2. Effect of Shaft Asperities and Load Direction on Cone Resistance
Figure 5 illustrates the change in cone resistance over the entire testing time. Note that the negative convention of the measured force indicates the pull-out test. Regardless of the presence of surface asperities, the penetration load initially shows minimal variation due to the compaction effect on the upper layer of the sample but then begins to increase steadily. After 8 s of penetration, the cone with surface asperities exhibits significantly higher penetration resistance compared to the smooth cone, with the maximum penetration resistance of the cone with surface asperities (=2.39 kN) being higher than that of the smooth cone (=1.75 kN). During pull-out (around 30 s), the load is dramatically decreased, with cones featuring surface asperities initially showing higher pull-out resistance and reaching a maximum pull-out load (=−0.5 kN) at 33 s and then gradually decreasing. In contrast, the smooth cone shows almost no change in pull-out resistance (=−0.23 kN).
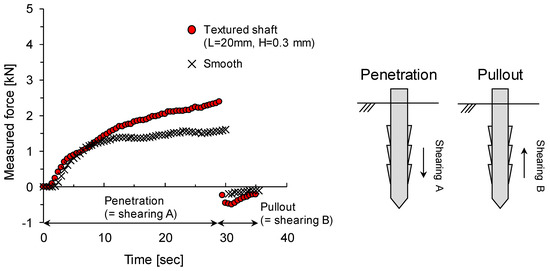
Figure 5.
Time series during penetration and pull–out testing.
Figure 6 shows the evolution of the measured load for different surface asperity shapes and load direction conditions. As shown in Figure 6a, penetration resistance is similar up to a certain depth (100–120 mm) regardless of asperity shape and load direction, but beyond this depth, there are clear differences depending on the asperity shape and load direction. The cone with surface asperity exhibits greater maximum penetration resistance than the smooth cone (=1.75 kN) regardless of load direction. Under the shearing A direction (asperity height increases during penetration), the maximum penetration load (=2.38 kN) is lower compared to that under the shearing B direction (=2.83 kN, where asperity height decreases during penetration). During pull-out, the pull-out resistance under the shearing A direction is rapidly changed with increasing displacement, whereas the pull-out resistance remains relatively constant in the shearing B direction. In addition, Figure 6b shows the change in cone resistance with a constant asperity length of L = 20 mm but a reduced asperity height of H = 0.3 mm. Compared to that in Figure 6a, the maximum penetration resistance is similar regardless of the shearing direction (shearing A = 2.39 kN, shearing B = 2.41 kN). In the case with the same asperity height (H = 0.3 mm) but a shorter asperity length (L = 6 mm), the shearing B condition produces a 1.07 kN higher maximum penetration resistance than the shearing A condition. There is a 0.66 kN difference between the two direction conditions during pull-out. A previous study on plate-sand direct shear tests with surface asperities used particle image velocimetry (PIV) to analyze soil movement near the interface during shearing [13]. The analysis revealed that shear failure at the interface formed wedge-shaped soil deformation patterns or uniform shear bands depending on the surface asperity geometry.
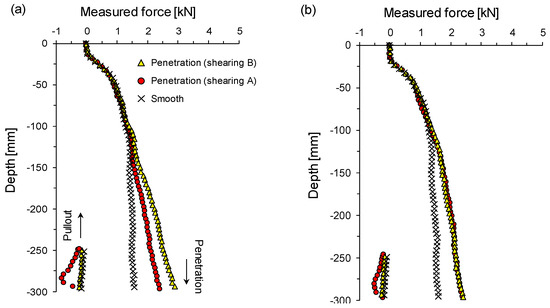
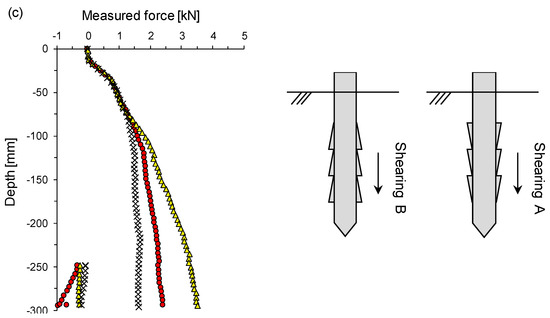
Figure 6.
Effect of cone shaft asperity on the measured force during penetration and pull–out testing: (a) L = 20 mm and H = 0.5 mm; (b) L = 20 mm and H = 0.3 mm; (c) L = 6 mm and H = 0.3 mm.
3.3. Change in Pull-Out Resistance After the Cone Penetration Test
Figure 7 presents the measured force against pull-out displacement after the cone is penetrated. Regardless of the surface asperity geometry, cones with asperities show higher pull-out resistance than smooth cones at all pull-out depths. However, the measured force–displacement response during pull-out is varied depending on the asperity shape. In the shearing B condition, the maximum pull-out load is observed within a pull-out displacement of approximately 10 mm, followed by a rapid decrease in pull-out resistance. On the other hand, in the shearing A condition, the pull-out resistance is slightly higher than that of the smooth cone, and the resistance is gradually decreased with increasing pull-out displacement. The maximum pull-out resistance is increased with the higher height of asperity (constant L = 20 mm), and the maximum load occurs at smaller displacements (H = 0.3 mm, maximum pull-out resistance = −0.5 kN; H = 0.5 mm, maximum pull-out resistance = −0.8 kN) [Figure 7a,b]. In addition, with a constant asperity height (H = 0.3 mm), shorter asperity lengths produce maximum pull-out resistance at smaller displacements (L = 6 mm, maximum pull-out resistance = −0.95 kN) [Figure 7a,c].
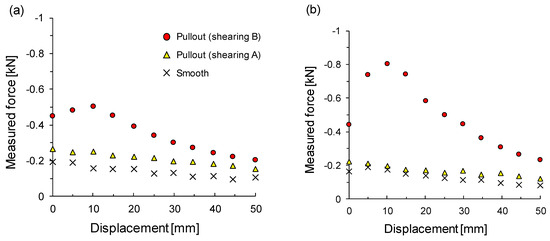
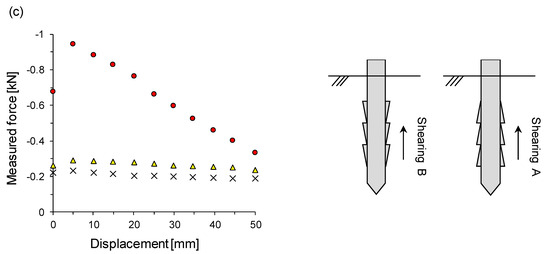
Figure 7.
Measured force against displacement during pull–out tests after the cone is penetrated: (a) L = 20 mm, H = 0.3 mm; (b) L = 20 mm; H = 0.5 mm; (c) L = 6 mm, H = 0.3 mm.
4. Conclusions
In this study, a laboratory model chamber and small-scale cone system are developed to evaluate the cone resistance with a textured shaft. The interface shear behavior between the cone surface and the sand according to two loading directions (penetration ⟶ pull-out) are quantitatively analyzed using cones with various surface asperities under constant vertical stress conditions, and the salient conclusions are as follows:
- (a)
- Preliminary experiments are conducted using cones with smooth surfaces to quantitatively analyze the boundary effect related to model chamber size and the distance between the cones. Similar penetration resistance and pull-out resistance values are measured for cones penetrated at four different positions, confirming that the distance between the model chamber size and the cone developed in this study is sufficiently secured.
- (b)
- A cone with surface asperity exhibits larger maximum penetration resistance than a smooth cone shaft, regardless of the load direction. During cone penetration, the shearing A direction condition produces a lower maximum penetration load compared to the shearing B direction condition. After the cone is penetrated, the pull-out resistance is dramatically changed with pull-out displacement in the shearing B direction condition, whereas the change in pull-out resistance is minimal in the shearing A direction condition.
- (c)
- Given scale geometry, a higher scale height or shorter scale length mobilizes greater penetration and pull-out resistance. In particular, the change in shear resistance according to the geometry scale is significantly affected by scale length rather than scale height. A higher height of asperity or shorter length of asperity indicates a rough surface that individual soil deformation wedges. Meanwhile, shorter height or longer length of asperity produces more uniform shear bands along the asperities.
Future studies will focus on identifying cone resistance behavior characteristics using the developed cone penetration test apparatus under various conditions (relative density, grain size distribution, overburden pressure) and conducting numerical analyses to analyze the mechanism of how the local shear failure propagated along the interface between the cone shaft and the sand affects the measured cone resistance.
Author Contributions
Conceptualization, S.-H.C. and T.-Y.K.; experimental test, K.-H.J. and T.-Y.K.; investigation, T.-Y.K., K.-H.J. and S.-H.C.; writing—original draft preparation, T.-Y.K. and K.-H.J.; writing—review and editing, S.-H.C.; supervision, S.-H.C.; project administration, S.-H.C.; funding acquisition, S.-H.C. All authors have read and agreed to the published version of the manuscript.
Funding
This work was supported by the National Research Foundation of Korea (NRF) grant funded by the Korea government (MSIT) (No. 2021R1C1C1006003).
Institutional Review Board Statement
Not applicable.
Informed Consent Statement
Not applicable.
Data Availability Statement
The data presented in this study are available on request from the corresponding author. The data are not publicly available due to privacy.
Conflicts of Interest
The authors declare no conflicts of interest.
References
- Sun, T.; Wang, C.; Xu, D.; Lin, Z.; Yang, J.; Liu, S.; Yang, F. Effect of Solidified Depth on the Vertical Compressive Bearing Characteristics of the Soil Continuously Solidified Pile Group Foundation. Appl. Sci. 2023, 13, 12850. [Google Scholar] [CrossRef]
- Wang, Z.; Jiang, J.; Wang, S.; Fu, C.; Yang, D. Analysis on Bearing Behavior of Single Pile under Combined Action of Vertical Load and Torque in Expansive Soil. Appl. Sci. 2023, 13, 4133. [Google Scholar] [CrossRef]
- Lu, Y.; Li, D.; Jia, S.; Wang, K. A new method for evaluating the bearing capacity of the bridge pile socketed in the soft rock. Appl. Sci. 2021, 11, 5923. [Google Scholar] [CrossRef]
- Elsawy, M.B.; Alsharekh, M.F.; Shaban, M. Modeling undrained shear strength of sensitive alluvial soft clay using machine learning approach. Appl. Sci. 2022, 12, 10177. [Google Scholar] [CrossRef]
- Ali, O.K.; Abbas, H.O. Performance assessment of screw piles embedded in soft clay. Civ. Eng. J. 2019, 5, 1788–1798. [Google Scholar] [CrossRef]
- Kim, D.; Jeong, S. Applicability of bearing capacity for single drilled shaft using empirical equation based on ground condition. J. Korean Geosynth. Soc. 2019, 18, 167–180. [Google Scholar] [CrossRef]
- Lee, J.H.; Lee, K.; Kim, D. Analysis of axial capacity and constructability of helical pile with inner cone penetration. J. Korean Geosynth. Soc. 2017, 16, 1–11. [Google Scholar]
- Bak, J.; Lee, K.; Choi, B.H.; Kim, D. Numerical analysis of helical pile behavior varying number and diameter of helices. KSCE J. Civ. Environ. Eng. Res. 2019, 39, 211–217. [Google Scholar]
- Elsherbiny, Z.H.; El Naggar, M.H. Axial compressive capacity of helical piles from field tests and numerical study. Can. Geotech. J. 2013, 50, 1191–1203. [Google Scholar] [CrossRef]
- Han, J.T.; Kim, S.R.; Jang, Y.E.; Lee, S.H. Evaluation of bearing capacity of waveform micropile by numerical analyses. J. Korea Acad. Ind. Coop. Soc. 2013, 14, 5906–5914. [Google Scholar]
- Jang, Y.E.; Han, J.T.; Kim, J.H.; Park, H.J.; Kim, S.H. Evaluation of axial bearing capacity of waveform micropile by centrifuge test. J. Korean Geotech. Soc. 2015, 31, 39–49. [Google Scholar] [CrossRef][Green Version]
- Baek, S.-H.; Han, J.T.; Kim, S.J.; Kim, J. Evaluation of the effect of waveform micropiles on reinforcement of foundation structures through field load tests. J. Korean Geotech. Soc. 2023, 39, 29–40. [Google Scholar]
- Martinez, A.; Palumbo, S.; Todd, B.D. Bioinspiration for anisotropic load transfer at soil–structure interfaces. J. Geotech. Geoenviron. Eng. 2019, 145, 04019074. [Google Scholar] [CrossRef]
- O’Hara, K.B.; Martinez, A. Effects of asperity height on monotonic and cyclic interface behavior of bioinspired surfaces under constant normal stiffness conditions. In Geo-Congress 2020; American Society of Civil Engineers: Reston, VA, USA, 2020. [Google Scholar]
- Lee, S.-H.; Chong, S.-H. A study on friction anisotropy between sand and surface asperities of plate using modified direct shear test. J. Korean Geotech. Soc. 2022, 38, 29–38. [Google Scholar]
- Nawaz, M.N.; Lee, S.H.; Chong, S.H.; Kim, J.H. Modification of direct shear apparatus for soil-soil and soil-solid interface testing. Geomech. Eng. 2023, 35, 325–332. [Google Scholar]
- Lee, S.-H.; Nawaz, M.N.; Chong, S.-H. Estimation of interface frictional anisotropy between sand and snakeskin-inspired surfaces. Sci. Rep. 2023, 13, 3975. [Google Scholar] [CrossRef] [PubMed]
- Nawaz, M.N.; Lee, S.H.; Chong, S.-H.; Ku, T. Interface frictional anisotropy of dilative sand. Sci. Rep. 2024, 14, 6166. [Google Scholar] [CrossRef] [PubMed]
- O’Hara, K.B.; Martinez, A. Monotonic and cyclic frictional resistance directionality in snakeskin-inspired surfaces and piles. J. Geotech. Geoenviron. Eng. 2020, 146, 04020116. [Google Scholar] [CrossRef]
- O’Hara, K.B.; Martinez, A. Cyclic axial response and stability of snakeskin-inspired piles in sand. Acta Geotech. 2024, 19, 1139–1158. [Google Scholar] [CrossRef]
- Bolton, M.D.; Gui, M.W.; Gamier, J.; Corte, J.F.; Bagge, G.; Laue, J.; Renzi, R. Centrifuge cone penetration tests in sand. Géotechnique 1999, 49, 543–552. [Google Scholar] [CrossRef]
Disclaimer/Publisher’s Note: The statements, opinions and data contained in all publications are solely those of the individual author(s) and contributor(s) and not of MDPI and/or the editor(s). MDPI and/or the editor(s) disclaim responsibility for any injury to people or property resulting from any ideas, methods, instructions or products referred to in the content. |
© 2024 by the authors. Licensee MDPI, Basel, Switzerland. This article is an open access article distributed under the terms and conditions of the Creative Commons Attribution (CC BY) license (https://creativecommons.org/licenses/by/4.0/).