Abstract
With the rapid increase in the number of various terminal devices in distribution systems, the important impact of communication networks on power supply reliability in cyber–physical distribution systems (CPDSs) is becoming increasingly prominent. The traditional wired communication method makes it difficult to meet the demand in some scenarios due to high cost and construction difficulty. For this reason, this study evaluated the reliability of power distribution cyber–physical systems, considering fifth-generation (5G) mobile communication technology wireless access conditions. First, a reliability model of a communication channel in a 5G communication network was established, and the indirect impact of information system failure on the power distribution system was analyzed. Secondly, a reliability assessment method based on the improved least path method was devised by combining switch action failure, self-healing processing, and load transfer. The simulation results show that 5G communication technology has significant advantages in improving system reliability, and the proposed method is closer to the development direction of future power distribution systems, which provides an effective reference basis for the optimized operation of power distribution cyber–physical systems.
1. Introduction
With the continuous development of new types of power systems, the number of terminal devices in power distribution systems is growing explosively, and dependence on communication networks is also increasing to fulfill the communication requirements of the power sector [1]. Currently, CPDSs typically employ wireless and wired communication methods to monitor and control the data on the physical side to ensure the reliable operation of the system. Although wired communication technologies, such as fiber optic communication, have the advantages of high reliability and security, they also have the disadvantages of high investment, difficult construction, and difficult access in certain physical environments.
The wireless communication technology represented by 5G is considered a key technology supporting CPDSs. Research has shown that compared to traditional wired communication, 5G wireless communication technology provides more flexible deployment options, especially in remote or complex terrain areas, where fiber optics are difficult to lay. This helps to reduce deployment costs and time. 5G technology provides highly reliable communication connections, which are crucial for the stable operation of power systems. The reliability of communication networks directly affects the continuity and security of power supply. The low latency characteristics of 5G networks enable them to support real-time or near-real-time control and monitoring applications, which is crucial for quickly responding to faults and abnormal situations in a power system. The high data transmission rate of 5G networks supports the fast transmission of large amounts of data, which is very useful for handling the large amount of monitoring and control data generated in power distribution systems. Although wireless communication technology provides significant advantages, the integration of CPDSs also brings new challenges. Due to the increasing dependence of physical systems on cyber systems in urban distribution networks, it is important to accurately assess the reliability of the impact of the failure of the information communication system under the conditions of wireless network access. The impacts of information systems in physical systems are categorized as direct and indirect effects.
The direct impact implies that information perturbations (e.g., information component failures and network attacks) can immediately lead to physical failures. Researchers have studied this by building corresponding reliability models. Literature [2] constructed a reliability assessment framework for distribution networks considering multiple types of information perturbations (e.g., cyber attacks, information component failures, and information transmission anomalies) by analyzing the consequences of information perturbations on information systems. Literature [3] constructed a reliability assessment model considering information component damage, transmission delay, and transmission error by analyzing the impacts of information system anomalies on the physical system.
Traditional reliability assessment methods may not fully capture the unique characteristics of physical information systems. Therefore, researchers have developed new methods, such as machine learning-based predictive models, to improve the accuracy and efficiency of evaluations. Literature [4] proposed a reliability evaluation method and indicators for CPDSs in distribution networks, taking into account network interference. The study proposed a reliability modeling method that combined fault tree and Petri net to simulate the reliability of distribution network CPDSs and defined a generalized reliability index for distribution network CPDSs, considering network interference. Literature [5] established a multi-state reliability model based on the failure scenarios of coupled components and used a full binary tree topology traversal method to model distribution network information failure scenarios. Literature [6] proposed a multidimensional network model that used the fault location, isolation, and supply restoration (FLISR) processes as an interface between PDS and DIS. The study constructed a path search method based on the transfer matrix by defining the composite multi-node attributes and the system transfer matrix. Literature [7] considered the impact of sensing terminal faults in information systems on distribution networks. The study proposed a reliability evaluation method for multi-voltage level distribution networks that took into account the effects of sensing terminal faults. The sequential Monte Carlo simulation method was used for reliability evaluation. The above literature has preliminarily explored the impact of cyber systems on physical systems in active distribution networks, but the analysis of the impact of information systems on physical systems is still not sufficiently in-depth.
The focus of research in recent years has shifted to indirect impacts. Literature [8] proposed a reliability evaluation method based on region-based DFA (Distributed Feedline Automation) analysis. This method had high computational efficiency in large-scale CPDSs. The article analyzed the impact of network system anomalies on reliability in DFA mode and constructed a network reliability model by considering two factors: network device failures and network attacks. Literature [9] analyzed the impact of information system failures on the reliability of distribution networks under the DFA mode. It also proposed a fast reliability assessment method for CPDSs. However, compared to the research on direct impacts, indirect impacts still require further exploration and in-depth study.
It is often difficult for a system to adapt to the complexity of the actual distribution network in real distribution network scenarios. Moreover, most of the existing reliability models for CPDSs are based on some simplified assumptions, which cannot accurately assess the reliability of complex situations in real engineering applications. Literature [10] categorized the factors that affect the reliability of the smart microgrid (SMG) for information systems into network failures and information transmission failures. By modeling the interdependence and information transmission failures between information systems and physical systems, a reliability assessment of the SMG was conducted. Literature [11] proposed a CPDN (cyber–physical distribution network) reliability assessment method that considered the interdependence between physical and cyber systems throughout the fault-handling process. The study established a sequential fault handling reliability model and corresponding results based on a fault tree that considered the influence of the network and proposed two metrics for assessing the network’s impact on DG (distributed generation) scheduling capability. Literature [12] established reliability models for components and two systems and summarized the mapping relationship between various network system faults and physical fault-handling. It transformed them into several laws and proposed a reliability assessment procedure in the framework of the Monte Carlo method.
Literature [13] proposed a new information flow modeling and computation method, which established an information flow matrix by defining the network operating parameters as the flow accumulation function, information flow rate, and time delay. Literature [14] established a reliability model for distribution network components based on cyber–physical systems (CPSs) and proposed a multi-state model for intelligent electronic devices (IEDs). Literature [15] simultaneously considered information uncertainty and multi-energy coupling characteristics to establish the basic architecture of an active CPDS, a reliability model of information domain components, and a model for analyzing the effectiveness of information transmission. Literature [16] proposed a sequential multi-stage cooperative recovery strategy for CPS failures caused by natural disasters. It considered the interdependence between cyber and physical systems at the facility, topology, and functional layers and the coupling relationship between grid integration and the recovery process. Literature [17] proposed a reliability modeling and assessment method for power information systems (i.e., cyberspace in the power system), in which a composite Markov model coupled physical properties and information flow performance in a two-layer model. Literature [18] deeply analyzed the communication system requirements to support the operation of a distribution network. The study demonstrated the high reliability and economic advantages of wireless communication technology in CPDSs. From the perspective of multi-layer networks, literature [19] proposed an evaluation method for the importance of communication nodes. The study focused on the operational characteristics of nodes in communication systems and the dynamic propagation of faults between homogeneous communication nodes. However, the impact of communication system reliability on physical system reliability was not thoroughly analyzed. Literature [20] studied the interdependence between information systems and physical systems in a multi-microgrid CPDS. It proposed a reliability evaluation framework based on Monte Carlo simulation. Research has shown that information systems have a significant impact on the reliability of physical systems, but there is no systematic study on the reliability assessment of a CPDS under wireless access network conditions.
The above literature emphasizes the impact of the integration of information systems and physical systems on the reliability of distribution networks. They all take wired access networks as the research object and establish corresponding CPDS reliability evaluation models. At present, research on CPDSs under wireless network access is still in its infancy. Based on the findings of existing research, our work aimed to fill the gap in the existing research and propose a new evaluation method to more accurately simulate and evaluate the reliability of a CPDS under wireless communication network conditions. As stated above, the key contributions of this paper are as follows.
(1) An analytical method was used to model the reliability of the information system components, communication channel reliability, and communication delay reliability of the 5G communication network, and the factors affecting the reliability of wireless communication networks are expressed analytically.
(2) This paper establishes a reliability model of multiple switches in the physical system based on the analysis of the indirect impact of information failure on the physical system.
(3) The reliability model took into account the self-healing treatment of faults, islanding operation, contact lines, load transfer, and the impact of DG access. The reliability assessment was carried out by utilizing the improved least square path method. The results of this study are close to the operation of a CPDS in practice.
2. Channel Reliability Modeling for 5G Communications
2.1. Structure of the CPDS
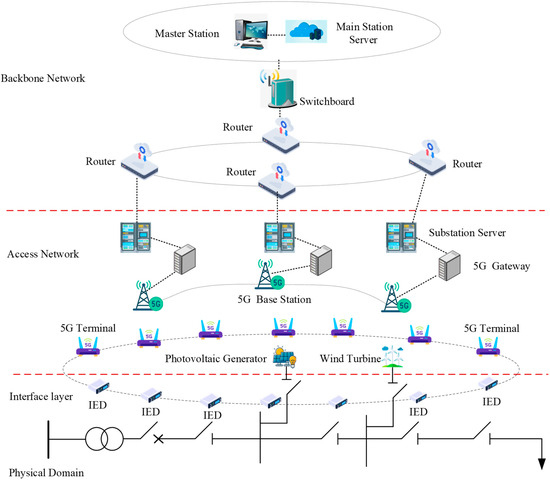
The information domain of the CPDS included the protocols, software, and topology used in the information and communication equipment and communication network. The physical domain included the traditional primary equipment and new energy equipment such as photovoltaic and wind power as well as the energy storage equipment, and its structure is shown in Figure 1.
Figure 1.
Physical, converged information distribution network structure.
In the figure, the information domain is divided into the backbone network and the access network. The backbone network adopted the SDH (synchronous digital hierarchy) transmission protocol to connect the power distribution master station and substations. The access network adopted the 5G wireless network based on the IEC104 protocol to connect the distribution electronic station and intelligent electronic devices. The control command of the information layer determined the operation state of the physical layer, and the operation state of the physical layer determined the data input of the information layer, and there was a close interaction between the two.
The application layer realized the analysis and processing of information (decision generation) and human–computer interaction and was located in the main power distribution station (or substation). The communication layer was divided into two parts, namely, the distribution of electronic stations between the control center and the backbone communication network. It mainly adopted fiber optic SDH or a multi-service transmission platform (MSTP) ring network structure, with multiple channels and multiplexing layers. The access communication network from the substation to the distribution terminal, also known as the distribution communication network, adopted various communication methods such as Ethernet, power line carrier, wireless, etc. The interface layer included the first section of the feeder. The interface layer included the feeder first section protection device, feeder terminal unit (FTU), distribution terminal unit (DTU), inverter, and other intelligent distribution terminals.
Due to the structure of CPDSs, wireless communication technology can serve as a supplement to wired communication, providing additional communication paths. When wired networks fail, wireless networks can serve as backups to ensure the continuous transmission of critical information, thereby improving network redundancy and reliability.
2.2. Wireless Channel Model
In wireless communication networks, to study the performance of the network, the most important thing is to test the reliability of the network communication channel, so it is necessary to establish a reasonable wireless channel model. Before studying the channel of the network, it is necessary to understand the propagation characteristics of electromagnetic waves in the wireless channel. The wireless channel is a very complex dynamic channel, electromagnetic wave propagation in space is mainly direct, reflective, scattered, diffracted, etc. Electromagnetic waves through the wireless channel will produce attenuation so that the signal strength received at the receiving end is weakened; this phenomenon is called fading.
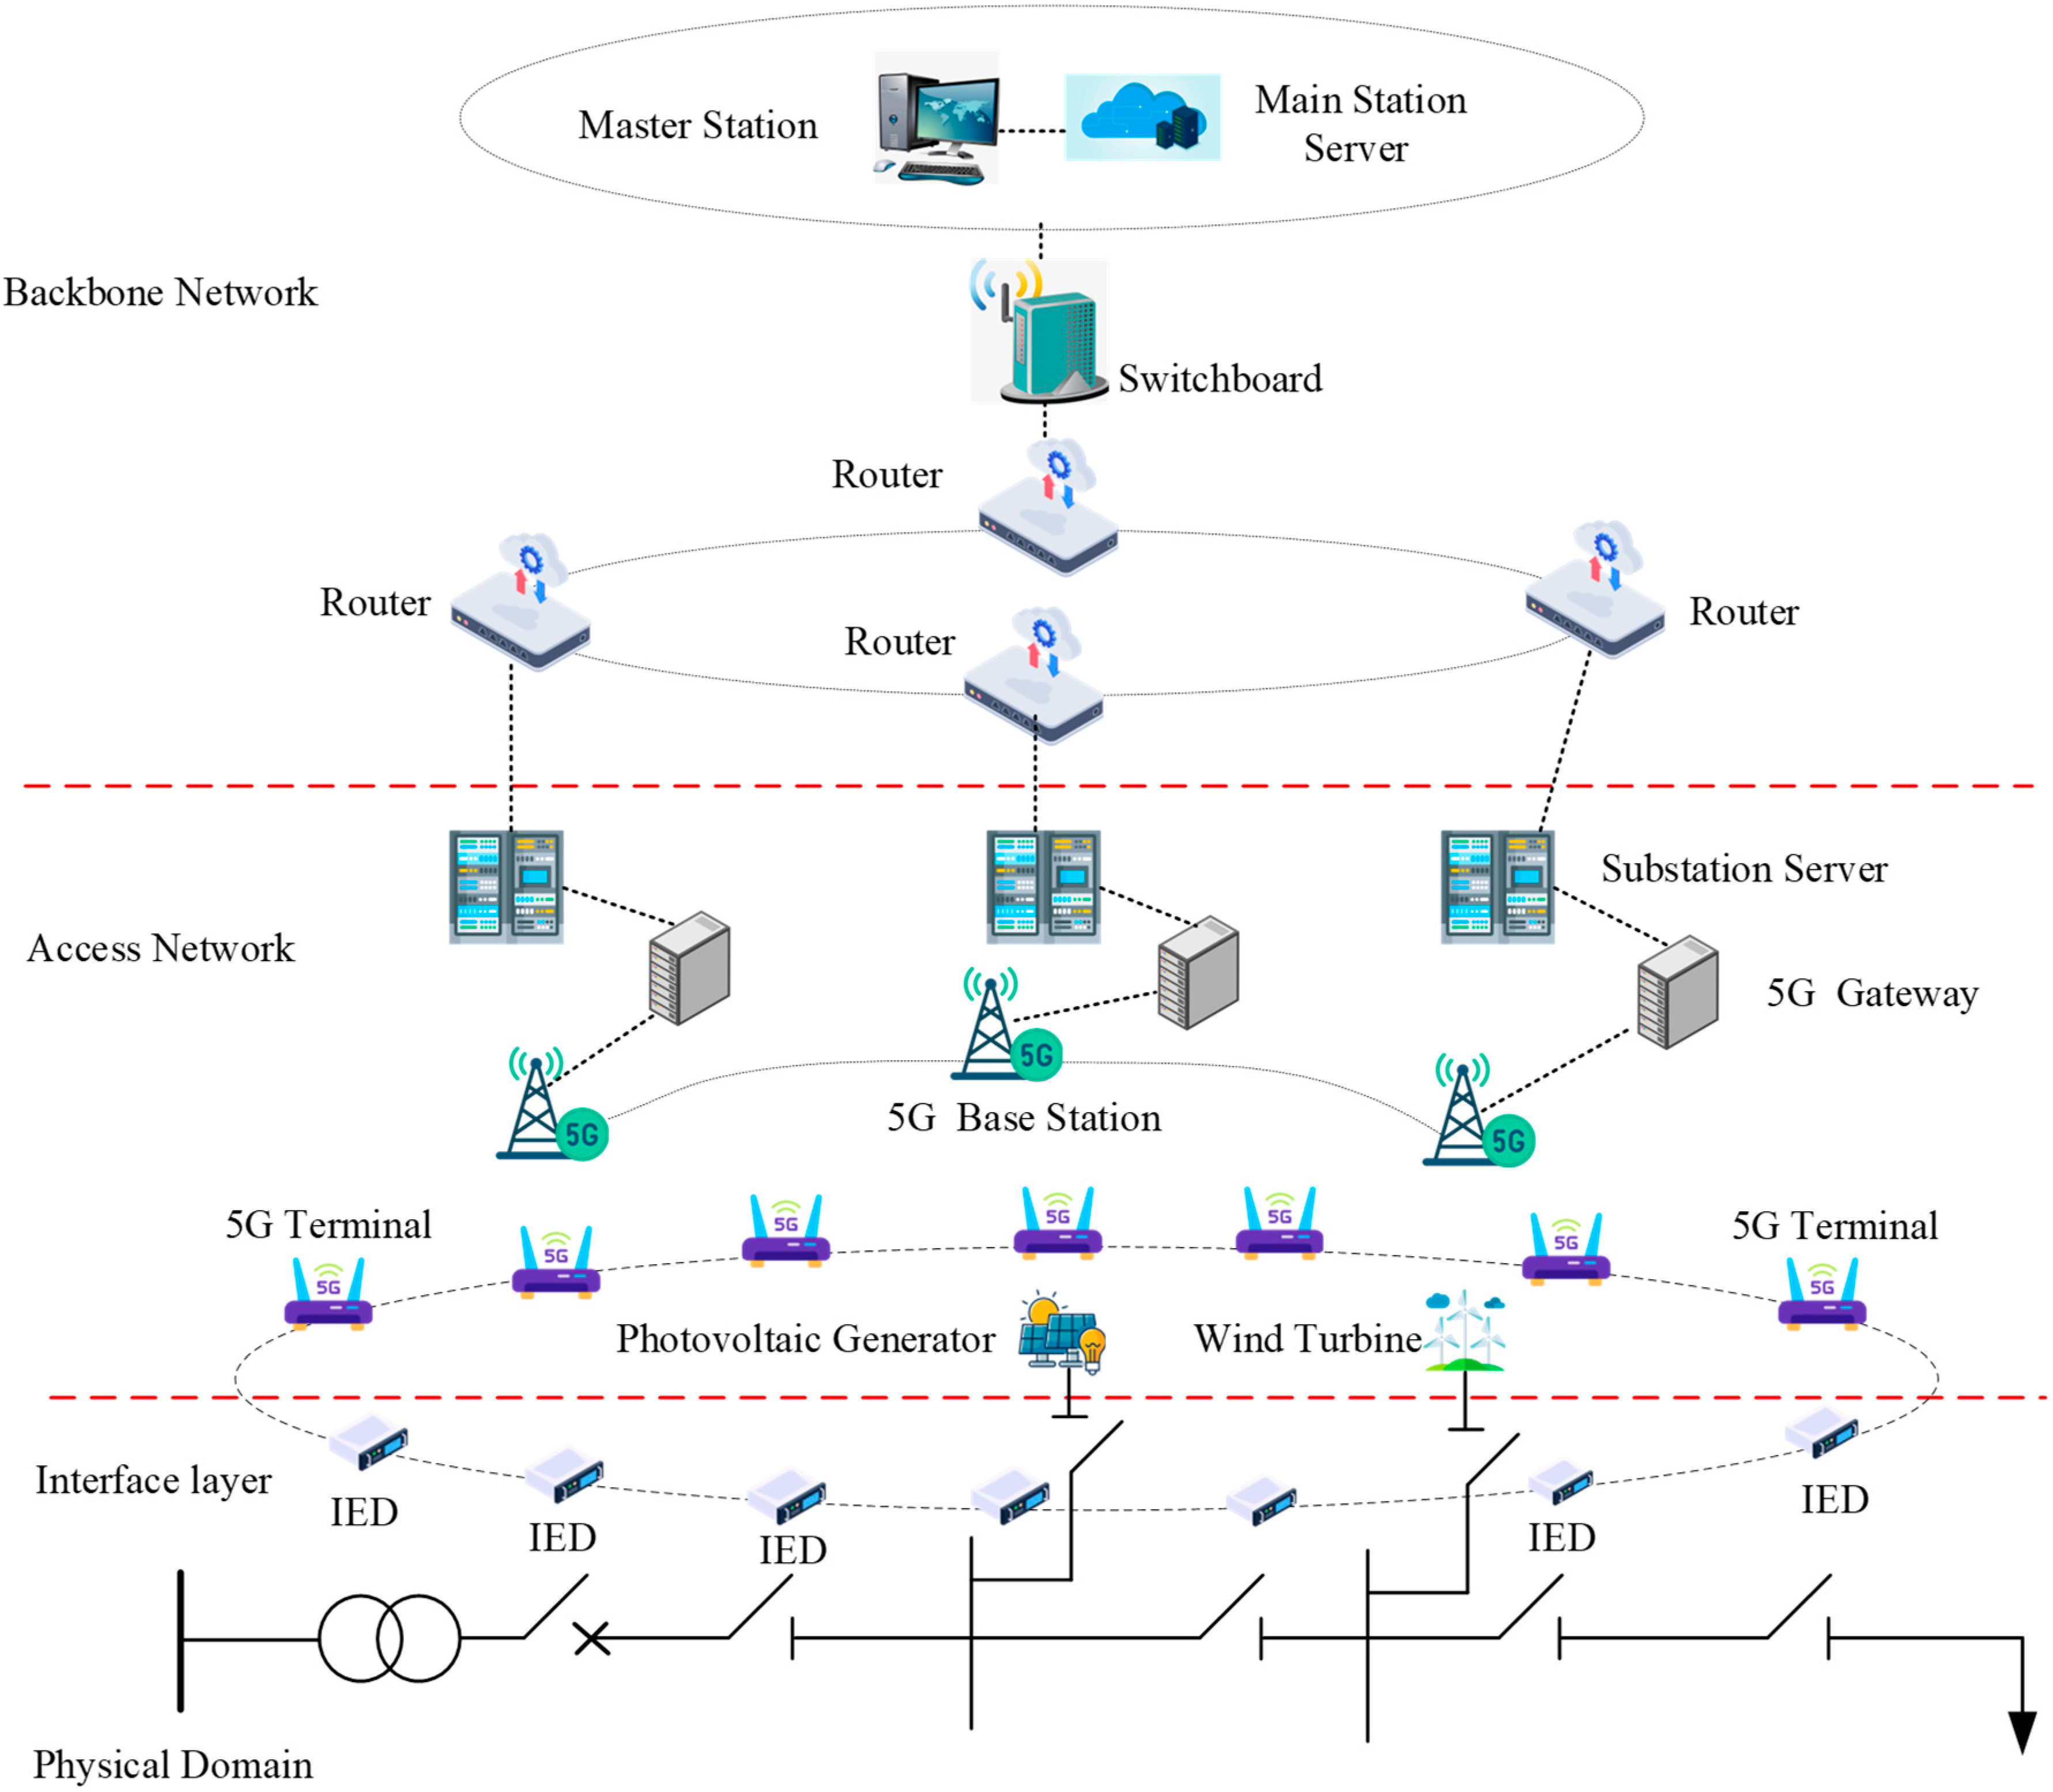
To provide a more intuitive explanation of the fading phenomenon in wireless channels, we created Figure 2. Figure 2 shows that the fading of wireless channels mainly includes large-scale fading and small-scale fading. Large-scale fading includes path loss and shadow fading, while small-scale fading mainly includes Rayleigh fading.
Figure 2.
Various types of fading in wireless channels.
Path loss is directly proportional to propagation distance and is influenced by the propagation environment. High path loss can lead to a decrease in the power of the received signal, thereby reducing the signal-to-noise ratio (SNR) and affecting signal demodulation and correct data reception. Shadow fading is a random signal attenuation caused by large obstacles (such as buildings) during the propagation of wireless signals, usually modeled as a log-normal distribution. This can lead to uneven signal coverage. Some areas may experience a significant decrease in signal strength due to signal obstruction, affecting communication quality. Rayleigh fading is a small-scale fading model used to describe the rapid changes of wireless signals in multi-path environments, typically used to simulate wireless channels in urban environments. This kind of fading can lead to rapid fluctuations in the signal, affecting its stability and reliability, especially in high-speed data transmission. In this study, a composite channel fading model considering path loss and shadow fading was used to study the reliability of wireless networks.
In a wireless communication network, all data packets are used to transmit information over a wireless channel. The source node and the nth (n) relay node are called node 0 and node n, respectively, and the destination node is called node N + 1. Suppose node n (n) sends a signal to node n + 1. The quality of the received signal can be measured by the SNR at the receiving end, which can be expressed as
where is the transmit power of node n. denotes the background noise power of the receiver. denotes the channel gain of the wireless channel between node n and node n + 1, which, in dB form, can be expressed as
where means 10. G is a dimensionless constant indicating the path loss coefficient at the reference point , the value of this parameter depends on the characteristics of the antenna as well as the average channel attenuation. indicates the power loss index of the wireless channel, the value of which depends on the area and environment where the wireless channel is located, and its value usually ranges from 2 (in free space) to 6 (in the urban downtown area) [21]. indicates the reference distance (the reference point must be in the far-field area of the antenna). indicates the straight line distance between node n and node n + 1 (the reference point must be in the far-field area of the antenna). denotes the shadow fading of the signal, and, usually, obeys the log-normal distribution. is a normally distributed random variable with a mean of 0 and variance of . In wireless communication, to ensure the accuracy of the received signal, the SNR of the received signal is usually required to be more than a certain threshold, expressed mathematically as
where denotes the desired SNR threshold.
2.3. Reliability Analysis of Wireless Channels
The probability of successful signal transmission is defined as the probability that the SNR of the signal does not fall below the SNR threshold. Thus, the channel reliability between node n and node n + 1 can be defined as
Substituting (2) into the above equation, we get
where the parameter can be expressed as
The function (5) in the formula represents the error function. The error function is defined as
The function is the cumulative distribution function (CDF) of the standard normal distribution function, which is defined as
From the system model, it can be seen that to ensure the reliability of the signal reception, each packet is repeatedly sent K times, so the probability that node n + 1 successfully receives a packet from node n can be expressed as
The function erfc(x) represents the complementary error function, which is defined as
Furthermore, Formula (9) can be used to derive the link reliability of the entire wireless sensor network as
3. Probability of Reliable Operation of Switching Elements Under the Influence of Information Systems
3.1. Probability of Reliable Circuit Breaker Operation
As a typical switch of the distribution network, the circuit breaker will break the branch in time once the fault is found, which is consistent with the function of the traditional power grid circuit breaker, and can act without the control center to issue commands. However, the transmission between the circuit breaker detection, calculation, and action modules can also fail, resulting in switch action failure; such failures should be categorized as secondary equipment failures, so the probability of reliable action of the circuit breaker itself is , which is the probability that the switch, being in a normal state, will not fail to act.
3.2. Probability of Reliable Operation of Sectionalized Switches
The telemetry of sectional switches is an important basis for fault area determination in distribution stations. If the monitoring information of a sectional switch is invalid, the control center can only use the monitoring information of its upstream sectional switches to determine the fault location, and the sectional switch can not act normally to isolate the fault, which leads to the extension of the fault isolation range. After completing the fault location decision, the control center will issue control commands to the switch with valid monitoring information that is closest to the fault point to isolate the fault area. At the same time, the control center will judge whether the fault isolation is successful or not through the control feedback information of the switch.
If the control information or control feedback information is invalid, the control center will mistakenly believe that the fault has not been successfully isolated and send control commands to the upstream switch in turn until it is determined that the fault has been successfully isolated.
Since the uploading of monitoring information, issuing of control instructions, and uploading of control feedback information are independent of each other, the probability that the faulty upstream switch can successfully act by the instructions of the control center and that the control center can confirm that the fault has been successfully isolated by the switch is
where is the probability that the monitoring information of switch i is valid. is the probability that the control information of switch i is valid. is the probability that the control feedback information of switch i is valid. Also, i ∈ N.
Consistent with the circuit breaker, due to the design defects of the switching element itself, there is still a certain probability of refusal to act after receiving the control command, so the probability of successful operation of the sectionalized switch is
where is the probability of reliable operation of the sectionalized switch itself.
3.3. Probability of Reliable Operation of the Contact Switch
For a distribution network with a defined transfer range, when the control center determines the fault location through the fault monitoring information transmitted by each circuit breaker and sectional switch, if the sectional switch upstream of the transfer area is successfully actuated, the control center will send control information to the contact switch to realize load transfer, and once the contact switch is successfully actuated, the load will be able to successfully restore power supply. Therefore, the probability that the contact switch can be successfully actuated can be expressed as
where is the valid probability of control information of the contact switch j in the transferable supply region. is the probability of the reliable operation of the contact switch itself. j ∈ N.
4. Reliability Assessment of Power Cyber–Physical Distribution Systems Under the Influence of Information Systems
In this study, based on the idea of an analytical solution, the branch reliability parameters were firstly equivalently aggregated to the head node of the branch and then, for various types of users, the minimum path method was utilized to solve their power supply reliability. We considered the characteristics of cyber failure and modified the equivalent average outage time model of downstream faults processed by switches. This manuscript argues that the equivalent average outage time is not equal to the switch action time of traditional distribution networks. We expected equivalent power outage time for both successful and failed switch actions. So, we propose an equivalent fault time calculation method that considers the participation of multiple switches in fault isolation based on this. At the same time, the reliability calculation model used in this study considers the power supply capacity of the contact network and the planned islanding. Planned islanding refers to isolating a part of the power grid from the main grid when a fault occurs, forming an independent and self-sustaining power system. The model combines the effective action probability and switching rejection rate of the micro power supply to provide the probability of contact network power transfer and planned islanding operation probability. This is more in line with the actual operation of a distribution network.
4.1. Upward Equivalence of Branch Reliability Parameters Considering Switching Action Failures
Faults in any element on a distribution branch may spread to the upstream area, and whether or not fault spreading occurs depends mainly on the successful operation of the branch’s switches. Since the action of the circuit breaker does not require the cooperation of the control center communication and can disconnect the branch in time with a certain probability after detecting the fault current, the equivalent fault rate for the feeder f with the presence of a circuit breaker at the first end can be expressed as
where is the equivalent failure rate of branch f. is the failure rate of the element on branch i or the lower branch. is the total number of elements on branch f or the lower branch.
When considering physical faults alone, it is often determined that the switches can be reworked using manual methods, and the equivalent outage time of the fault in the area downstream of the switch is the switch action time, or the sum of the switch action time and the manual operation time, which fails to reflect the self-healing process of faults in a highly automated distribution network. Therefore, this paper offers a formula for calculating the equivalent outage time of switch .
where is the repair time of the upper element or lower branch of branch i. is the switching action time.
At the same time, whether or not a fault spreads in a component of a branch circuit does not only depend on one of the upstream switches; all of the upstream switches may successfully operate and isolate the fault. Therefore, for branch circuits containing sectionalized switches, isolation of the fault requires the coordination of multiple switches. The branch circuit can be divided into N regions according to the sectionalized switches. For a distribution branch circuit containing sectionalized switches, once a fault occurs, all of its upstream sectionalized switches will try to isolate the fault sequentially under the remote control commands, so the equivalent fault rate of this branch circuit is
where is the failure rate of the i-1st region. M is the number of sectionalized switches in the branch.
The repair time for the region downstream of switch i, if the switch successfully isolates the fault, is the sectionalized switch action time ; otherwise, the upstream switch will actuate up to the branch circuit breaker or branch node. Therefore, for the region downstream of switch i, the equivalent fault time is
Included among these is
where is the equivalent outage time of the area downstream of switch j in the branch circuit. is the repair time of switch j.
4.2. Minimum Road-Based User Reliability Solution Method
According to the relationship between distribution network users and power sources, users in the physical layer of the distribution network can be broadly categorized into two types: ordinary users and transferable users.
4.2.1. General User Reliability Calculations
For an ordinary user of the distribution network, its relationship with the power point can be obtained by directly finding the minimum path between it and the main power source. The failure rate and average outage time for user n are
where and are the failure rate and repair time of user n, respectively. and are the equivalent failure rate and repair time of user n’s non-minimum road branch j, respectively. is the number of user n’s non-minimum road branch i. M is the number of minimum road components or equivalent branches between the user and the main power supply.
4.2.2. Reliability Calculation of Users Within the Isolated Island
The successful operation of the planned islanding is related to factors such as the operational status of the islanding and the operation strategy of distributed power sources within the islanding. Therefore, the probability that a planned island can form and operate stably can be expressed as
where is the probability that the planned island q can provide power to the planned island users in island operation mode. is the probability of the effective operation of the energy storage battery. is the probability of the effective operation of DG.
The effective operation of a micro power supply relies on the monitoring, control, and effective probability of feedback information from the information system in the CPDS.
where , , and represent the effective probabilities of DG monitoring, control, and control feedback information in the island, respectively. , , and are the effective probabilities of energy storage battery monitoring, control, and control feedback information, respectively.
For user n within the planned island, when there is an external fault, there is a probability that user can restore the power supply through the planned island. Therefore, the outage rate of user n within the planned island can be expressed as
where represents the number of components or equivalent branches on the minimum path between island q and the main power supply.
When a failure occurs outside the planned island, if the planned island q can successfully enter the island operation, the average power outage time inside the planned island is the island switching time ; otherwise, the power outage time is the equivalent of the power outage time outside the planned island. Therefore, the average power outage time for user n is
where and are the equivalent failure rate and outage time from user n to PCC, respectively.
5. Calculus Analysis
5.1. Simulation System and Parameters
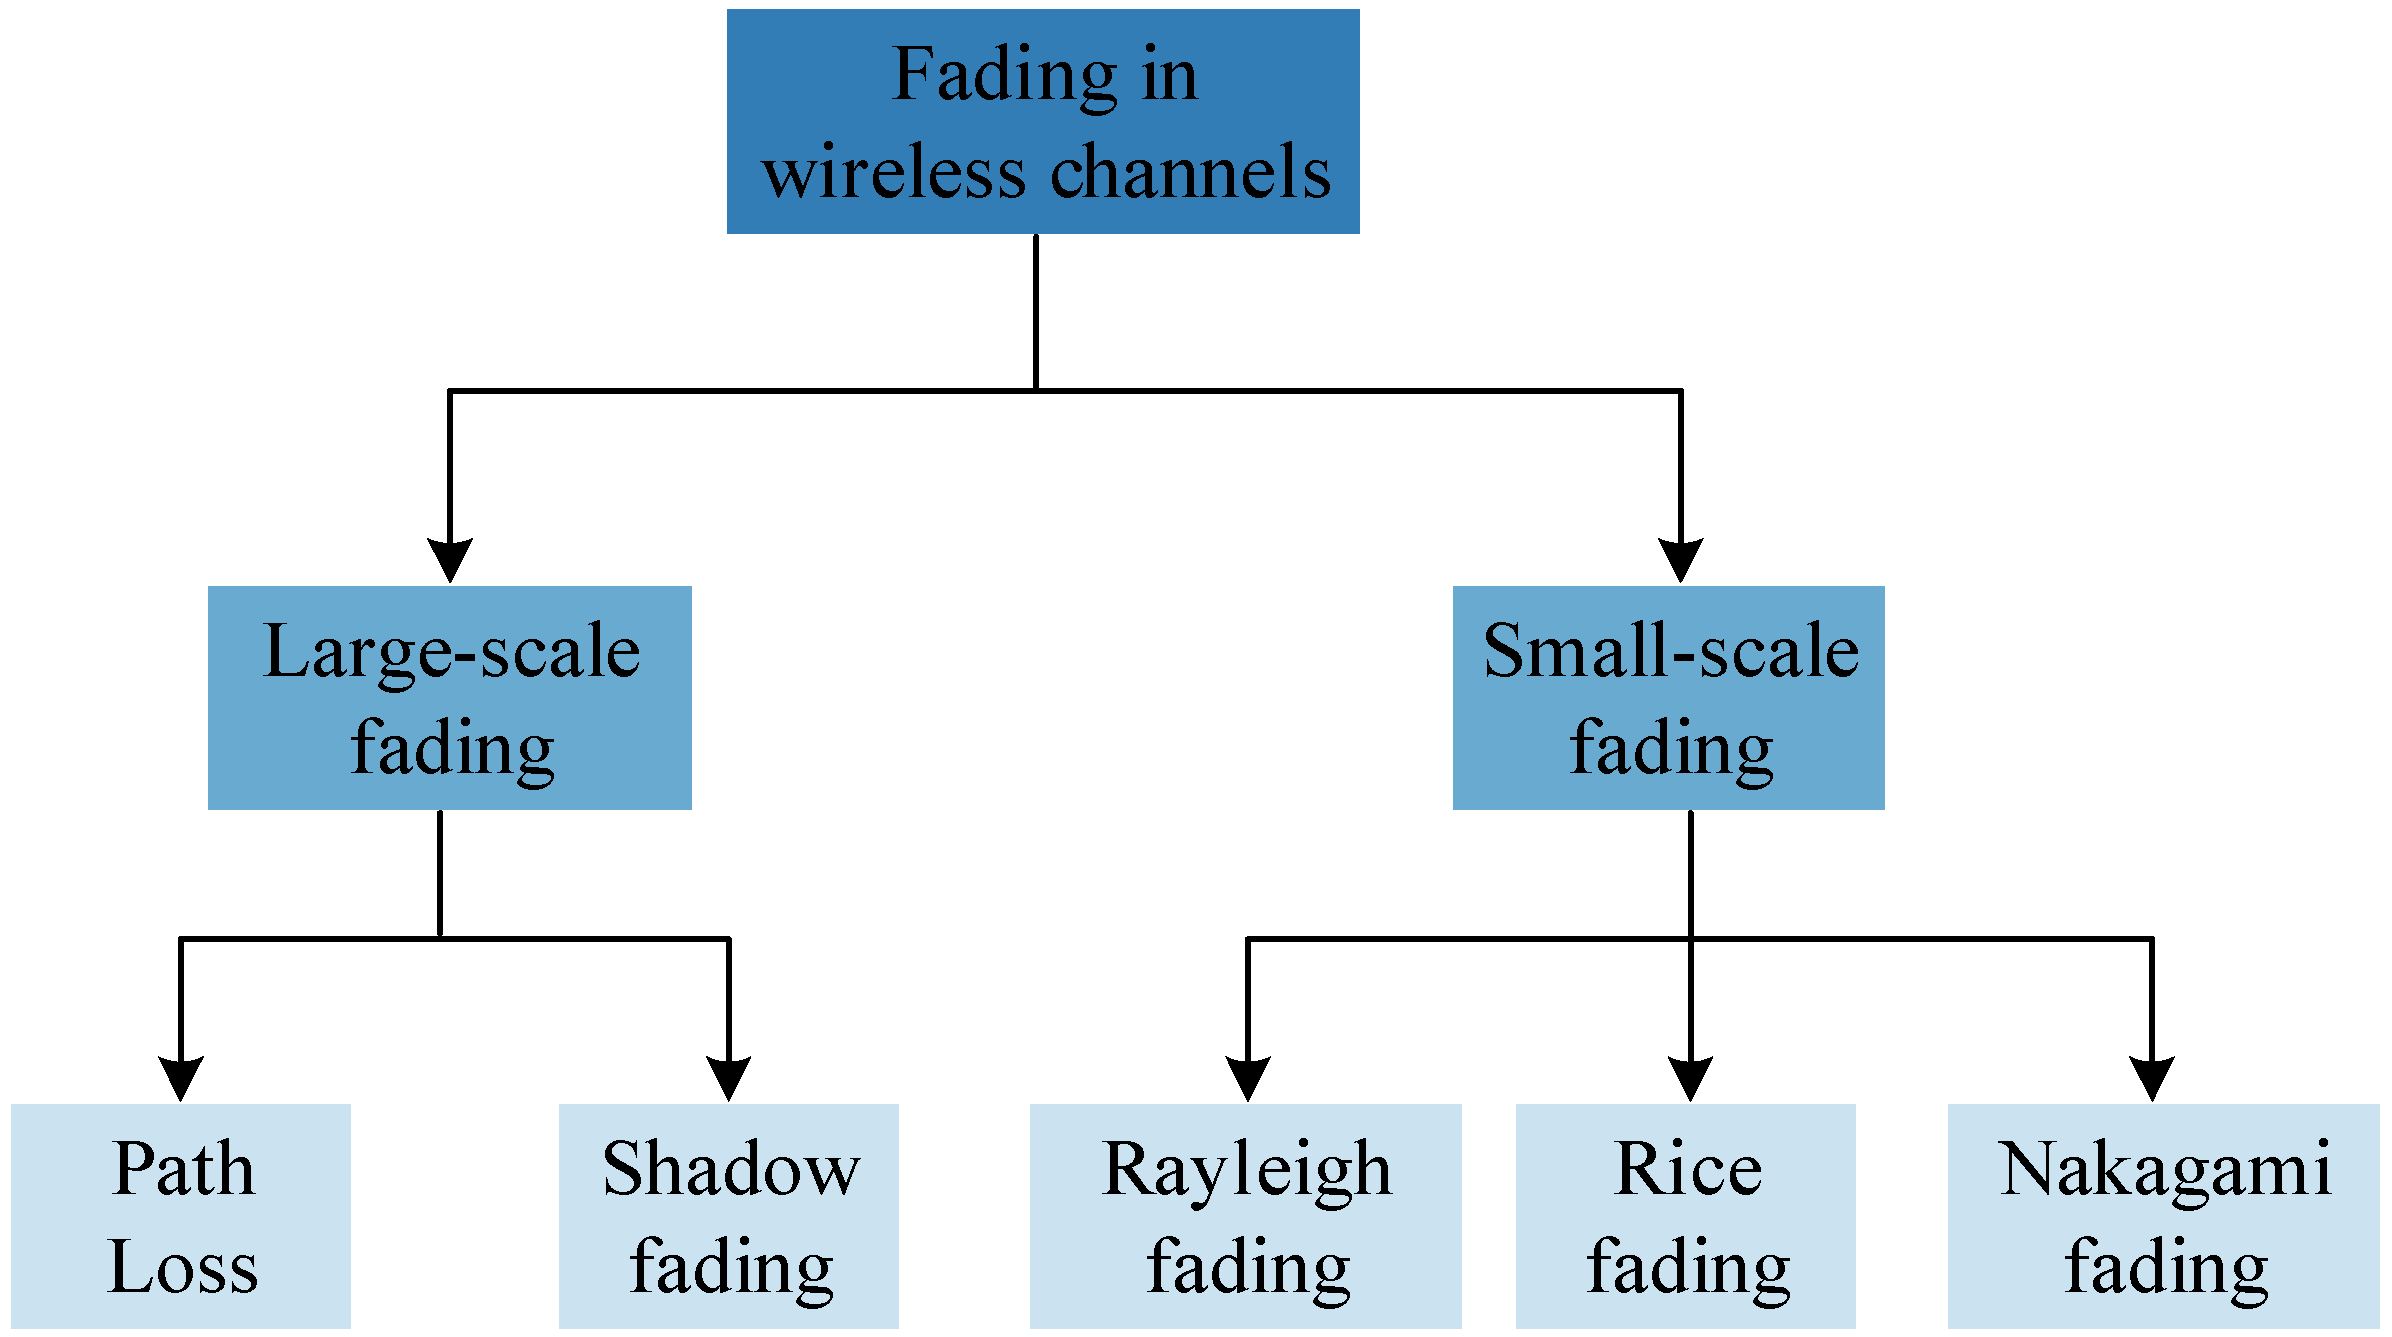
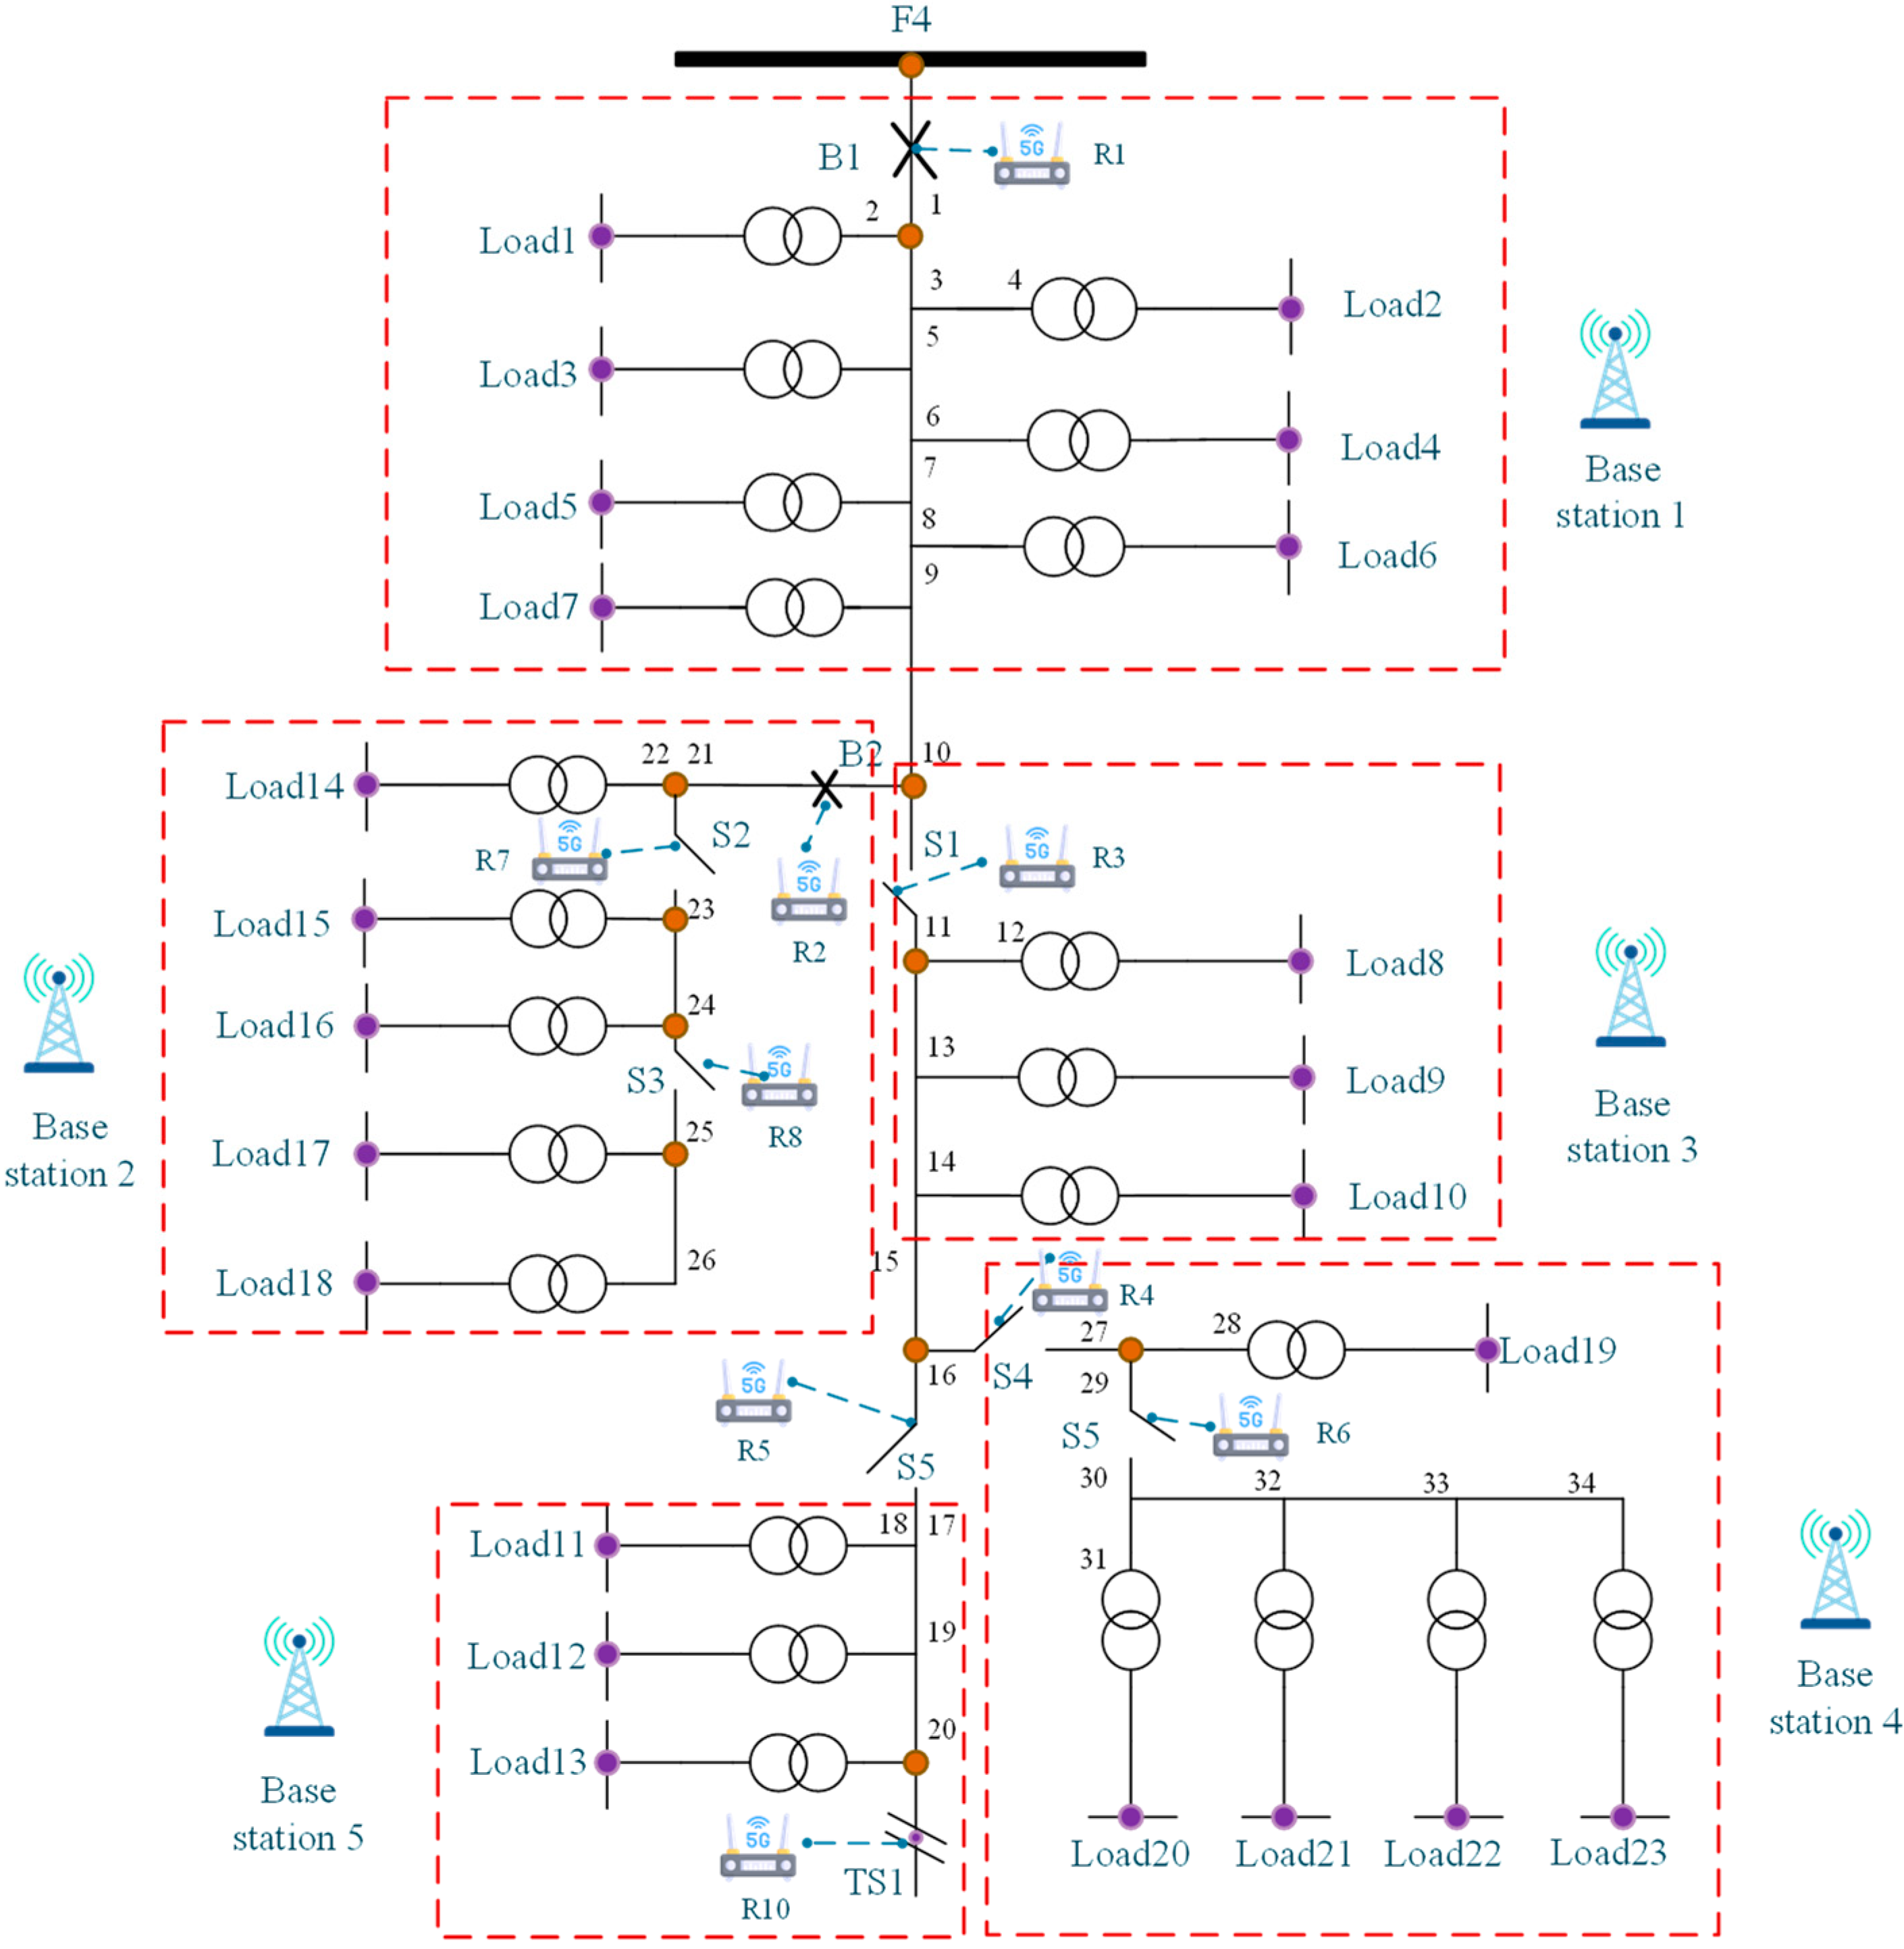
After establishing the theoretical model, we validated our method by constructing a simulation system. In this paper, the main feeder 4 of IEEE-RBTS BUS6 was taken as an example [22], and the system wiring is shown in Figure 3. This feeder contained 23 load points and 1225 users, totaling 34.26 megawatts. These parameters reflect a medium-sized distribution network and were sufficient to demonstrate the effectiveness of the model in handling complex networks. It also included distributed energy equipment, such as a 6 MW photovoltaic power generation unit and a 6 MW/32 MWh energy storage system. The reliability parameters of components in the system can be found in the reference literature [22]. Different from the traditional wired access network, the access network in this study adopted a wireless 5G communication network and the data transmission backbone network adopted a wired ring network structure, which included a total of five base stations, and the coverage area of each base station is shown in Figure 3.
Figure 3.
Information system architecture.
Figure 3 shows that the network consisted of multiple nodes, including base stations and load points. The base station represented the key hub of the network communication, while the load point represented the location of power consumption. Each load point was connected to a base station through a wireless 5G network, which was responsible for transmitting and receiving wireless signals. The “R” in the figure represents a repeater or router in the network, used to expand the coverage range of wireless signals. The “S” in the figure represents different communication paths or channels, which could result in corresponding losses and delays. The advantage of this structure lies in its ability to quickly adapt to environmental changes and support remote monitoring and control. Simultaneously, it can reduce deployment and maintenance costs.
The causes of communication delays are complex. On the one hand, they are related to the network load rate. On the other hand, they are related to the number of times information is forwarded. This characteristic can be represented by the probability density function of information element delay. Different information devices have different transmission characteristics; for example, the information transmission of fiber optic lines usually follows an exponential distribution model. The information delay of switches and 5G wireless routers follows a Pareto distribution model with parameters of 67.9 ms and 20. The information transmission delay of IEDs follows a normal distribution model with parameters of 68.35 and 11. These parameters were obtained based on extensive simulation calculations and mathematical analysis in the existing literature. Therefore, the communication node delays followed a Pareto distribution model with parameters 67.9 ms and 20 [23]. The forwarding delay of the IEDs followed a normal distribution N (68.35,11) [24], while the communication line delays were modeled by an exponential distribution [25].
The setting of the upper limit of communication delay usually depends on the size of the information system. Therefore, the communication delay upper limit set in this study was selected from information systems of a similar scale in the published literature.
The latency of a distribution information physical system is related to network bandwidth, routers, and network structure. Communication protocols can also affect latency, and this study considered communication protocols under the IEC61850 standard. Considering that the communication system established in this study was relatively small in scale, the maximum system delay was set to 600 ms. This was selected based on the settings of information systems of a similar scale in the published literature [26]. When the access network is a 5G wireless public network, the information processing capacity and time of each node in the network are basically the same. The failure rate of network nodes is generally between 10−5 and 10−3. This value can be determined based on the size of the network. The failure rate of IEDs and communication nodes is generally a fixed value. The failure rate for communication nodes and IEDs was set to [27].
5.2. Calculation Results and Analyses
5.2.1. Influence of Information System on System Reliability Assessment
In order to study the impact of information system failure on system reliability, this study analyzed the following two aspects. ① The impact of overall information system failure on system reliability. ② The impact of information component failure on system reliability.
In the study of the impact of information system failure on the reliability of the distribution network system, this research adopted the method of comparative analysis to analyze the average power supply availability (average service availability index, ASAI), the expectation of shortage of electricity supply (expected energy not supplied, EENS), average system outage frequency (system average interruption frequency index, SAIFI), average system outage time (system average interruption duration index, SAIDI), and average duration of outages for customers (customer average interruption duration index, CAIDI), with both no consideration and consideration of information system failure. The results are shown in Table 1.
Table 1.
Calculation results of system reliability.
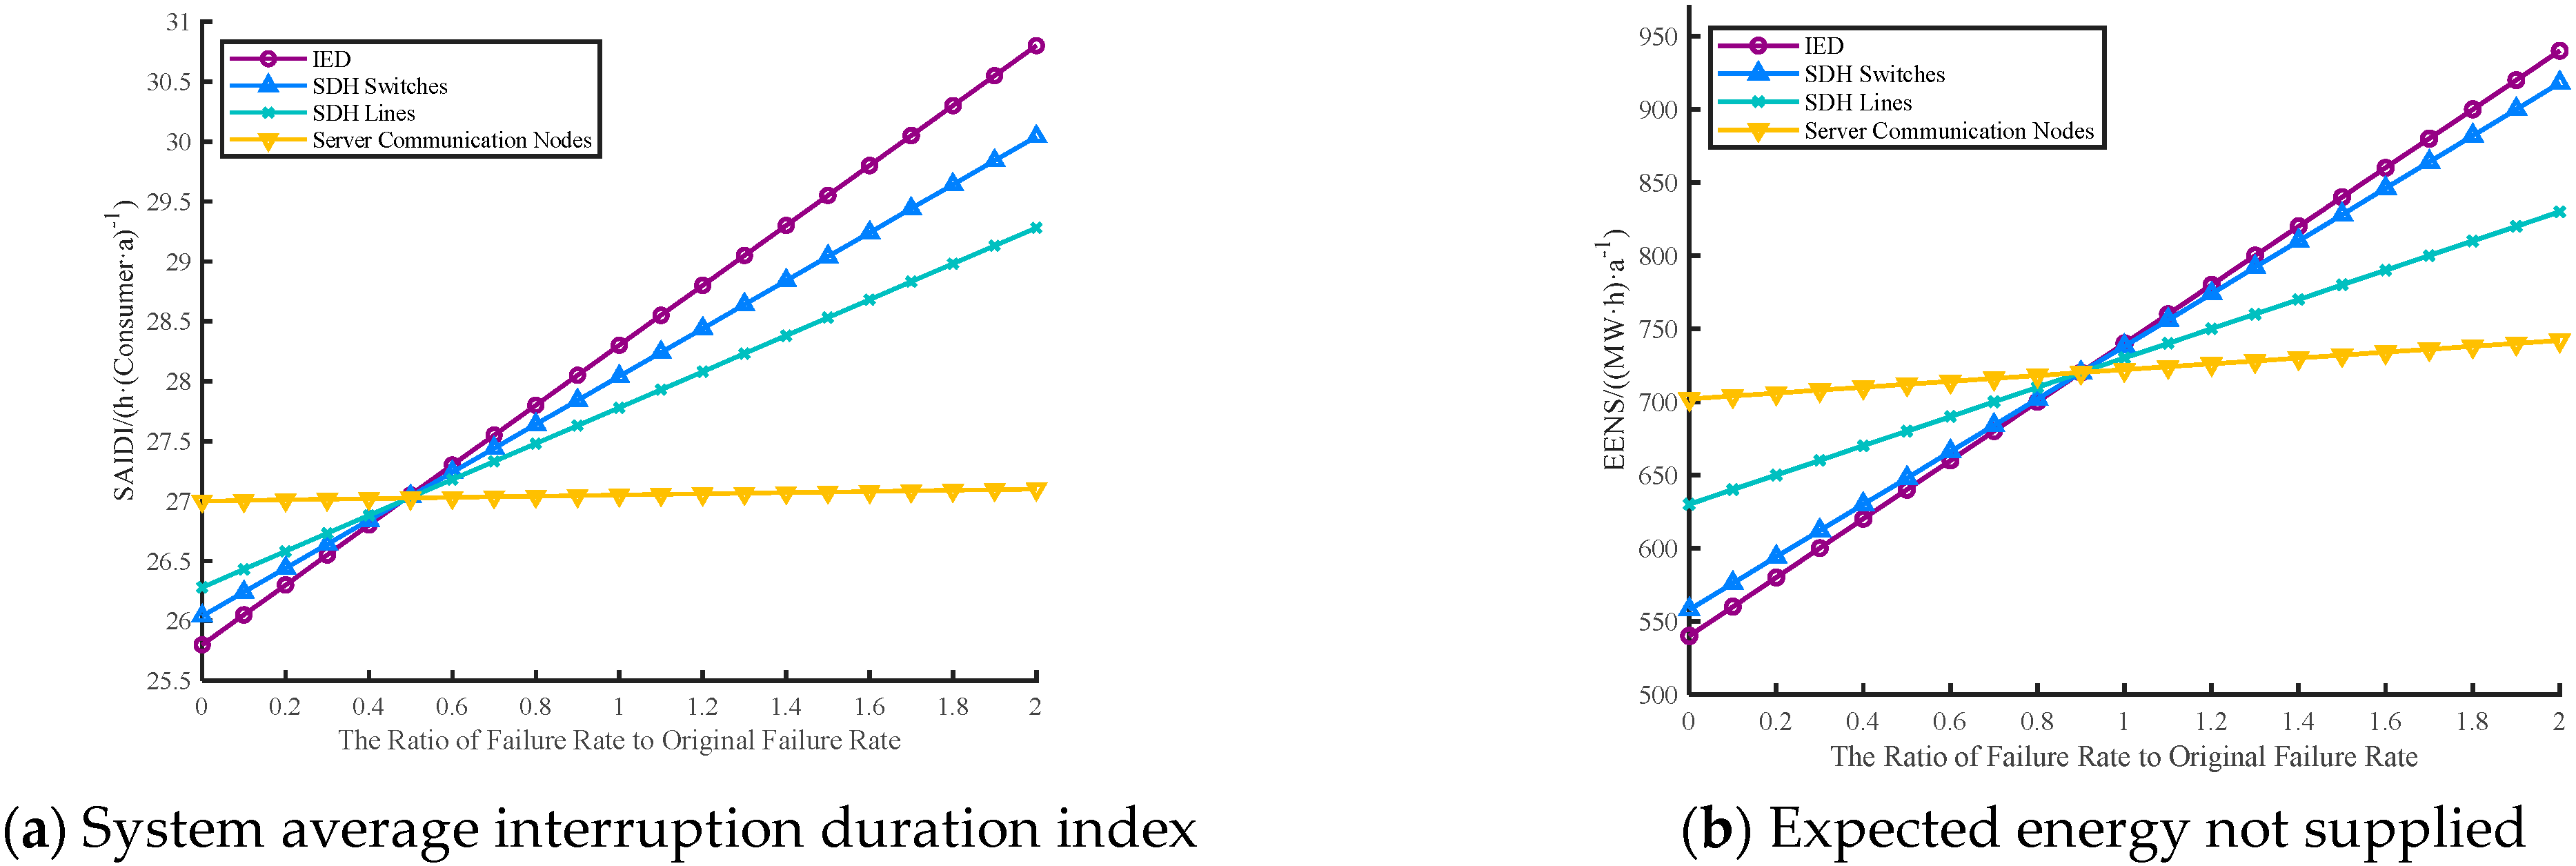
From the results in Table 1, it can be seen that although information system failures have a certain negative impact on the reliability of a power system, the impact is relatively small. In order to further investigate the impact of information system component failures on system reliability, the failure rate of each type of information component was reduced to 0 or increased to 200%, with a step size of 10%. At the same time, we kept the failure rates of other components constant and conducted multiple simulations to take the average. We fitted the data points to obtain reliability index curves for four types of information IEDs, SDH switches, SDH lines, and server communication nodes under different failure rates. The reliability index curves of components under different failure rates are shown in Figure 4.
Figure 4.
Trend of system reliability index under different failure rates.
From Figure 4, it can be seen that changes in the failure rate of information equipment have different degrees of impact on the reliability of CPDSs, in descending order of IEDs, synchronous digital hierarchy SDH lines, SDH switches, and server communication nodes. With the increasing failure rate of components, IEDs have the greatest impact on system reliability. Due to their large number and high failure rate, a further increase in the failure rate will result in a large number of IEDs failing, thus reducing the reliability of the active distribution network. In comparison, servers have the least impact on system reliability due to their extremely low failure rate due to the presence of a backup mechanism. In summary, the development and use of high-quality IEDs, the addition of standby for SDH switches, and the regular maintenance of lines are all effective measures to reduce the failure rate of information systems and increase the reliability of active distribution networks.
5.2.2. Impact of Communication Delay and Access DG Capacity on Reliability
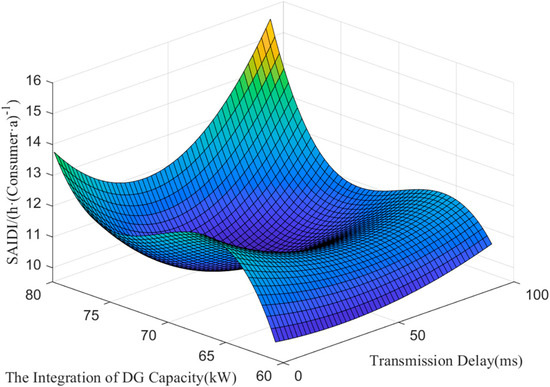
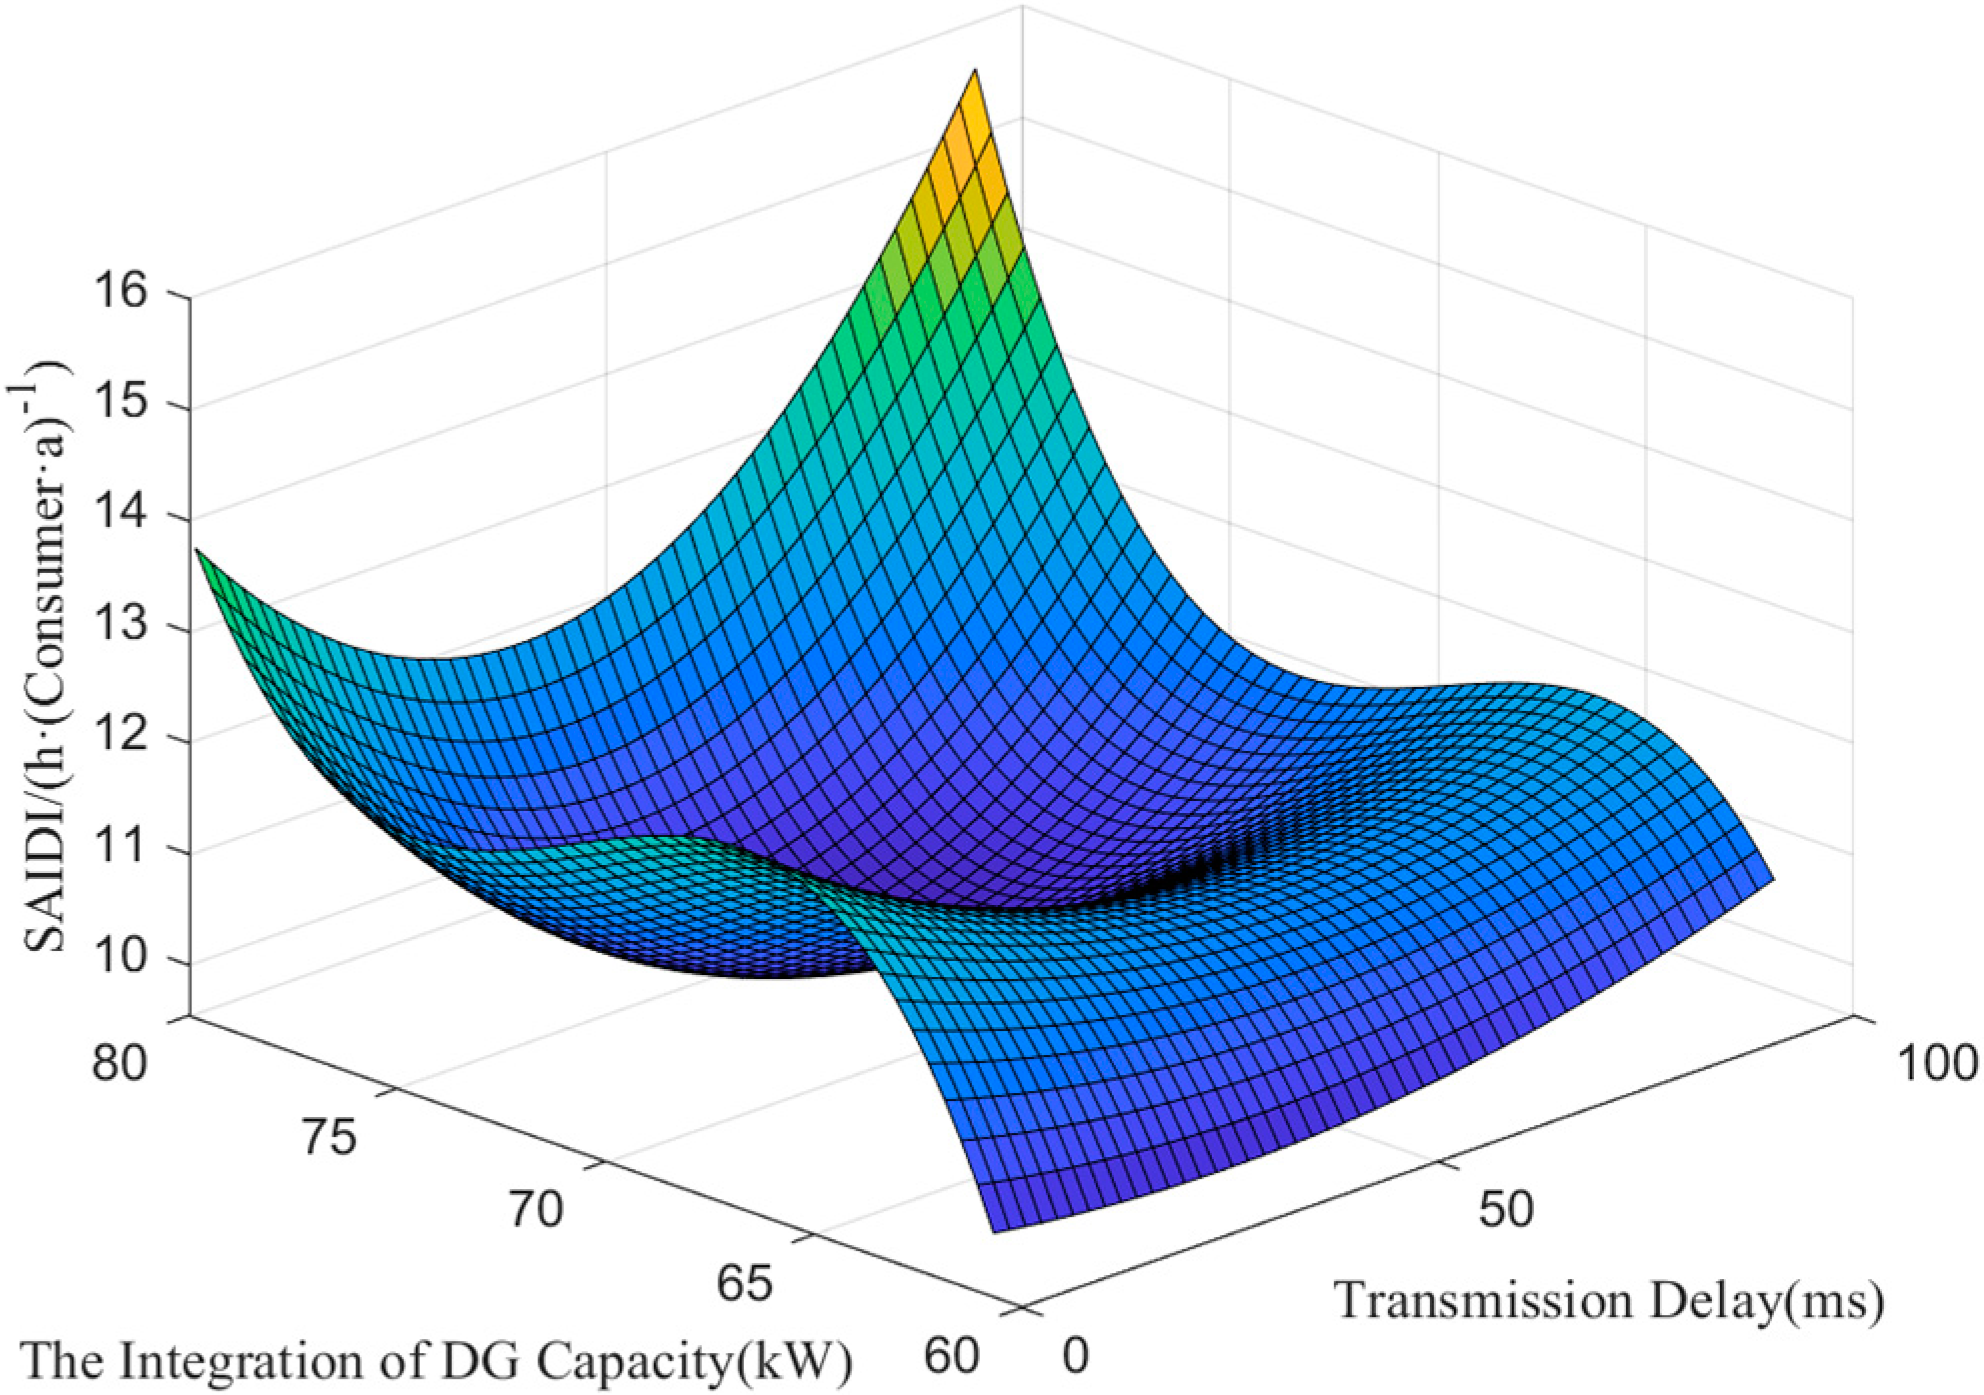
Micro power plays a vital role in active distribution networks and can effectively reduce load losses and increase power supply reliability. When an information system is not completely reliable, changes in the capacity of DG will have more complex impacts on the reliability of the distribution network power supply system. Considering this situation, this study gradually increased the access DG capacity from 0 to 80 kilowatts while the communication delay increased from 0 to 100 milliseconds and calculated the system’s reliability index SAIDI. The results are shown in Figure 5.
Figure 5.
Variations in system reliability indices under different noise power levels.
As can be seen in Figure 5, as the communication delay increased, the SAIDI index gradually increased. This indicated that in the CPDS composed of wireless communication, transmission delay had a huge impact on the reliability of the CPDS. Compared with wired communication, in the CPDS composed of wired communication, information was mainly transmitted through optical fibers. Its transmission channel was simple and it did not require complex forwarding and transmission. In addition, the risk of information loss was low. Therefore, the impact of information transmission delay on wireless communication was much greater than that on wired communication.
However, the increase in DG access capacity delayed the increase in SAIDI and resulted in a minimum value. In this example, the reliability of the system was highest when the access capacity of DG was 68 kW. The results also indicated that the access of DG could indeed improve the reliability of the CPDS, but when the communication delay continued to increase, the further increase in the access capacity of DG led to a faster increase in the value of SAIDI. This was because at this point, the communication system had completely failed, and physical faults could only be handled manually.The research results of this case study can play an important role in the planning of reasonable DG capacity in CPDSs.
5.2.3. Analysis of the Impact of Information System Failure on Plan Islanding
Distributed new energy plays a vital role in active distribution networks and can effectively reduce load loss and improve power supply reliability. However, the operation of the microgrid cannot be separated from the control center. Therefore, this study established the following three scenarios to analyze the impact of micro power on the reliability of active distribution networks. ① Scenario 1: active distribution grid without a micro power supply, considering dual system faults. ② Scenario 2: active distribution grid with a micro power supply, considering dual system faults. ③ Scenario 3: active distribution grid with a micro power supply, considering dual system faults but not considering the impact of information system faults on the micro power supply.
This study analyzed and compared the changes in five indicators, ASAI, EENS, SAIFI, SAIDI, and CAIDI, in the above three scenarios. The results are shown in Table 2.
Table 2.
Calculation results of system reliability under scenarios 1, 2, and 3.
The results show that the presence of distributed new energy sources could indeed improve the reliability of the active distribution networks, and access to the DG caused the system reliability indicators EENS, SAIDI, and SAIFI to decrease by 1.01%, 2.67%, and 6.41%, respectively. However, this was slightly lower than the reliability metrics in Scenario 3, indicating that information system failure had a partial impact on the distributed new power plan islanding; nevertheless, the role of distributed power in improving the reliability of the distribution network should not be ignored.
5.2.4. Effect of SNR on System Reliability
In order to analyze the impact of different SNRs on system reliability indicators, the following five scenarios were set up for comparison. In these five scenarios, we set three transmit powers and frequencies.
Scenario 1: The wireless transmit power is 250 dB and the frequency f is 230 MHz.
Scenario 2: The wireless transmit power is 250 dB and the frequency f is 2.6 GHz.
Scenario 3: The wireless transmit power is 250 dB and the frequency f is 4.9 GHz.
Scenario 4: The wireless transmit power is 230 dB and the frequency f is 4.9 GHz.
Scenario 5: The wireless transmit power is 200 dB and the frequency f is 4.9 GHz.
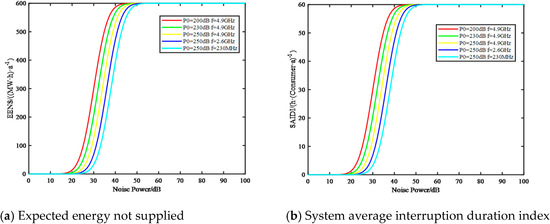
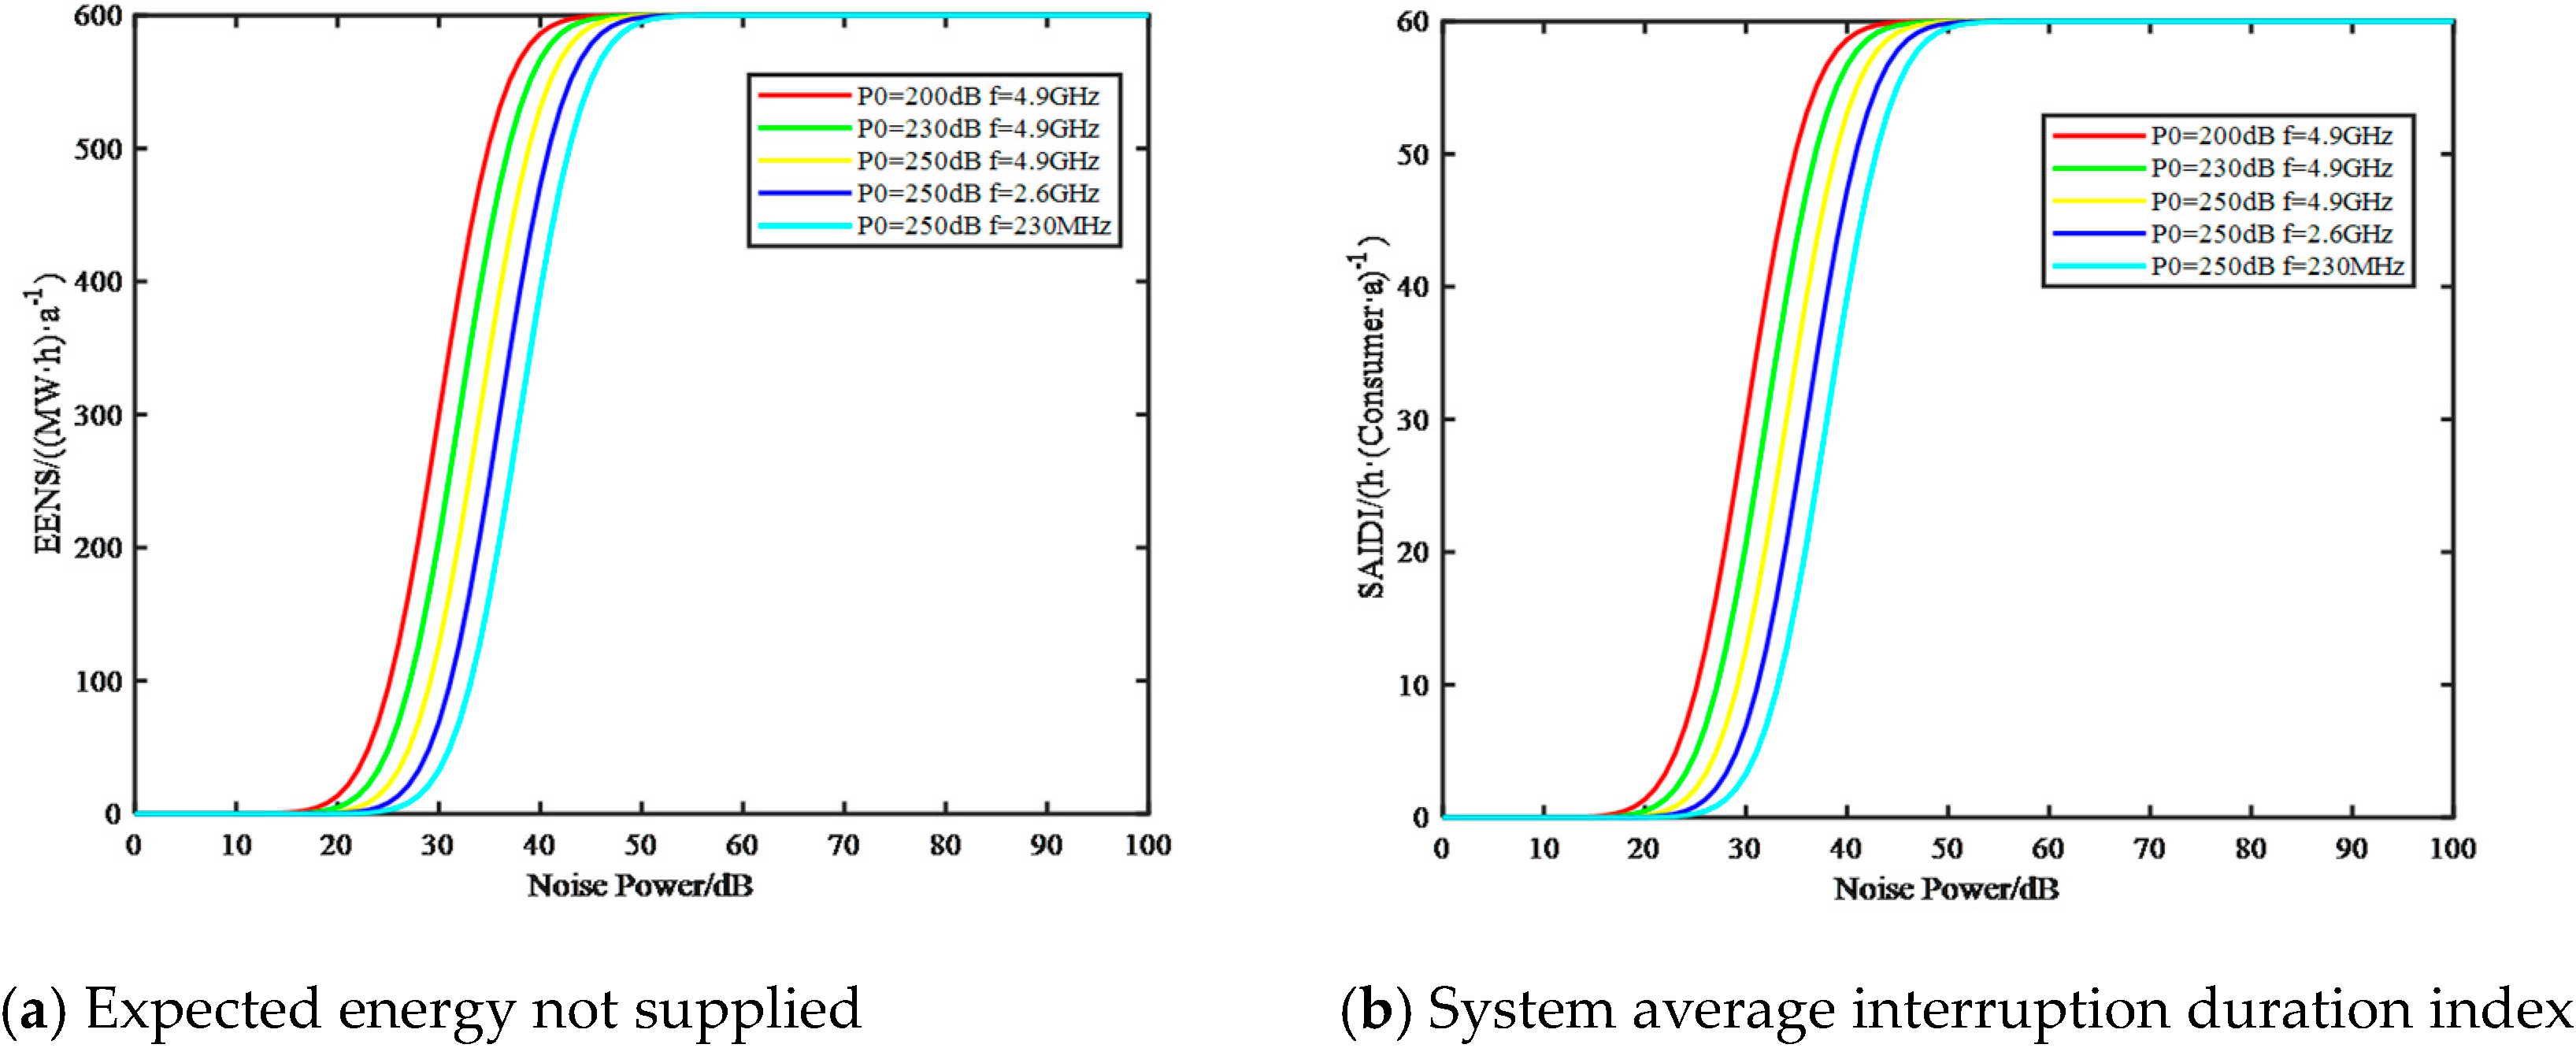
The variation of system reliability indexes under different noise powers is shown in Figure 6.
Figure 6.
Variation of system reliability index at different noise power levels.
As can be seen from Figure 6, for the above five scenarios, the higher the system transmitting power and the lower the operating frequency, the higher the noise power required to cause an increase in the average outage time of the system, and the lower the probability of the occurrence of BER (bit error rate) in data transmission. Taking scenario 5 as an example for detailed analysis, when the noise power received by the base station was less than 26 dB, the system reliability index remained almost unchanged with the increase in noise power. This was because at this stage, the system error rate did not exceed the threshold. The information link was effective and the controllable devices of the physical system were still reliably controlled by the information system. When the noise power was greater than 26 dB and less than 48 dB, the system reliability index increased accordingly. At this time, the error rate of information data during transmission exceeded the controllable range of the system. This resulted in information link failure and uncontrolled physical system equipment. When the noise power was greater than 48 dB, the system reliability index no longer changed. This was because when the physical system failed, the information link corresponding to the controllable action switch failed. The fault could only be repaired manually.
Comparing the five scenarios, it can be seen that scenario 1 required the highest noise power and the lowest probability of data transmission errors to increase the reliability index. A high system transmission power requires good equipment quality, and a low operating frequency can carry less information. Therefore, in practice, it is necessary to set the system transmission power and frequency reasonably while ensuring error-free data transmission, which is beneficial for cost savings.
In other words, the higher the system generating power, the higher the quality requirements of the equipment, and the lower the operating frequency, the lower the amount of information that can be carried. Therefore, under the condition of ensuring the accuracy of data transmission, the reasonable setting of system transmit power and operating frequency can improve the transmission efficiency and reduce the cost of equipment.
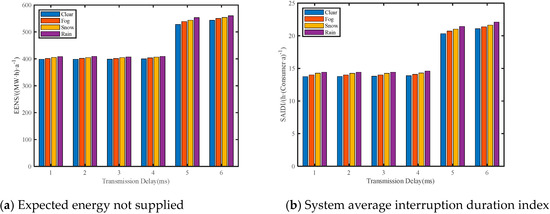
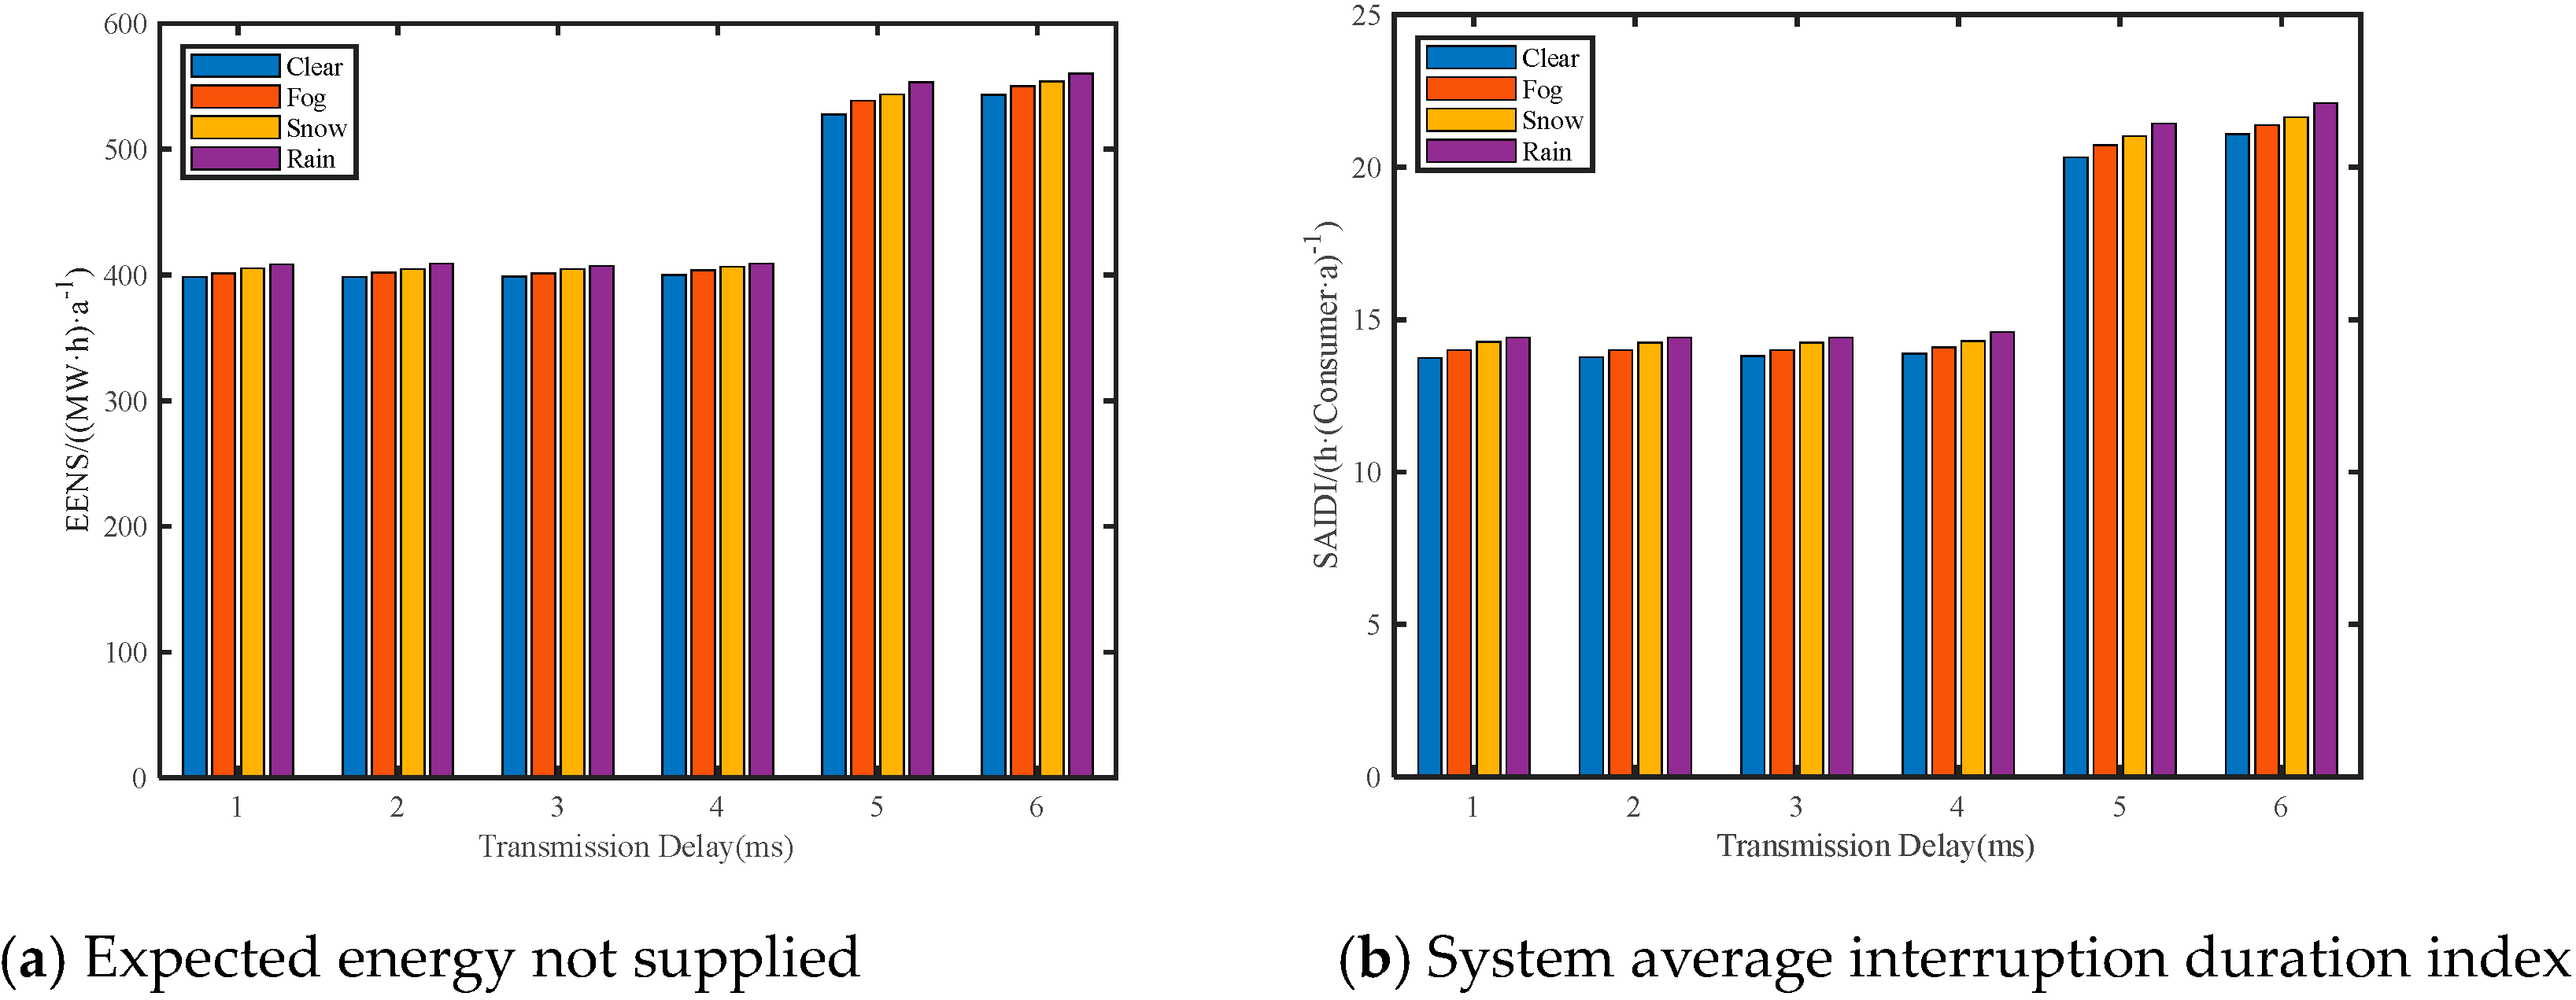
In order to study the effect of weather on system reliability in wireless mode, this study selected a wireless transmit power of 250 dB and frequency of 2.6 GHz and set four kinds of weather, namely, sunny, rainy, snowy, and foggy, for analysis. The changes in system reliability indexes under different weather conditions and different time delays are shown in Figure 7.
Figure 7.
System reliability under various weather conditions.
From Figure 7, it can be seen that the system reliability index was smaller under adverse weather conditions than on sunny days. This was because wireless signals are more prone to scattering, diffraction, and absorption during propagation in adverse weather conditions, thereby reducing signal strength. This reduces the power of the signal-receiving end, thereby lowering the SNR. This increases the symbol error rate (SER) of the system, affecting the quality of wireless communication and the reliability of the system. Therefore, an important difference between wired communication and wireless communication is that the quality of wireless communication is easily affected by weather factors, especially in adverse weather conditions. When choosing the access network communication method for the distribution network, the actual weather type of the geographical area should be considered. During extreme weather events, information systems can ensure the reliability of communication systems by appropriately increasing wireless signal transmission power and reducing frequency.
6. Conclusions
Considering the reliability of wireless information transmission in distributed network physical systems, this article proposed a reliability evaluation method for distributed cyber systems based on wireless access networks. It provided a new idea for quantifying information transmission performance reasonably and quickly. Based on the established switching model, this paper proposed a reliability calculation method combining the upward equivalence and the minimum path method, which greatly improved the calculation efficiency. Finally, a test system was established to verify the impact of information transmission performance on distribution network reliability, which verified the correctness and efficiency of the proposed method, and the main conclusions are as follows:
(1) Among the information system components, the variation in the failure rate of IEDs has the greatest impact on CPDS reliability.
(2) Information system failures cause a small decrease in the reliability of active distribution networks, and the allocation of distributed new energy generation devices with reasonable capacity to CPDSs is conducive to improving the reliability of system power supplies.
(3) As the average load rate of the wireless access network increases, the number of withdraws of the channel detection increases, which will directly lead to the increase in information transmission delay, the probability of information link failure becomes larger, and the reliability of the CPDS decreases.
(4) One notable limitation is the potential compatibility issue between 5G technology and existing wired communication infrastructures in traditional power distribution networks. Additionally, the high investment and construction challenges in certain physical environments may pose barriers. However, these limitations can be bypassed through strategic planning and incremental upgrades to the existing network, alongside cost–benefit analyses and collaborative efforts with stakeholders to facilitate a smoother transition to 5G-enabled power distribution systems.
For subsequent research, we are preparing to introduce machine learning algorithms into the reliability assessment of power distribution physical systems to extend machine learning integration for predictive maintenance in a cyber–physical system.
Author Contributions
Methodology, C.L. and X.D. Software, S.Z. and X.W. Formal analysis, C.L. Writing—original draft, C.L., S.Z. and X.D. All authors have read and agreed to the published version of the manuscript.
Funding
This work was supported in part by the Postdoctoral Fellowship Program of CPSF under Grant Number GZC20241269.
Data Availability Statement
The original contributions presented in the study are included in the article, further inquiries can be directed to the corresponding authors.
Conflicts of Interest
The authors declare no conflicts of interest.
References
- Wang, X.; Kang, Q.; Guo, L.; Zhang, F.; Liang, Z.; Gao, J.; Wang, X.; Liu, W. Economic evaluation for 5G planning of a distribution network considering network coupling and important node identification. Prot. Control Mod. Power Syst. 2024, 9, 126–141. [Google Scholar] [CrossRef]
- Chen, B.; Lu, Z.; Li, B. Reliability assessment of distribution network considering multiple types of information disturbances. Autom. Electr. Power Syst. 2019, 43, 103–110. [Google Scholar]
- Chen, B.; Lu, Z.; Li, B. Reliability assessment of distribution network considering connectivity and accuracy of information system in fault treatment process. Power Syst. Technol. 2020, 44, 742–750. [Google Scholar]
- Zhou, B.; Cai, Y.; Zang, T.; Wu, J.; Sun, B.; Chen, S. Reliability assessment of cyber–physical Distribution Systems Considering Cyber Disturbances. Appl. Sci. 2023, 13, 3452. [Google Scholar] [CrossRef]
- Lin, D.; Liu, Q.; Zeng, G.; Wang, Z.; Yu, T. Refined modeling and evaluation of reliability for cyber-physical system of distribution network. Autom. Electr. Power Syst. 2021, 45, 92–101. [Google Scholar]
- He, R.; Liang, H.; Wu, J.; Xie, H.; Shahidehpour, M. Reliability assessment of cyber-physical distribution system using multi-dimensional information network model. IEEE Trans. Smart Grid 2023, 14, 4683–4692. [Google Scholar] [CrossRef]
- Zuo, J.; Zhou, S.; Xu, Z.; Gao, C.; Zheng, S.; Chen, P. Reliability Evaluation Method of Multi-Voltage Levels Distribution System Considering the Influence of Sense-Control Terminal Faults. Appl. Sci. 2023, 13, 11761. [Google Scholar] [CrossRef]
- Zeng, G.; Yu, T.; Wang, Z.; Lin, D. Analytical reliability assessment of cyber-physical distribution system with distributed feeder automation. Electr. Power Syst. Res. 2022, 208, 107864. [Google Scholar] [CrossRef]
- Liu, Y.; Deng, L.; Gao, N.; Sun, X. A reliability assessment method of cyber physical distribution system. Energy Procedia 2019, 158, 2915–2921. [Google Scholar] [CrossRef]
- Aslani, M.; Hashemi-Dezaki, H.; Ketabi, A. Analytical reliability evaluation method of smart micro-grids considering the cyber failures and information transmission system faults. IET Renew. Power Gener. 2022, 16, 2816–2839. [Google Scholar] [CrossRef]
- Sun, X.; Liu, Y.; Deng, L. Reliability assessment of cyber-physical distribution network based on the fault tree. Renew. Energy 2020, 155, 1411–1424. [Google Scholar] [CrossRef]
- Lin, D.; Liu, Q.; Li, Z.; Zeng, G.; Wang, Z.; Yu, T.; Zhang, J. Elaborate reliability evaluation of cyber physical distribution systems considering fault location, isolation and supply restoration process. IEEE Access 2020, 8, 128574–128590. [Google Scholar] [CrossRef]
- He, R.; Long, L.; Zhang, B.; Wang, Y.; Xiao, Z. Cyber system physicalizing modeling and analysis method in cyber-physical power systems. Proc. CSEE 2024, 44, 72–85. [Google Scholar]
- Chen, Y.; Li, J.; Xu, A. Reliability evaluation method for smart substation based on cyber-physical fusion. Autom. Electr. Power Syst. 2021, 45, 102–110. [Google Scholar]
- Zheng, H.; Lv, T.; Sun, Y.; Li, Y.; Yu, K. Reliability analysis of integrated energy cyber physical system considering information equipment failure. High Volt. Eng. 2022, 48, 3078–3087. [Google Scholar]
- Liu, Y.; Feng, H.; Nikos, D. Multi-stage collaborative resilient enhancement strategy for coupling faults in distribution cyber physical systems. Appl. Energy 2023, 348, 121560. [Google Scholar] [CrossRef]
- He, R.; Xie, H.; Deng, J.; Feng, T.; Lai, L.L.; Shahidehpour, M. Reliability modeling and assessment of cyber space in cyber-physical power systems. IEEE Trans. Smart Grid 2020, 11, 3763–3773. [Google Scholar] [CrossRef]
- Rafy, M.F.; Srivastava, A.K.; Neto, F.; Biasi, J. Communication Technologies for DER-centric Power Distribution Systems: A Comparative Analysis and Cyber-Resilience Guidelines. IEEE Access 2004, 12, 80549–80558. [Google Scholar] [CrossRef]
- Li, Y.; Wang, B.; Wang, H.; Ma, F.; Zhang, J.; Ma, H.; Zhang, Y.; Mohamed, M.A. Importance Assessment of Communication Equipment in Cyber-Physical Coupled Distribution Networks Based on Dynamic Node Failure Mechanism. Front. Energy Res. 2022, 10, 911985. [Google Scholar] [CrossRef]
- Barani, M.; Vadlamudi, V.V.; Farzin, H. Impact of cyber failures on operation and adequacy of Multi-Microgrid distribution systems. Appl. Energy 2023, 348, 121437. [Google Scholar] [CrossRef]
- He, B.; Zhang, A.; Hao, W.; Liu, P.; Ning, B. Multiple beam selection and near-optimal digital precoding for multiuser millimeter-wave massive MIMO systems. IEEE Trans. Circuits Syst. II Express Briefs 2022, 70, 811–815. [Google Scholar] [CrossRef]
- Allan, R.N.; Billinton, R.; Sharief, I.; Goel, L.; So, K. A reliability test system for educational purposes-basic distribution system data and results. IEEE Trans. Power Deliv. 1991, 6, 813–820. [Google Scholar] [CrossRef]
- Zheng, A.; Huang, Q.; Cai, D.; Li, J.; Jing, S.; Hu, W.; Wu, J. Quantitative assessment of stochastic property of network-induced time delay in smart substation cyber communications. IEEE Trans. Smart Grid 2019, 11, 2407–2416. [Google Scholar] [CrossRef]
- Zhu, X.; Zhou, M. Multi objective optimized deployment of edge-enabled wireless visual sensor networks for target coverage. IEEE Internet Things J. 2023, 10, 15325–15337. [Google Scholar] [CrossRef]
- Basnayaka, D.A. Introduction to mediumband wireless communication. IEEE Open J. Commun. Soc. 2023, 4, 1247–1262. [Google Scholar] [CrossRef]
- Li, L.; Chen, W.; Letaief, K.B. Simple bounds on delay-constrained capacity and delay-violation probability of joint queue and channel-aware wireless transmissions. IEEE Trans. Wirel. Commun. 2022, 22, 2744–2759. [Google Scholar] [CrossRef]
- Kong, G.; Kim, T.; Jung, M. Iterative Multihead Multitrack Detection Scheme for Bit-Patterned Media Recording. IEEE Magn. Lett. 2022, 13, 6505405. [Google Scholar] [CrossRef]


Disclaimer/Publisher’s Note: The statements, opinions and data contained in all publications are solely those of the individual author(s) and contributor(s) and not of MDPI and/or the editor(s). MDPI and/or the editor(s) disclaim responsibility for any injury to people or property resulting from any ideas, methods, instructions or products referred to in the content. |
© 2024 by the authors. Licensee MDPI, Basel, Switzerland. This article is an open access article distributed under the terms and conditions of the Creative Commons Attribution (CC BY) license (https://creativecommons.org/licenses/by/4.0/).