Article

Artificial Intelligence-Enhanced Colorimetric Assessment of Self-Cleaning Road Marking Paints

by
Orlando Lima, Jr.
1,2,*,
Iran Rocha Segundo
2,
Laura Mazzoni
3,
Manuel F. M. Costa
4,
Elisabete Freitas
1 and
Joaquim Carneiro
2,*
1
ISISE, ARISE, Department of Civil Engineering, University of Minho, 4800-058 Guimarães, Portugal
2
Centre of Physics of Minho and Porto Universities (CF-UM-UP), Azurém Campus, University of Minho, 4800-058 Guimarães, Portugal
3
Department of Transportation Engineering, University of São Paulo, São Paulo 13566-590, Brazil
4
Centre of Physics of Minho and Porto Universities (CF-UM-UP), Gualtar Campus, University of Minho, 4710-057 Braga, Portugal
*
Authors to whom correspondence should be addressed.
Appl. Sci. 2024, 14(21), 9718; https://doi.org/10.3390/app14219718
Submission received: 31 July 2024 / Revised: 8 October 2024 / Accepted: 17 October 2024 / Published: 24 October 2024
(This article belongs to the Section Optics and Lasers)

Abstract

:
Road markings (RMs) typically consist of a paint layer and a retroreflective layer. They play a crucial role in road safety by offering visibility and guidance to drivers. Over their lifetime, dirt particles, oils, and greases are adsorbed on the RM surface, reducing their visibility and service life. A self-cleaning ability has been widely studied in several substrates. However, for RMs, this represents a breakthrough and a sustainable advance, while having the potential to increase their service life and enhance road safety. In this context, nanotechnology can be a strong ally through the application of semiconductor materials, such as TiO2, to develop the self-cleaning ability. In addition to this novelty in RMs, quantifying this ability in terms of pollutant removal efficiency is also a challenge. In this sense, artificial intelligence (AI) and colorimetry can be combined to achieve improved results. The aims of the work herein reported were to assess the self-cleaning capability in an RM paint through the mass incorporation of semiconductors, evaluate their photocatalytic efficiency using traditional (spectrophotometric) and modern (AI-enhanced) colorimetry techniques, and compare the results obtained using both techniques. To this end, a water-based acrylic RM paint was modified through the mass incorporation of 0.5%, 1%, 2%, and 3% of nano-TiO2, and a pollutant model widely used, Rhodamine B, was applied onto their surface. The samples were irradiated with a light source that simulates sunlight for 0, 3, 6, 12, 24, and 48 h. Visual analysis and spectrophotometric and artificial intelligence-enhanced colorimetry techniques were used and compared to evaluate the pollutant removal. The results confirm that RM paints with 2% and 3% nano-TiO2 incorporated have a significantly higher pollutant removal ability and that both colorimetric techniques used are suitable for this assessment.

1. Introduction

Road markings (RMs) play a critical role in ensuring road safety by providing guidance to drivers and enhancing visibility. Typically, RMs consist of two layers that work together as a system (Figure 1). The base layer, also referred to as the paint layer, adheres to the road surface and enhances daytime visibility through contrasting colors. It acts as the support for the second layer, which includes retroreflective material in the form of glass beads. These glass beads improve nighttime visibility and safeguard the underlying layer from deterioration [1,2].
The optical properties of RMs, luminance and retroreflectance, are related to daytime and nighttime visibility, respectively, and are key aspects in evaluating their remaining durability. Consequently, initial research into this subject was concentrated on enhancing these optical properties, specifically retroreflectance [3,4,5]. However, the practical use of RM materials faces significant challenges related to durability, maintenance costs, and environmental impact. The typical service life of RMs is approximately two years after application [6], although certain types can last between two and four years depending on the materials used [4,7,8]. Various factors affect the performance and durability of RMs, such as the traffic load and type, winter maintenance, environmental conditions, surface dirt accumulation, road surface quality, line location, and lane width [9].
The maintenance of RMs incurs high costs and has environmental impacts. The wear and degradation of these materials, whether due to natural use or removal for renewals, contribute to microplastic pollution, with RMs estimated to account for about 5% to 10% of the total microplastic pollution in the environment [10,11]. Therefore, extending the life service of RMs by improving their durability could not only reduce maintenance costs by minimizing the frequency of reapplication but also significantly decrease their environmental impact. In this regard, recent research has prompted the exploration of smart materials, such as semiconductor nanoparticles, thermocapsules, photoluminescent materials, and other cutting-edge technologies, in various fields of road engineering to achieve new abilities [12,13], which are designed to improve the visibility of RMs and extend their service life.
Semiconductor materials, such as TiO2, when exposed to UV light and humidity, produce superoxide ions that interact with contaminants such as dirt, organic compounds (e.g., oils, greases), and inorganic substances. This interaction leads to the photooxidation of these contaminants and contributes to a self-cleaning effect through photocatalytic properties [12,14,15,16,17]. This capability has been extensively studied for a range of substrates, including asphalt pavements, mortars, glasses, and architectural paints [14,15,16,18].
Rocha Segundo et al. [15] evaluated the self-cleaning characteristics of photocatalytic asphalt mixtures functionalized with nano-TiO2 and micro-ZnO and confirmed their capability to photodegrade Rhodamine B up to 92%. Reza Omranian et al. [16] also functionalized asphalt mixtures with nano-TiO2 and assessed their self-cleaning property by monitoring soot degradation via digital image processing. The results revealed that the soot coverage of the functionalized asphalt pavement decreased from 65.3% to 7.2%. Van Hal et al. [19] evaluated the self-cleaning properties of glass slides coated with TiO2 and ZnO. The assessment was performed by monitoring soot degradation via digital image processing, and the results revealed degradation rates of over 90%.
Considering self-cleaning properties in paints and coatings for architectural applications, Silva et al. [20] evaluated the effectiveness of protective coatings for external thermal insulation containing TiO2 and ZnO in degrading Methylene Blue, Rhodamine B, and a commercial dye. The assessment was conducted using colorimetry (CIELAB color space). The results demonstrated discoloration rates of up to 97% after exposure to solar light. Pal et al. [21] studied resin paints and silicate paints functionalized with TiO2. The results indicated that the degradation rates of Methylene Blue and Rhodamine B, analyzed via diffuse reflectance, led to the nearly complete discoloration of the dyes after just 30 min of UV light exposure. Despite the studies on self-cleaning properties in other substrates and certain types of paints, there is a notable absence of research pinpointing this capability in RM paints [20,21,22,23].
In imparting self-cleaning properties, it is important that we can quantify self-cleaning. In this context, techniques like UV-Vis spectrometry, colorimetry, digital image processing, and visual analysis are valuable for assessing the efficiency of self-cleaning in different substrates, since surface changes translate to color changes. These methodologies offer precise and reliable means to evaluate the effectiveness of self-cleaning technologies and pave the way for advancements in surface engineering and material science [16,19,20,21,24,25,26,27,28]. However, regarding these techniques, visual analysis is not accurate if not performed in a controlled environment, and both UV-Vis spectrometry and colorimetry require relatively high costs and complex operations, necessitating specific and expensive equipment.
Integrating artificial intelligence (AI) into advanced analytical techniques can offer a promising approach to assessing the self-cleaning efficiency by enhancing the accuracy, speed, and depth of analysis while also reducing the costs for the test. Several studies from different scientific areas have utilized AI to improve colorimetric analysis; for example, Zanuncio et al. [29] combined AI and colorimetry to predict properties of heat-treated wood through artificial neural networks (ANNs). Together, colorimetry and AI were able to predict the physical and mechanical properties of wood. Feng et al. [30] integrated AI into colorimetry for enhanced sensitivity, accuracy, resolution, and anti-illuminating capability in urine glucose detection. The results revealed a high (87.6%) correlation with the standard blood glucose test method.
Lin et al. [31] utilized machine vision and AI algorithms for color recognition in food to assess cooking status identification. The results revealed that the judgment time of each image can be performed in less than 0.2 s, and the false judgment rate can be reduced to less than 3%. Hoque et al. [32] developed an intelligent image-based system utilizing AI through histogram-based image processing and machine learning algorithm for conducting automatic colorimetric tests in real time as a proof of concept for a dry-chemical-based or microfluidic, stable, and semi-quantitative assay. The results revealed an accuracy > 98% for the image processing algorithm.
From the literature, AI has already been widely used in combination with colorimetry for diverse purposes. However, this study represents a breakthrough in the integration of AI with colorimetry to evaluate the self-cleaning capabilities of smart RMs. The results obtained from AI-enhanced colorimetry will be compared with those from traditional (spectrophotometric) methods to confirm the effectiveness of integrating AI for self-cleaning measurements. The innovation of this work reveals the gains of the incorporation of semiconductors in an RM paint in terms of self-cleaning, and also provides an enhanced evaluation of this capability, opening new perspectives for the application of AI-enhanced techniques in road engineering.

2. Methodology

2.1. Materials

A white water-based acrylic RM paint from Candela (Aveiro, Portugal) was used as the first layer to be functionalized. TiO2 nanoparticles (Aeroxide TiO2 P25) from Quimidroga (Barcelona, Spain) were used to provide self-cleaning properties to the RM paint. Also, Rhodamine B from Merck (St. Louis, MO, USA) was selected since this is a pollutant model widely used in different areas.

2.2. Methods

2.2.1. RM Paint Functionalization and Evaluation of the Self-Cleaning Ability

Four rates of nano-TiO2, 0.5%, 1%, 2%, and 3% (wt%), were incorporated into the RM paint in the functionalization process. The incorporation was carried out using a low-shear mixer (15 min, 1000 RPM) [33] at room temperature. Glass slides (2.5 × 7.5 cm2) were coated with the reference paint (0%) and the functionalized ones. The paint application ratio was 750 g/m2, in accordance with standard EN 1436:2009 [34]. Two specimens were prepared for each RM paint condition (test results to be averaged).
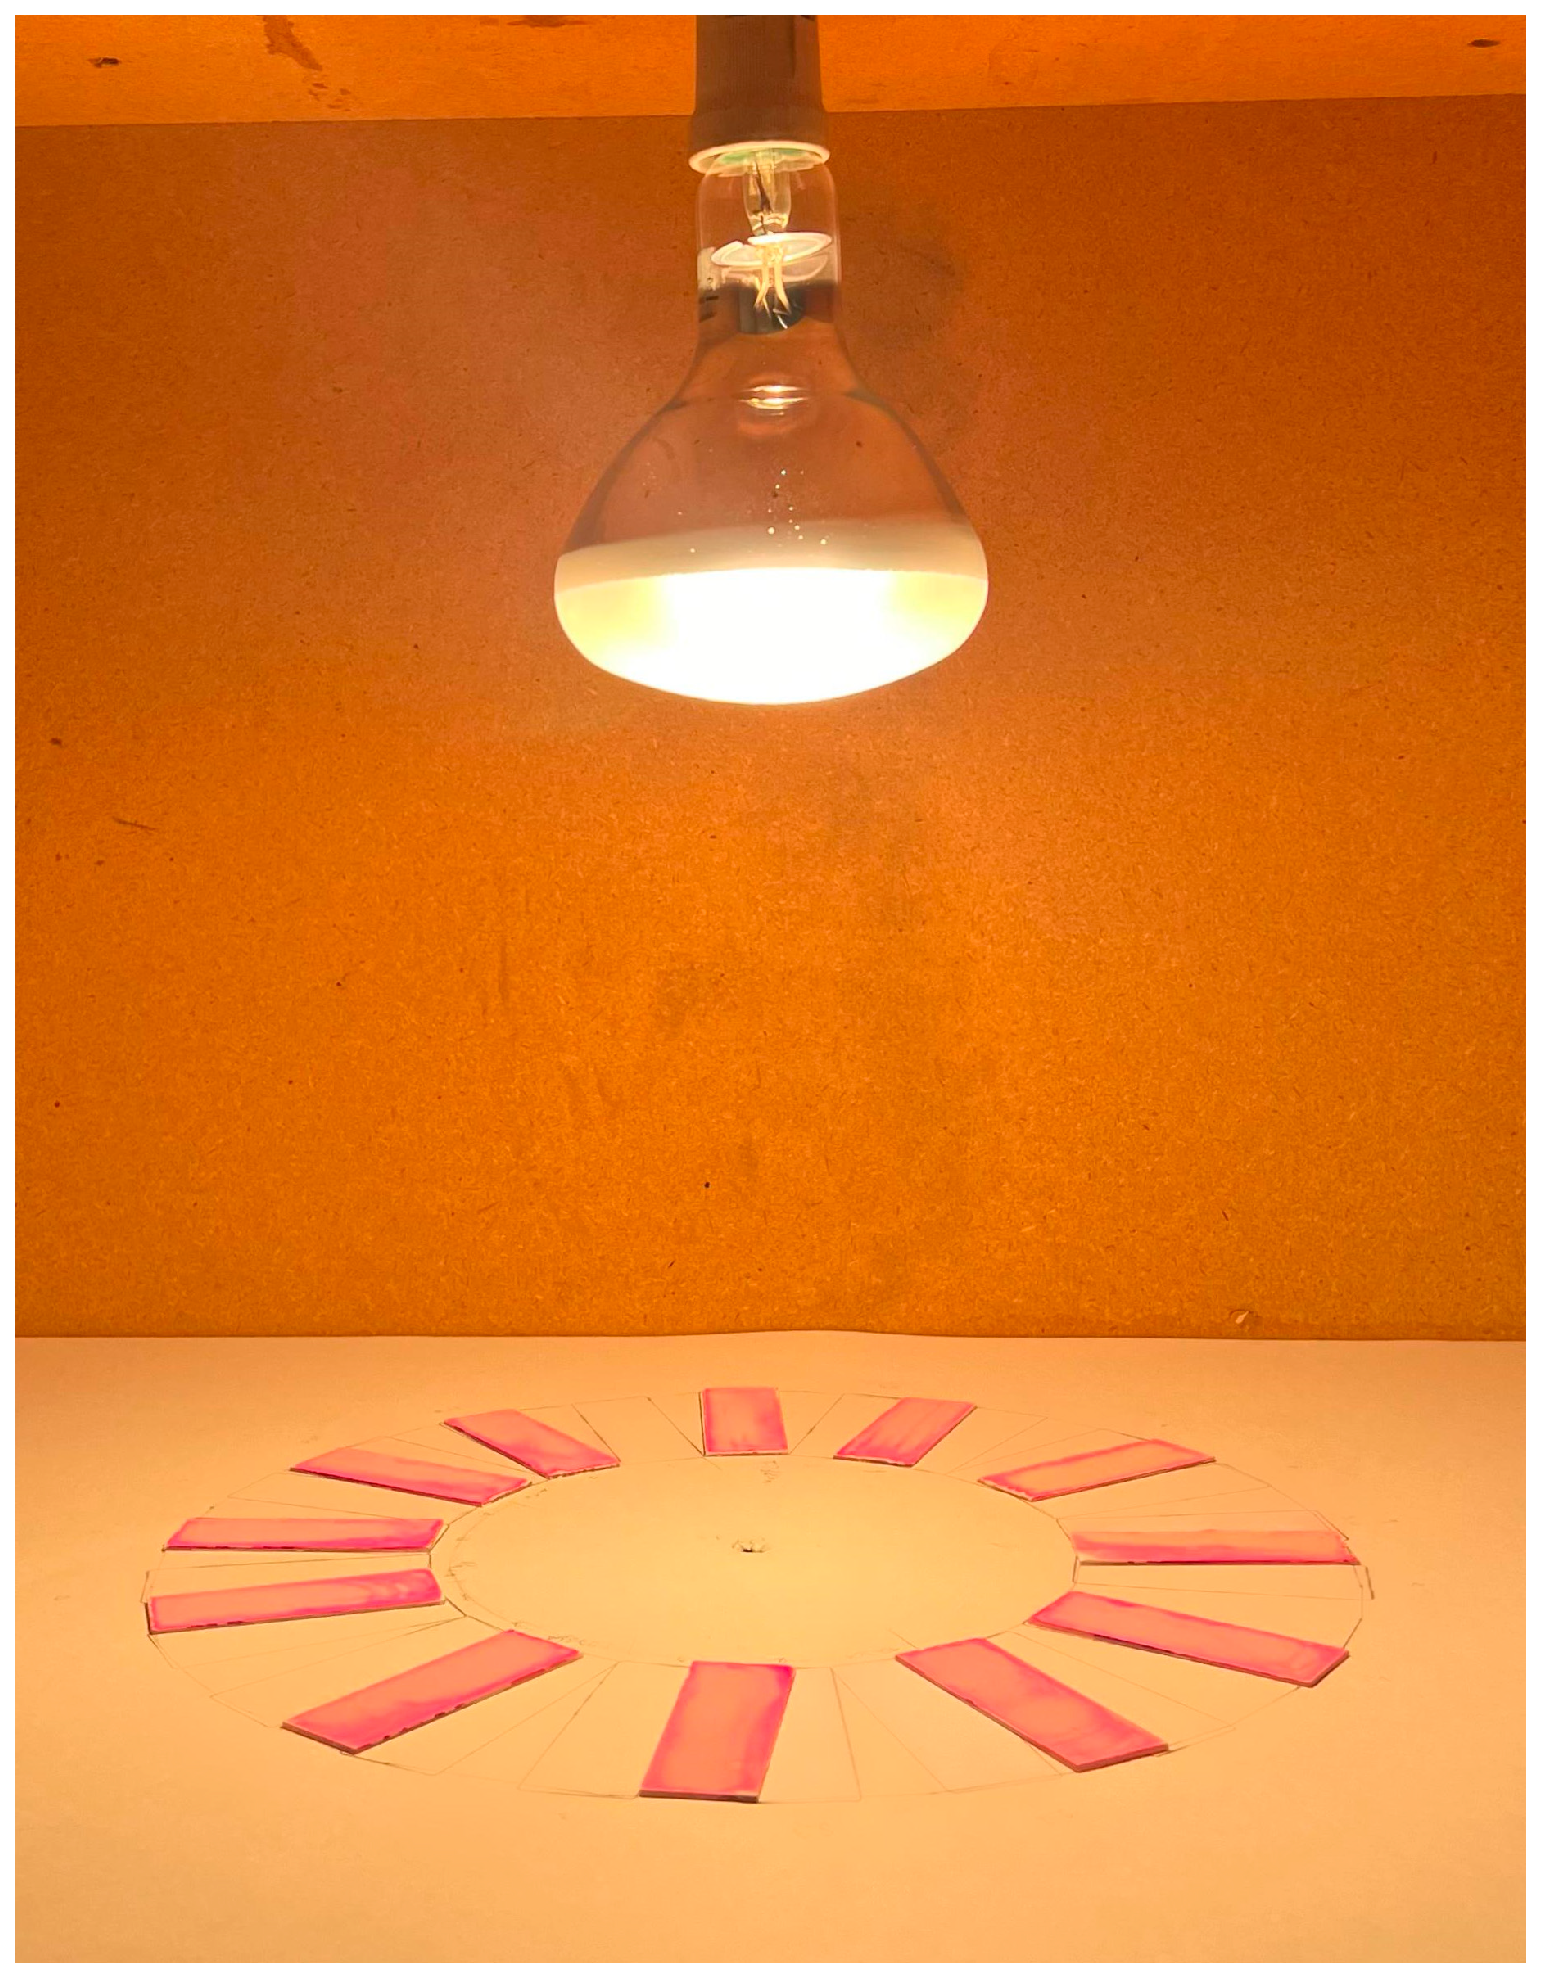
Each sample was polluted with 500 µL of Rhodamine B solution (100 ppm) and then allowed to dry for at least 24 h at room temperature. Then, the specimens were irradiated at intervals of 0, 3, 6, 12, 24, and 48 h with a lamp that simulates sunlight (Osram Ultra Vitalux 300 W) (OSRAM, Munich, Germany) with a light intensity of 11 W/m2 measured with a Quantum Photo Radiometer HD9021. The lamp was placed at a distance of 25 cm from the samples (Figure 2).
The self-cleaning property was evaluated by monitoring the pollutant degradation on the sample surfaces through visual analysis and by calculating the color variation and photocatalytic efficiency using colorimetry, according to [20,35]. The latter technique was performed with spectrophotometric and AI-enhanced CIELAB color space measurements.

2.2.2. Visual Analysis

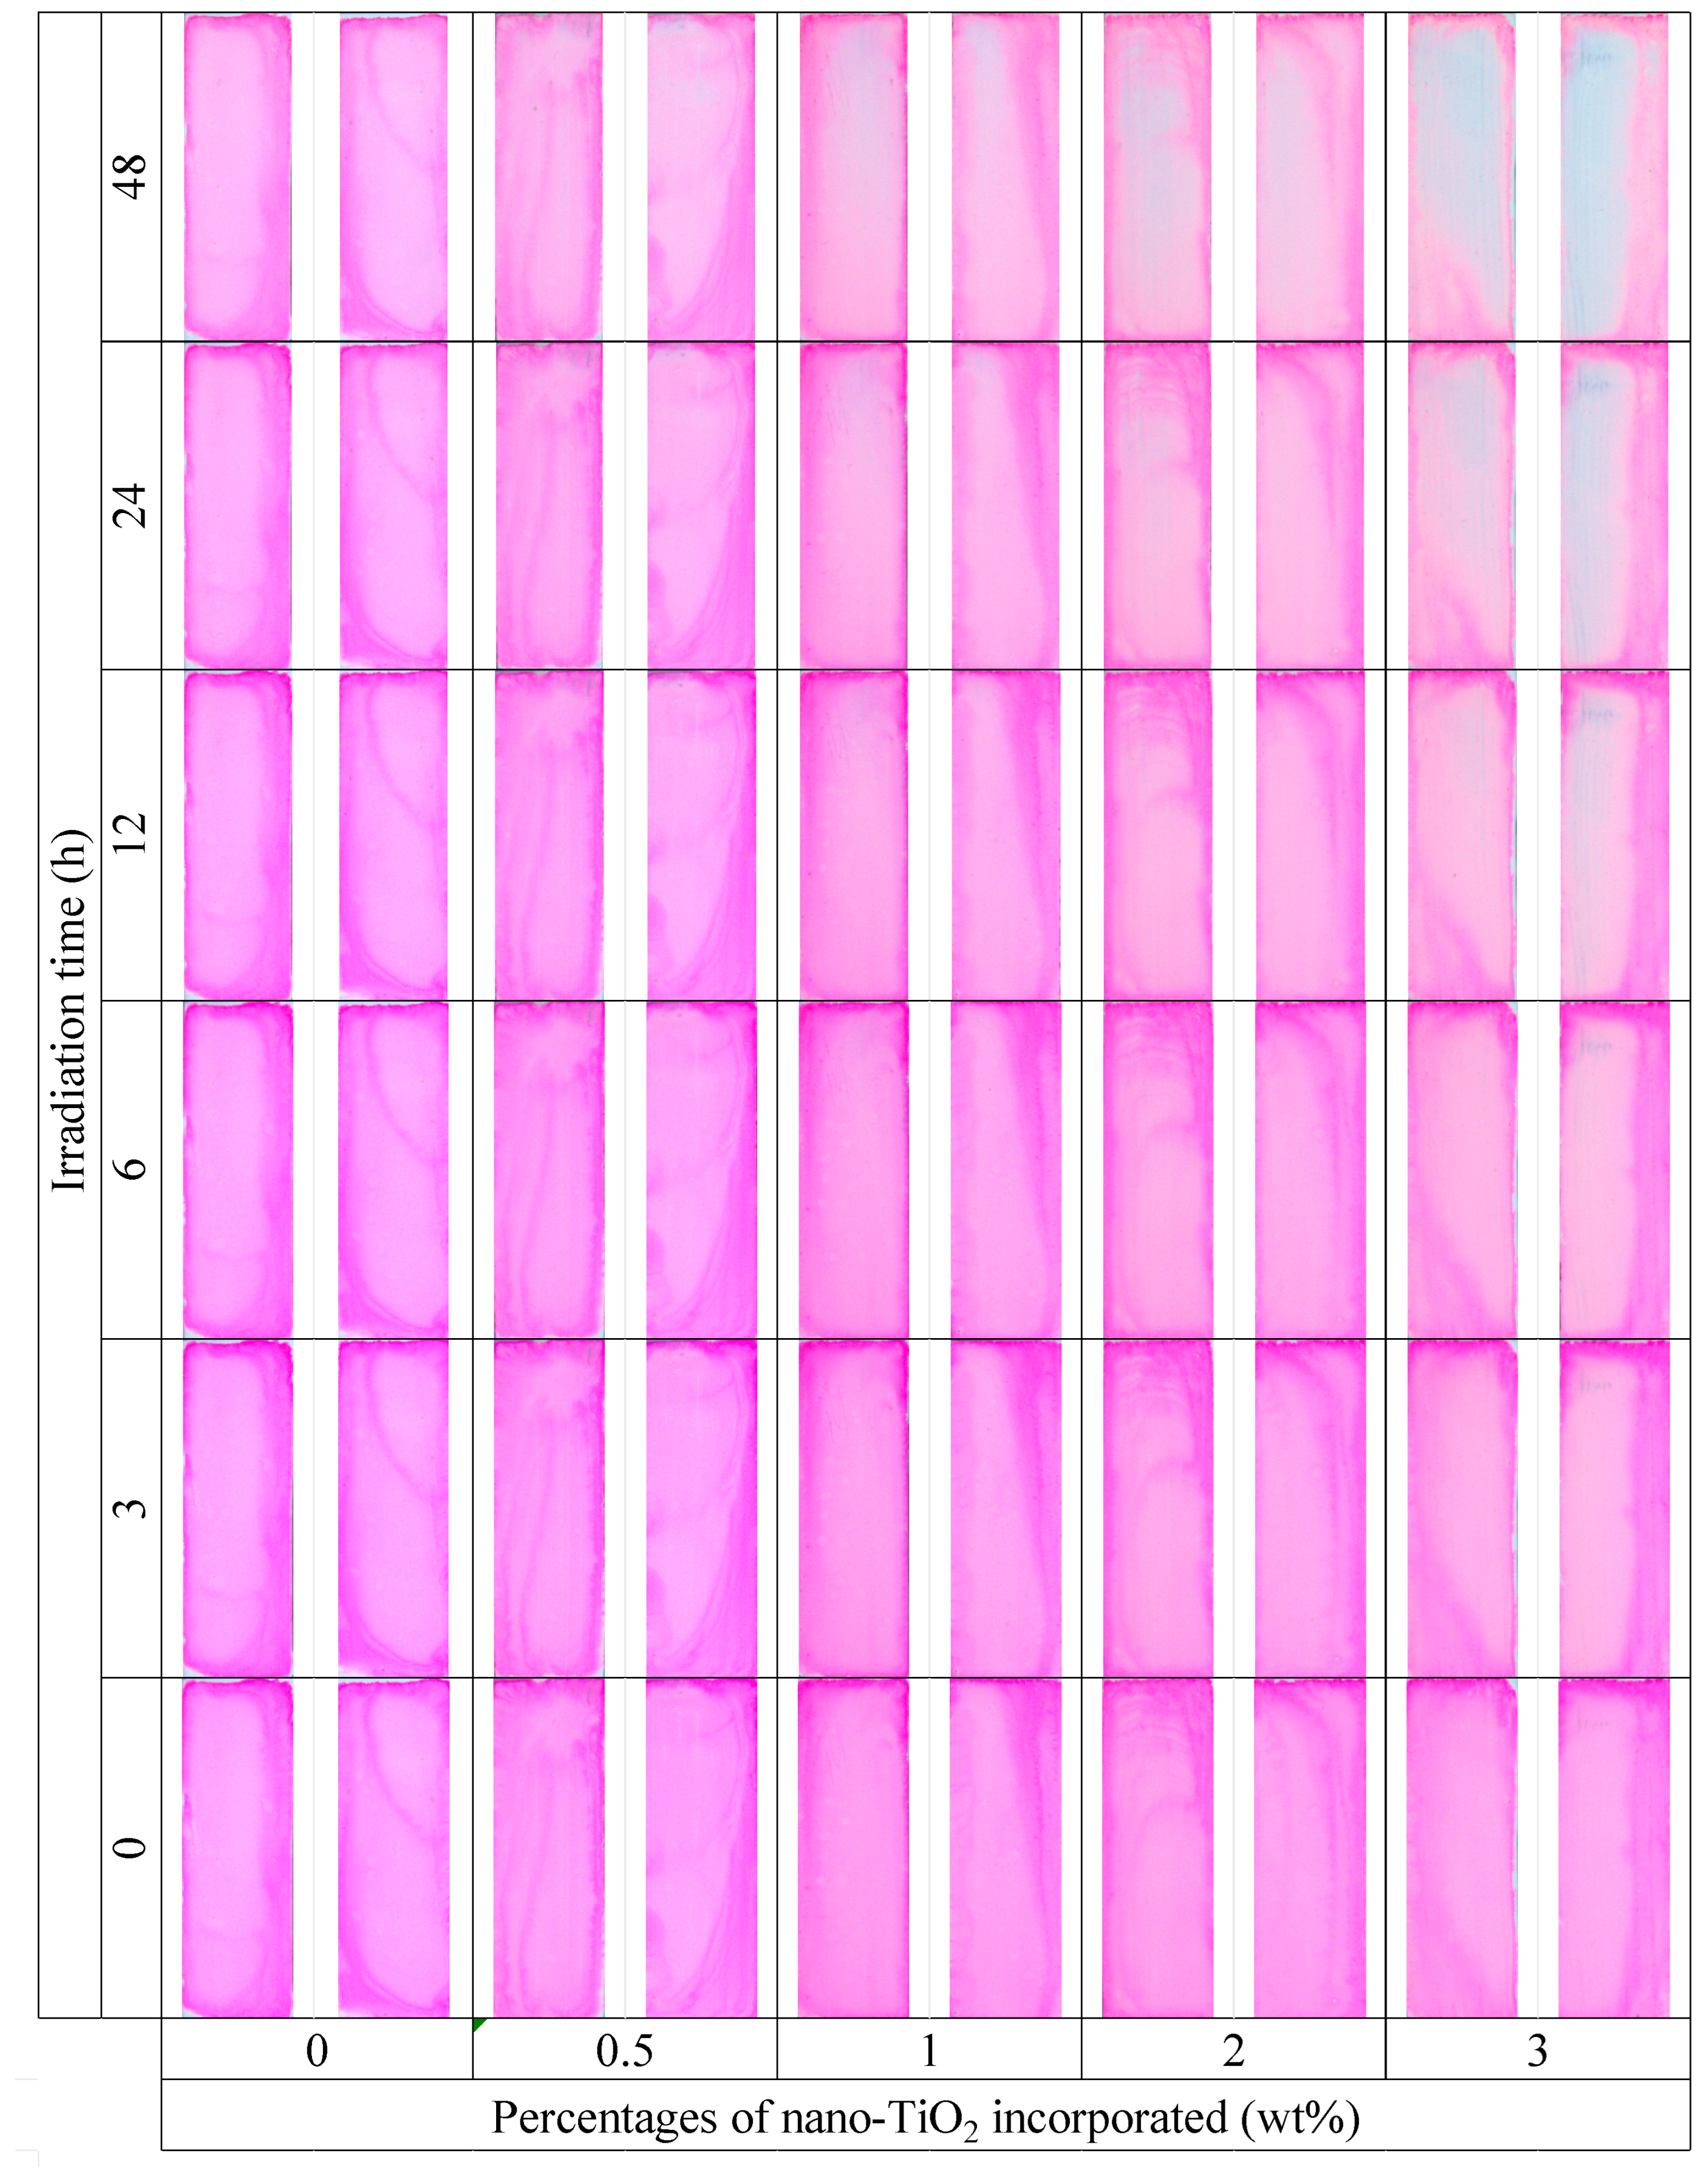
Images of the samples were captured after each light irradiation interval. The pictures were taken in a photobox that excludes external light and ensures that the internal lighting conditions and the camera–sample distance (20 cm) are always constant [16,19,24]. All the images were captured with a Canon PowerShot SX50 HS camera model in manual mode (exposure time 1/100 s; F-stop: f/8; and ISO 80) in raw image file format (.CR2). All the sample images were cropped to the same size (276,000 pixels) and grouped according to the RM paint functionalization condition and the irradiation periods. Therefore, it was possible to visually identify the specimens with the best self-cleaning performance.

2.2.3. Spectrophotometric CIELAB Color Space

The CIELAB color space is a widely used model designed to provide a perceptually uniform system for color measurement that closely aligns with human perception. It was developed by the International Commission on Illumination (CIE) in 1976 and consists of three coordinates—L*, a* and b*—and provides a consistent system to measure colors. Coordinate L* represents the lightness from black (0) to white (100), a* indicates the variation from green (−100) to red (+100) to, and b* is the variation from blue (−100) to yellow (+100) [20,36,37]. This makes it ideal for various applications, such as color comparison, quality control, and digital imaging.
A portable spectrophotometer model PCE-CSM 20 was used to determine the CIELAB color coordinates of the samples. The equipment was set up to a D65 illuminant, with a measuring aperture of Ø 8 mm, and in specular component inclusion (SCI) mode.

2.2.4. Artificial Intelligence-Enhanced CIELAB Color Space

The images obtained from the visual analysis technique were digitally processed CIELAB color space measurements enhanced with ChatGPT 4.0 AI. The AI was commanded to read all the pixels in each of the images (samples) within the same range of color coordinates as the spectrophotometer: L* from black (0) to white (100), a* from green (−100) to red (+100), and b* from blue (−100) to yellow (+100). For each image, the L*, a*, and b* color coordinates were calculated as the average values of these coordinates across all pixels in the sample image, as shown in Equations (1)–(3):
L * = 1 N i = 1 N L * i
a * = 1 N i = 1 N a * i
b * = 1 N i = 1 N b * i
where N is the total number of pixels in the image, and L * i , a * i , and b * i are the color coordinates of the i-th pixel in each image. Once each image was digitally processed by the AI, the AI was commanded to generate a table displaying the L*, a*, and b* values for each of the processed images (samples).
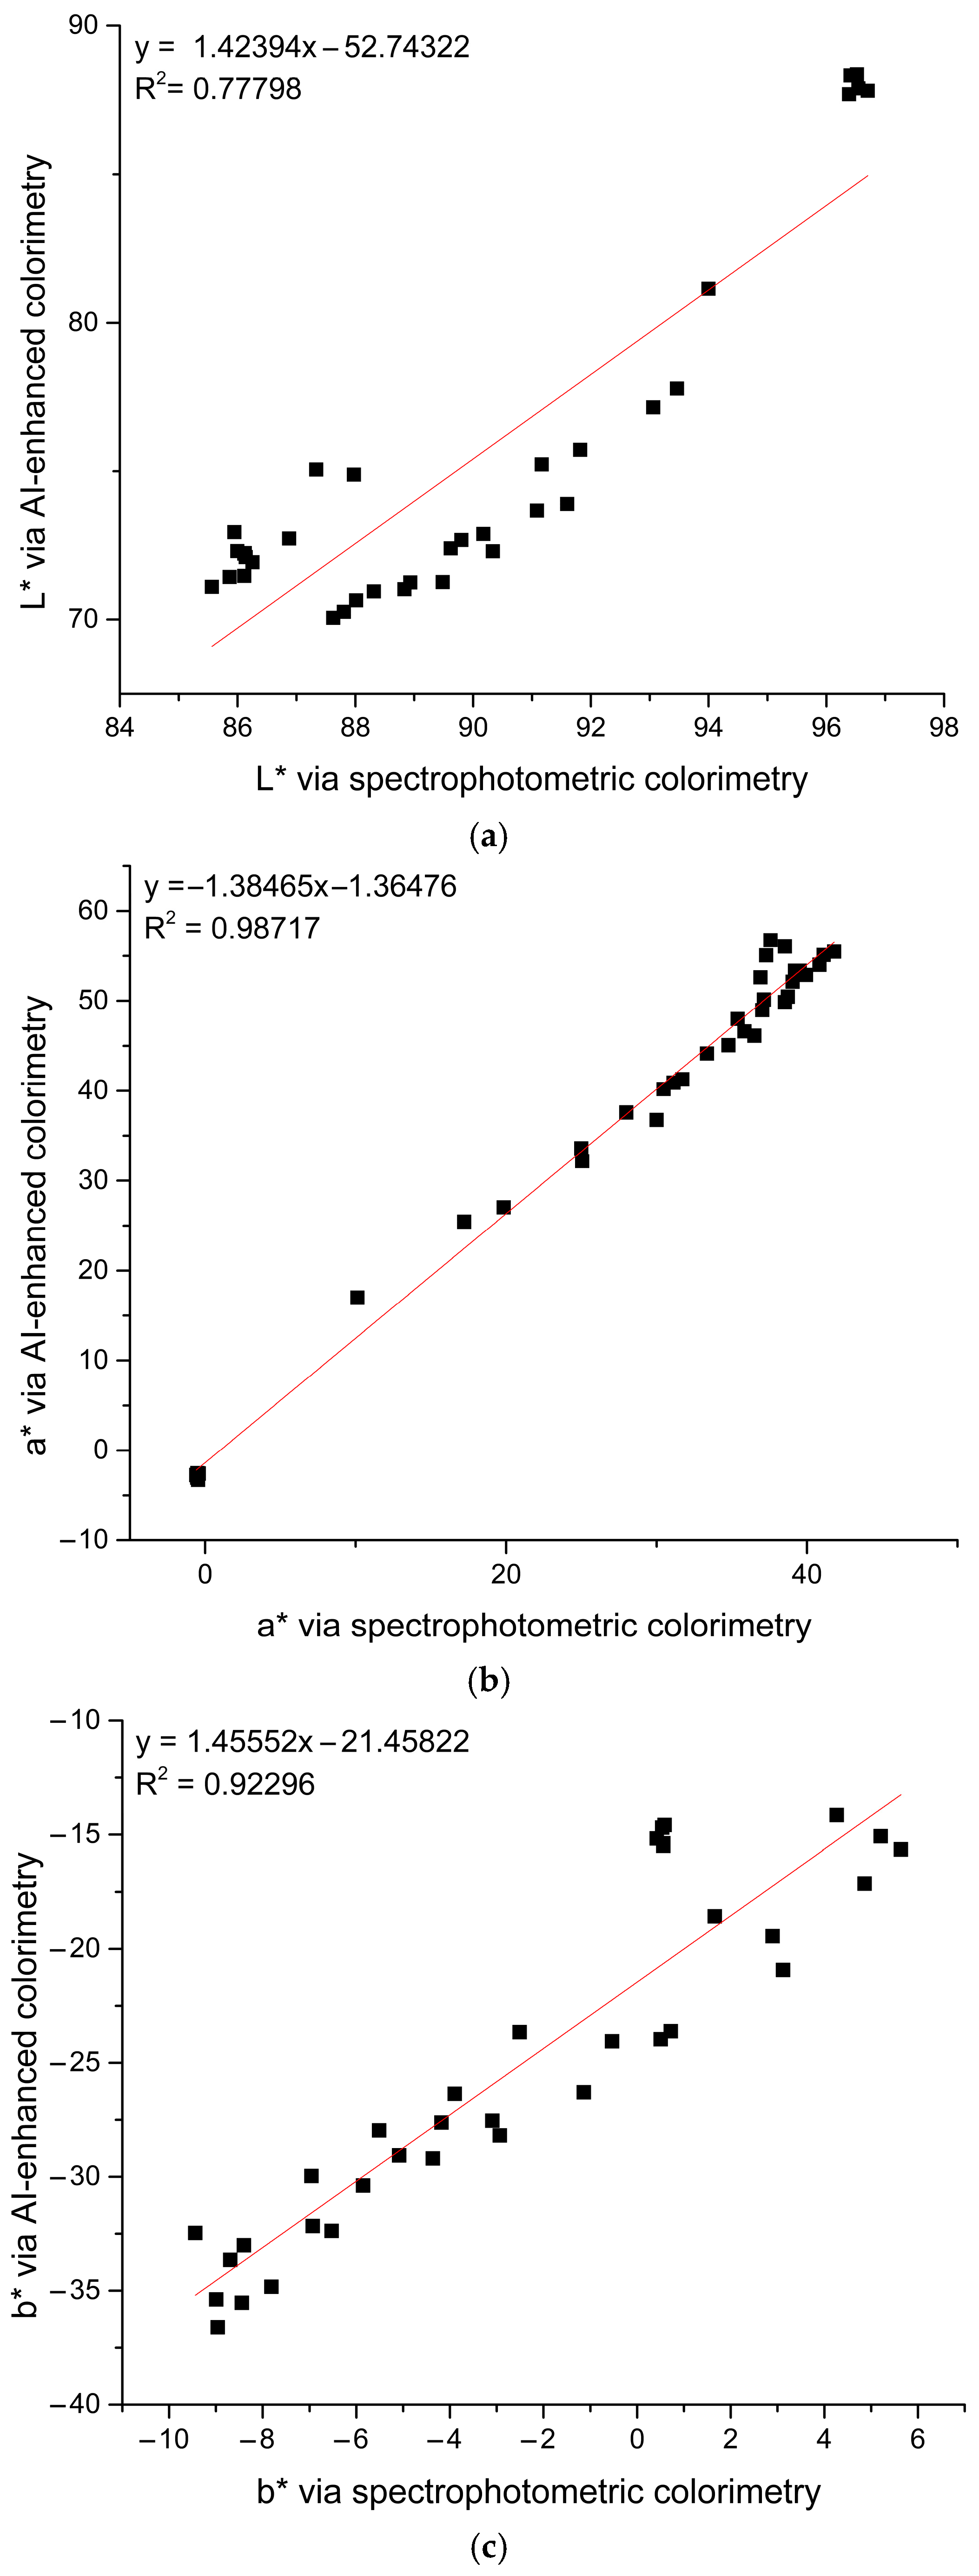
After calculating the CIELAB color coordinates using spectrophotometric and AI-enhanced colorimetry, the linear relationship between each coordinate calculated using the two methods was determined and discussed. Linear trend lines were obtained with the respective coefficient of determination (R2) for a*, b*, and L* obtained by spectrophotometry versus AI-enhanced digital image processing.

2.2.5. Photocatalytic Efficiency and Color Variation Assessment

The photocatalytic efficiency (PE) and color variation (∆E) measurements manifest the self-cleaning capability of RM paint after functionalization. Higher values for both parameters indicate a greater pollutant degradation on the surface of the specimens. At the specified irradiation times, after obtaining the color coordinates using both methods (spectrophotometry and AI-enhanced processing), the chroma or color saturation (CS) was determined using the chromatic coordinates ( a * and b * ) as per Equation (4):
C S = a * 2 + b * 2 0.5
Subsequently, the PE was calculated using the CIELAB color space, based on the discoloration of the sample (pollutant degradation), as described in Equation (5) [20,35]:
P E % = C S 0 C S t C S 0 C S w × 100
where C S 0 represents the color saturation of the polluted sample before starting irradiation, C S t is the color saturation at a specified light exposure time, and C S w is the color saturation of the sample before pollution.
In addition to photocatalytic efficiency, another indicator that works as a perceptibility factor of the pollutant removal is ∆E, calculated according to Equation (6) [20,36]:
E = L * 2 + a * 2 + b * 2 0.5
where L * , a * , and b * indicate the difference in the values of the coordinates L * , a * , and b * at a known irradiation period and the same polluted sample before starting irradiation.
Additionally, a linearity study was also performed to verify the correlation between the parameters calculated via spectrophotometric (PEs and ∆Es) and AI-enhanced (PEai and ∆Eai) colorimetry. Linear trend lines were obtained with the respective coefficient of determination (R2) for PEs versus PEai and ∆Es versus ∆Eai.

3. Results and Discussion

3.1. Self-Cleaning Assessment by Visual Analysis

The visual analysis technique (Figure 3) allowed for a qualitative assessment of the sample discoloration for different nano-TiO2 contents over the irradiation periods. It was observed that the specimens with the highest amounts of incorporated nano-TiO2 (2% and 3%) tended to become whitish as the irradiation time increased, indicating the degradation of Rhodamine B on their surfaces. In contrast, the reference sample and the samples with lower percentages of incorporated nano-TiO2 tended to maintain their initial color throughout light exposure, indicating low pollutant degradation rates. Thus, the incorporation of nano-TiO2 into RM paints conferred self-cleaning capability to the RM paint.

3.2. CIELAB Color Coordinates Comparative Analysis

Figure 4 presents the CIELAB color coordinates (L*, a*, b*) of the specimens obtained via spectrophotometric versus AI-enhanced colorimetry methods. The detailed results concerning the color coordinates values are properly identified in the Supplementary Materials in Tables S1 and S2. The comparison of L values from both techniques revealed a coefficient of determination (R2) of 0.77798, indicating a positive correlation. Besides there being a general linear trend between the values, the graph indicates potential discrepancies in lightness measurements between the two methods. Factors contributing to this discrepancy may include the lighting inside the photobox and the non-uniform spreading of the pollutant over the samples. Another relevant factor is that the spectrophotometer measures lightness in a specific area of the specimen, whereas the digital image processing considers the average lightness of all pixels in an image, which encompasses the entire surface of the specimen.
The scatter plots for the a* and b* coordinates reveal an R2 of 0.98717 and 0.92296, respectively, indicating a strong correlation between the colorimetric methods. These values suggest that image processing for color measurements with AI is highly consistent with spectrophotometric measurements. For the a* coordinate, AI-enhanced colorimetry accurately captured the green-to-red variation, similarly reflecting the spectrophotometric readings. For the b* coordinate, there was also a strong correlation; however, minor discrepancies may exist due to factors such as the internal lighting of the photobox, which may impart a residual coloration to the specimens. Therefore, the analysis of the self-cleaning capability of the functionalized RM paint using colorimetry could be performed using both techniques and compared.

3.3. Self-Cleaning Assessment by CIELAB Color Space

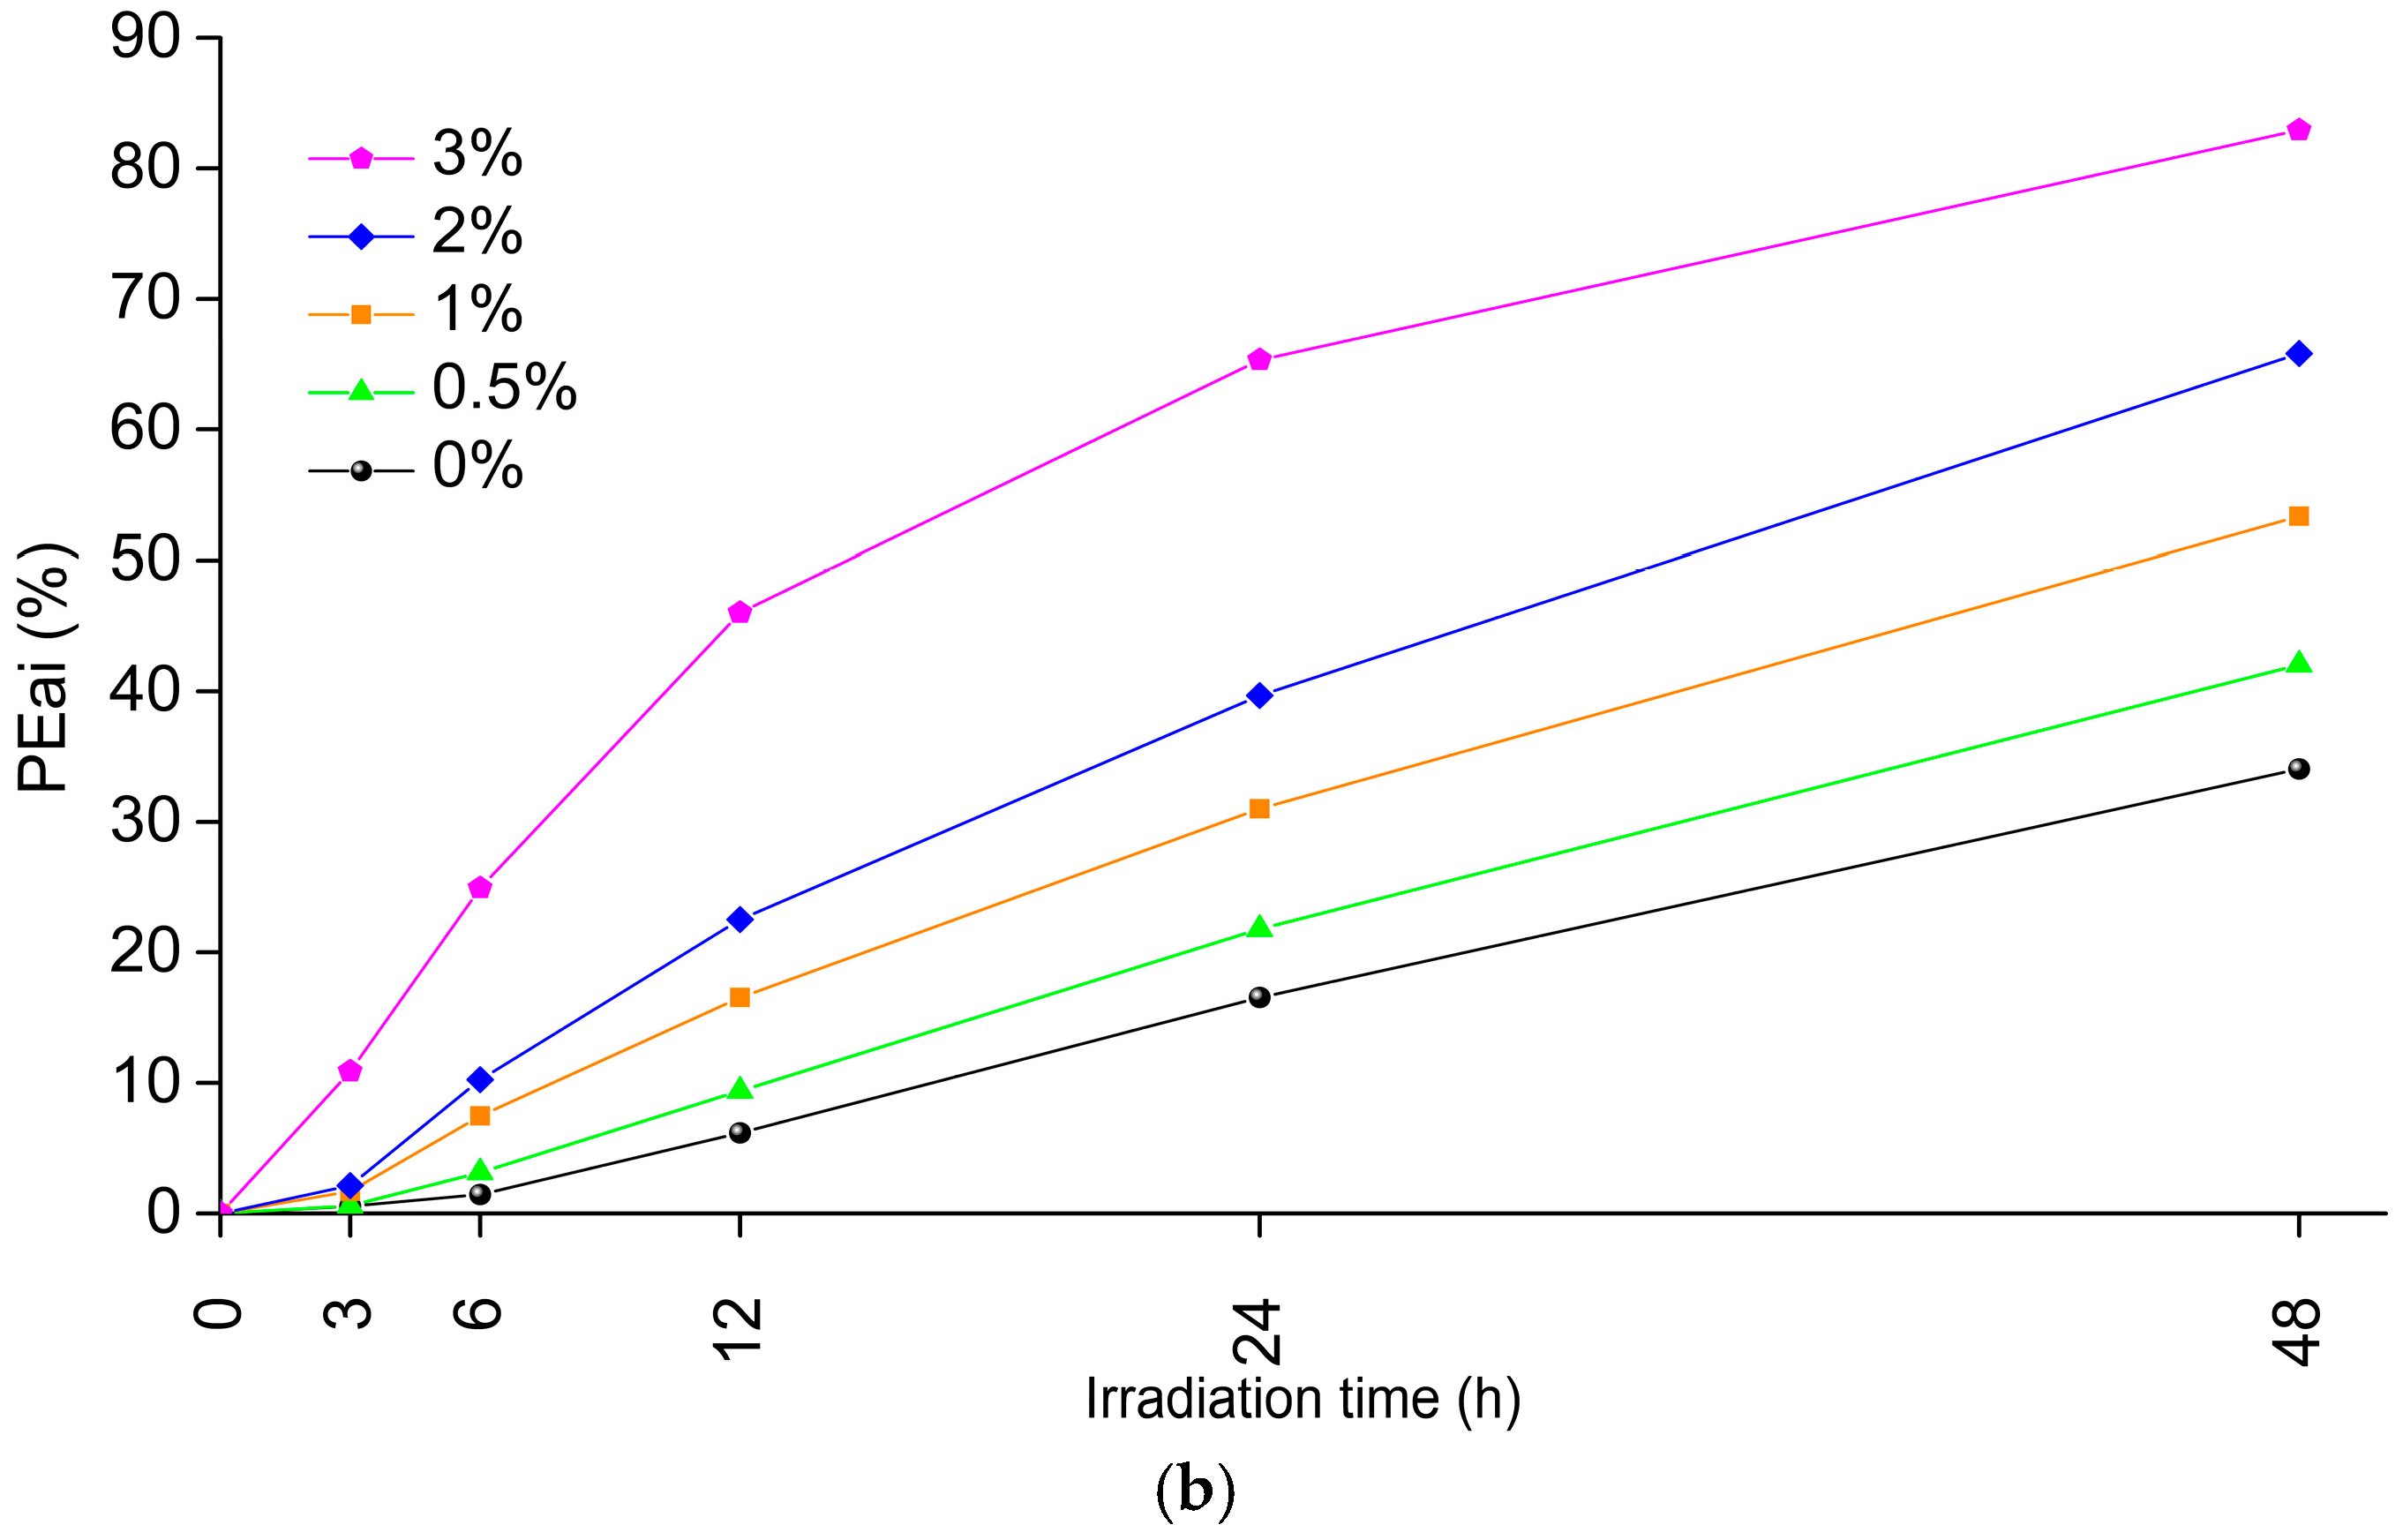
The photocatalytic efficiency calculated through spectrophotometric (PEs) and AI-enhanced (PEai) colorimetry techniques is presented in Figure 5. The results show that pollutant degradation (self-cleaning) increased with irradiation time, and higher amounts of nano-TiO2 in the paint led to increased photocatalytic efficiency. Thus, samples with 3% nano-TiO2 achieved PEs above 70% after 48 h, while the reference sample reached just over 20%.
PEai confirmed this trend, showing that higher concentrations of nano-TiO2 provided a greater self-cleaning capability to the paints. For example, the sample with 3% had the highest photocatalytic efficiency (above 80%) compared to the 34% of the reference paint.
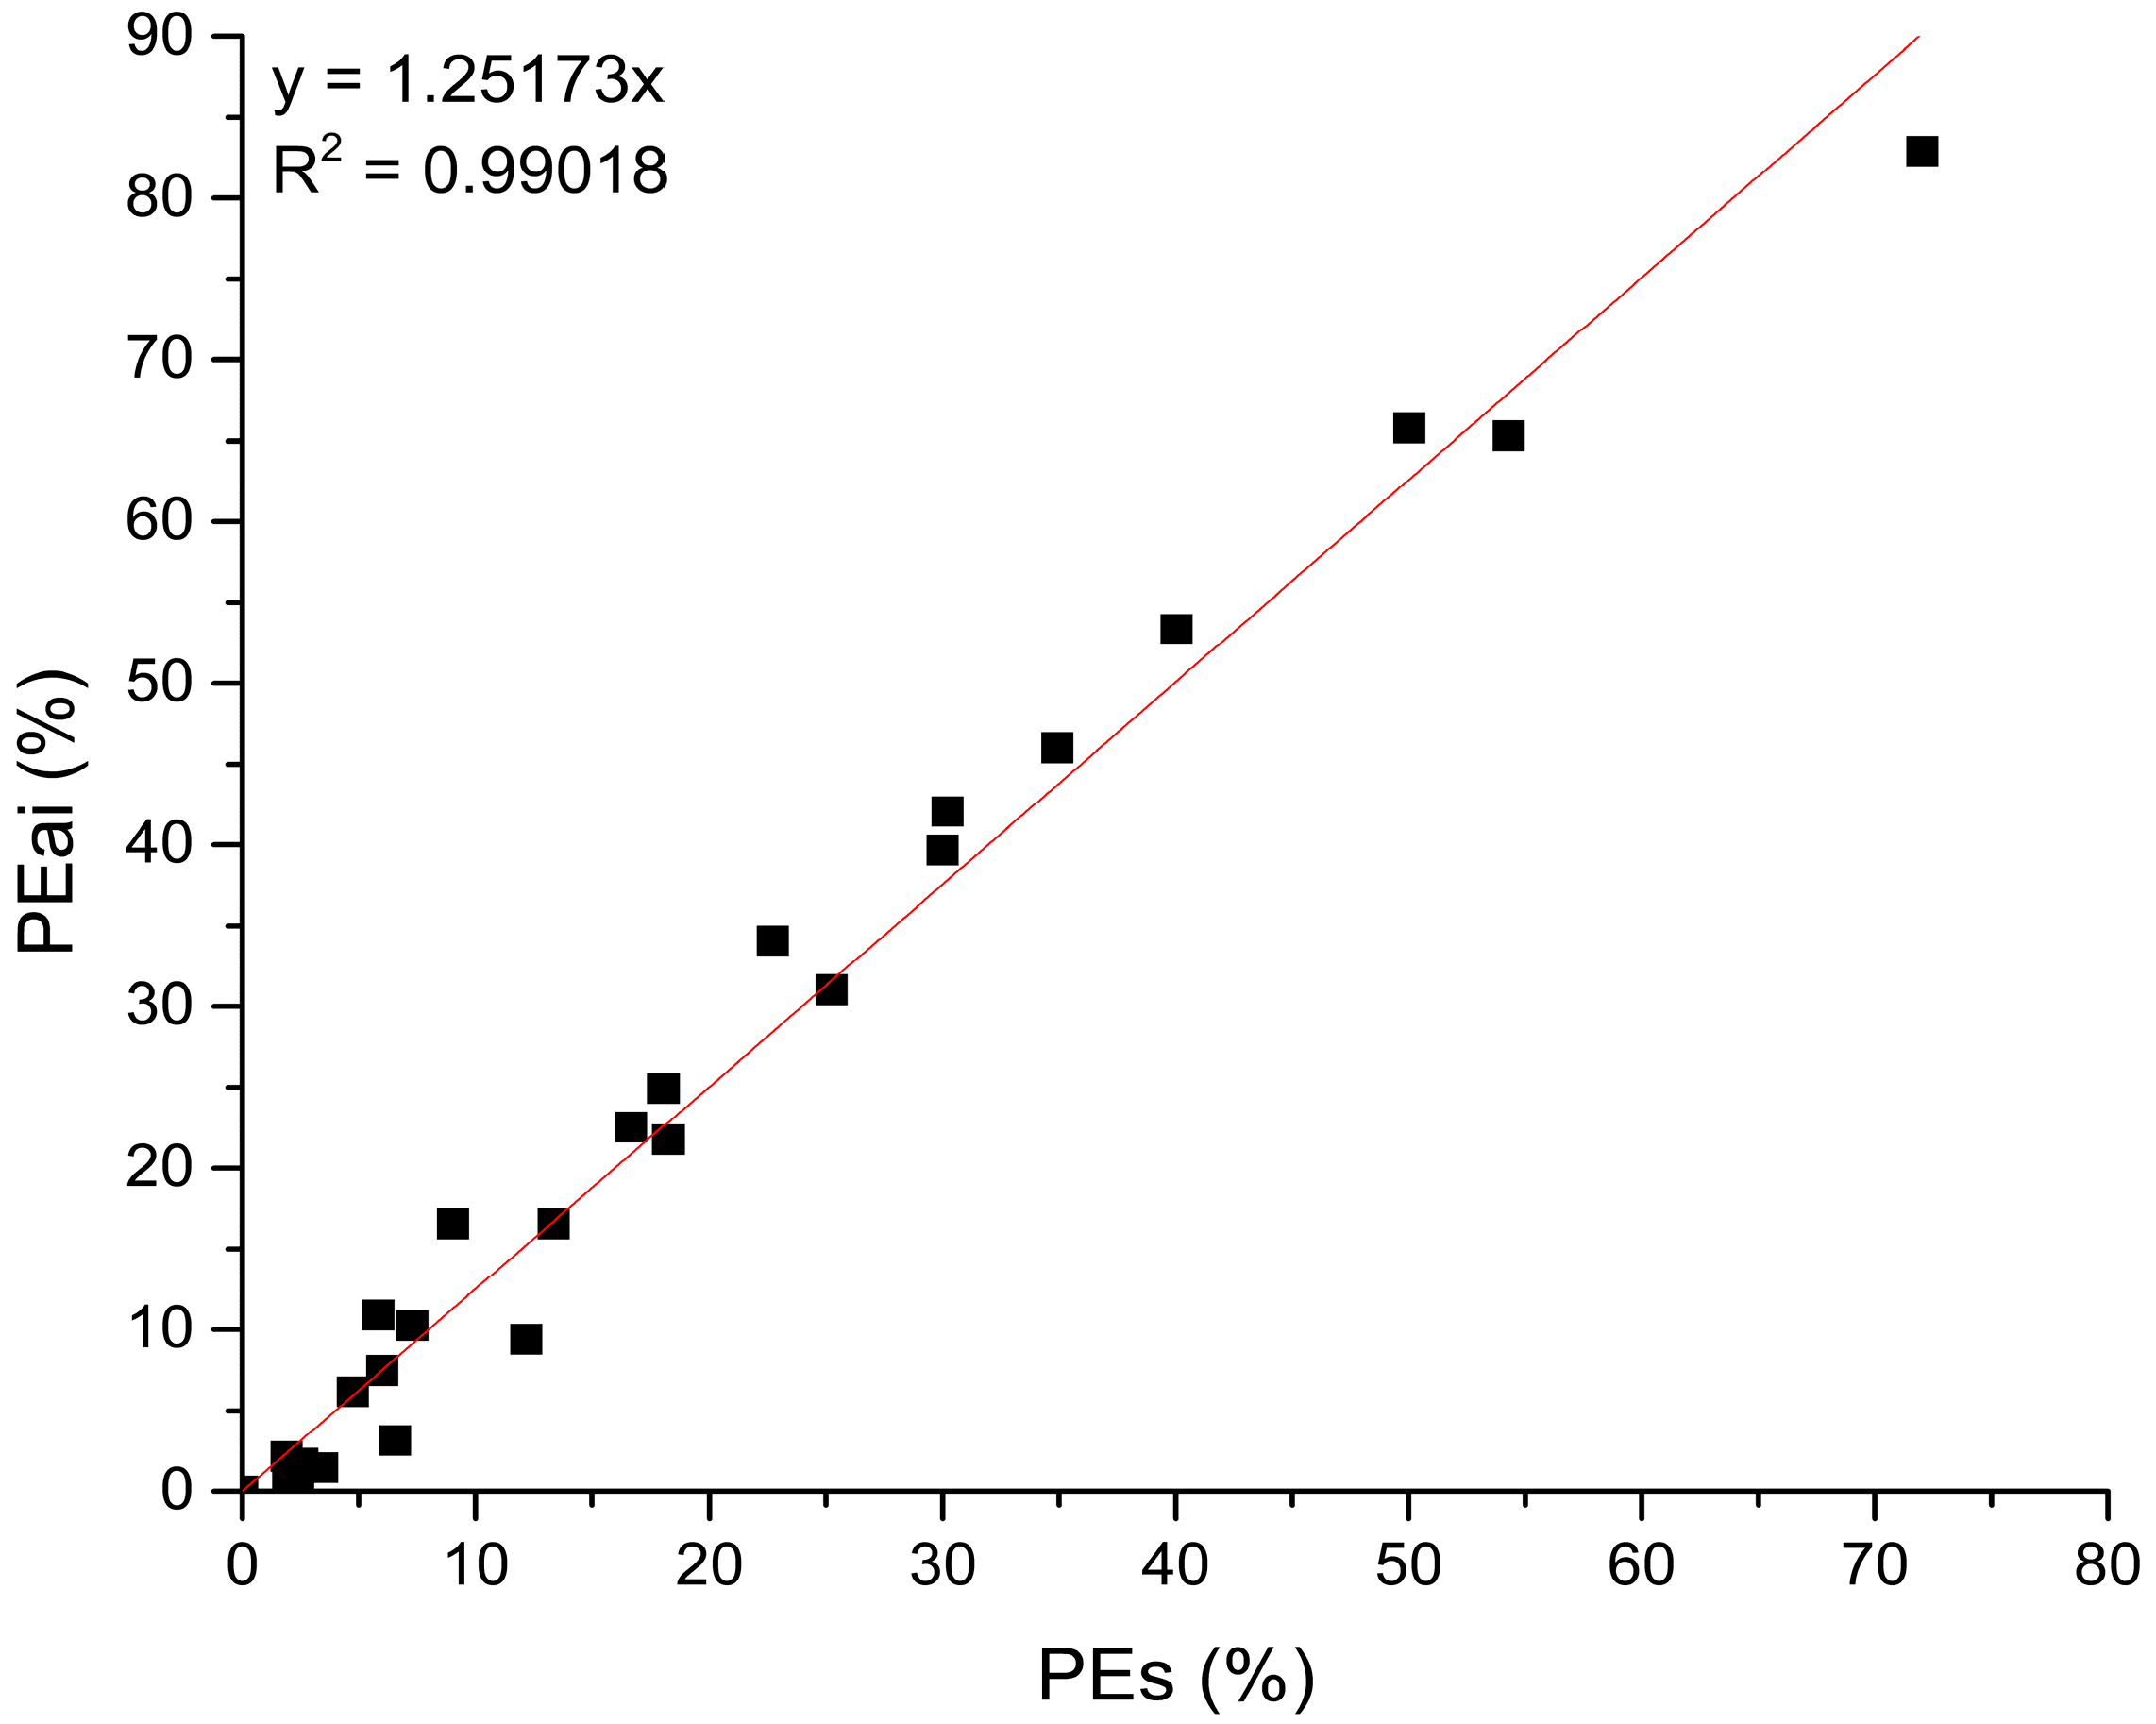
The linearity between PEs and PEai is shown in Figure 6, demonstrating a very high determination coefficient (R2 = 0.99018). This confirms that AI-enhanced colorimetry is an effective alternative for measuring self-cleaning on substrates. This linearity was expected, as color coordinates a* and b*, which were used to calculate photocatalytic efficiency, presented determination coefficients of 0.98717 and 0.92296, respectively.
The second colorimetric parameter used to evaluate self-cleaning was the E . It considers the variation in the three CIELAB color coordinates (Figure 7) and increases due to greater pollutant degradation on the sample surface (self-cleaning). Furthermore, the results concerning the colorimetric parameters (CS, PE, and ΔE) for self-cleaning assessment are properly identified in the Supplementary Materials in Tables S3 and S4.
The E s showed that color change increased with irradiation time and was directly proportional to the concentration of the semiconductors. Thus, the sample with 3% nano-TiO2 showed the highest color variation, reaching approximately 30 after 48 h of irradiation due to its higher photocatalytic efficiency.
The E a i also confirmed that the increase in color change was more pronounced for samples with higher amounts of incorporated nanomaterial. In this case, the sample with 3% nano-TiO2 revealed the highest color variation, exceeding 35 units after 48 h of irradiation.
As expected, the correlation between ∆Es and ∆Eai is high (Figure 8), with an R2 of 0.97825. However, similarly to the P E a i values, which were relatively higher than the P E s , the E a i values were also higher than the E s .
Several factors might have led to the higher values of P E a i and E a i , such as the lower correlation of the L* coordinate between both techniques, the illumination projected by the photobox on the samples, the area of the sample analyzed, the non-uniform pollutant dispersion on the sample, and the equipment calibration and configuration, among others. However, this comparison was essential to highlight that the AI-enhanced colorimetry method is a promising and highly efficient tool, enabling the measurement of color variations and photocatalytic efficiency, among other parameters. The use of AI eliminates the need for expensive and sophisticated equipment, such as a spectrophotometer, making the process more accessible and cost-effective. Additionally, AI offers the advantage of quickly analyzing large areas and volumes of data with high precision and consistency, ensuring reliable results. The ability to process images and detect subtle variations makes AI a valuable tool in situations where traditional methods may be time-consuming or fail.

4. Conclusions

This study focused on evaluating the self-cleaning capability achievement of RM paints after the incorporation of nano-TiO2 nanoparticles. For this purpose, as visual analysis techniques (in a controlled environment), spectroscopy and AI-enhanced colorimetry techniques were employed and compared. The following conclusions can be drawn:
  • Visual analysis showed that, after 48 h of light irradiation, samples with 2% and 3% of nano-TiO2 exhibited greater discoloration (self-cleaning) than the reference samples or those with lower rates.
  • The CIELAB color coordinates exhibited a strong linear correlation between the spectrophotometric and AI-assisted colorimetric methods, particularly for a* and b*, with R2 values of 0.98717 and 0.92296, respectively. The L* coordinate also demonstrated a positive correlation between the methods, with an R2 value of 0.77798, although this correlation was lower compared to a* and b*.
  • Colorimetric analysis revealed higher values of photocatalytic efficiency (up to 82%) and color variation (up to 35.76) for the samples with 3% of nano-TiO2 after 48 h of light irradiation.
  • The R2 for PEs versus PEai was 0.99018, and the R2 for ∆Es versus ∆Eai was 0.97825. For both parameters, the values obtained by AI-enhanced colorimetry were slightly higher.
In this regard, it can be inferred that the incorporation of nano-TiO2 into a water-based acrylic RM paint conferred self-cleaning properties. It was also concluded that colorimetry is a suitable technique for evaluating photocatalytic efficiency and that AI-enhanced colorimetric analysis is an economical and reliable alternative for this evaluation, as it does not require expensive equipment such as spectrophotometers or extensive programming knowledge for image processing.
Thus, AI-enhanced colorimetry, explored in this work, becomes a valuable technique with numerous practical applications. In industry, it can be used for quality control; in the medical field, for diagnostic tests and monitoring of skin diseases; in civil engineering, to assess the aging and degradation of construction materials; and in road engineering, to quantify the self-cleaning properties of various elements beyond RM, such as pavements.
Future work on self-cleaning capabilities includes using pollutant models similar to traffic-related pollution (soot), conducting extended duration testing, and developing new methods for immobilizing semiconductors, such as successive spray layers of nanoparticle dispersions during RM paint application. Additionally, it is crucial to evaluate the aging properties and durability of the RM system (luminance and retroreflectance) after functionalization. Moreover, future studies should also consider the potential environmental impact of using nano-TiO2, assessing its potential toxicity, bioavailability, and mitigation strategies to minimize adverse effects. Such assessments are essential to ensure that the practical applications of self-cleaning technologies are both effective and environmentally sustainable. Regarding the AI-enhanced colorimetry method for evaluating self-cleaning, used in this study, it is valuable to conduct a calibration study of the photobox compared to spectrophotometer measurements, with particular focus on adjusting the photobox lighting conditions to improve the correlation of the L* coordinate.

Supplementary Materials

The following supporting information can be downloaded at: https://www.mdpi.com/article/10.3390/app14219718/s1, Table S1. CIELAB color coordinates via spectrophotometer. Table S2. CIELAB color coordinates via AI-enhanced colorimetry. Table S3. Colorimetric parameters via spectrophotometric colorimetry. Table S4. Colorimetric parameters via AI-enhanced colorimetry.

Author Contributions

Conceptualization, O.L.J., I.R.S., E.F. and J.C.; methodology, O.L.J., I.R.S., E.F. and J.C.; software, O.L.J.; validation, I.R.S., E.F. and J.C.; formal analysis, O.L.J., I.R.S., E.F. and J.C.; investigation, O.L.J., I.R.S., E.F. and J.C.; resources, O.L.J., I.R.S., E.F., J.C. and M.F.M.C.; data curation, O.L.J.; writing—original draft preparation, O.L.J.; writing—review and editing, O.L.J., I.R.S., E.F., J.C., L.M. and M.F.M.C.; visualization, O.L.J., I.R.S., E.F., J.C., L.M. and M.F.M.C.; supervision, I.R.S., E.F. and J.C.; project administration, I.R.S., E.F. and J.C.; funding acquisition, I.R.S., E.F., M.F.M.C. and J.C. All authors have read and agreed to the published version of the manuscript.

Funding

This research was supported by doctoral Grant PRT/BD/154269/2022 financed by the Portuguese Foundation for Science and Technology (FCT) and with funds from POR Norte-Portugal 2020 and the State Budget, under the MIT Portugal Program. This research was also financed by the FCT through national funds (PIDDAC) under projects NanoAir PTDC/FISMAC/6606/2020 (doi.org/10.54499/PTDC/FISMAC/6606/2020), UIDB/04650/2020, and UIDB/04029/2020 (doi.org/10.54499/UIDB/04029/2020), under the R&D Unit Institute for Sustainability and Innovation in Structural Engineering (ISISE), under reference UIDB/04029/2020, and under the Associate Laboratory Advanced Production and Intelligent Systems ARISE under reference LA/P/0112/2020. The second author would like to acknowledge the FCT for funding with reference 2022.00763.CEECIND. (https://doi.org/10.54499/2022.00763.CEECIND/CP1718/CT0006).

Institutional Review Board Statement

Not applicable.

Informed Consent Statement

Not applicable.

Data Availability Statement

The original contributions presented in the study are included in the article/Supplementary Material, further inquiries can be directed to the corresponding author.

Conflicts of Interest

The authors declare no conflicts of interest.

References

  1. Pocock, B.W.; Rhodes, C.C. Principles of Glass-Bead Reflectorization. Highw. Res. Board Bull. 1952, 57, 32–48. [Google Scholar]
  2. Burghardt, T.E.; Pashkevich, A. Materials Selection for Structured Horizontal Road Markings: Financial and Environmental Case Studies. Eur. Transp. Res. Rev. 2020, 12, 11. [Google Scholar] [CrossRef]
  3. Burghardt, T.E.; Pashkevich, A. Green Public Procurement Criteria for Road Marking Materials from Insiders’ Perspective. J. Clean. Prod. 2021, 298, 126521. [Google Scholar] [CrossRef]
  4. Migletz, J.; Graham, J.L.; Harwood, D.W.; Bauer, K. Service Life of Durable Pavement Markings. Transp. Res. Rec. J. Transp. Res. Board 2001, 1749, 13–21. [Google Scholar] [CrossRef]
  5. Theeuwes, J.; Snell, J.; Koning, T.; Bucker, B. Self-Explaining Roads: Effects of Road Design on Speed Choice. Transp. Res. Part F Traffic Psychol. Behav. 2023, 102, 335–361. [Google Scholar] [CrossRef]
  6. Oktopianto, Y.; Rukman, R. Analysis of the Road Markings Reflectivity Service Life on Highways to Improve Safety. RSF Conf. Ser. Eng. Technol. 2022, 2, 316–323. [Google Scholar] [CrossRef]
  7. Burghardt, T.E.; Maki, E.; Pashkevich, A. Yellow Thermoplastic Road Markings with High Retroreflectivity: Demonstration Study in Texas. Case Stud. Constr. Mater. 2021, 14, e00539. [Google Scholar] [CrossRef]
  8. Babić, D.; Ščukanec, A.; Fiolić, M. Model for Predicting Road Markings Service Life. Balt. J. Road Bridge Eng. 2019, 14, 341–359. [Google Scholar] [CrossRef]
  9. Babić, D.E.; Burghardt, T.; Babić, D. Application and Characteristics of Waterborn Road Marking Paint. Int. J. Traffic Transp. Eng. 2015, 5, 150–169. [Google Scholar] [CrossRef]
  10. Boucher, J.; Friot, D. Primary Microplastics in the Oceans: A Global Evaluation of Sources; IUCN International Union for Conservation of Nature: Gland, Switzerland, 2017; ISBN 9782831718279. [Google Scholar]
  11. Kole, P.J.; Löhr, A.J.; van Belleghem, F.; Ragas, A. Wear and Tear of Tyres: A Stealthy Source of Microplastics in the Environment. Int. J. Environ. Res. Public Health 2017, 14, 1265. [Google Scholar] [CrossRef] [PubMed]
  12. Segundo, I.R.; Freitas, E.; Branco, V.T.F.C.; Landi, S.; Costa, M.F.; Carneiro, J.O. Review and Analysis of Advances in Functionalized, Smart, and Multifunctional Asphalt Mixtures. Renew. Sustain. Energy Rev. 2021, 151, 111552. [Google Scholar] [CrossRef]
  13. Lima, O.; Cardoso, P.; Segundo, I.R.; Freitas, E.; Costa, M.F.M.; Nascimento, H.; Afonso, C.; Landi, S.; Teixeira, V.; Carneiro, J. Thermochromism Applied to Transportation Engineering: Asphalt Roads and Paints. J. Phys. Conf. Ser. 2022, 2407, 012042. [Google Scholar] [CrossRef]
  14. Carneiro, J.O.; Azevedo, S.; Teixeira, V.; Fernandes, F.; Freitas, E.; Silva, H.; Oliveira, J. Development of Photocatalytic Asphalt Mixtures by the Deposition and Volumetric Incorporation of TiO2 Nanoparticles. Constr. Build. Mater. 2013, 38, 594–601. [Google Scholar] [CrossRef]
  15. Rocha Segundo, I.; Ferreira, C.; Freitas, E.F.; Carneiro, J.O.; Fernandes, F.; Júnior, S.L.; Costa, M.F. Assessment of Photocatalytic, Superhydrophobic and Self-Cleaning Properties on Hot Mix Asphalts Coated with TiO2 and/or ZnO Aqueous Solutions. Constr. Build. Mater. 2018, 166, 500–509. [Google Scholar] [CrossRef]
  16. Reza Omranian, S.; Geluykens, M.; Van Hal, M.; Hasheminejad, N.; Rocha Segundo, I.; Pipintakos, G.; Denys, S.; Tytgat, T.; Fraga Freitas, E.; Carneiro, J.; et al. Assessing the Potential of Application of Titanium Dioxide for Photocatalytic Degradation of Deposited Soot on Asphalt Pavement Surfaces. Constr. Build. Mater. 2022, 350, 128859. [Google Scholar] [CrossRef]
  17. Liu, K.; Cao, M.; Fujishima, A.; Jiang, L. Bio-Inspired Titanium Dioxide Materials With Special Wettability and Their Applications. Chem. Rev. 2014, 114, 10044–10094. [Google Scholar] [CrossRef]
  18. Paramés, J.; Brito, J. de Materiais de Construção Nanotecnológicos de Auto-Limpeza-Self-Cleaning Nanotechnologic Construction Materials. Teor. Prática Eng. Civ. 2010, 15, 55–62. [Google Scholar]
  19. Van Hal, M.; Verbruggen, S.W.; Yang, X.-Y.; Lenaerts, S.; Tytgat, T. Image Analysis and in Situ FTIR as Complementary Detection Tools for Photocatalytic Soot Oxidation. Chem. Eng. J. 2019, 367, 269–277. [Google Scholar] [CrossRef]
  20. Silva, A.S.; Borsoi, G.; Parracha, J.L.; Flores-Colen, I.; Veiga, R.; Faria, P.; Dionísio, A. Evaluating the Effectiveness of Self-Cleaning Products Applied on External Thermal Insulation Composite Systems (ETICS). J. Coat. Technol. Res. 2022, 19, 1437–1448. [Google Scholar] [CrossRef]
  21. Pal, S.; Contaldi, V.; Licciulli, A.; Marzo, F. Self-Cleaning Mineral Paint for Application in Architectural Heritage. Coatings 2016, 6, 48. [Google Scholar] [CrossRef]
  22. Quan, X.; Yang, L.; Li, H.; Chen, Y.; Shi, S. Performance Evaluation of a Multifunctional Road Marking Coating for Tunnels Based on Nano SiO2 and TiO2 Modifications. Buildings 2024, 14, 459. [Google Scholar] [CrossRef]
  23. Fang, M.; Peng, L.; Li, Y.; Cheng, Y.; Zhan, L. Evaluation Test of NO Degradation by Nano-TiO2 Coatings on Road Pavements under Natural Light. Coatings 2022, 12, 1200. [Google Scholar] [CrossRef]
  24. Smits, M.; Chan, C.K.; Tytgat, T.; Craeye, B.; Costarramone, N.; Lacombe, S.; Lenaerts, S. Photocatalytic Degradation of Soot Deposition: Self-Cleaning Effect on Titanium Dioxide Coated Cementitious Materials. Chem. Eng. J. 2013, 222, 411–418. [Google Scholar] [CrossRef]
  25. Folli, A.; Jakobsen, U.H.; Guerrini, G.L.; Macphee, D.E. Rhodamine B Discolouration on TiO2 in the Cement Environment: A Look at Fundamental Aspects of the Self-Cleaning Effect in Concretes. J. Adv. Oxid. Technol. 2009, 12, 126–133. [Google Scholar] [CrossRef]
  26. Sikora, P.; Horszczaruk, E.; Rucinska, T. The Effect of Nanosilica and Titanium Dioxide on the Mechanical and Self-Cleaning Properties of Waste-Glass Cement Mortar. Procedia Eng. 2015, 108, 146–153. [Google Scholar] [CrossRef]
  27. Wirunchit, S.; Wonganan, N.; Koetniyom, W. Multi Self-Cleaning Properties of Zinc Oxide Nanoparticles/ Polydimethylsiloxane (ZnO/PDMS) Composite on Polyester Textile. Curr. Appl. Sci. Technol. 2023, 23. [Google Scholar] [CrossRef]
  28. Hirashima, T.; Adachi, T. Procedures for the Quantification of Whole-Tissue Immunofluorescence Images Obtained at Single-Cell Resolution During Murine Tubular Organ Development. PLoS ONE 2015, 10, e0135343. [Google Scholar] [CrossRef]
  29. Zanuncio, A.J.V.; Costa, E.A.; Carvalho, A.G.; De Castro, V.R.; Carneiro, A.D.C.O.; Araújo, S.D.O.; Florestais, P.C.d.E. Artificial Intelligence and Colorimetry as a Combined Non-Destructive Method to Predict Properties of Heat-Treated Wood. Cellul. Chem. Technol. 2022, 56, 941–948. [Google Scholar] [CrossRef]
  30. Feng, F.; Ou, Z.; Zhang, F.; Chen, J.; Huang, J.; Wang, J.; Zuo, H.; Zeng, J. Artificial Intelligence-Assisted Colorimetry for Urine Glucose Detection towards Enhanced Sensitivity, Accuracy, Resolution, and Anti-Illuminating Capability. Nano Res. 2023, 16, 12084–12091. [Google Scholar] [CrossRef]
  31. Lin, C.-S.; Pan, Y.-C.; Kuo, Y.-X.; Chen, C.-K.; Tien, C.-L. A Study of Automatic Judgment of Food Color and Cooking Conditions with Artificial Intelligence Technology. Processes 2021, 9, 1128. [Google Scholar] [CrossRef]
  32. Hoque Tania, M.; Lwin, K.T.; Shabut, A.M.; Najlah, M.; Chin, J.; Hossain, M.A. Intelligent Image-Based Colourimetric Tests Using Machine Learning Framework for Lateral Flow Assays. Expert. Syst. Appl. 2020, 139, 112843. [Google Scholar] [CrossRef]
  33. Pereira, A.P.; Ribeiro, J.L.; Oliveira, A.C.F.; Vasconcelos, C.K.B.; Viana, M.M.; Lins, V.d.F.C. Lignin-Modified Road Marking Paint: Weathering Aging Studies. REM-Int. Eng. J. 2021, 74, 225–233. [Google Scholar] [CrossRef]
  34. EN 1436:2009; Road Marking Materials—Road Marking Performance for Road Users. German Institute for Standardization: Berlin, Germany, 2009.
  35. Munafò, P.; Quagliarini, E.; Goffredo, G.B.; Bondioli, F.; Licciulli, A. Durability of Nano-Engineered TiO2 Self-Cleaning Treatments on Limestone. Constr. Build. Mater. 2014, 65, 218–231. [Google Scholar] [CrossRef]
  36. Lima, O.; Freitas, E.; Cardoso, P.; Segundo, I.R.; Margalho, É.; Moreira, L.; José, J.H.; Landi, S.; Carneiro, J. Mitigation of Urban Heat Island Effects by Thermochromic Asphalt Pavement. Coatings 2023, 13, 35. [Google Scholar] [CrossRef]
  37. Robertson, A.R. The CIE 1976 Color-difference Formulae. Color Res. Appl. 1977, 2, 7–11. [Google Scholar] [CrossRef]
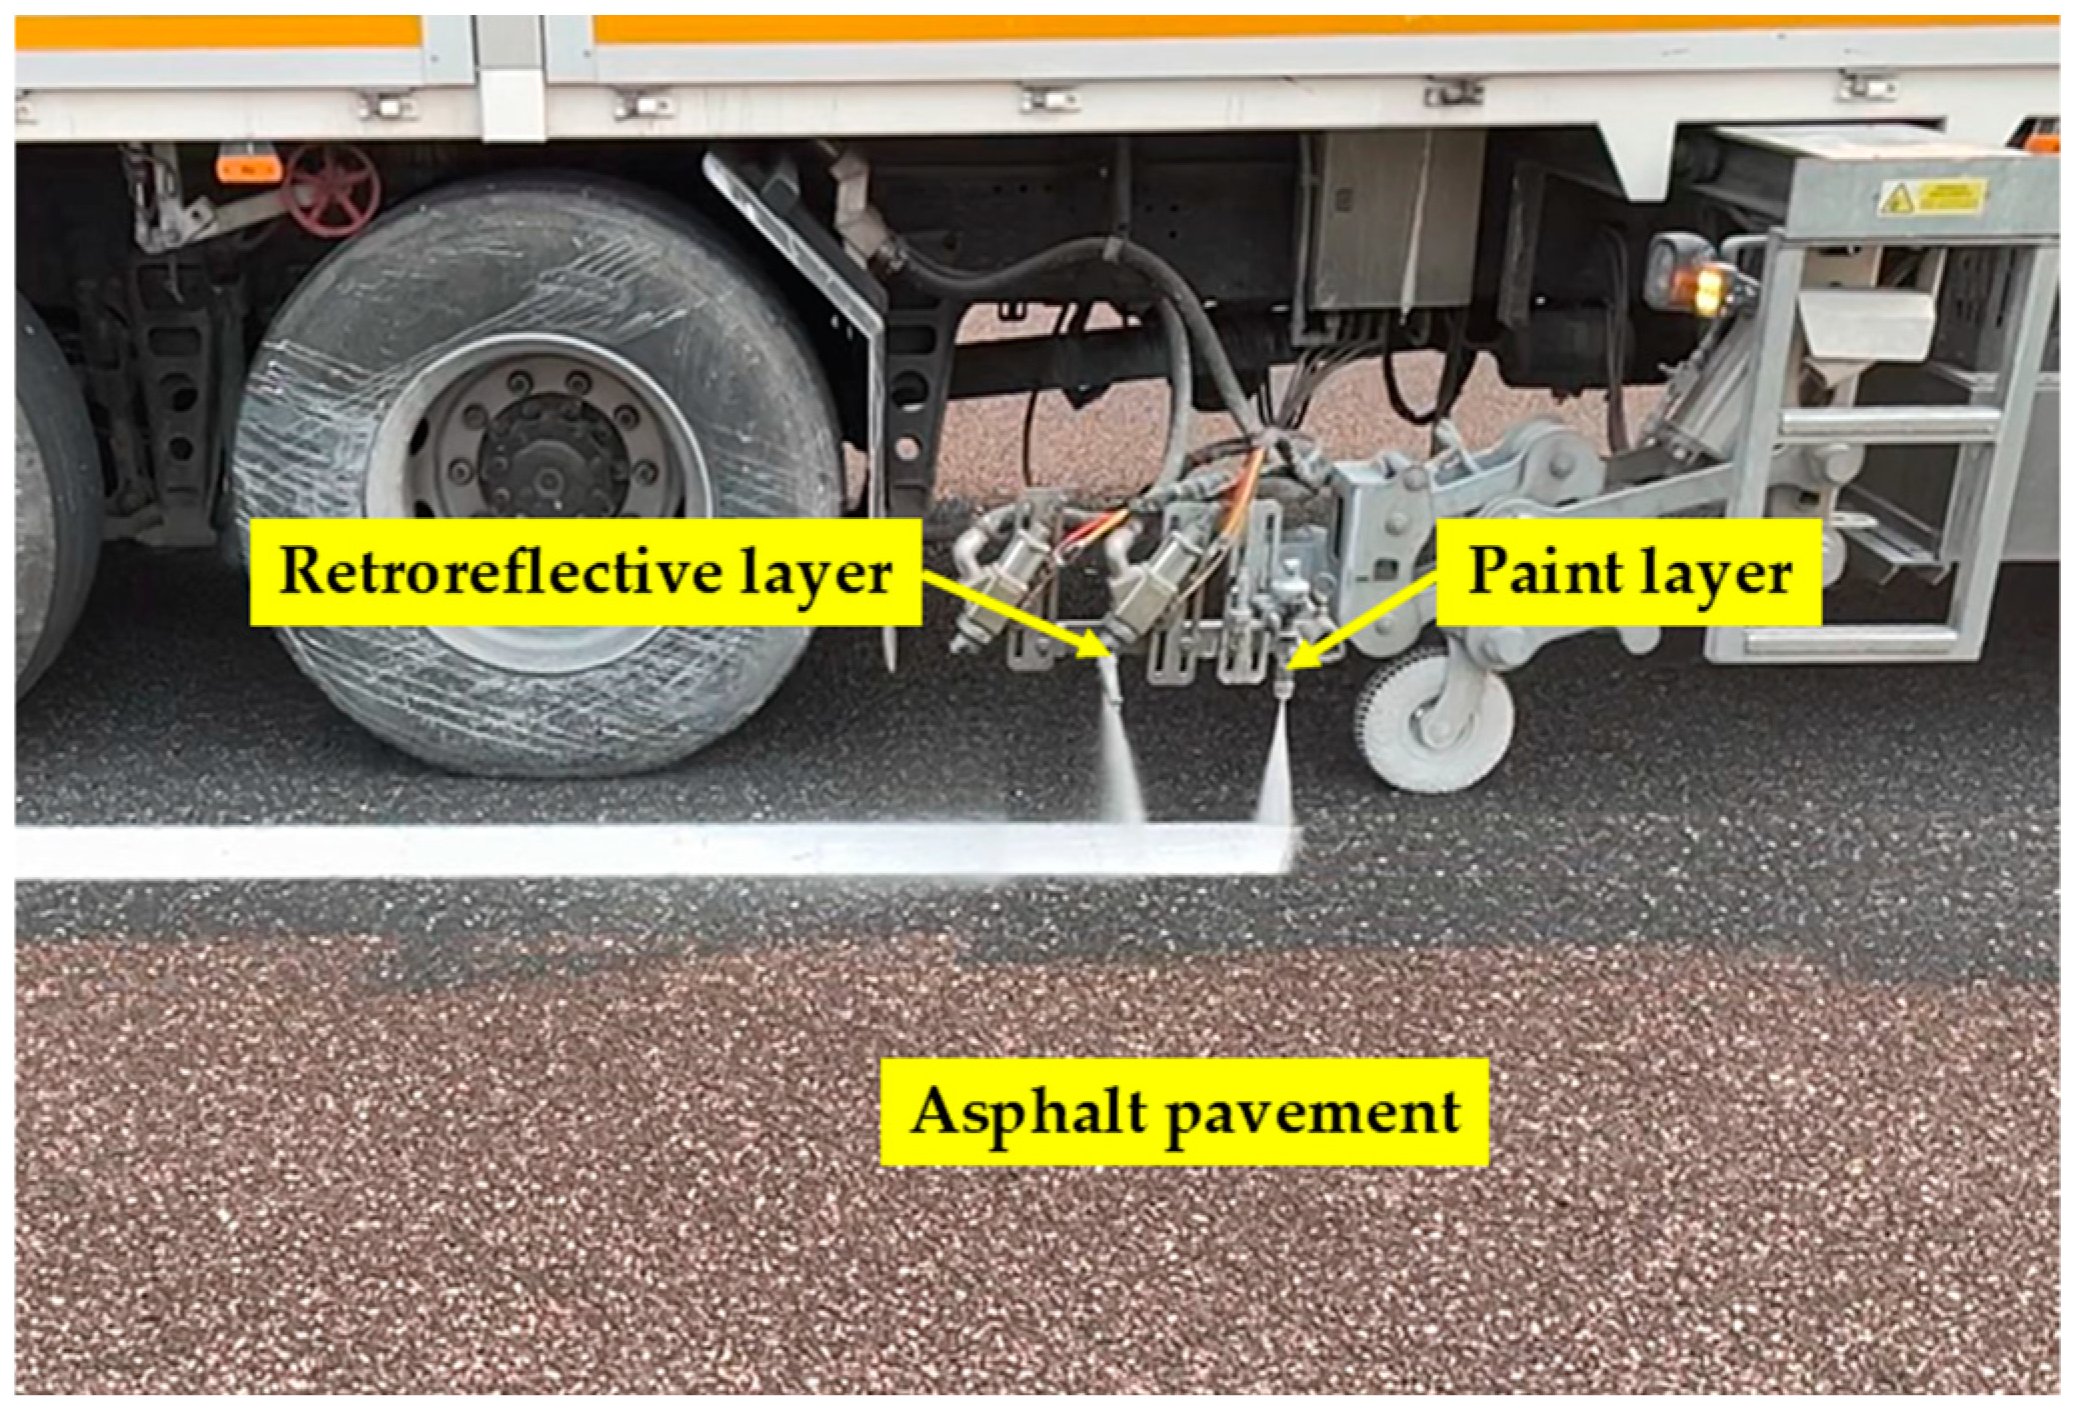
Figure 1. Application of RM system.
Applsci 14 09718 g001
Figure 2. Irradiation setup.
Applsci 14 09718 g002
Figure 3. Visual analysis of sample discoloration over irradiation periods.
Applsci 14 09718 g003
Figure 4. (a) L*; (b) a*; and (c) b* values obtained from spectrophotometric versus AI-enhanced colorimetry methods.
Applsci 14 09718 g004
Figure 5. Photocatalytic efficiency calculated through (a) spectrophotometric (PEs) and (b) AI-enhanced (PEai) colorimetry.
Applsci 14 09718 g005aApplsci 14 09718 g005b
Figure 6. PEs versus PEai.
Applsci 14 09718 g006
Figure 7. Color variation calculated through (a) spectrophotometric ( E s ) and (b) AI-enhanced ( E a i ) colorimetry.
Applsci 14 09718 g007
Figure 8. E s versus E a i .
Applsci 14 09718 g008
Disclaimer/Publisher’s Note: The statements, opinions and data contained in all publications are solely those of the individual author(s) and contributor(s) and not of MDPI and/or the editor(s). MDPI and/or the editor(s) disclaim responsibility for any injury to people or property resulting from any ideas, methods, instructions or products referred to in the content.