1. Introduction
The UK has a temperate climate. It gets cool, wet winters and warm, wet summers [
1], and construction workers are often outside working on projects throughout the year. Eventually, their protective equipment and clothing will inevitably come into contact with mud and water. Hence, to help staff keep their clothes dry and ready to wear for the next shift, most sites accommodate staff changing facilities by using temporary modular buildings or so-called drying rooms to provide employees with changing facilities [
2]. These facilities are indispensable for construction sites, as they are used on a daily basis and become increasingly crucial as the workforce expands throughout the construction project. However, when it is rainy, these spaces become filled with wet kit, which makes the combination of drying racks and heating alone a slower drying option and not effective enough to have garments dry and ready to use for the next day shift. It is mostly the case when changing rooms are locked up overnight with little to no ventilation, causing evaporated moisture from wet garments to remain in the atmosphere, making the environment uncomfortable, which could lead to mould spread affecting employees’ welfare, and to retard this phenomenon, an extractor needs to be installed simultaneously with the heater for long hours to dry garments, which consumes a huge amount of energy. It was predicted in June 2023 that the construction industry will increase by 12% in the UK in 2024 and 3% in 2025 [
3]. Due to this increasing trend, innovative drying methods should be developed to reduce energy consumption and improve the drying performance of drying rooms in construction sites; otherwise, a large amount of energy will be wasted every year, exacerbating the global energy crisis.
Following the UK Government’s 2019 amendment to the 2008 Climate Change Act, enshrining net zero in law, a construction company in the UK took on a board-level challenge and began the process of developing a new, long-term sustainability strategy that aims to create material change through the construction industry. Site drying room setups currently account for 10% of the company’s carbon emissions; reducing this is vital for success. This project will bring a new approach to the market, using computer modelling and data analysis to help design an economically viable solution and push industry best practices for carbon reduction.
As per these facts, a comprehensive study to determine the optimum drying condition of protective personal equipment is important, and the results will be beneficial for construction and other businesses such as firefighters, water sports, etc.
The drying process, which refers to the removal of moisture remaining in fabric after squeezing or hydro-extraction, is one of the most energy-intensive processes [
4]. The amount of moisture in a fabric depends on different properties such as thickness, structure, size, the shape of pores of the fabric, and also the chemical interaction between the water molecules and the surface of that fabric [
5]. The drying capability is evaluated by the drying rate of the fabric, which is defined as the speed that the drying process takes, which is an important indicator to evaluate the drying performance of a wet garment [
6].
There are three elements that favour the evaporation of water from wet clothes [
7]:
High temperature: to transform liquid molecules to vapour.
Air movement: to carry water vapour away and prevent the air near clothes from becoming saturated with vapour.
Low humidity: evaporation will continue steadily, and water molecules will not return to clothes from the air.
In general, the clothes drying process is divided into two parts. First, heat is to be provided to wet clothes through the air to generate evaporation of enough water molecules; then, the space above the clothes becomes saturated with water; the second important step is that an air stream is needed to completely remove the vapour from the air around them since the water vapour lingering near the clothes’ surface would hinder water molecules from escaping from clothes, and some of the vapour molecules could also re-enter clothes, wetting them again. In addition, even if it is warm, the high level of humidity in the air will make it difficult for water to evaporate from clothes, and it is very unlikely they will dry. They may even pick up moisture and become wetter [
7].
So far, multiple research projects have been undertaken on dryers in the agriculture domain, which showed that the temperature of drying air, airflow velocity, relative humidity, and type and maturity of agricultural crops influence the moisture removal process. A study by [
8] investigated the impact of temperature and air velocity on evaporation rates. The results demonstrated that evaporation rates increase proportionally with air temperature and velocity due to an increased air absorption capacity for water vapour. However, evaporation rates tend to decrease when the temperature reaches its maximum and becomes constant, indicating saturation at constant velocity and temperature. Additionally, the study concluded that temperature’s effect is less significant at high air velocities. Similarly, [
9] examined a clothes dryer using waste heat from a split type of air conditioner. Two experiments were conducted: one with an auxiliary fan unit and one without. The results showed that the drying rate was higher with the fan unit (2.26 kg/h) compared to without (1.1 kg/h). Despite the fan unit consuming additional power, it significantly improved drying efficiency. In their study, ref. [
10] presented an eco-friendly heat pump clothes dryer to address high-power consumption and environmental concerns in urban Malaysia. Utilising waste heat from indoor air conditioner units, the prototype demonstrated faster drying times compared to outdoor methods, as it can dry up to 1.5 kg of clothes in 3 h, significantly reducing household costs. In another study, the authors in [
11] investigated the distribution uniformity of the drying airflow by using a thermal resistor to measure material temperature and considering the temperature rising rate as an indicator of drying materials (fruits and vegetables), and good distribution of the airflow concluded that many factors affect the uniformity of the fruits and vegetables drying process, which are not only limited to the structural design parameters but are extended to the operating conditions parameters and the distribution of fruit and vegetables in the material tray.
Considerable studies have been made on clothes drying but not in the construction sector, such as [
12] evaluating the drying properties of summer men’s sportswear of different brands and thicknesses available in the Hong Kong market. The conclusion of this study stated that the fabric thickness has an effect on the drying rate; in other words, the higher the fabric thickness, the lower the drying rate.
The study [
13] built a theoretical model to simulate the drying process inside a domestic tumble dryer and concluded that the energy consumption was primarily influenced by the ambient air temperature and relative humidity. Ref. [
14] studied the effect of three different types of electric heating elements (the Positive Temperature Coefficient, resistance wire, and modified resistance wire) on the drying performance of the dryer; the results indicated that a modified resistance wire with aluminium splints in a tumbler clothes dryer might have great potential to reduce the residential energy consumption. However, most of these studies are conducted on tumble dryers, and while there is a need to investigate drying performance in construction sites, that is the purpose of the current case.
Interestingly, a recent study conducted by [
15] introduced a new predictive maintenance system for VRF systems. The system uses machine learning to predict refrigerant leaks and reduce downtime and energy costs. Similar to how machine learning is used in predictive maintenance for VRF systems, it can also be applied to optimise drying processes in construction sites. By analysing historical data on energy consumption, drying times, and environmental factors, machine learning models can predict potential energy savings and identify opportunities for improvement in drying room operations. For example, a machine learning model could predict the optimal drying time based on factors such as garment type, moisture content, and ambient temperature, leading to reduced energy consumption and improved efficiency.
2. Research Gap, Study Objective, and Significance of This Study
Nevertheless, all the identified and reviewed articles explored agricultural products and investigated clothes drying using tumble dryers, which investigated the potential to make the drying process more efficient; however, it is outside of the construction field context within which sits the current research that investigates better ways to optimise energy consumption in drying rooms. Since the process of drying clothes consumes a significant amount of energy [
16], no report on the energy consumption of drying construction garments exists to date in the UK. Hence the objective of the present study is to achieve the following:
Show the inefficiency of using fan heaters to dry construction garments.
Create a baseline computational model to assess and investigate the potential for energy savings and to ensure efficient functioning of the heating system.
Reduce energy costs and carbon emissions in construction sites in the UK.
This work is oriented (but not limited) to construction site drying.
The novelty of this study lies in its focus on optimising the energy efficiency of drying rooms in the construction industry, specifically in the UK. This research contributes to the field by means of the following:
Quantifying energy consumption: It provides a baseline measurement of energy usage in a traditional drying room, establishing a benchmark for comparison and improvement.
Developing a thermal model: The use of IESVE software allows for accurate prediction of energy consumption, enabling informed decision-making regarding energy-saving measures.
Testing alternative drying systems: This study compares various drying systems (dehumidifier, air mover, heater) to identify the most energy-efficient combination, offering practical solutions for industry professionals.
Analysing the impact of environmental factors: This research demonstrates the significant influence of humidity, air velocity, and temperature on drying time and energy consumption, providing valuable insights for future design and optimisation.
Overall, this study advances the field of construction energy efficiency by offering a data-driven approach to optimising drying processes and reducing environmental impact. The findings can be applied to improve the sustainability and cost-effectiveness of construction operations.
3. Methodology
This research was conducted at two sites: The first one was the whole drying room of Everton stadium construction site, and second one encompassed only one drying unit in Wincham site. The point of using two sites is that in the original case study, the stadium was in the phase of construction, and the drying room onsite had open access to the workforce; then, no experiments took place in there, and only temperature and humidity sensors were installed to identify the usage profile of the fan heaters (3 kW) in the drying room to be able to model it using IESVE software to predict the energy use onsite which would represent the baseline against which energy reduction interventions will be compared. IESVE tool was used to generate the building model and to run the thermal simulation since it is easy to manipulate and gives accurate calculation results at no cost; also in the context of the current study, it enables the user to investigate and compare between the different suggested energy conservation measures in a virtual environment and to evaluate their viability before opting for real implementation. In addition, there were no historical data on the energy consumption platform onsite that state the energy used by the drying room separately from the whole site cabin due to the combined electrical distribution. In addition, it includes an extensive database and a wide selection of different structural building components with various energy consumption profiles [
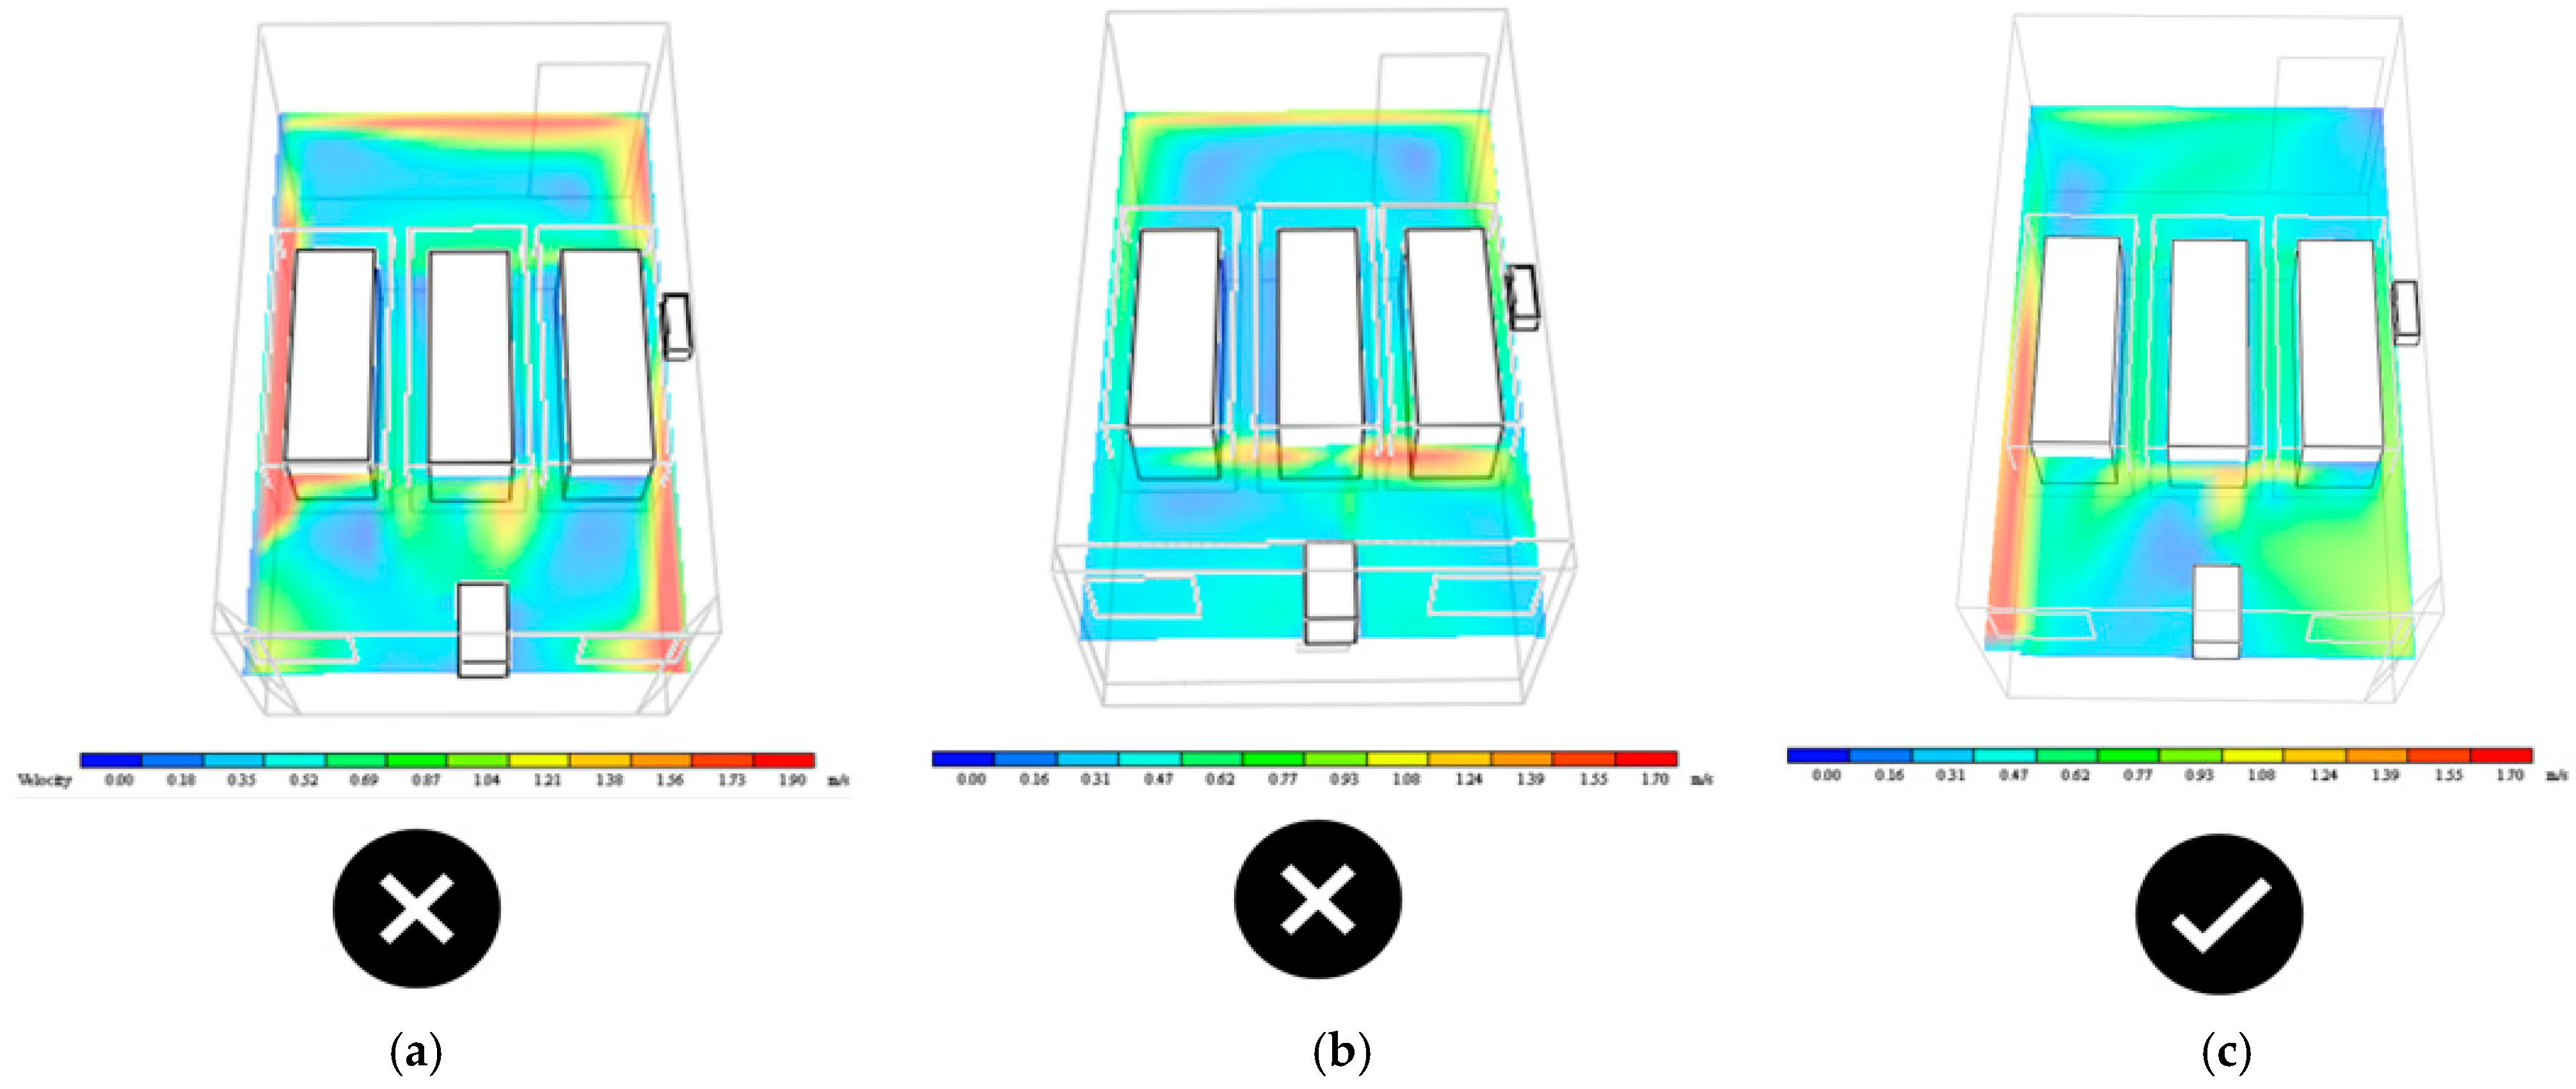
17]. CFD simulations were conducted to analyse air velocity, temperature, and moisture distribution in the room. This process helps identify optimal locations for different drying racks and system components. However, to be able to visualise real drying test results, CFD simulation on its own was not enough, as it is unable to determine the drying time of garments; hence, there was a need for a private drying room to test different drying scenarios other than only fan heaters that would reduce energy consumption; therefore, it has been resorted to the drying unit in Wincham, which was dedicated only for experimentation.
The dimensionless fraction of moisture in the fabric
WW is expressed by Equation (1):
where
mw is the mass of water (kg), and
mf is the mass of dry fabric (kg) [
18].
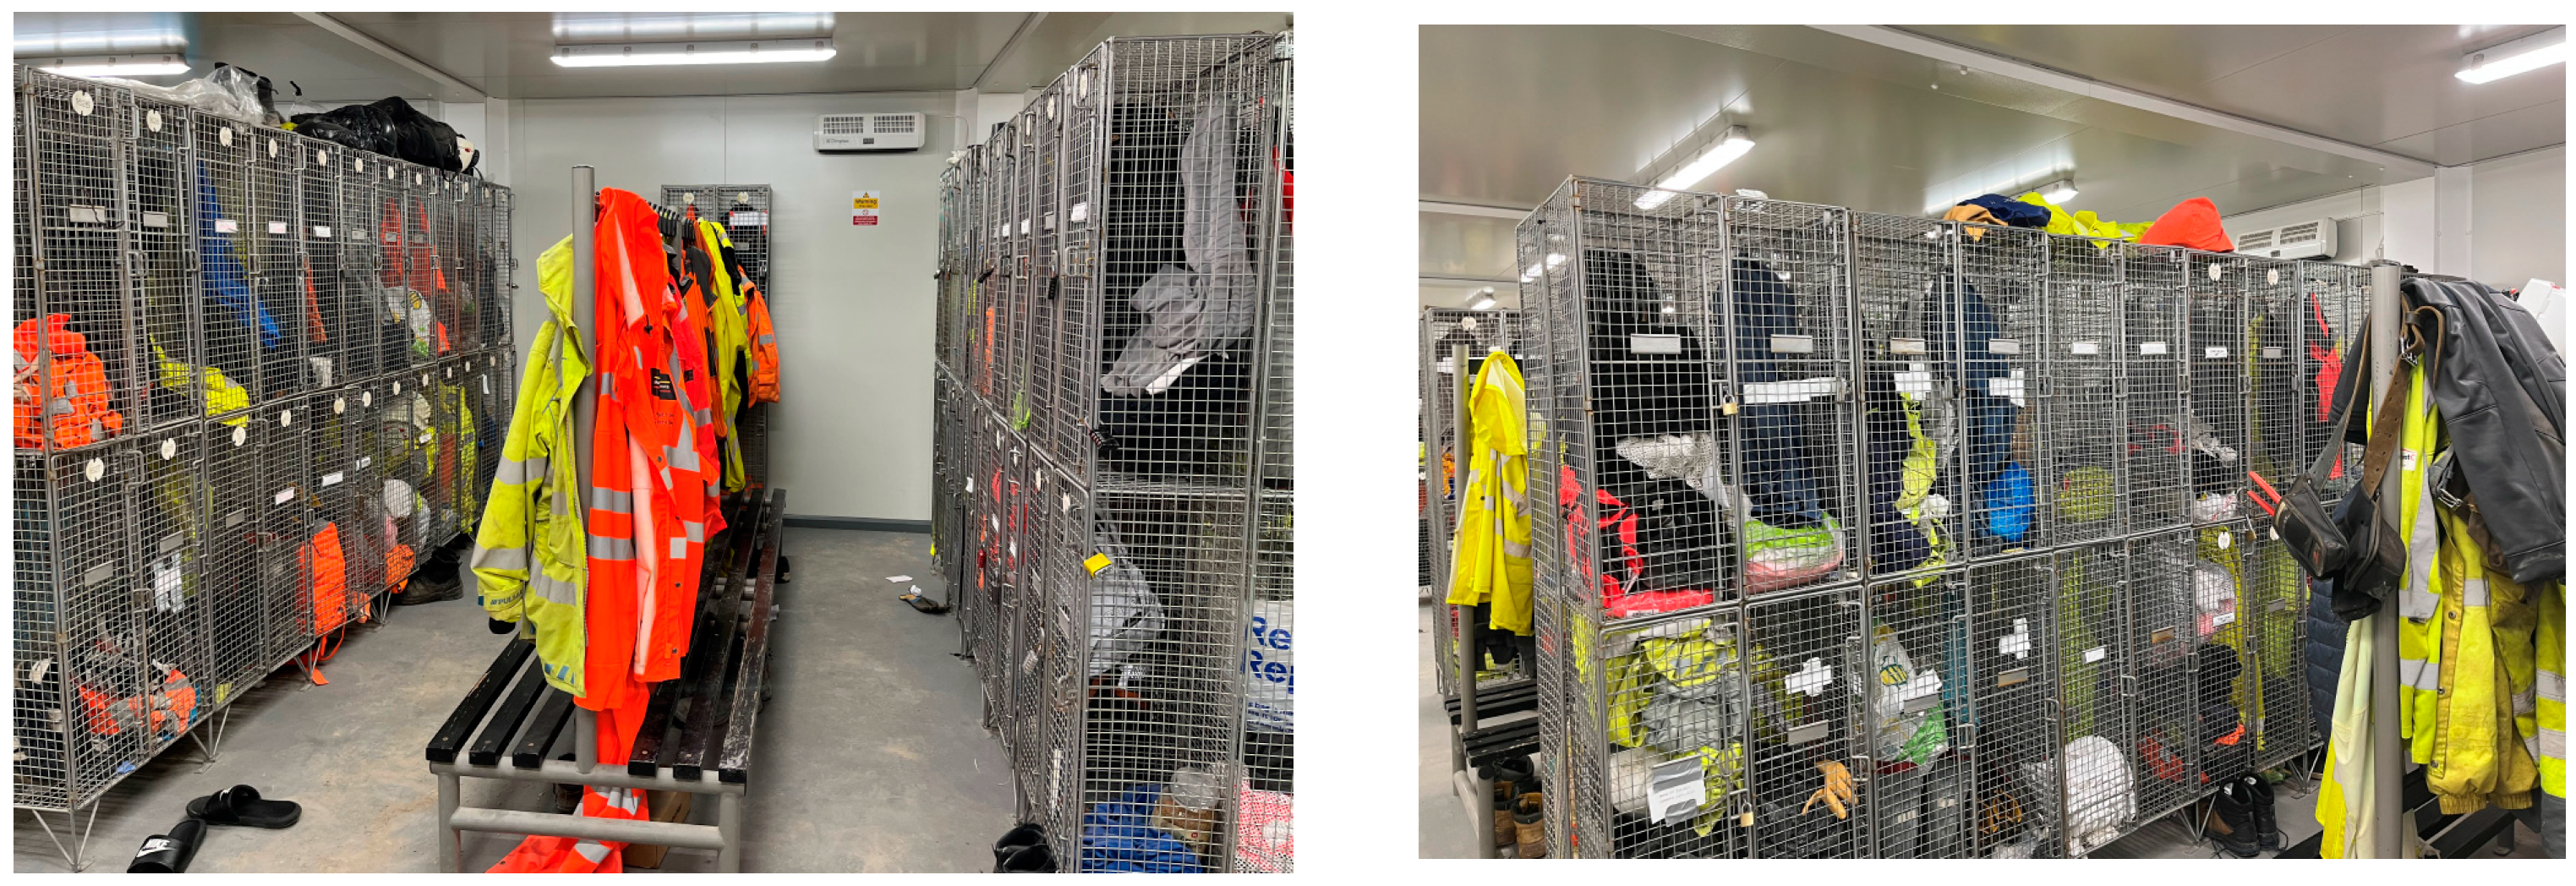
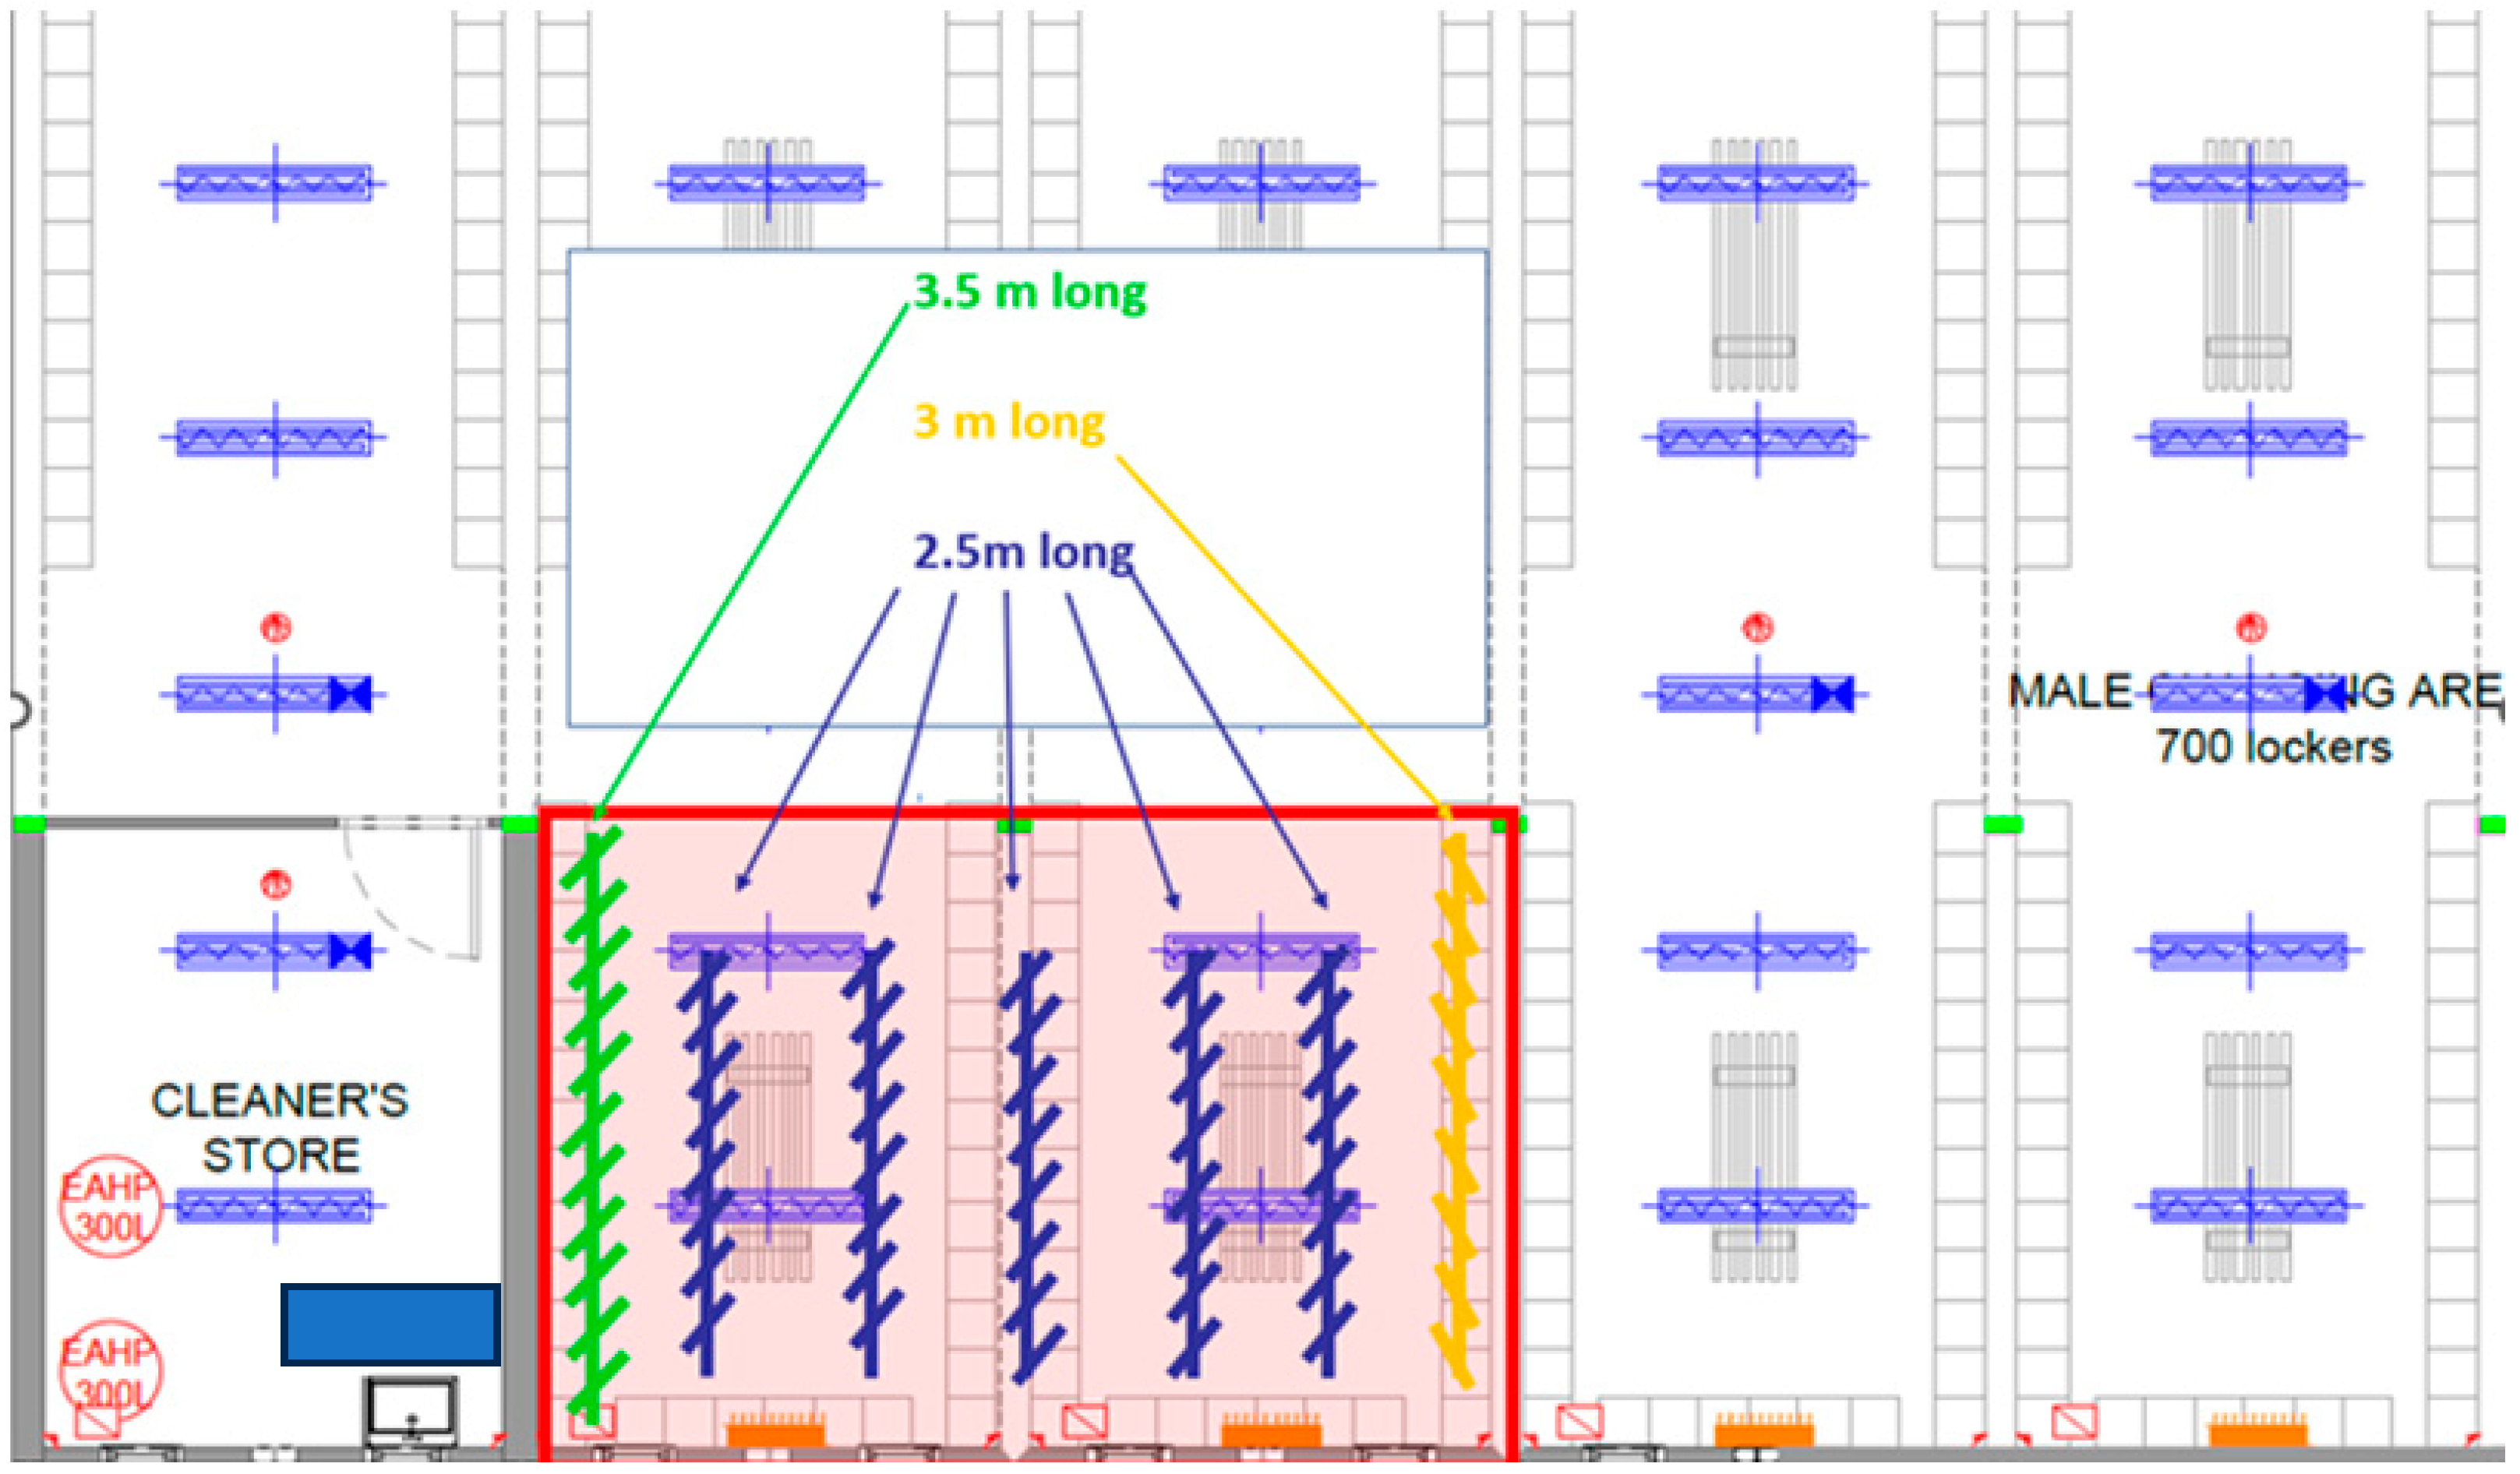
3.1. Experimental Setup and Materials for Everton Site Drying Room
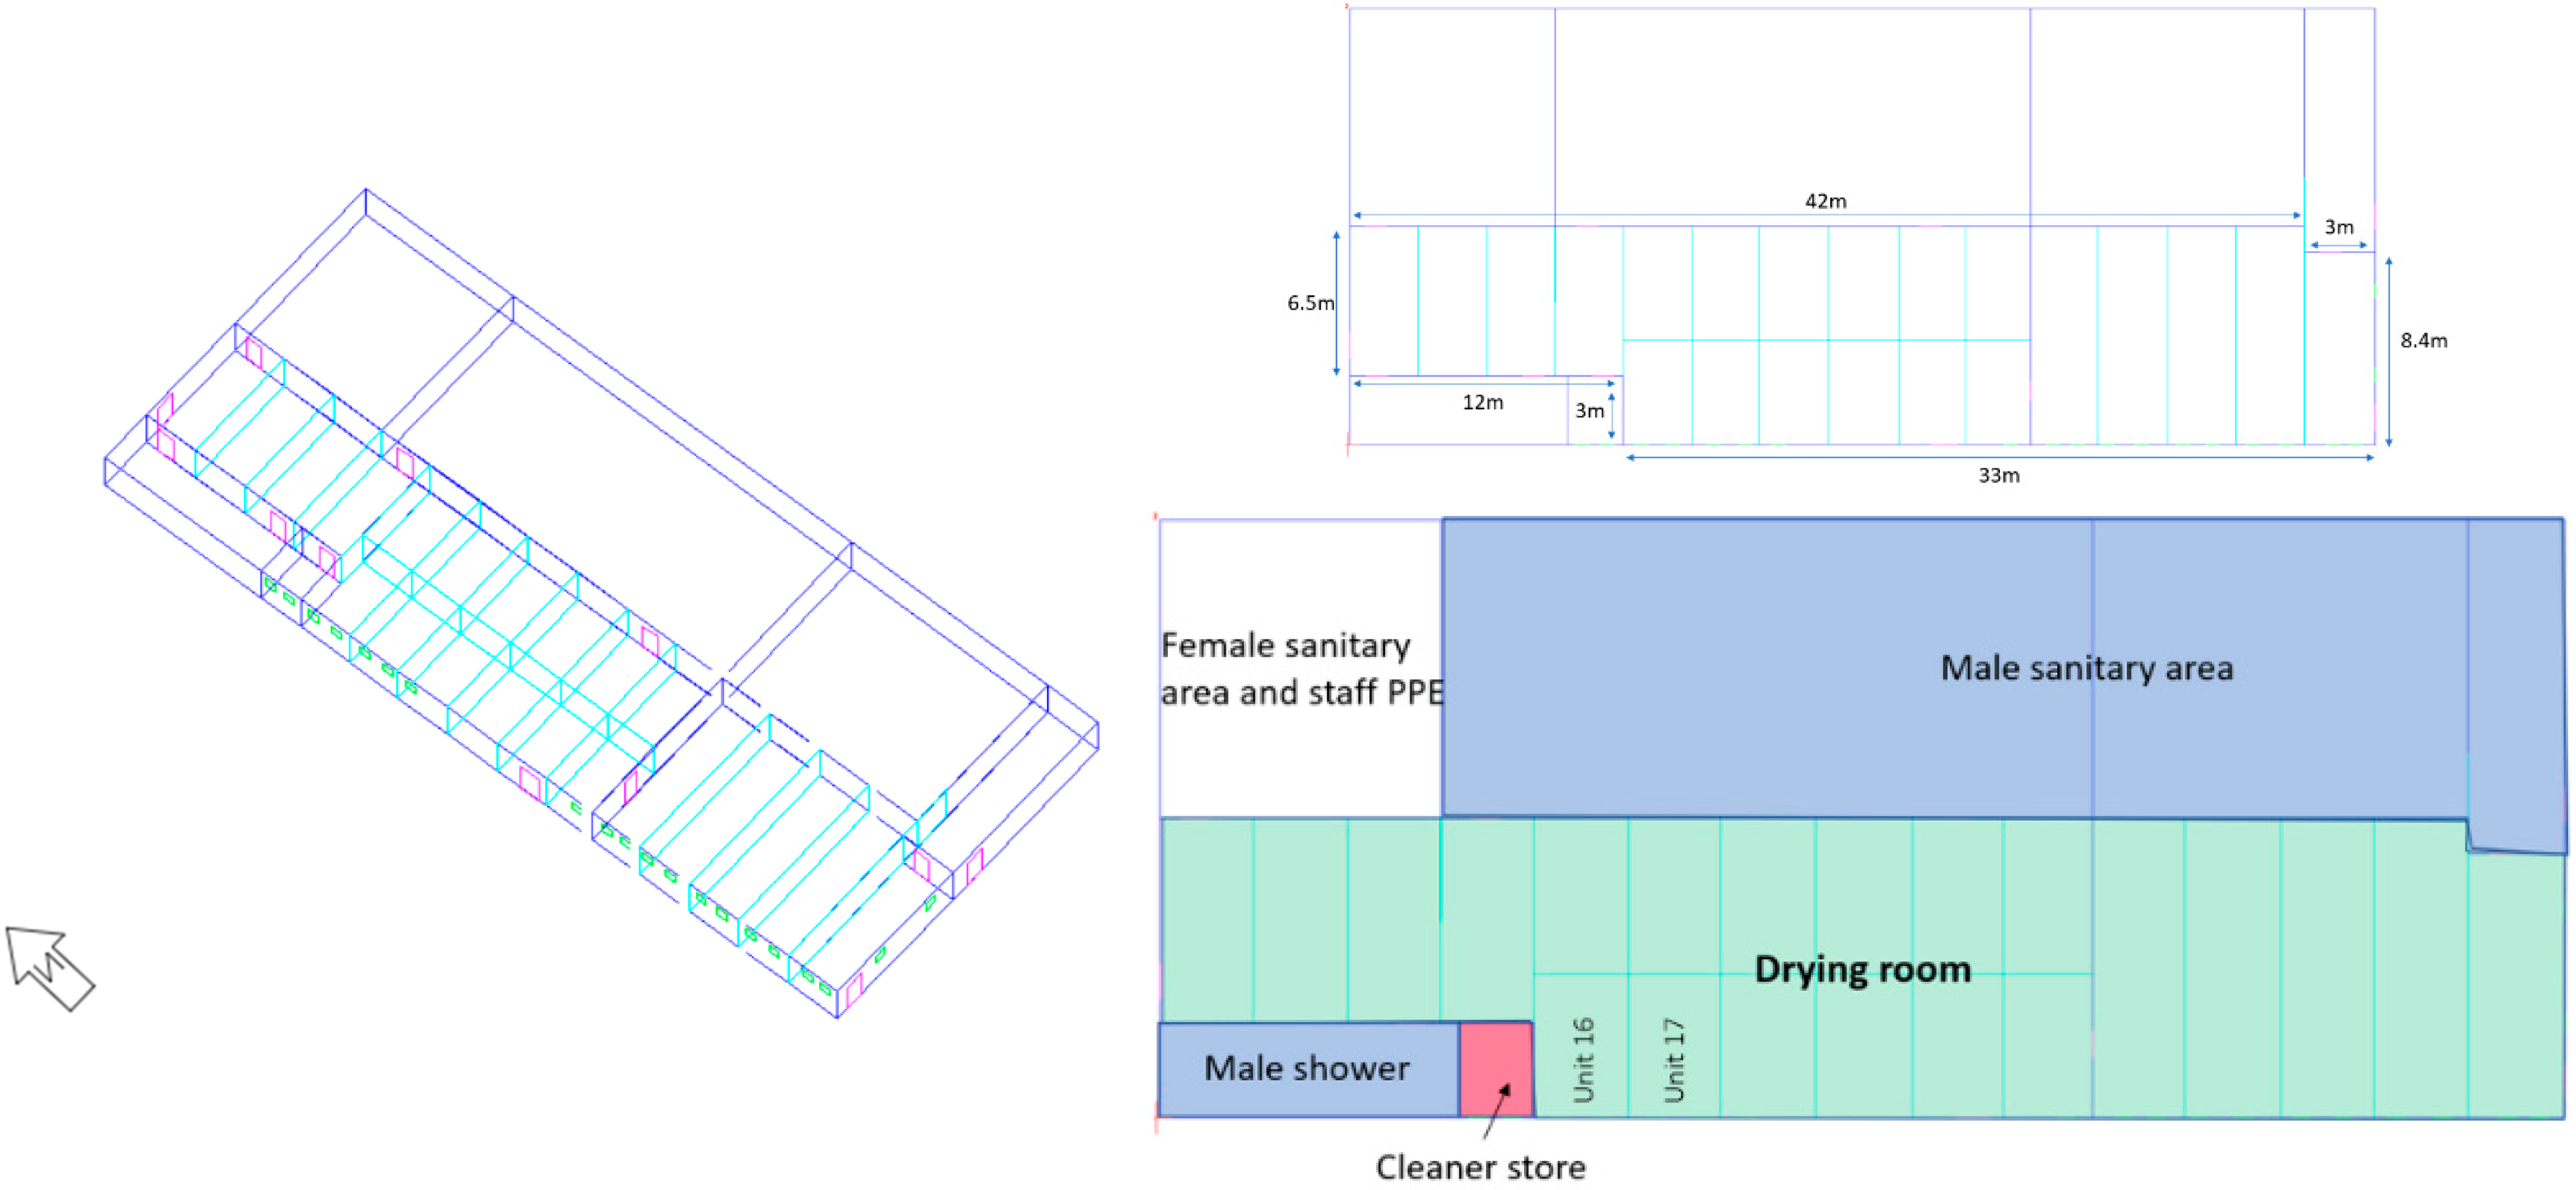
The Everton site drying room is located on the first floor; it contains 15 non-partitioned cabins, which are highlighted in green (
Figure 1) and surrounded by other spaces such as a male and female sanitary area, cleaner’s store, and male shower. The drying room, accommodating 700 lockers, currently doubles as a changing area and drying space. However, inefficient heating practices lead to unnecessary energy consumption. To remedy this, separating the drying room (
Figure 1) into drying space and changing area is proposed. This would confine heat to the drying area, with controlled access for hanging garments. Implementing automation for precise drying times could optimise energy usage and minimise waste. The modelled area is highlighted in green (
Figure 1). The drying room dimensions and construction materials reflecting the u-values have been provided in
Table 1 and
Table 2.
The type of heaters used in the simulation are local room heater-fanned, with a power of 3 kW and a set point temperature of 30 °C, as this is the temperature setpoint selected in the thermostat.
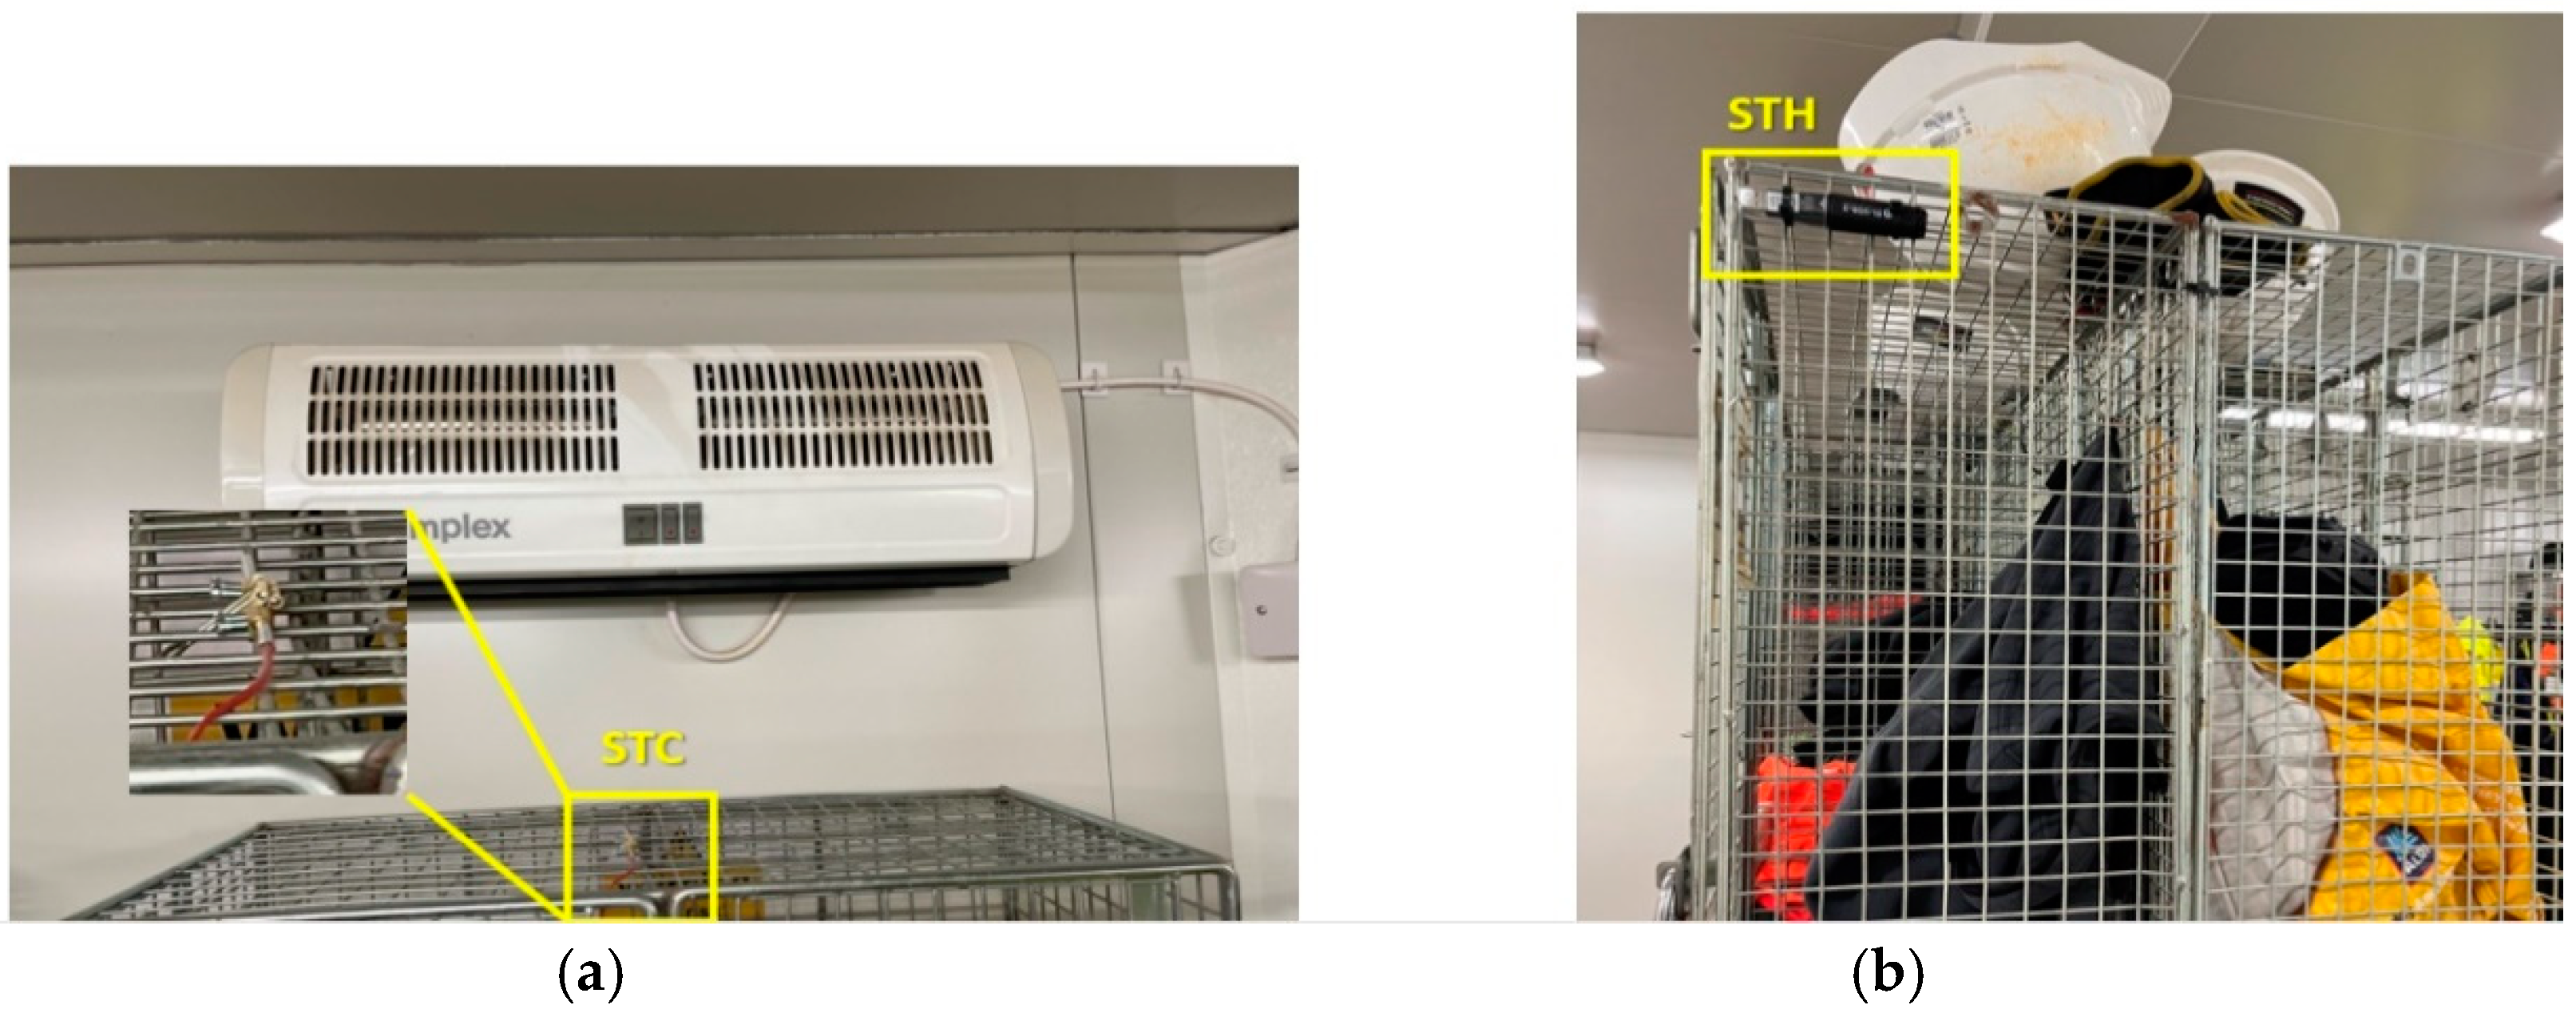
There are two types of sensors installed in the drying room: Lascar EL-USB-1, Temperature Data Logger (STC) and LASCAR Temperature and Humidity USB Data Logger—EL-USB-2 (STH), as shown in the images (
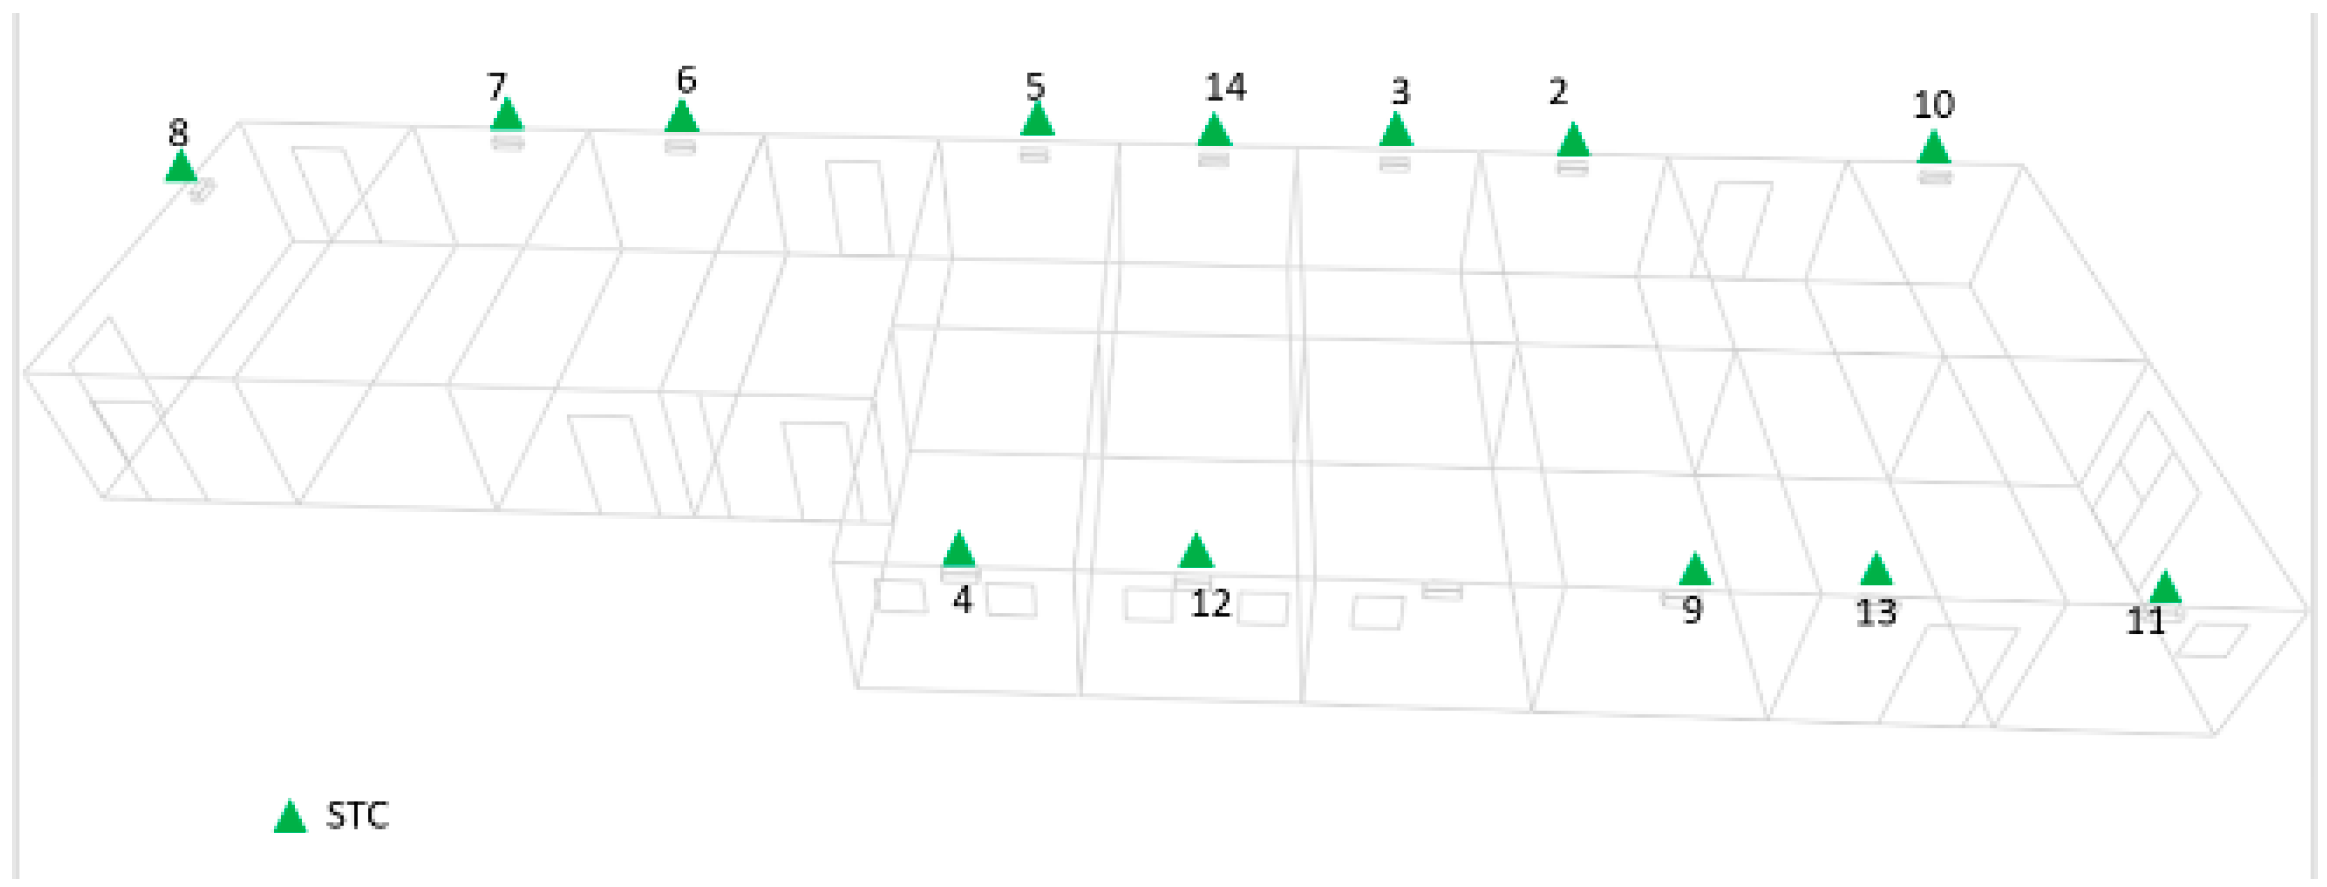
Figure 2a,b). These sensors measure and store relative humidity and temperature readings and offer user-settable logging rates, start-times, and alarms, allowing for humidity, temperature, and dewpoint data to be graphed and printed via a PC USB port and free-to-use easylog USB 7.6 software. STCs are connected to thermocouples and are placed just in front of the supply grill of each fan heater to measure temperature (see
Figure 3). The primary purpose of these sensors was to monitor the operation profile of all the heaters from the temperature variation graph.
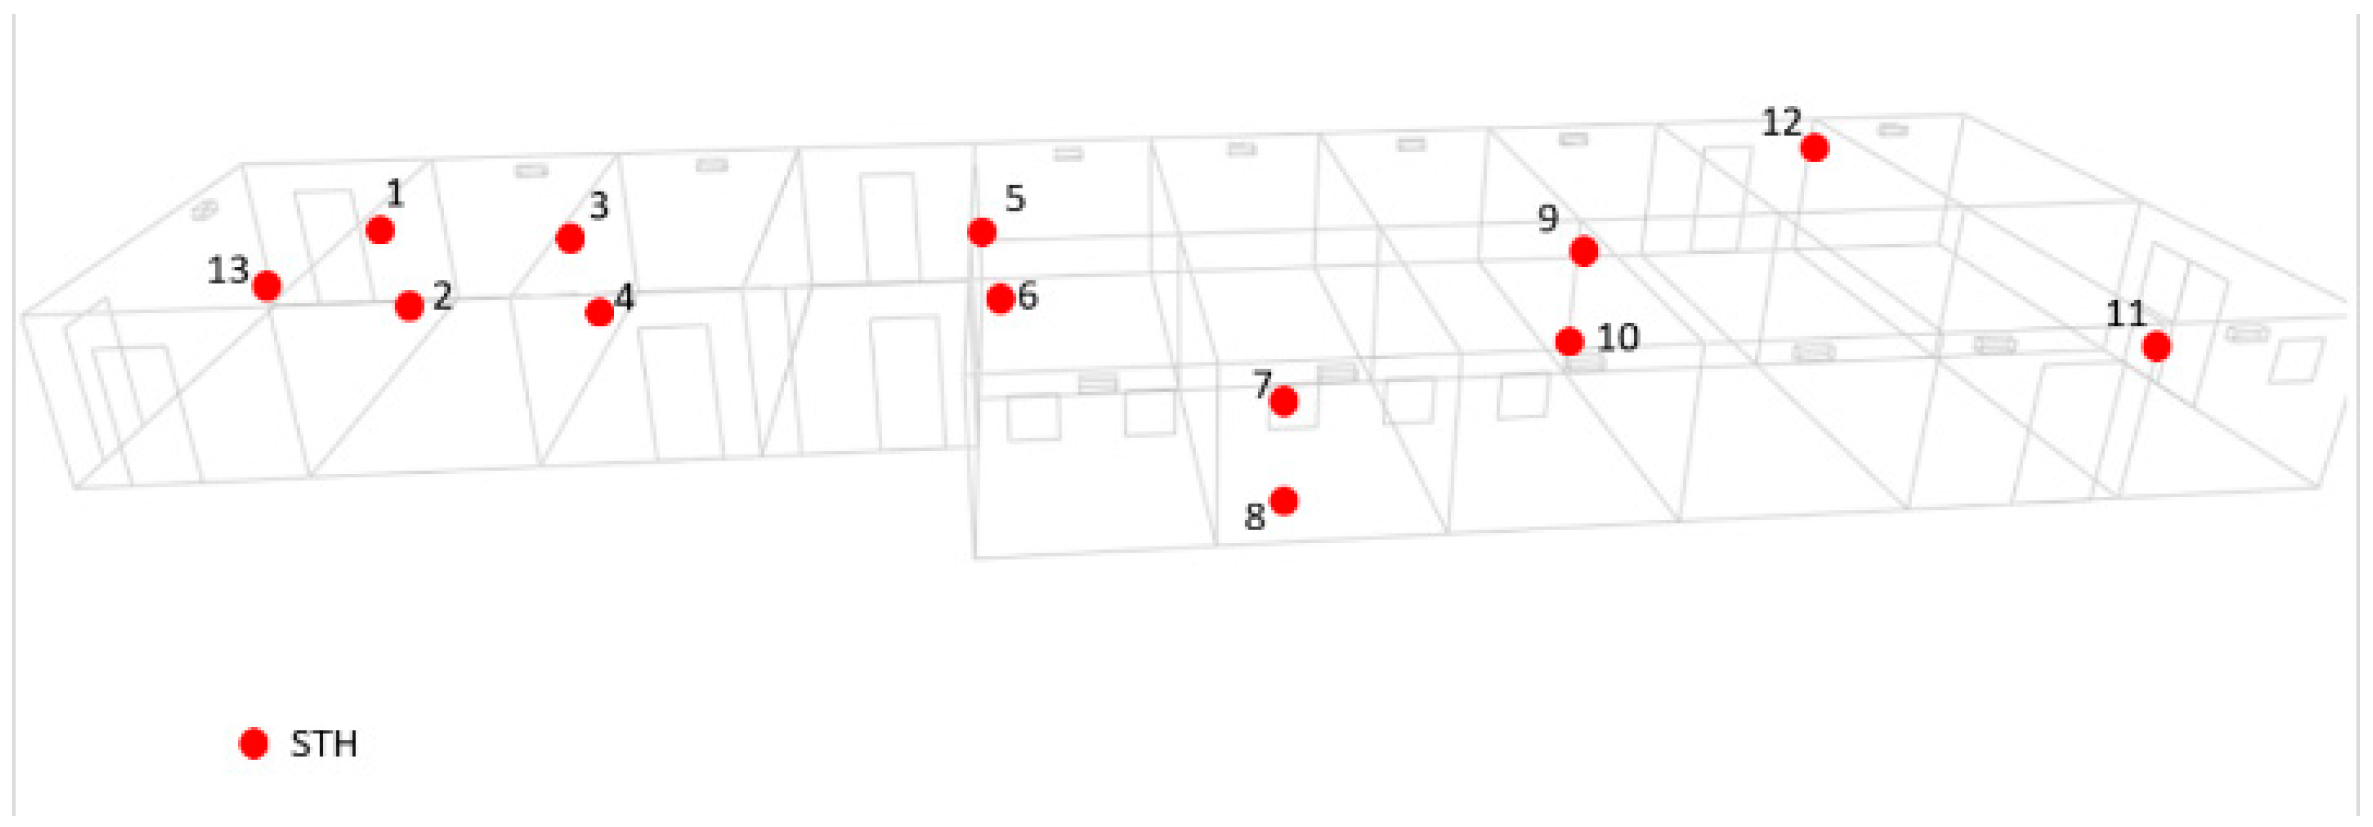
STH sensors are installed on and inside lockers in different locations in the room (
Figure 4). These sensors measure temperature and humidity in the drying room; sensors 1, 3, 5, 7, 9, 12, 11, 13 are installed at a height of 1 m, and the remaining sensors 2, 4, 6, 8, 10 are at 1.98 m from ground level. Placing sensors at different heights and locations permits us to know the temperature and humidity distribution in the room.
3.2. Thermal Model and Calibration (Everton Site)
The model was constructed based on the dimensions of the drying room (
Table 1), followed by the creation of a construction template utilising the materials listed in
Table 2. Subsequently, the thermal template was developed using the temperature profile derived from sensor data, as illustrated in
Figure 3. Additionally, all internal gains of the room (as listed in
Table 3), air infiltration, microflow openings (as specified in
Table 4), and adjacent conditions (as outlined below in this section) were incorporated into the model.
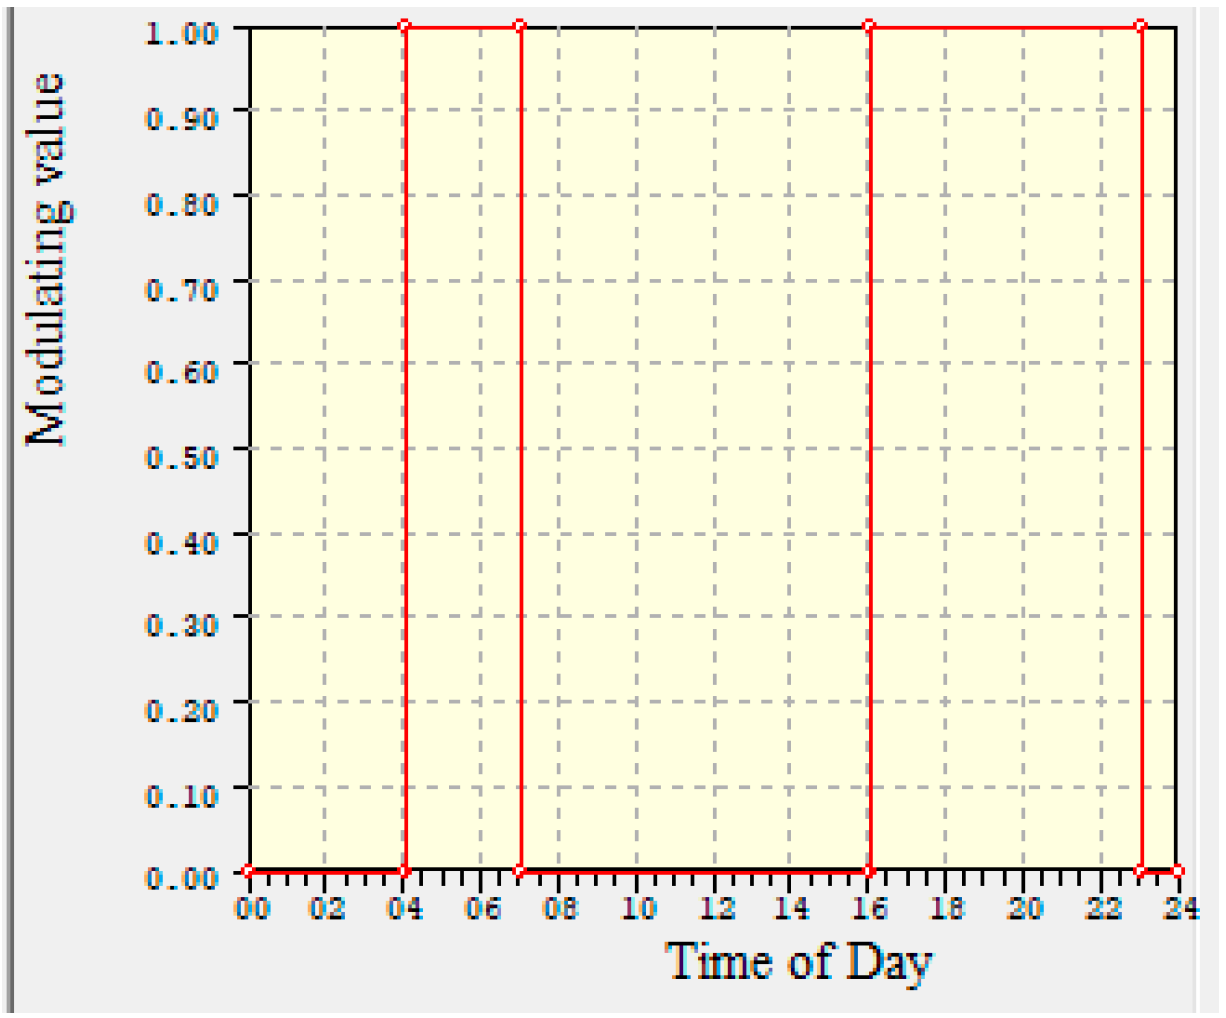
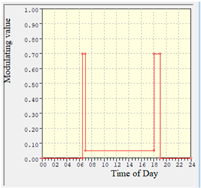
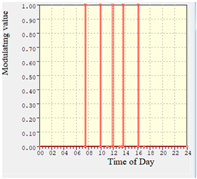
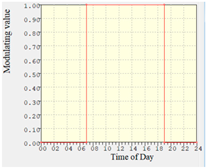
To accurately forecast the average heating load within the building and calibrate the model based on actual performance, an extensive analysis of data from temperature and humidity sensors was conducted. The challenge arose in delineating the specific profile followed by each heater, as these profiles exhibited variations from one heater to another. Additionally, the weekly profiles for a given heater displayed fluctuations throughout the month, complicating the calibration process. To streamline this calibration effort, a pragmatic approach was adopted, identifying the most frequently recurring profile in the drying room across multiple heaters. This predominant profile indicated that the heaters were consistently switched on from 4 to 7 am and from 4 to 11 pm on weekdays. December and January data were used to calibrate the model (refer to
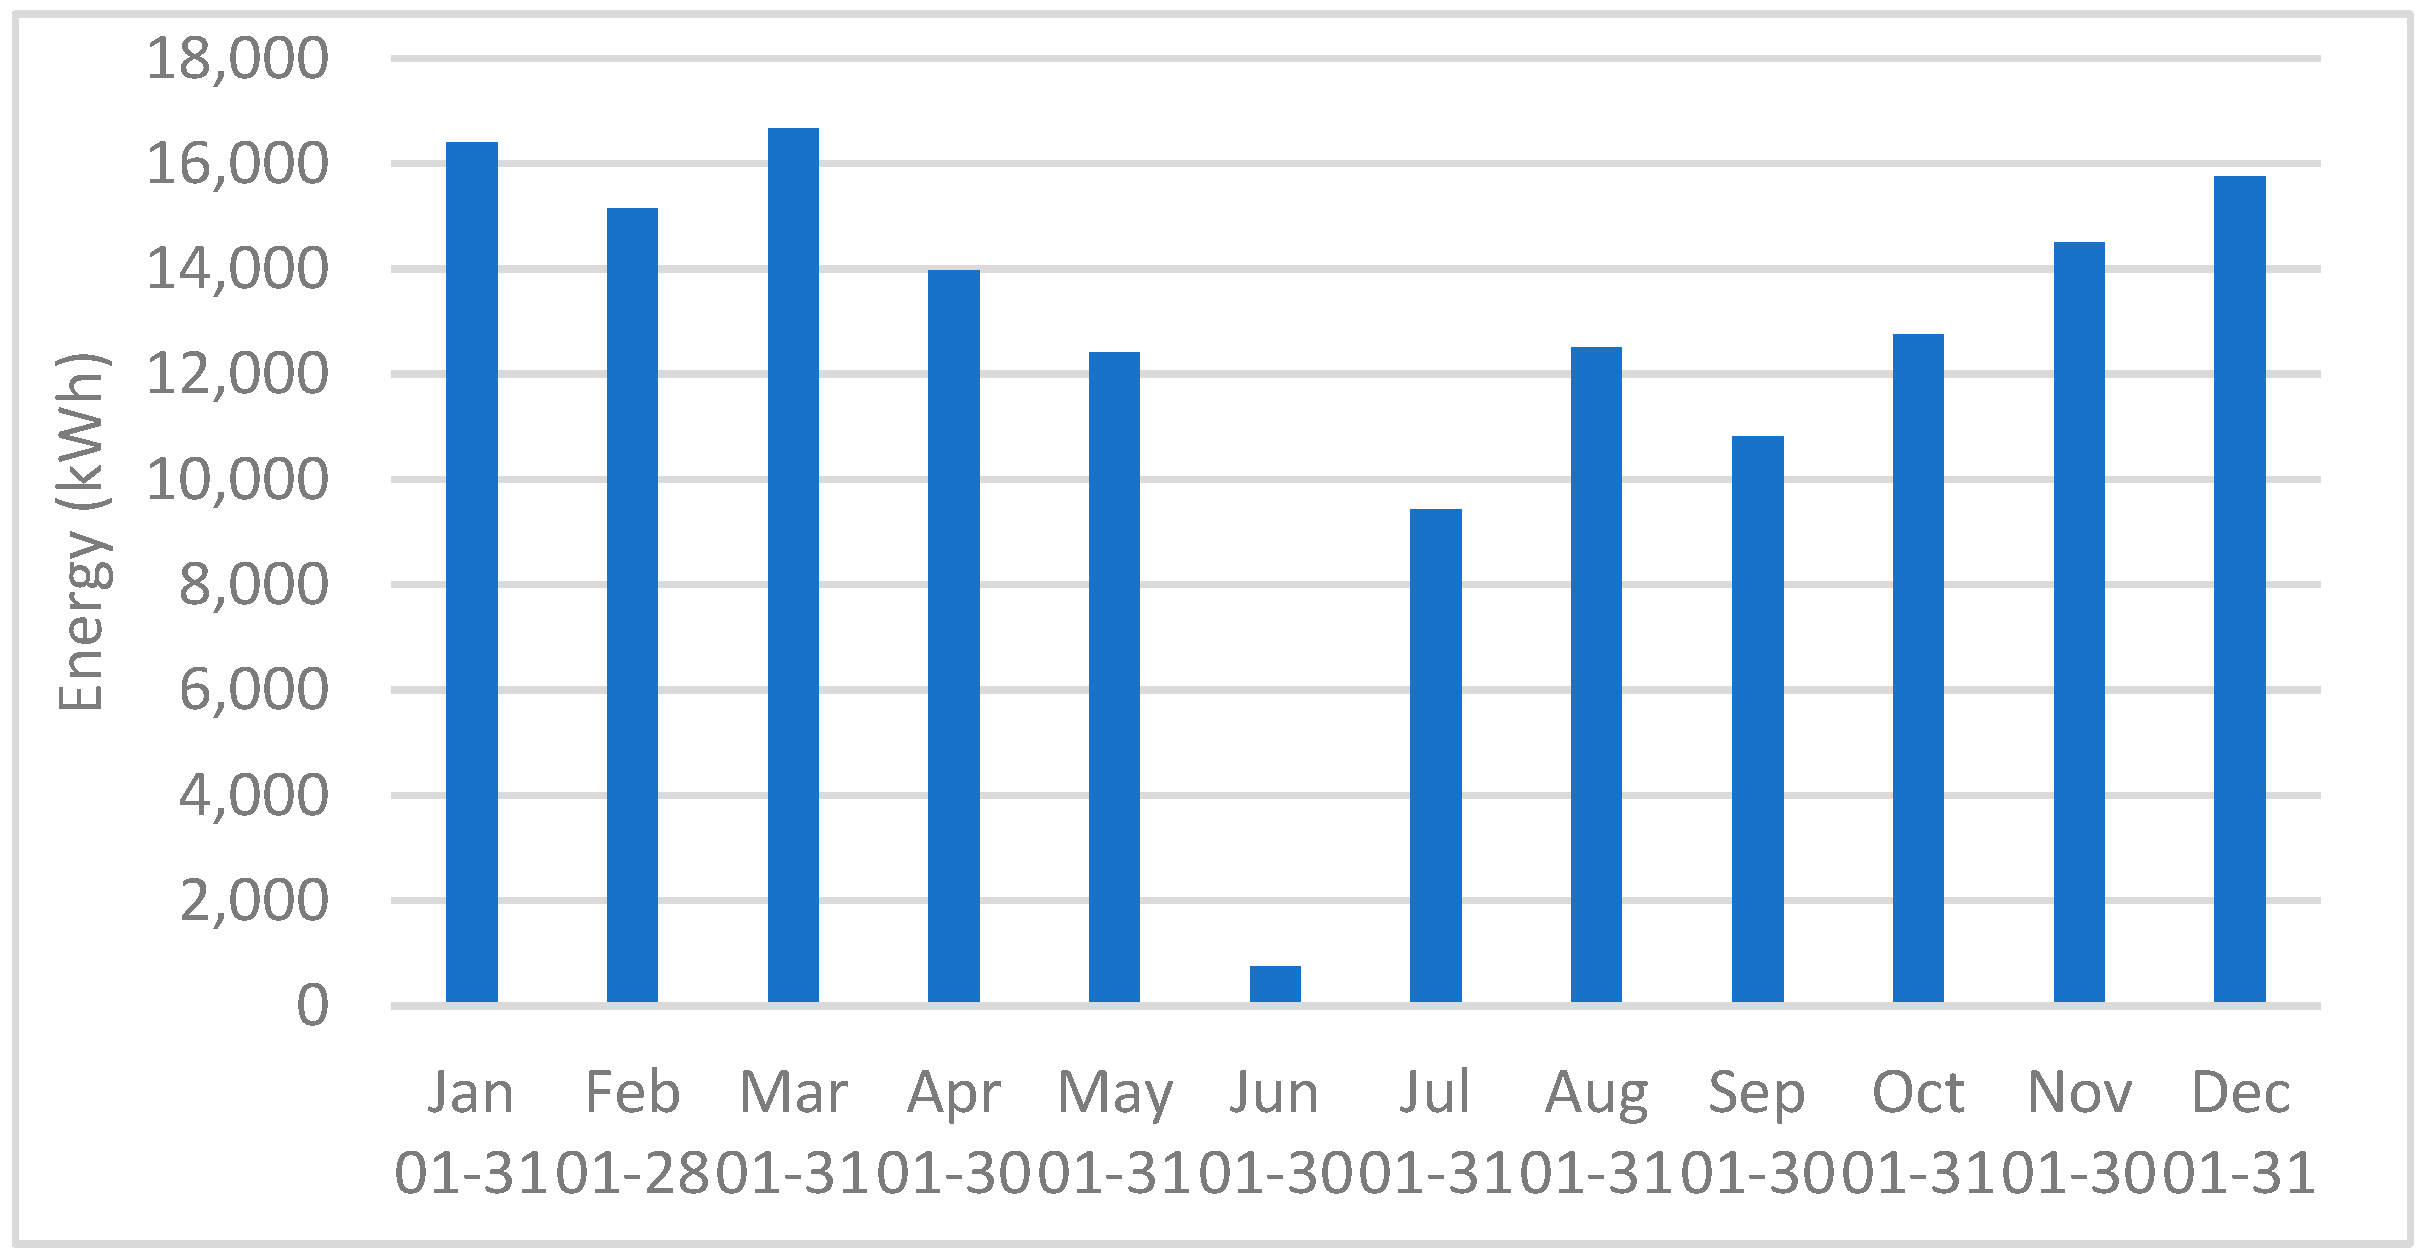
Figure 5), as this is the only dataset that was available then, with a designated “OFF” period during weekends. Noteworthy is the exception in June, during which the system was always inactive due to the absence of recorded rainfall in that particular month. In addition, lighting and extractor consumption were included in the simulation.
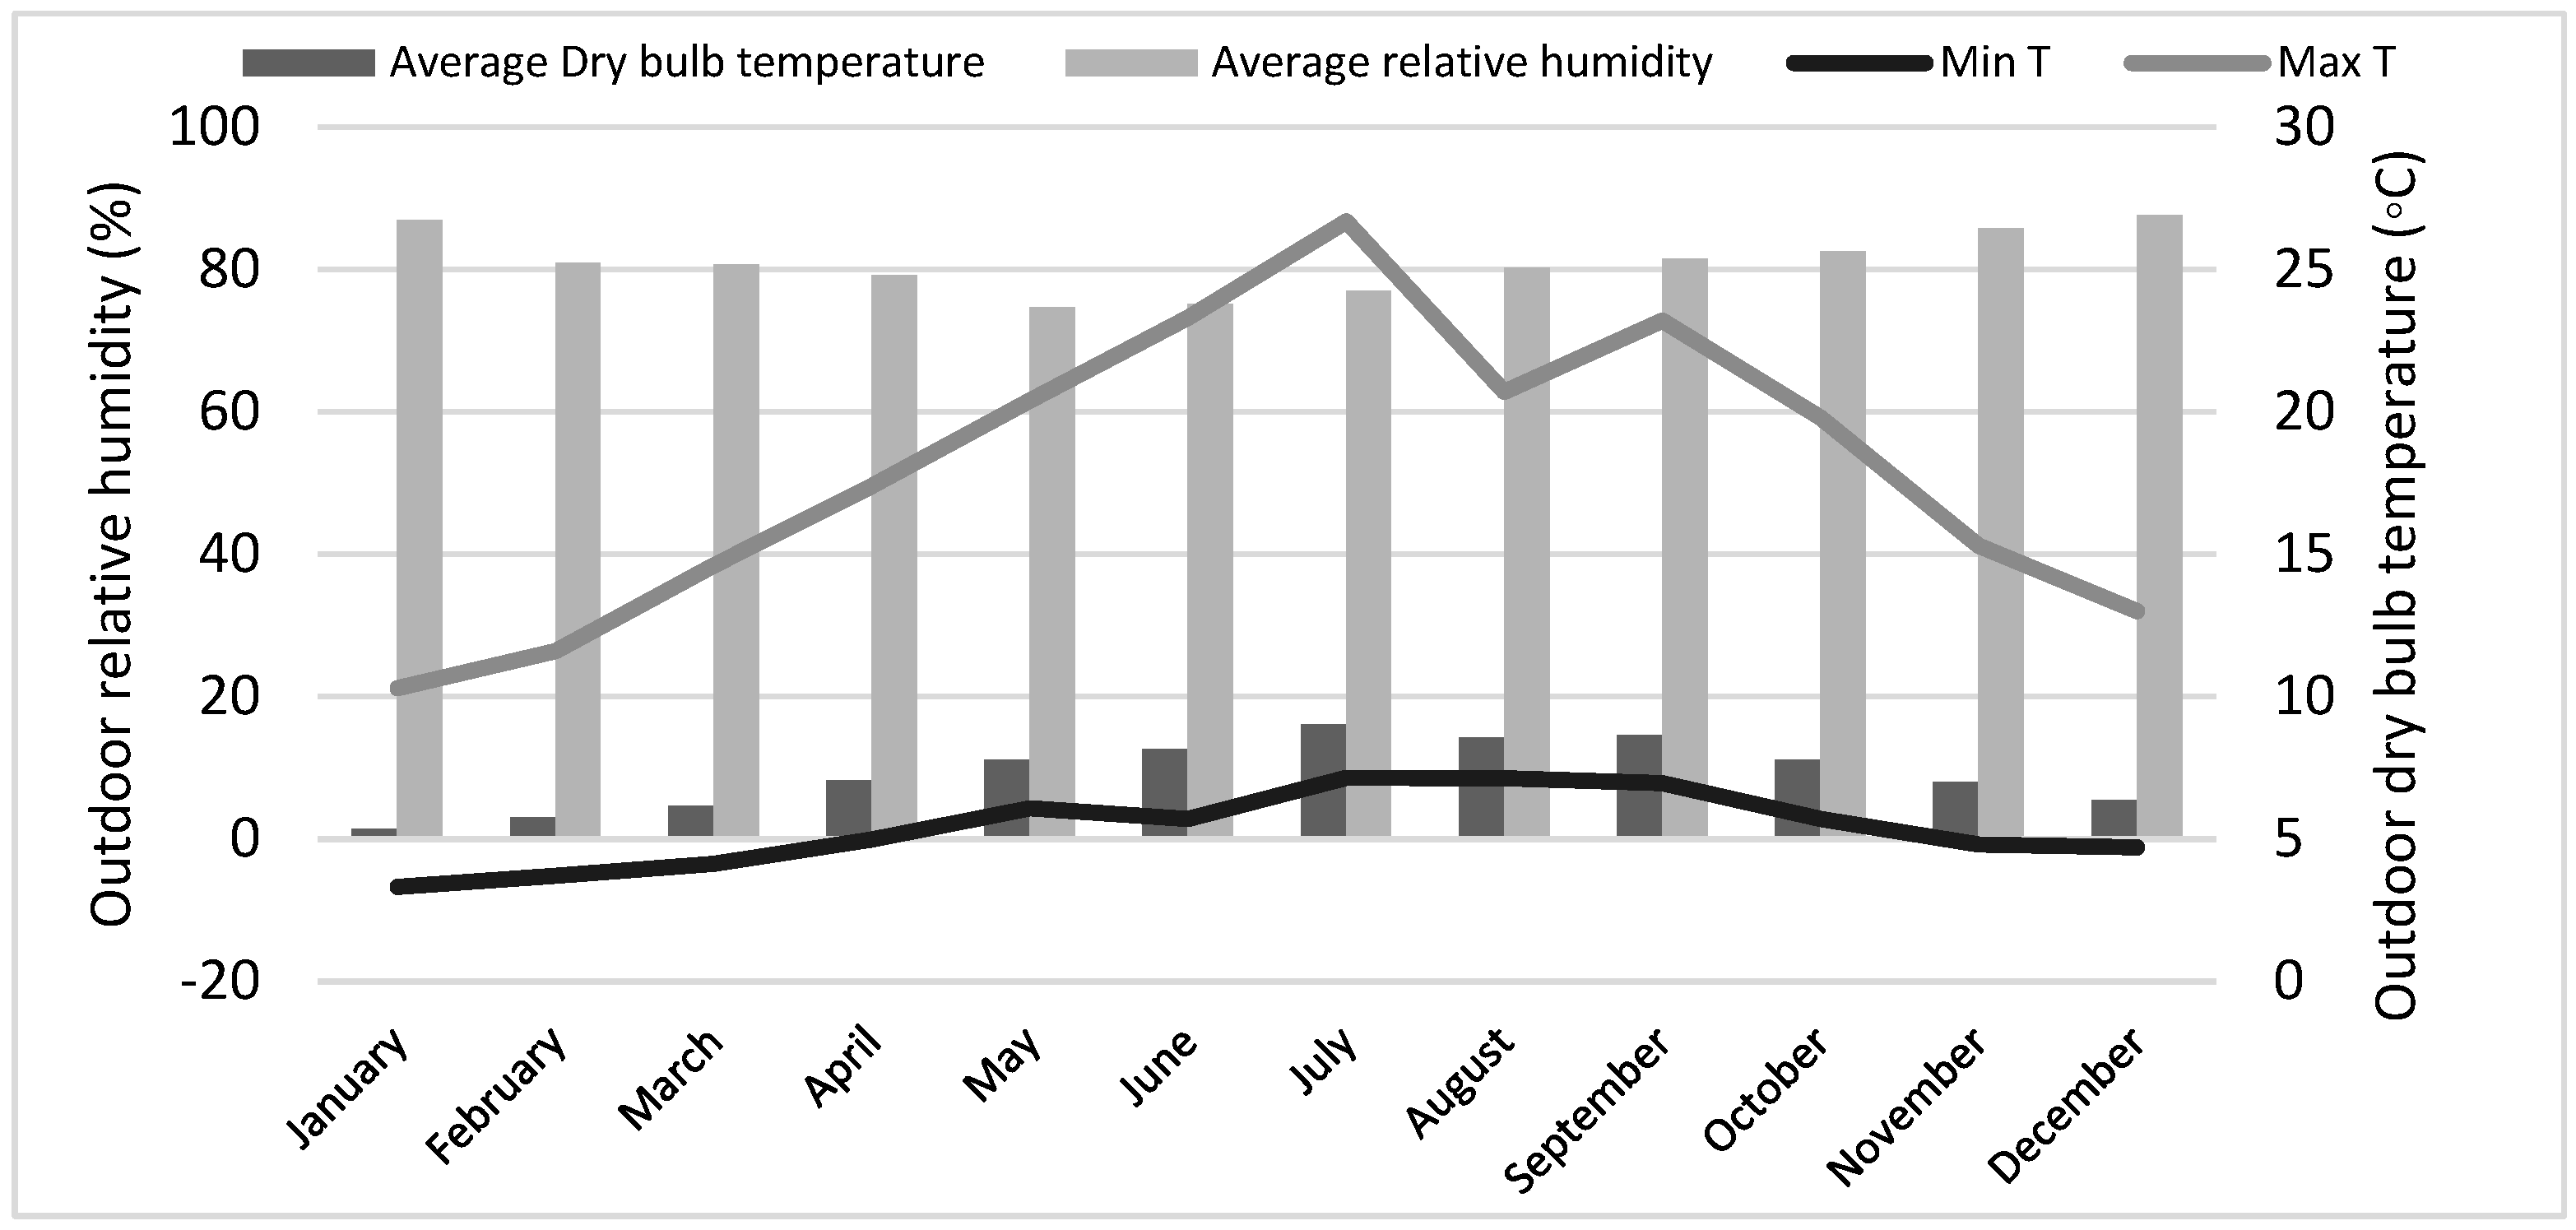
The weather file used is Liverpool John Lennon United Kingdom, which contains historical weather data of the nearest site to Everton (17 km from Everton) already stored in the software library.
Figure 6 shows John Lennon’s monthly maximum, minimum, and average outdoor air dry bulb temperatures along with RH. It is evident that Liverpool experiences extreme temperature fluctuations that range from +27 °C in summer to −7 °C in winter during the year (according to IES weather data), and typically, heaters run at the end of the day shift from (4–11 p.m.) with another boost early in the morning before the shift from 4–7 a.m. (
Figure 5). In addition, in Liverpool, rain is not restricted to winter; it could rain throughout all four seasons even in summer, which increases the energy bill. Consequently, the fan heaters used for drying purposes will run for a long time assumed to be 9 h to dry construction work garments.
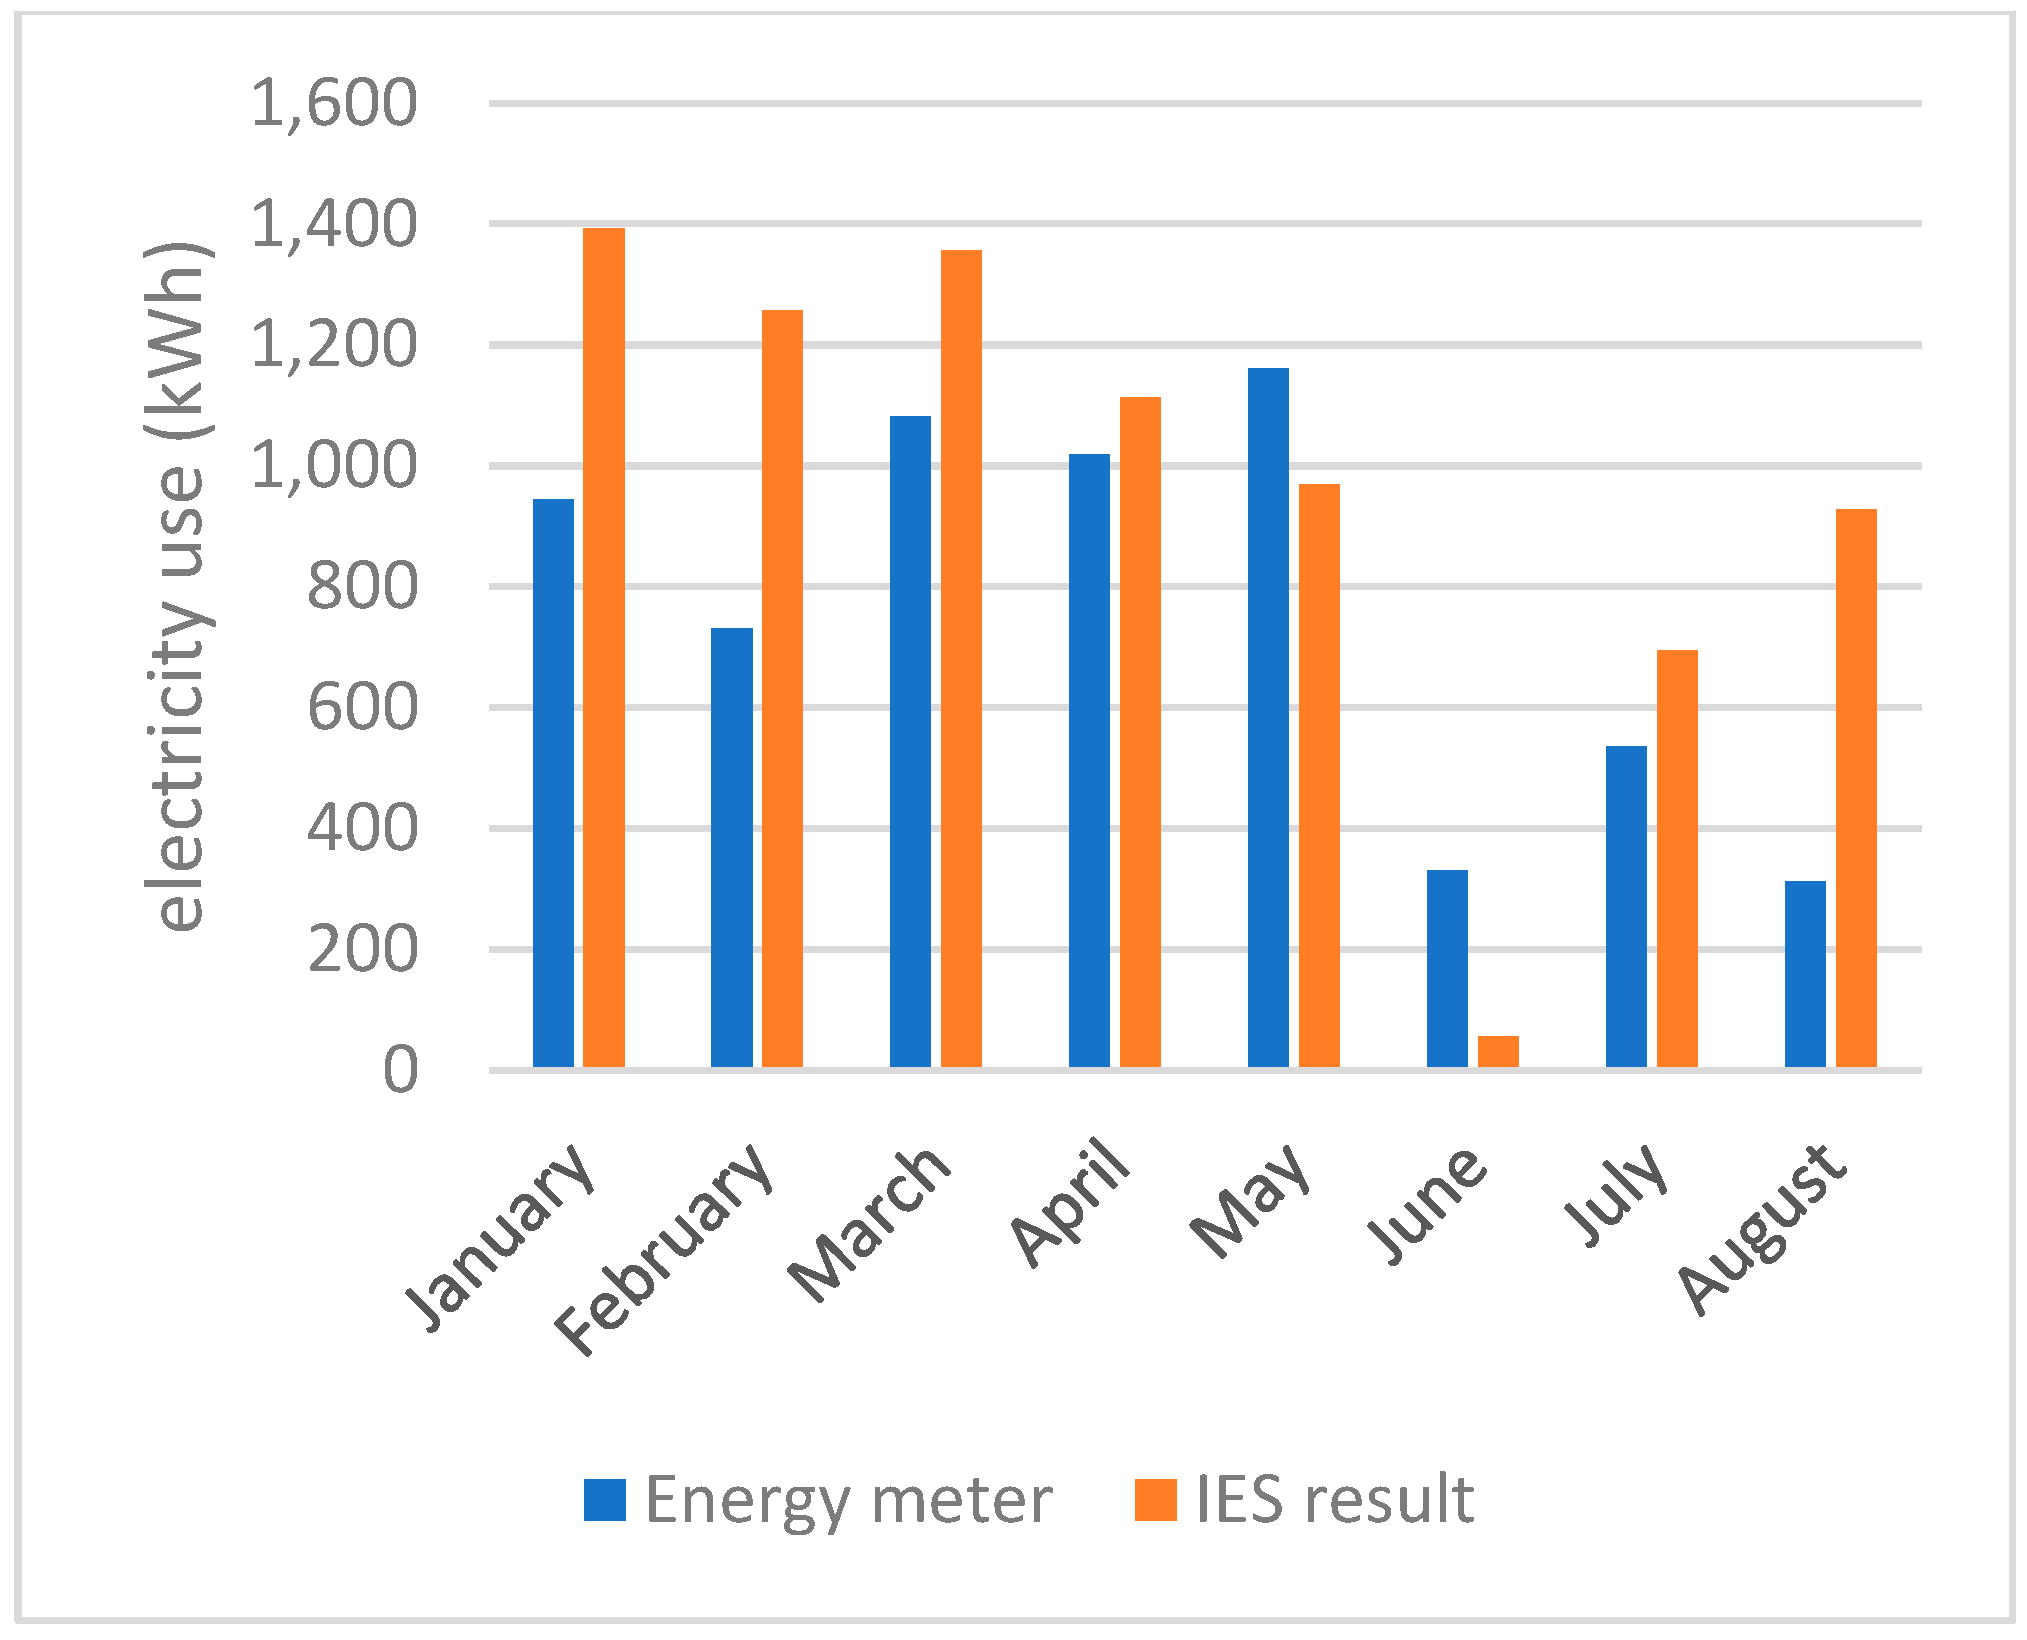
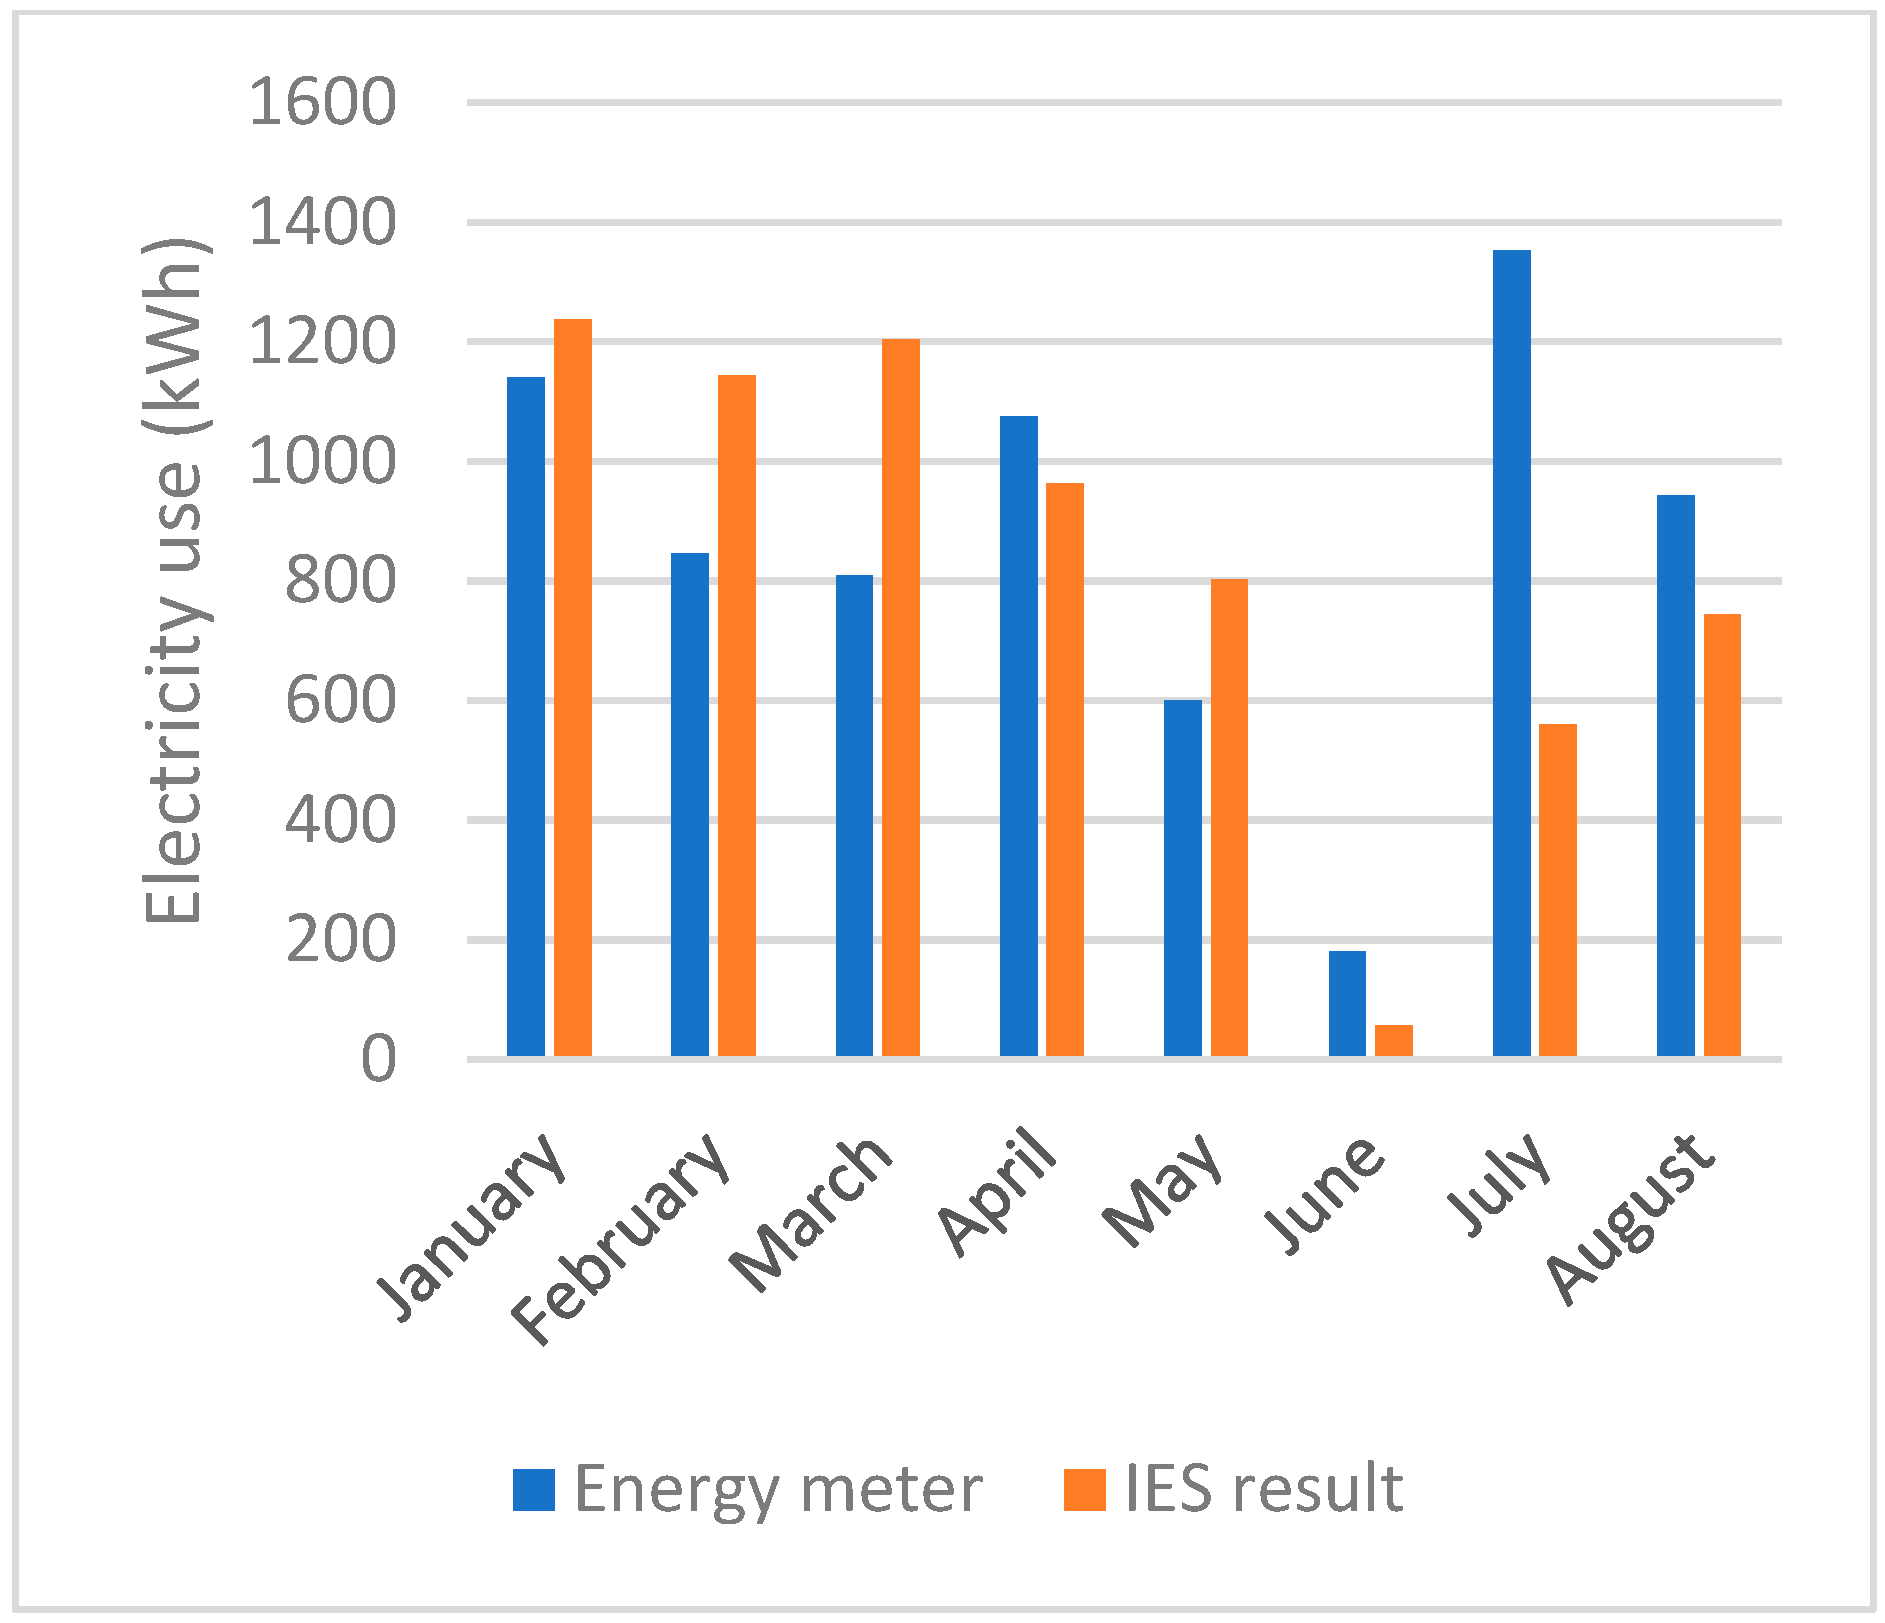
The calibration process involved a meticulous examination that extended to a comparative analysis of the actual monthly energy consumption of the drying room, derived from the readings of the energy meter installed in two units adjacent to the cleaner store on the right (as depicted in
Figure 1). This energy meter was strategically placed to monitor and record the comprehensive usage of energy. The available monthly data spans from January through August, providing a comprehensive temporal scope for the calibration endeavour. The calibration was not solely reliant on real-time data but also incorporated results from IES simulations, a critical aspect of this calibration process. The simulation results were generated under the consideration that the windows were open for half of the daily duration. This nuanced approach acknowledges the practical scenario that windows are not constantly open and aligns with the realistic conditions of not maximising heating needs at all times. The integration of these diverse data sources and simulation parameters enriched the calibration methodology, ensuring a comprehensive and accurate refinement of the model to enhance its predictive capabilities.
To take into consideration the impact of heat exchange between the drying room and adjacent units and floors, it is important to set fixed or profile temperatures for the adjacencies, which are as follows:
The adjacent rooms to the main area have specific temperature settings. The floor and ceiling are maintained at a constant temperature of 21 °C, ensuring optimal human comfort. Additionally, rooms located near the drying room, including showers, the cleaner’s store, and other units, are kept at a higher temperature of 25 °C. This is due to the presence of heat pumps in the cleaner’s store.
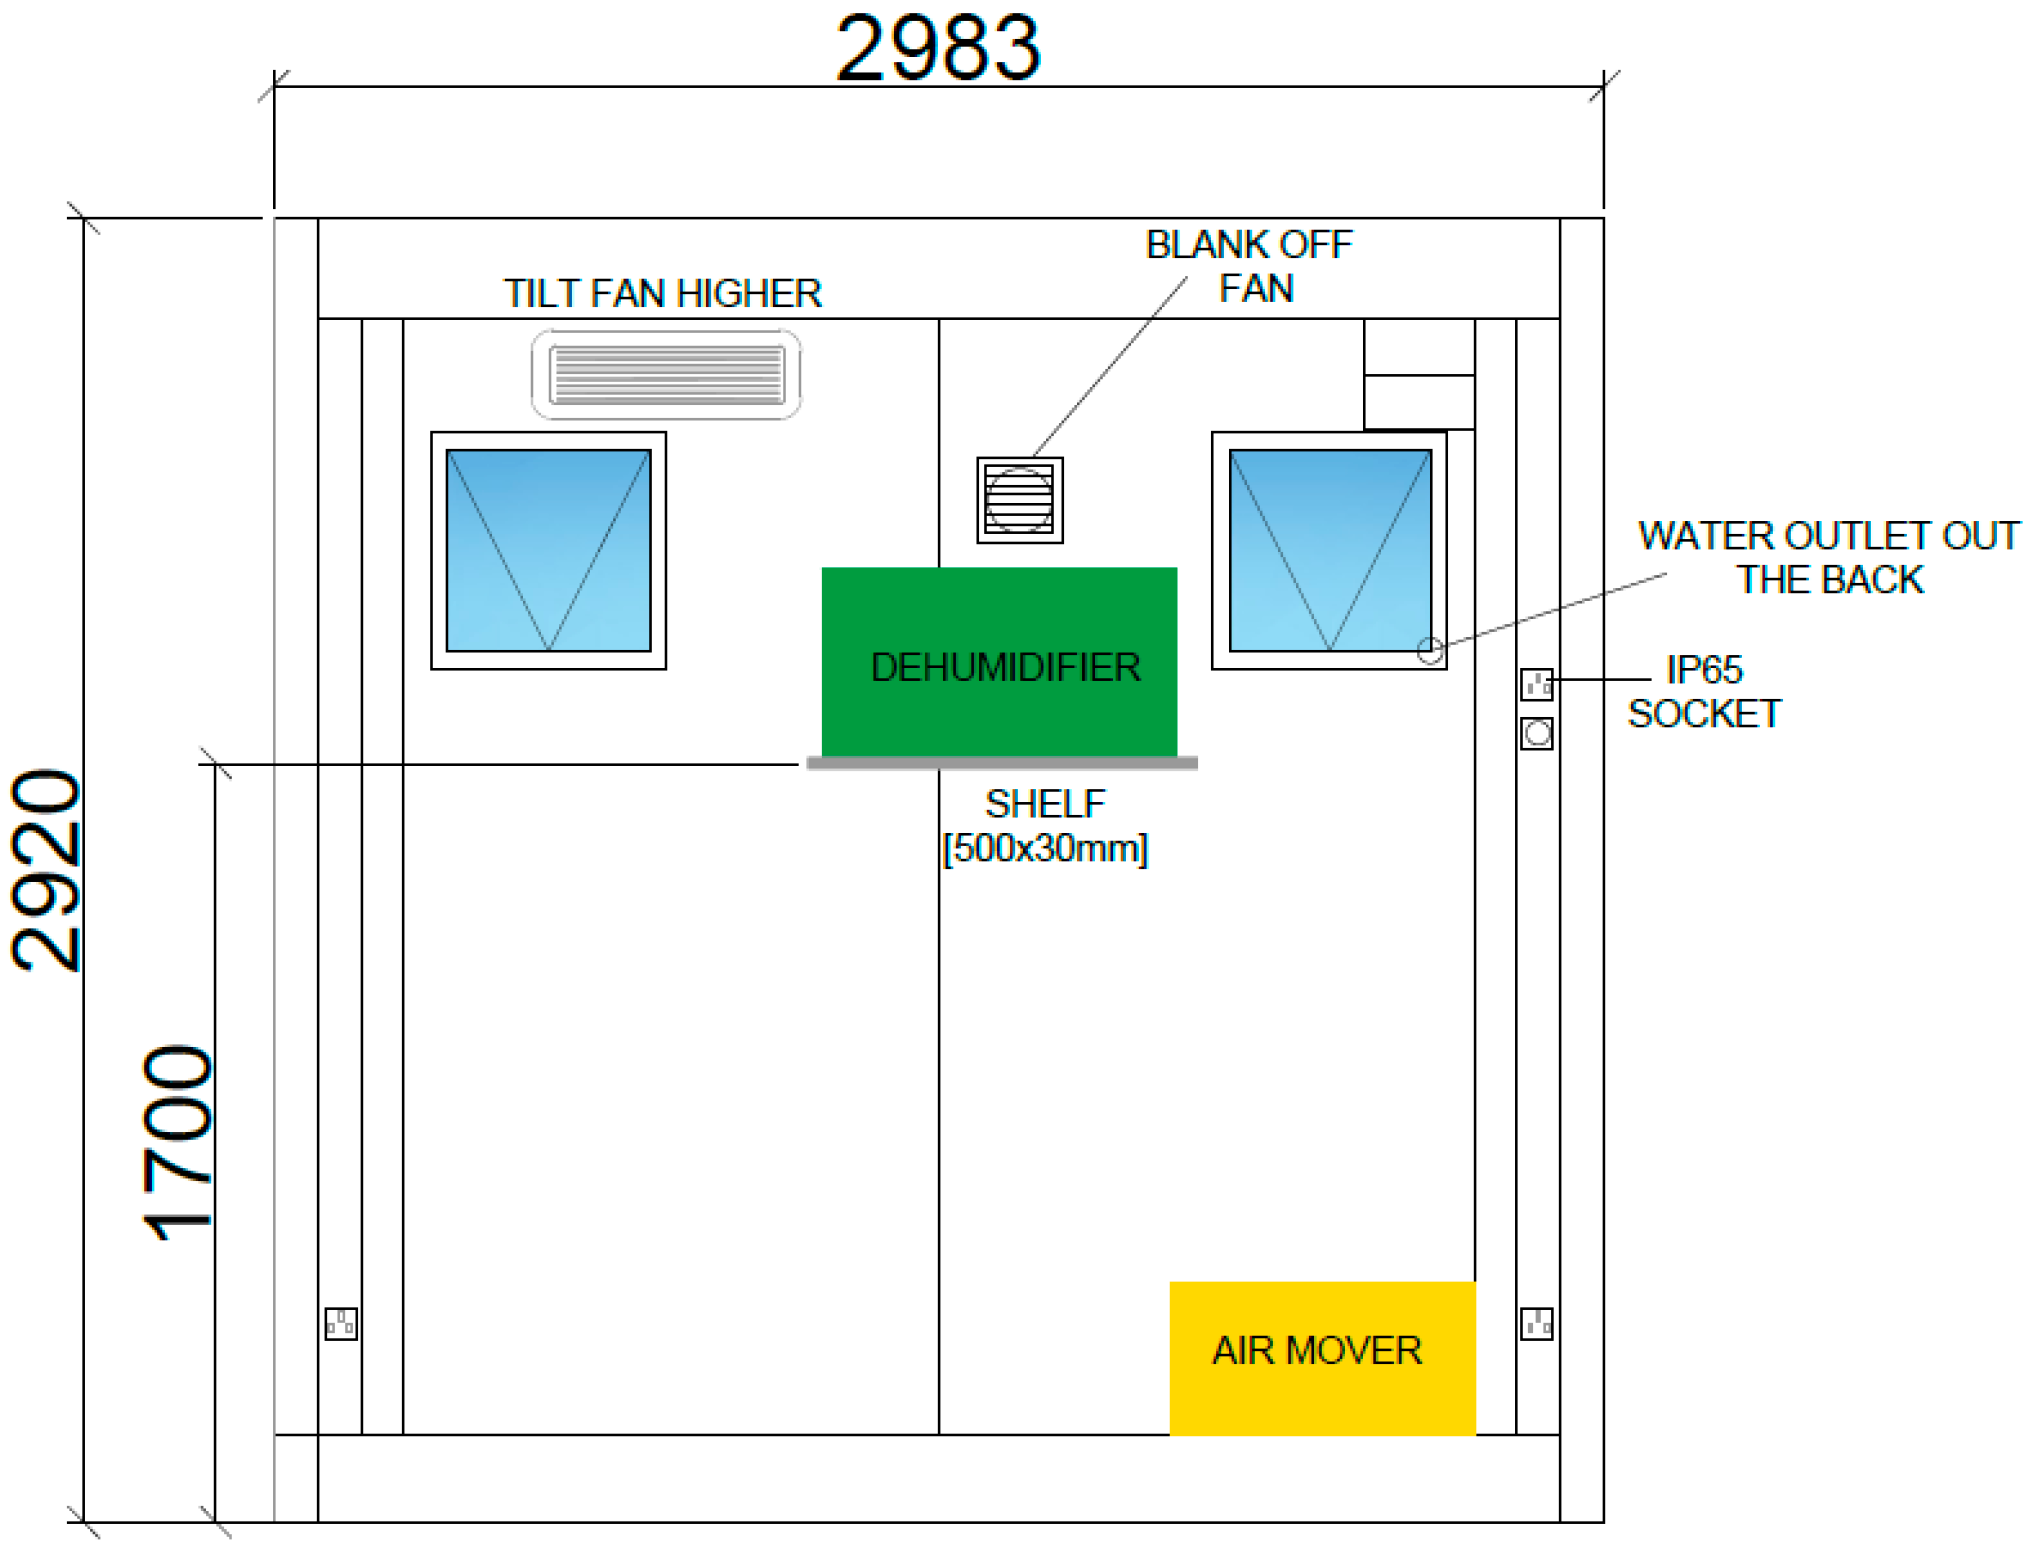
3.3. Wincham Drying Room
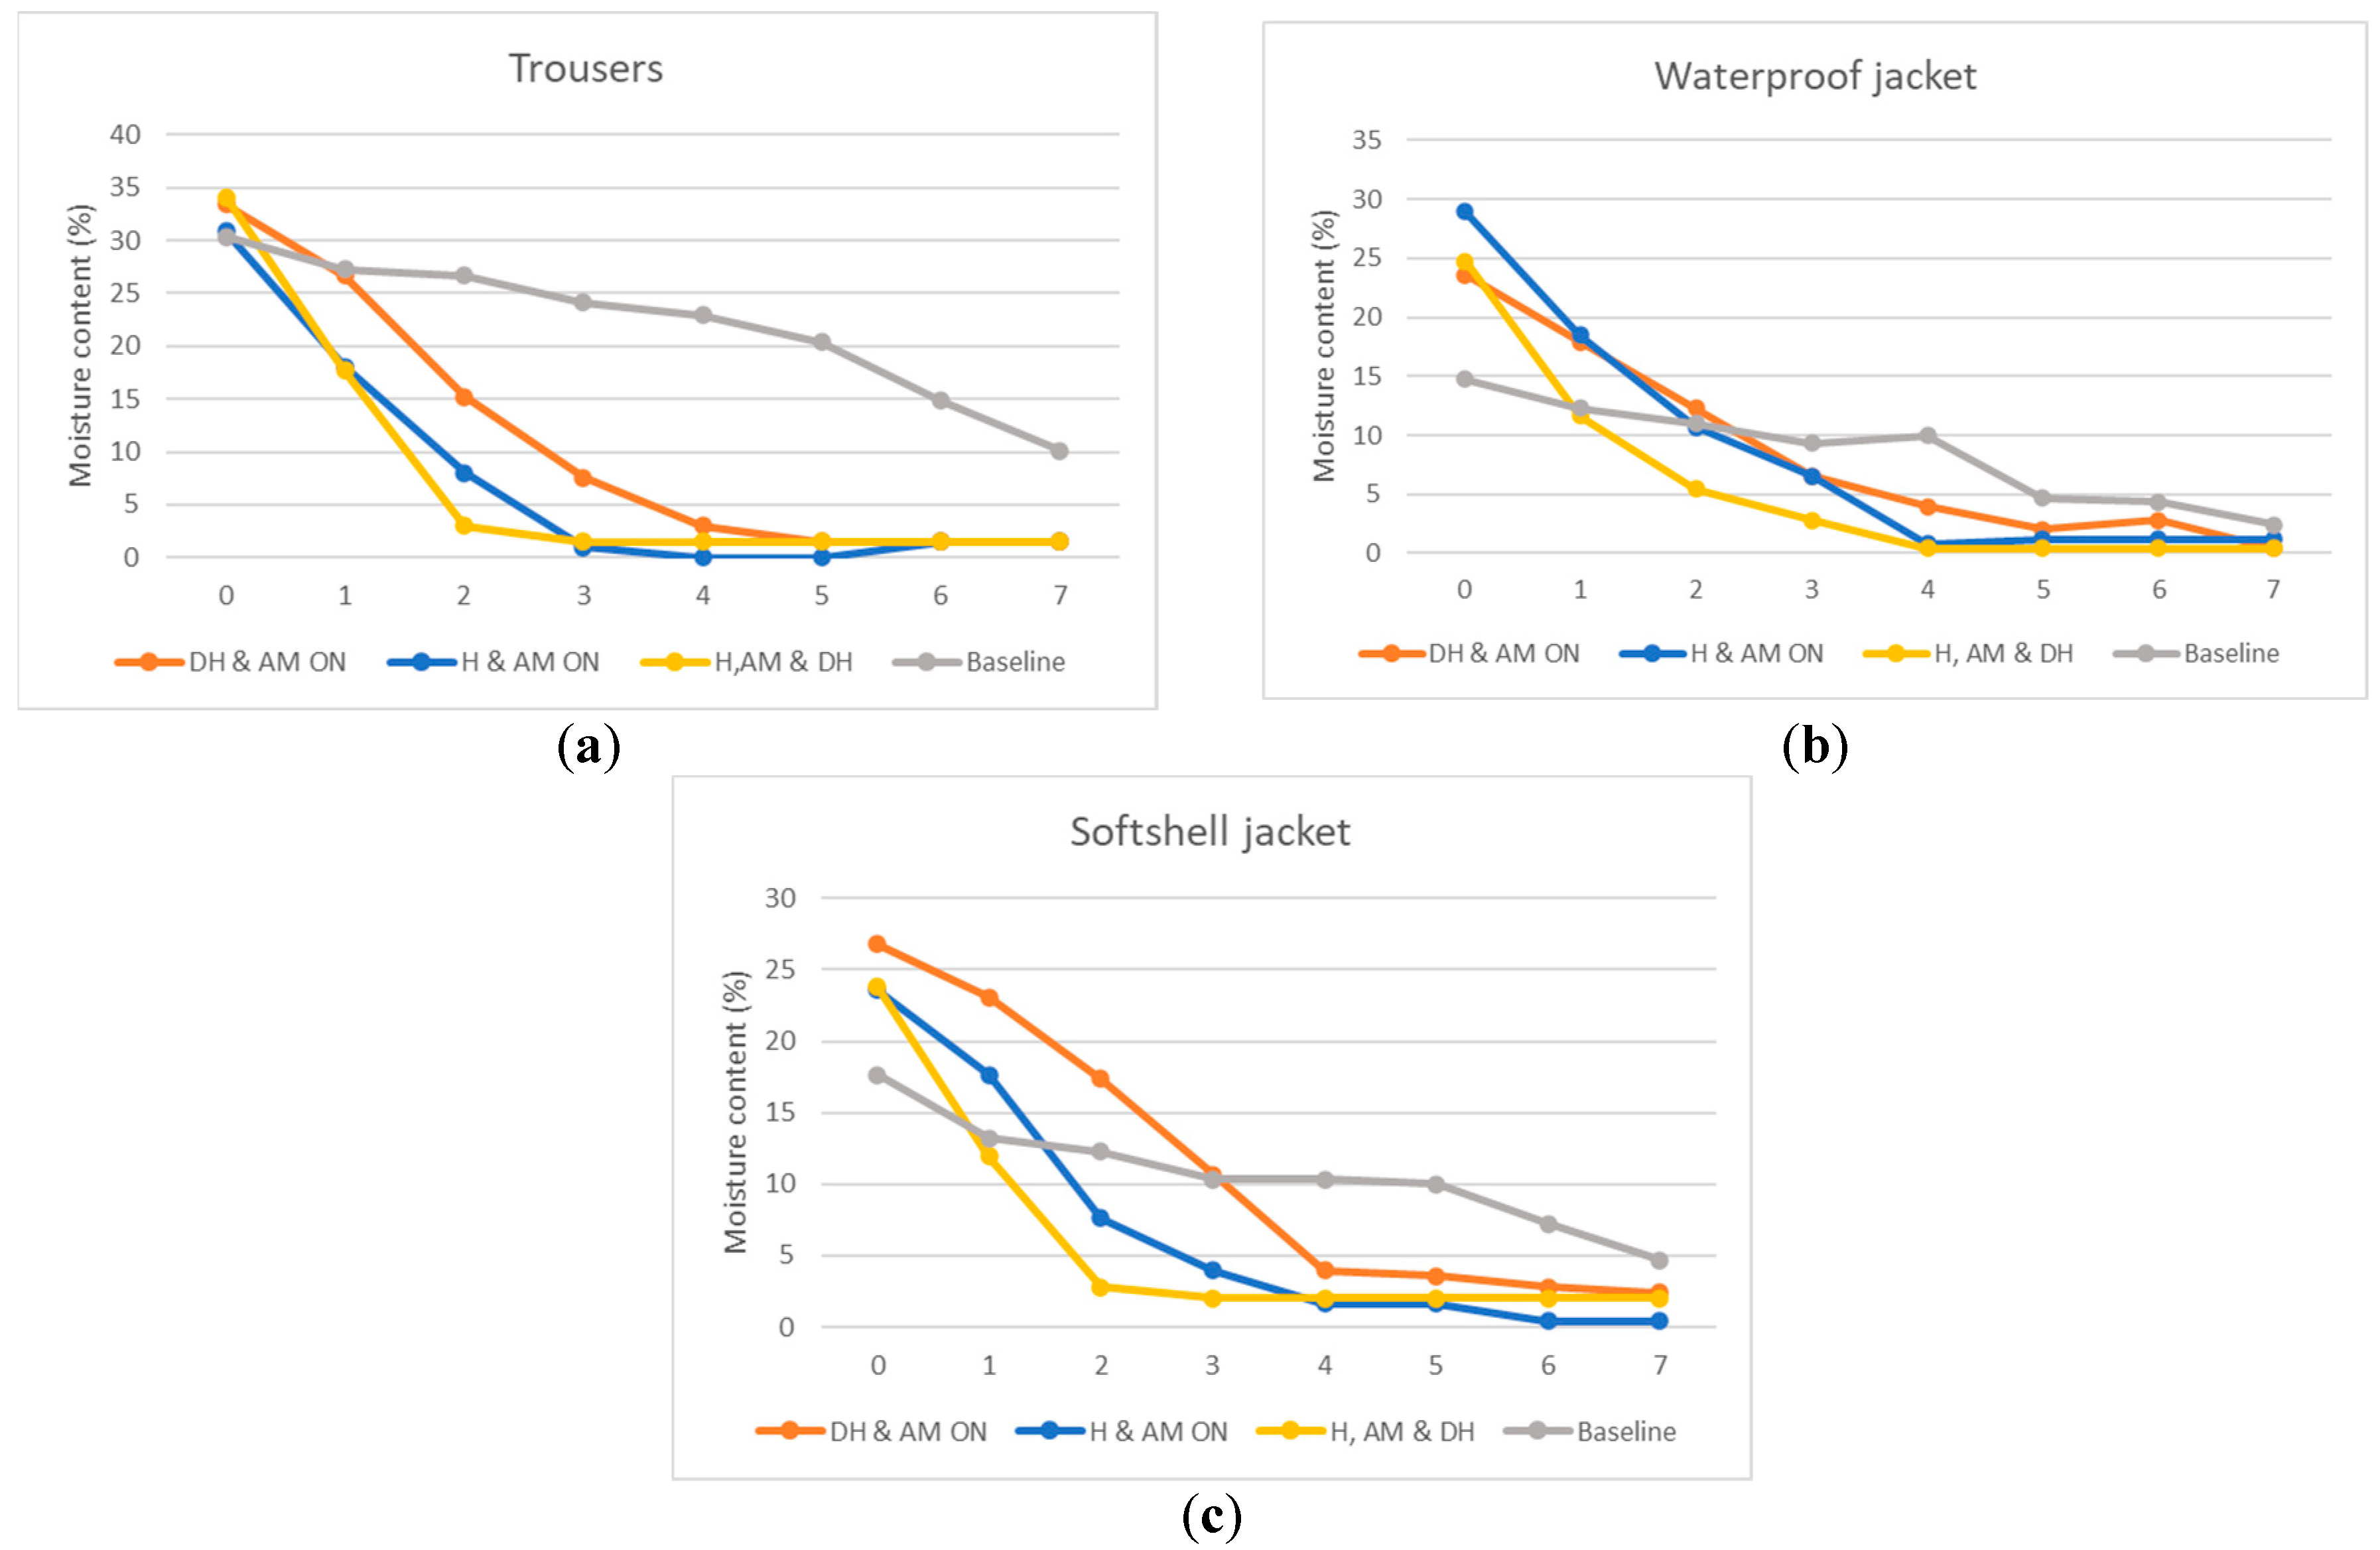
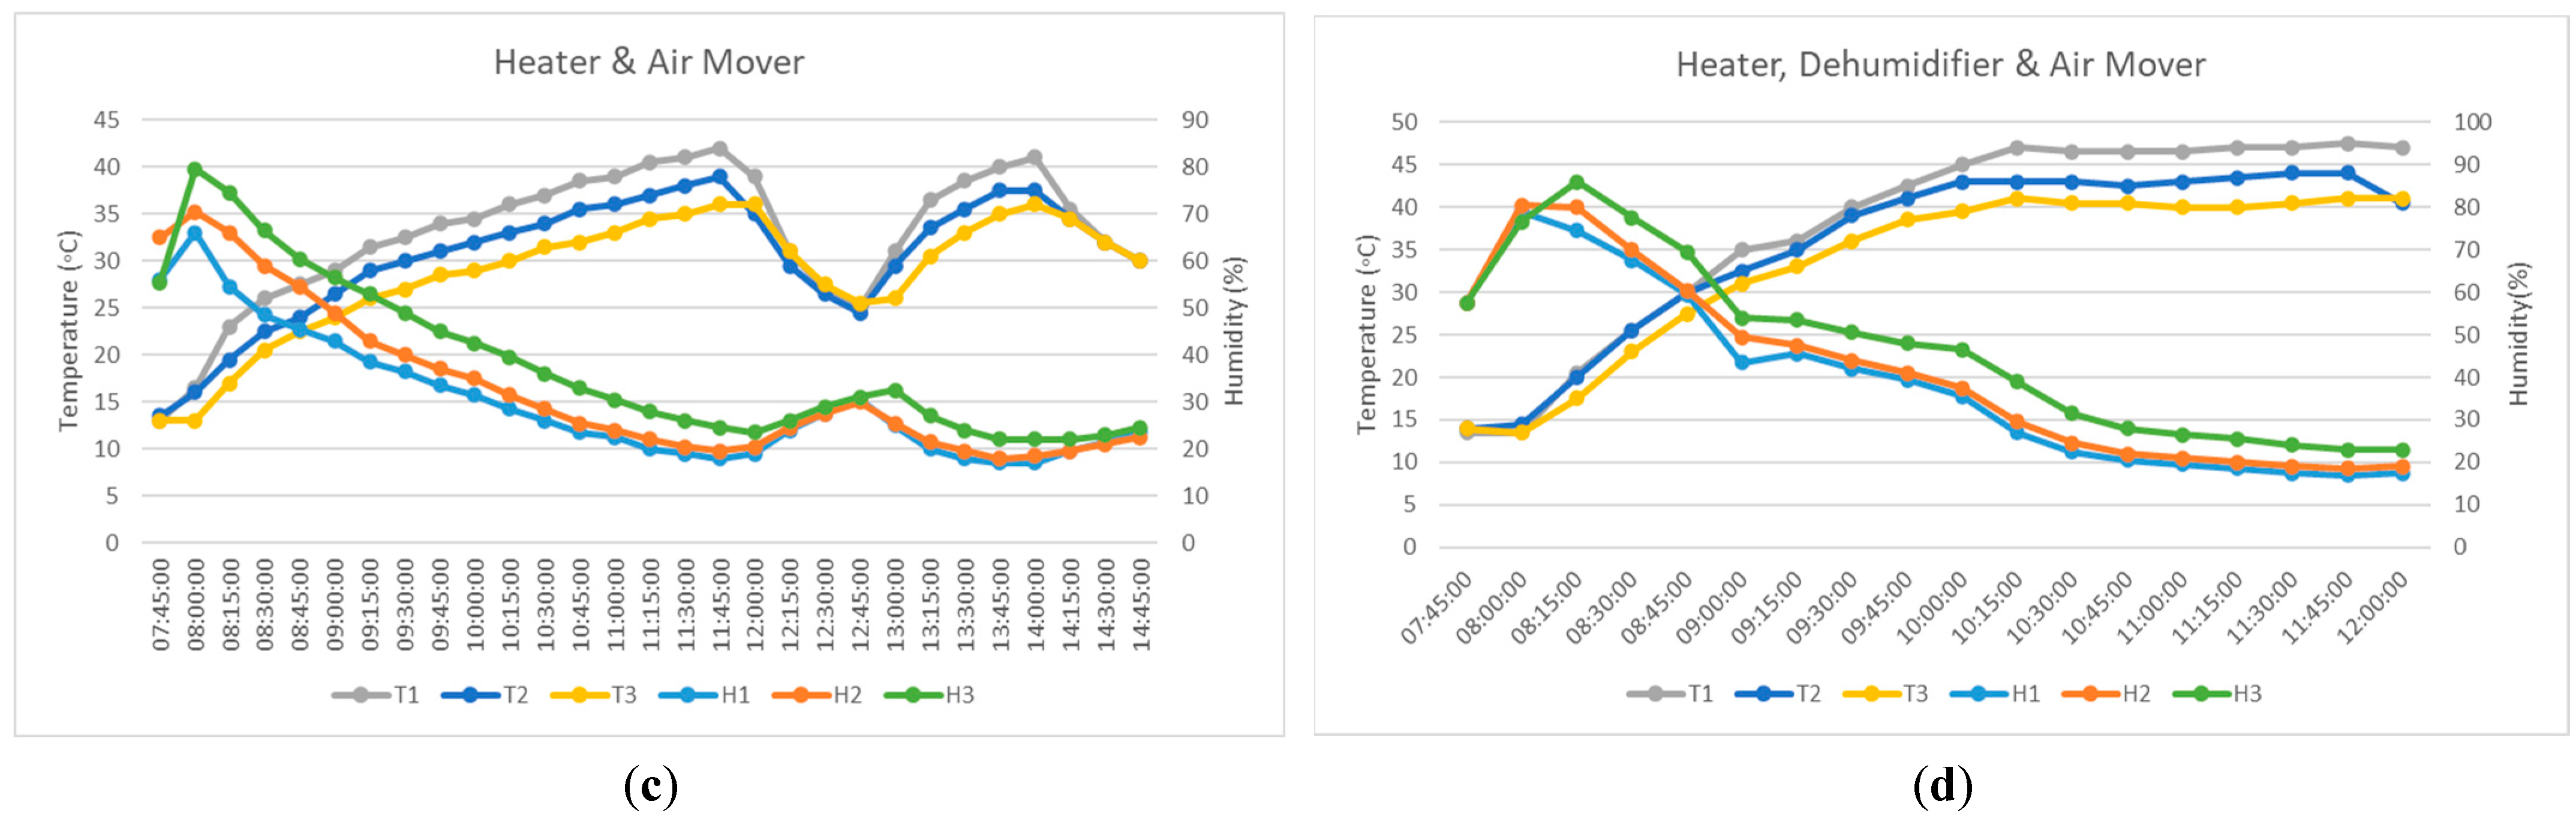
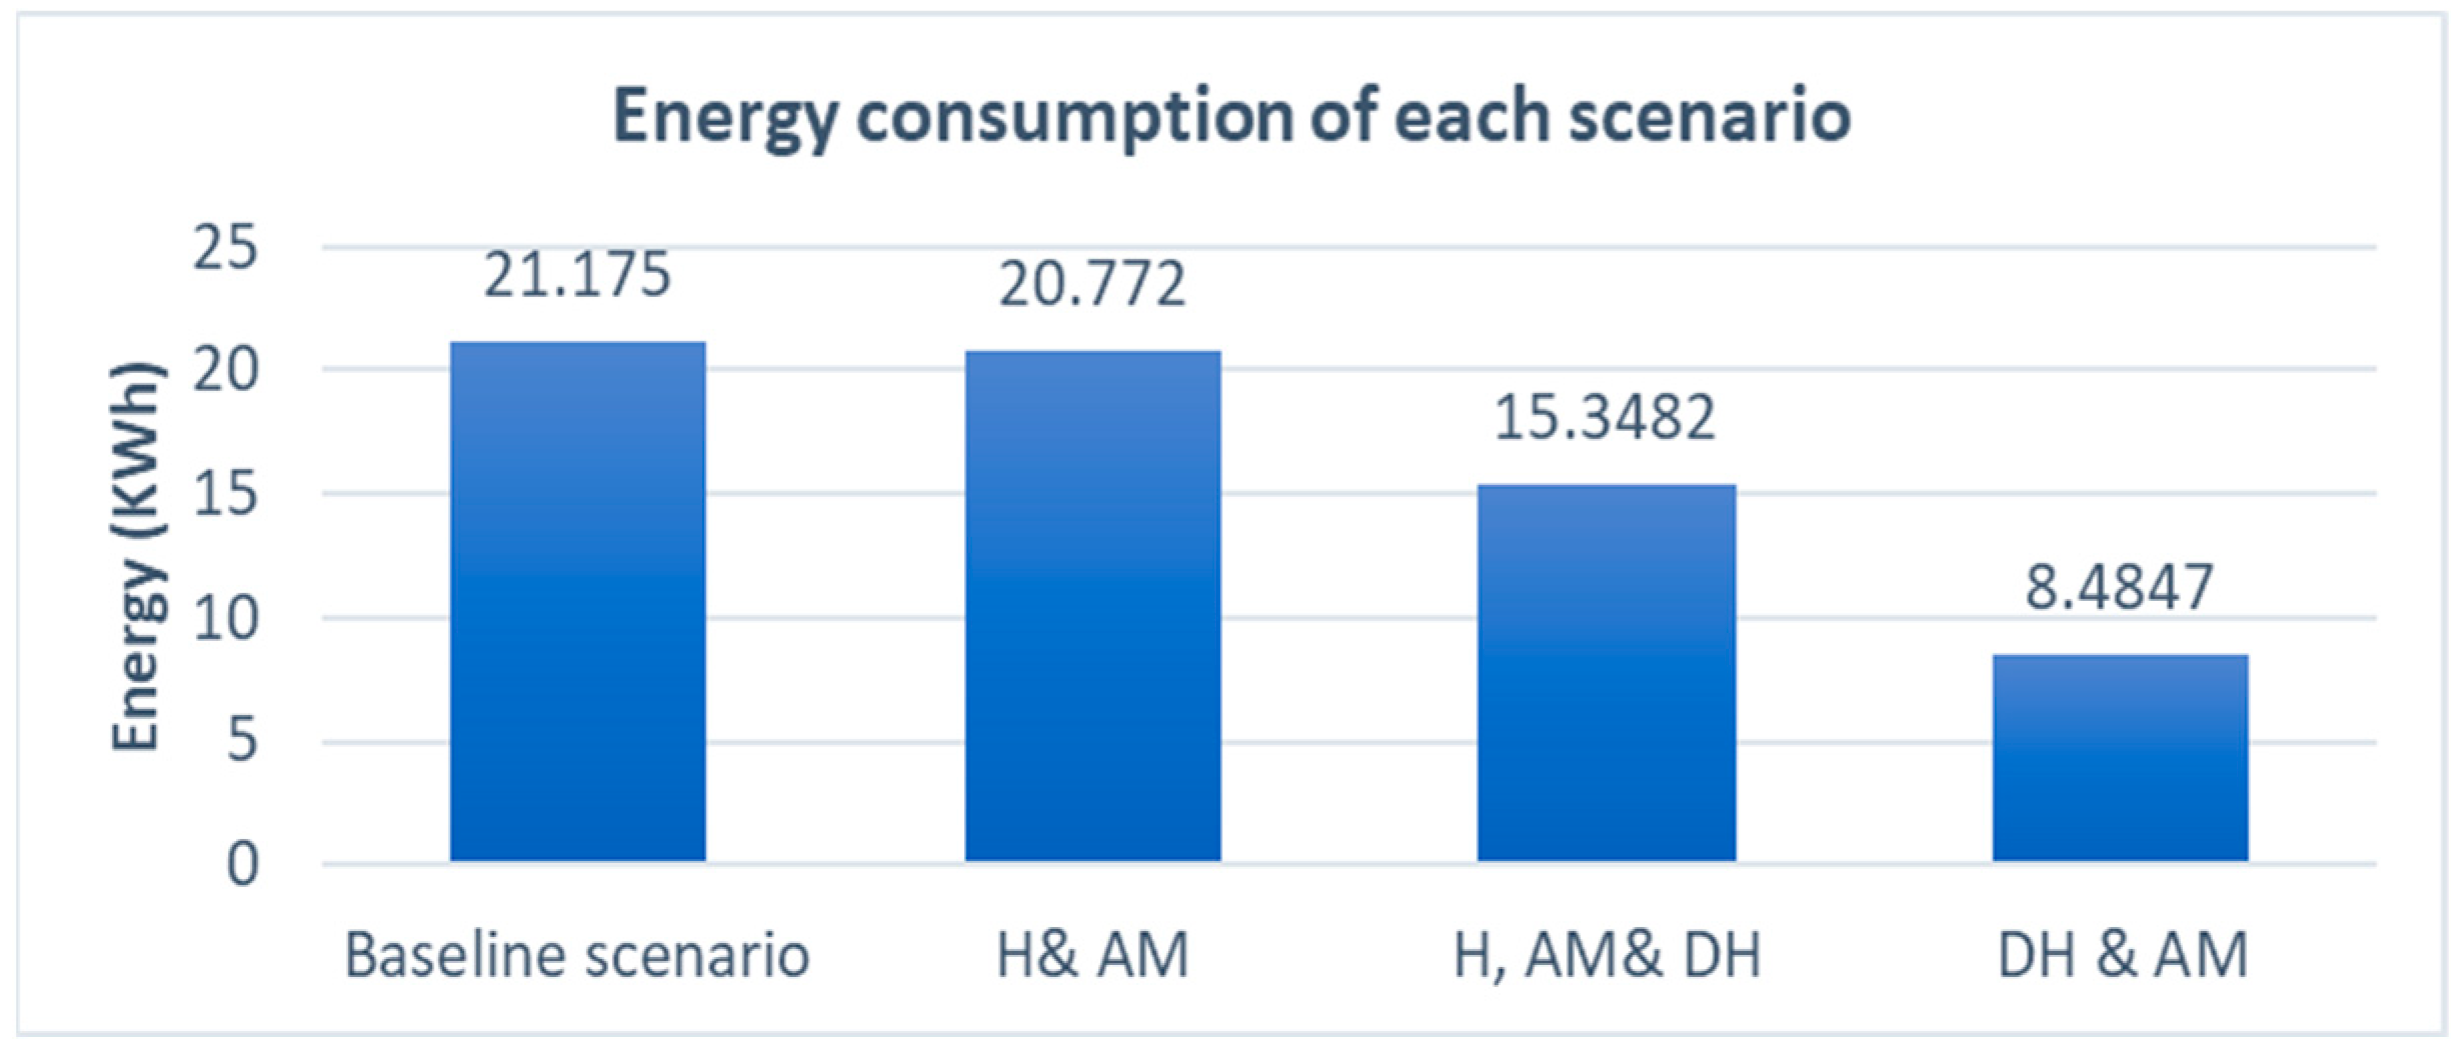
Figure 7 depicts the Wincham depot drying room that is half of one unit ~3 × 5 m similar to Everton units; it is an enclosed area that was used to conduct experiments for the following 4 scenarios (
Table 5).
Garments used in this experiment are ×10 softshell jackets, ×10 waterproof jackets, ×10 cargo trousers which are usually worn by the workforce onsite.
The equipment used in the experiment is as has been presented in
Table 6.
Table 6.
Equipment used in Wincham experiment.
Table 6.
Equipment used in Wincham experiment.
| Equipment | Description |
|---|
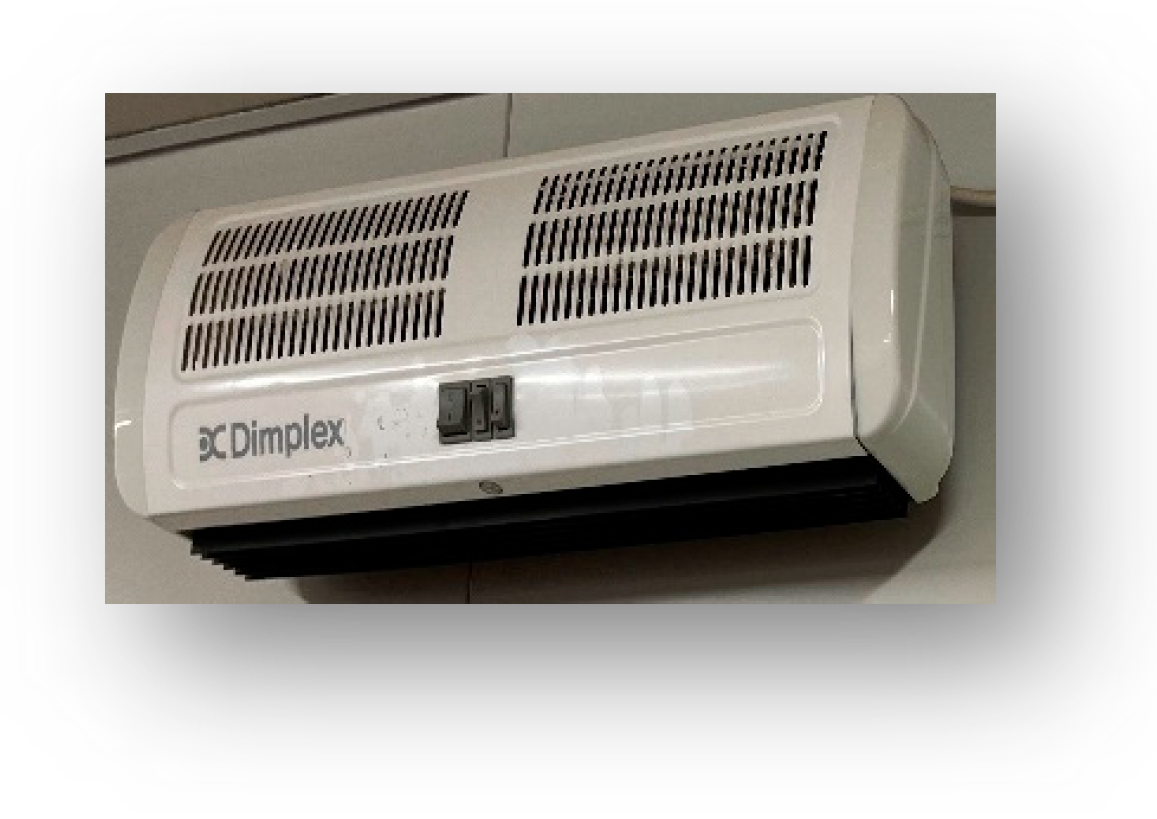
| Electric fan heater | Dimplex Air Curtain. Model: AC3N (3 kW) (Figure 8) |
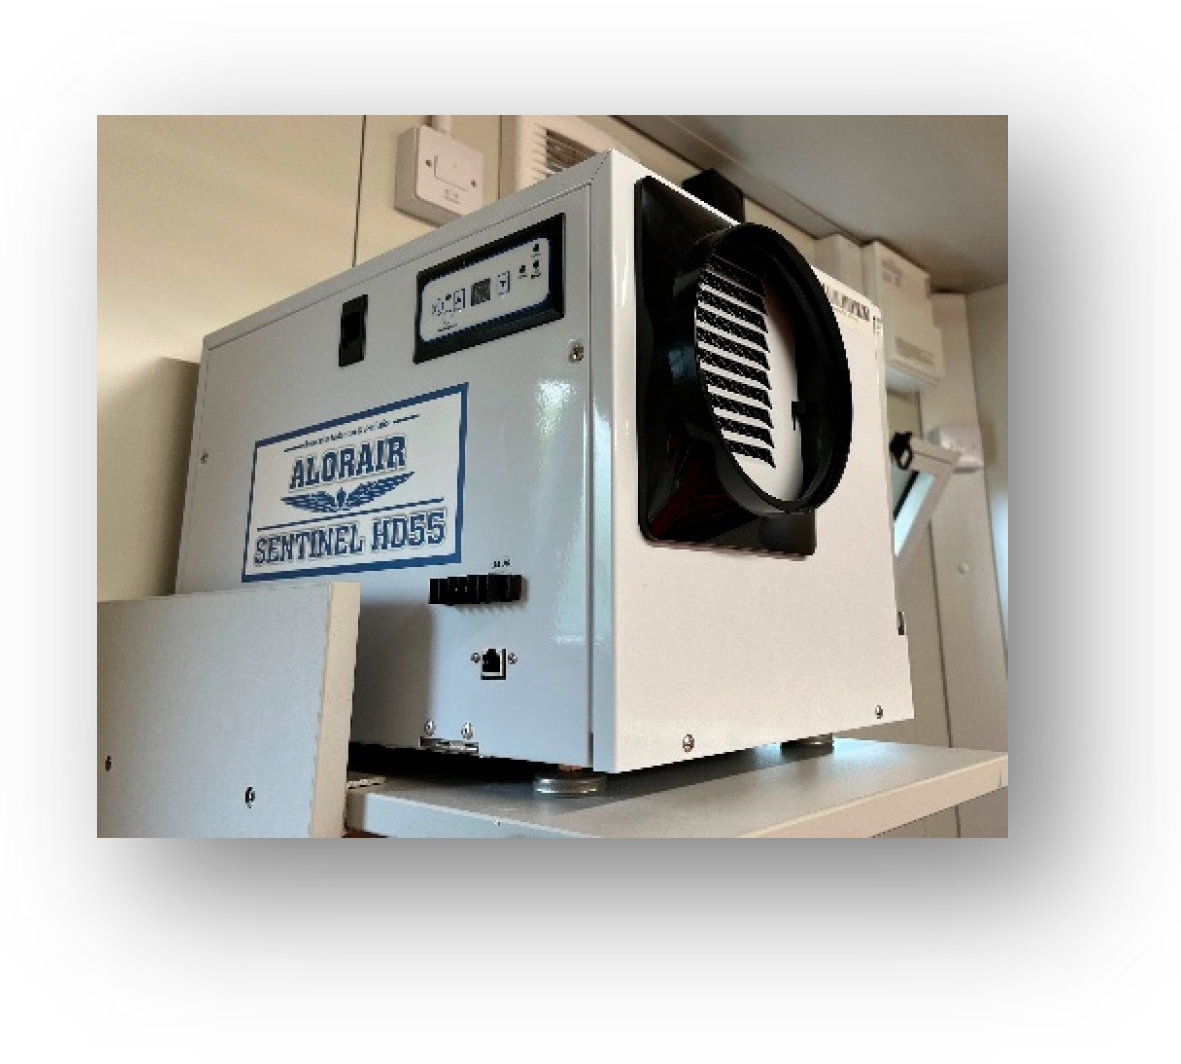
| Dehumidifier | SENTINEL HD55 (Figure 9) |
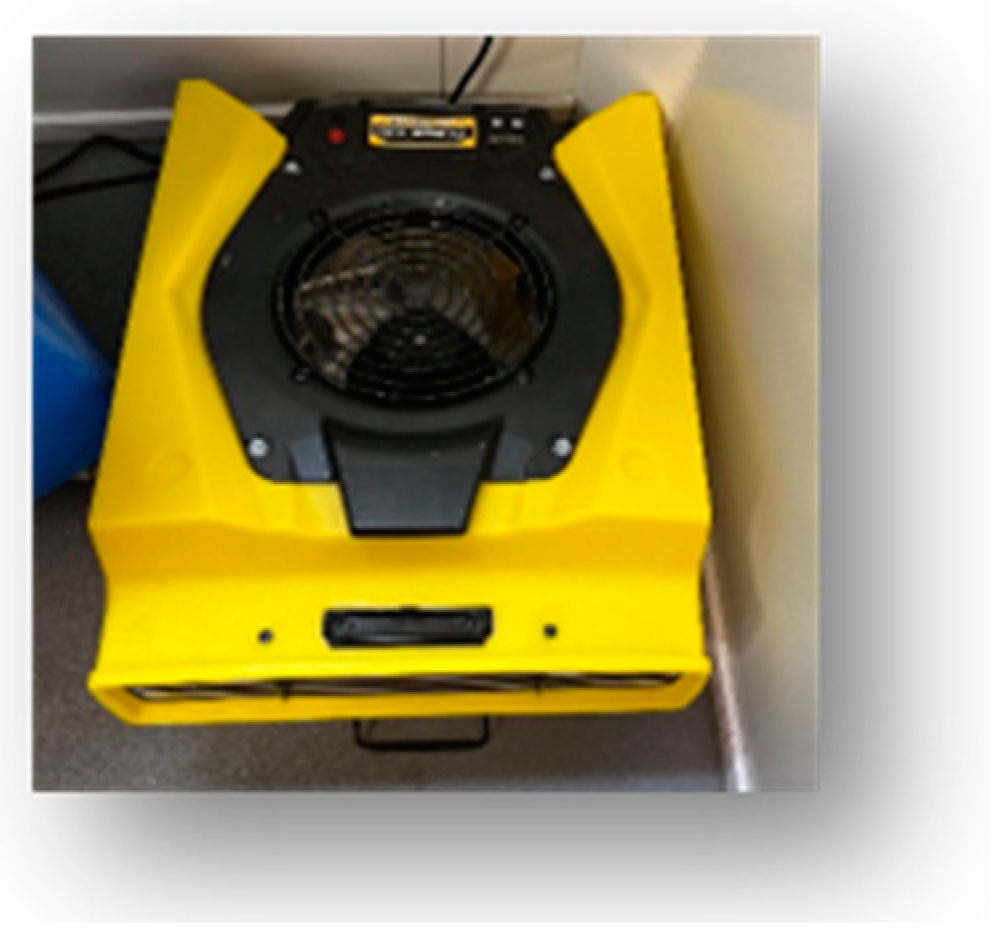
| Air circulation fan | ZEUS 900 AIR MOVER (Figure 10) |
| Humidity and temperature sensor | ThermoProTP357 Bluetooth Hygrometer |
| Three temperature and humidity sensors | Lascar EL-USB-2 Temperature and Humidity Data Logger (measurement accuracy: ±0.5 °C, ±2.25% RH) |
| Crane scale | KERN HCB 200K500 with a precision of 0.005 |
Figure 8.
Electric heater.
Figure 8.
Electric heater.
Figure 10.
Air circulation fan.
Figure 10.
Air circulation fan.
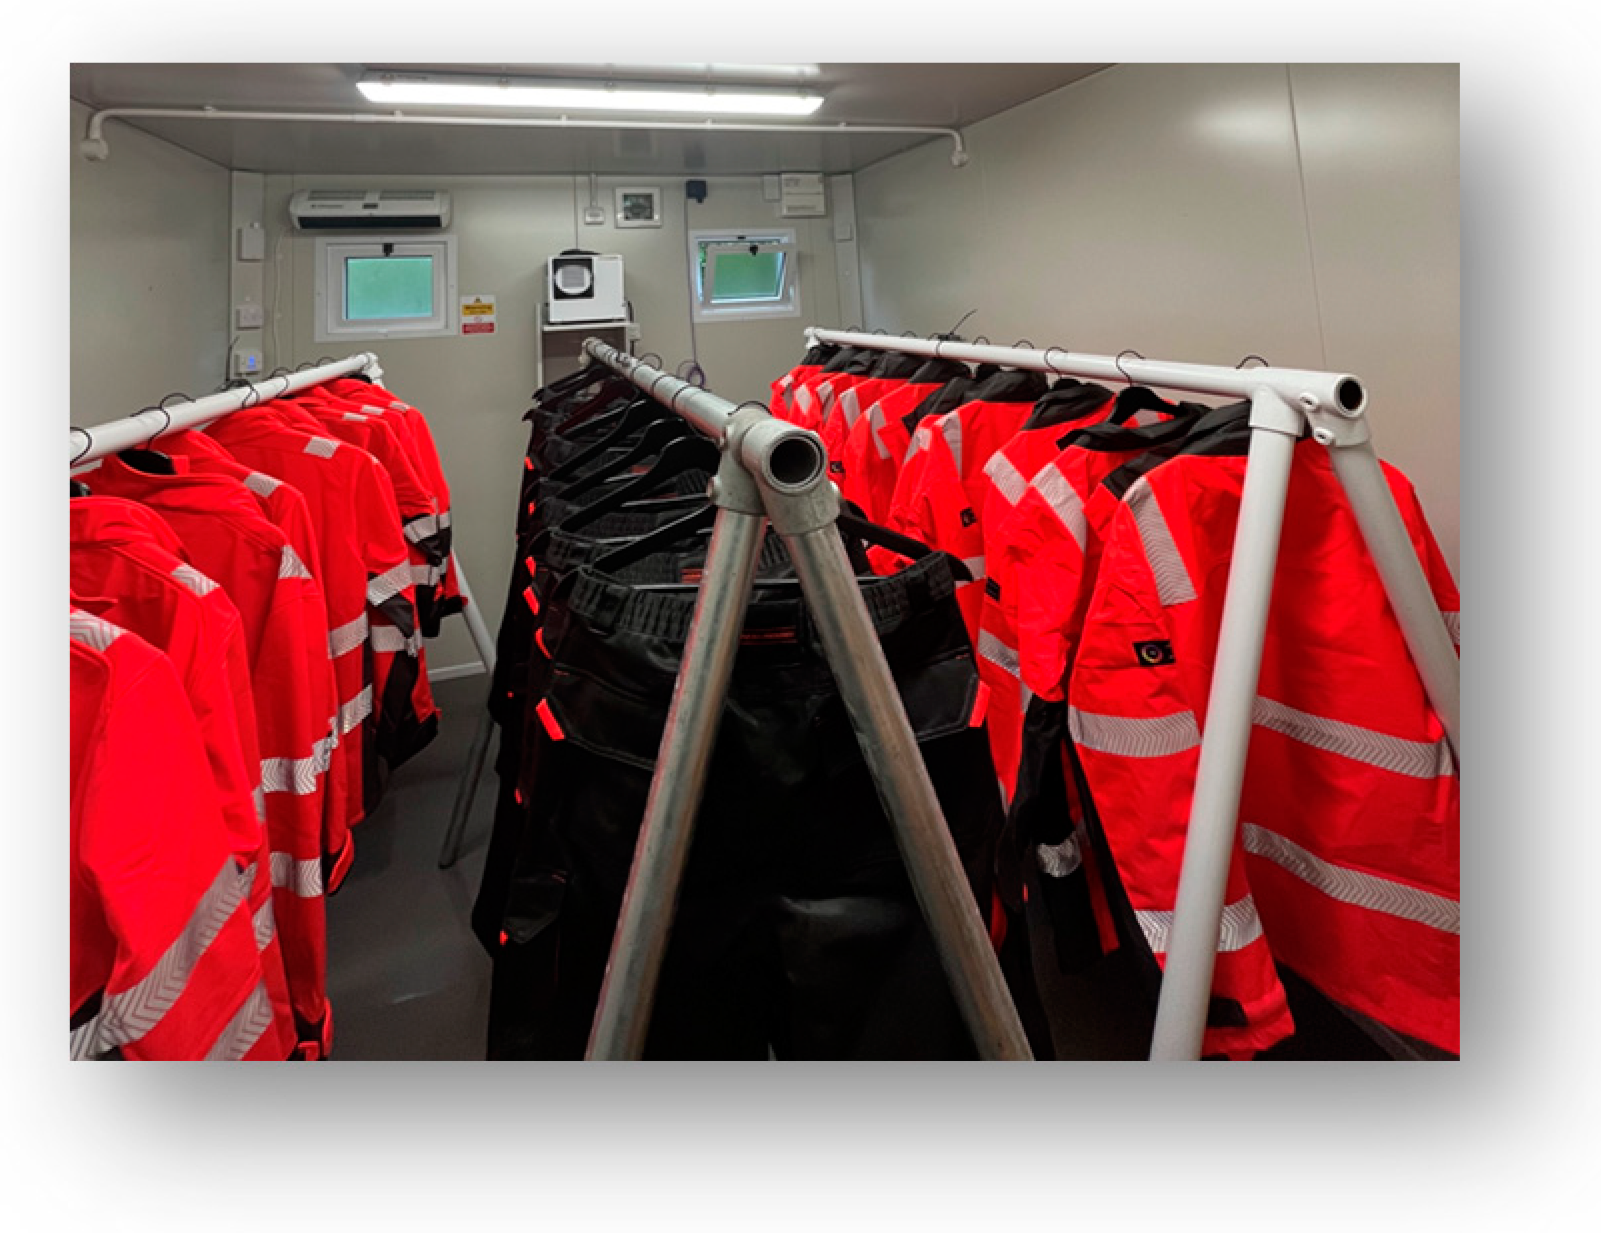
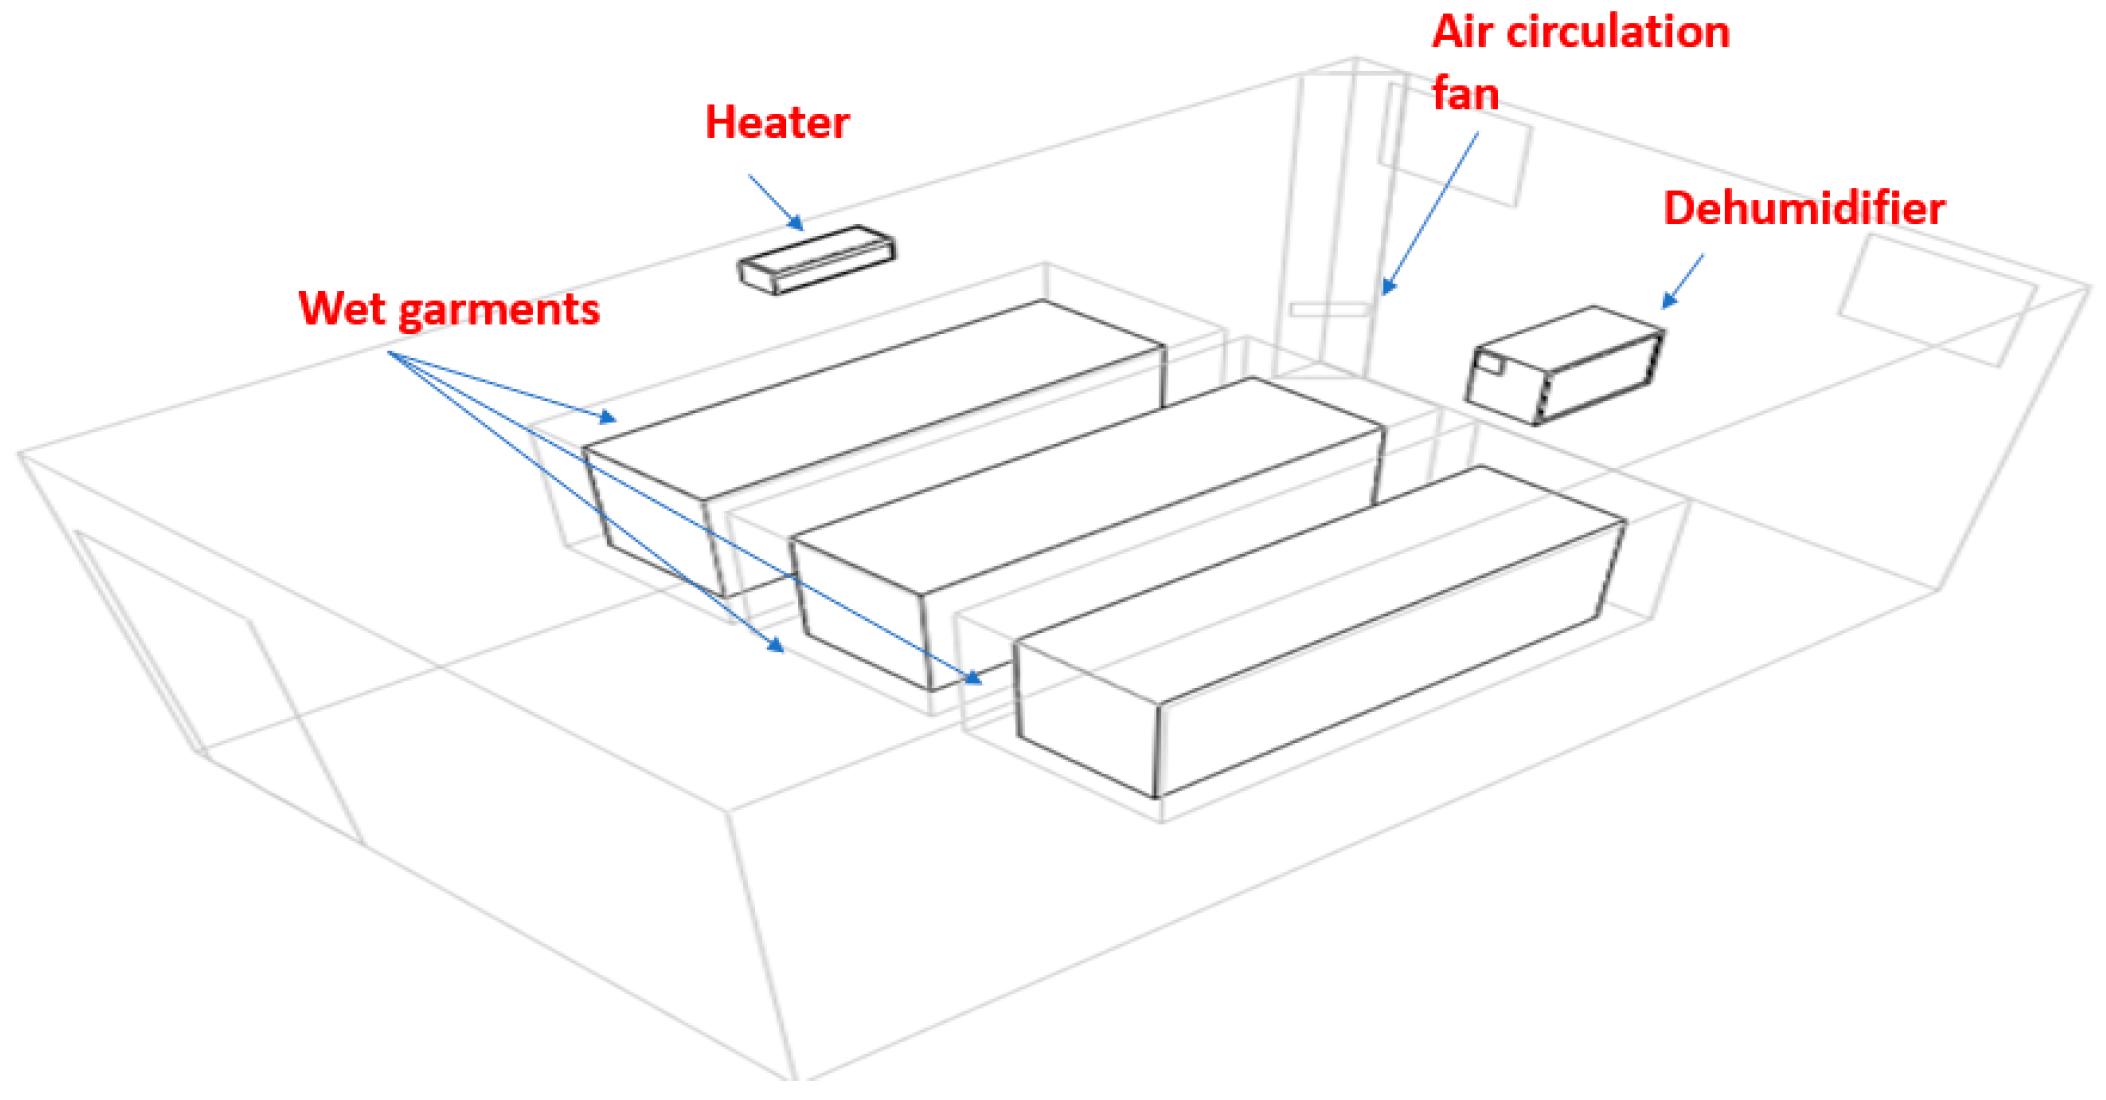
Three racks were used in this experiment; each hung 10 pieces of garments (
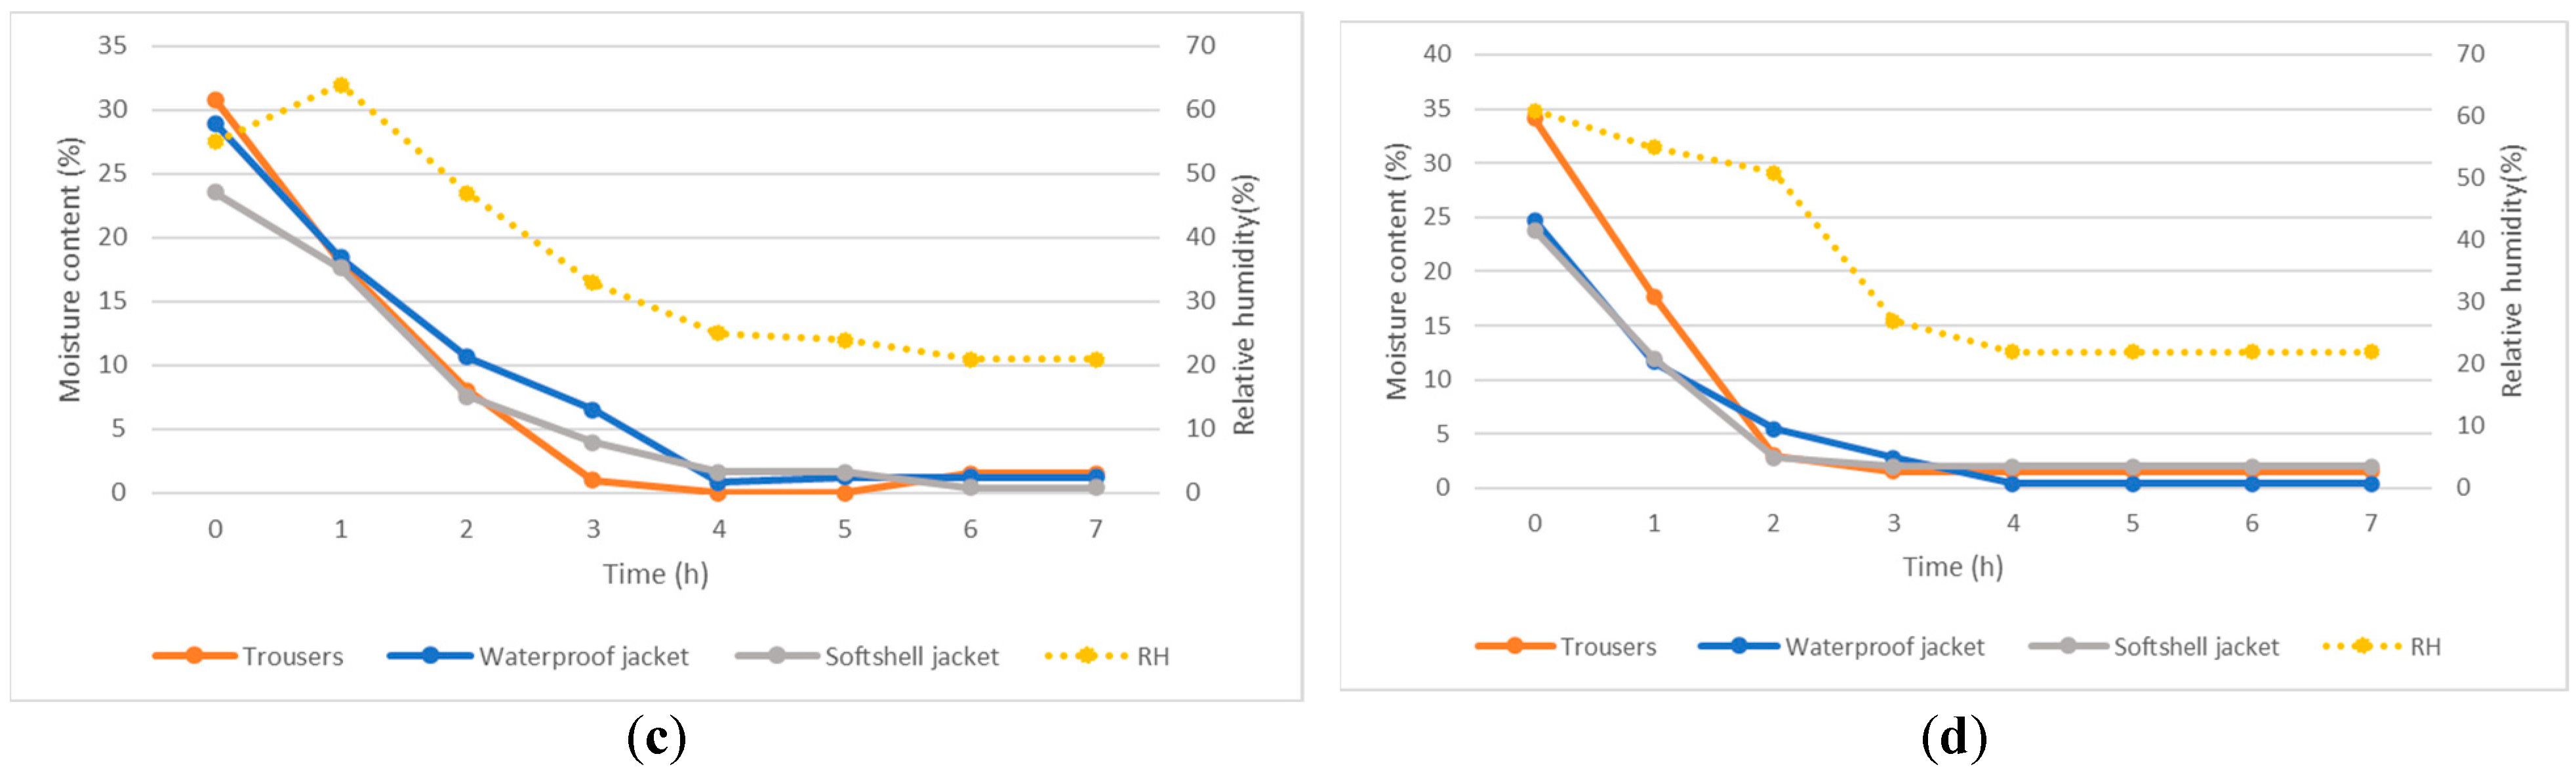
Figure 11); this time, hangers were used to expose all sides to the air, which was suggested to improve the drying process. The extractor fan was ON in some scenarios to let humid air be sucked out because the dehumidifier was not running, and moisture would be stuck indoors, hindering the drying process.
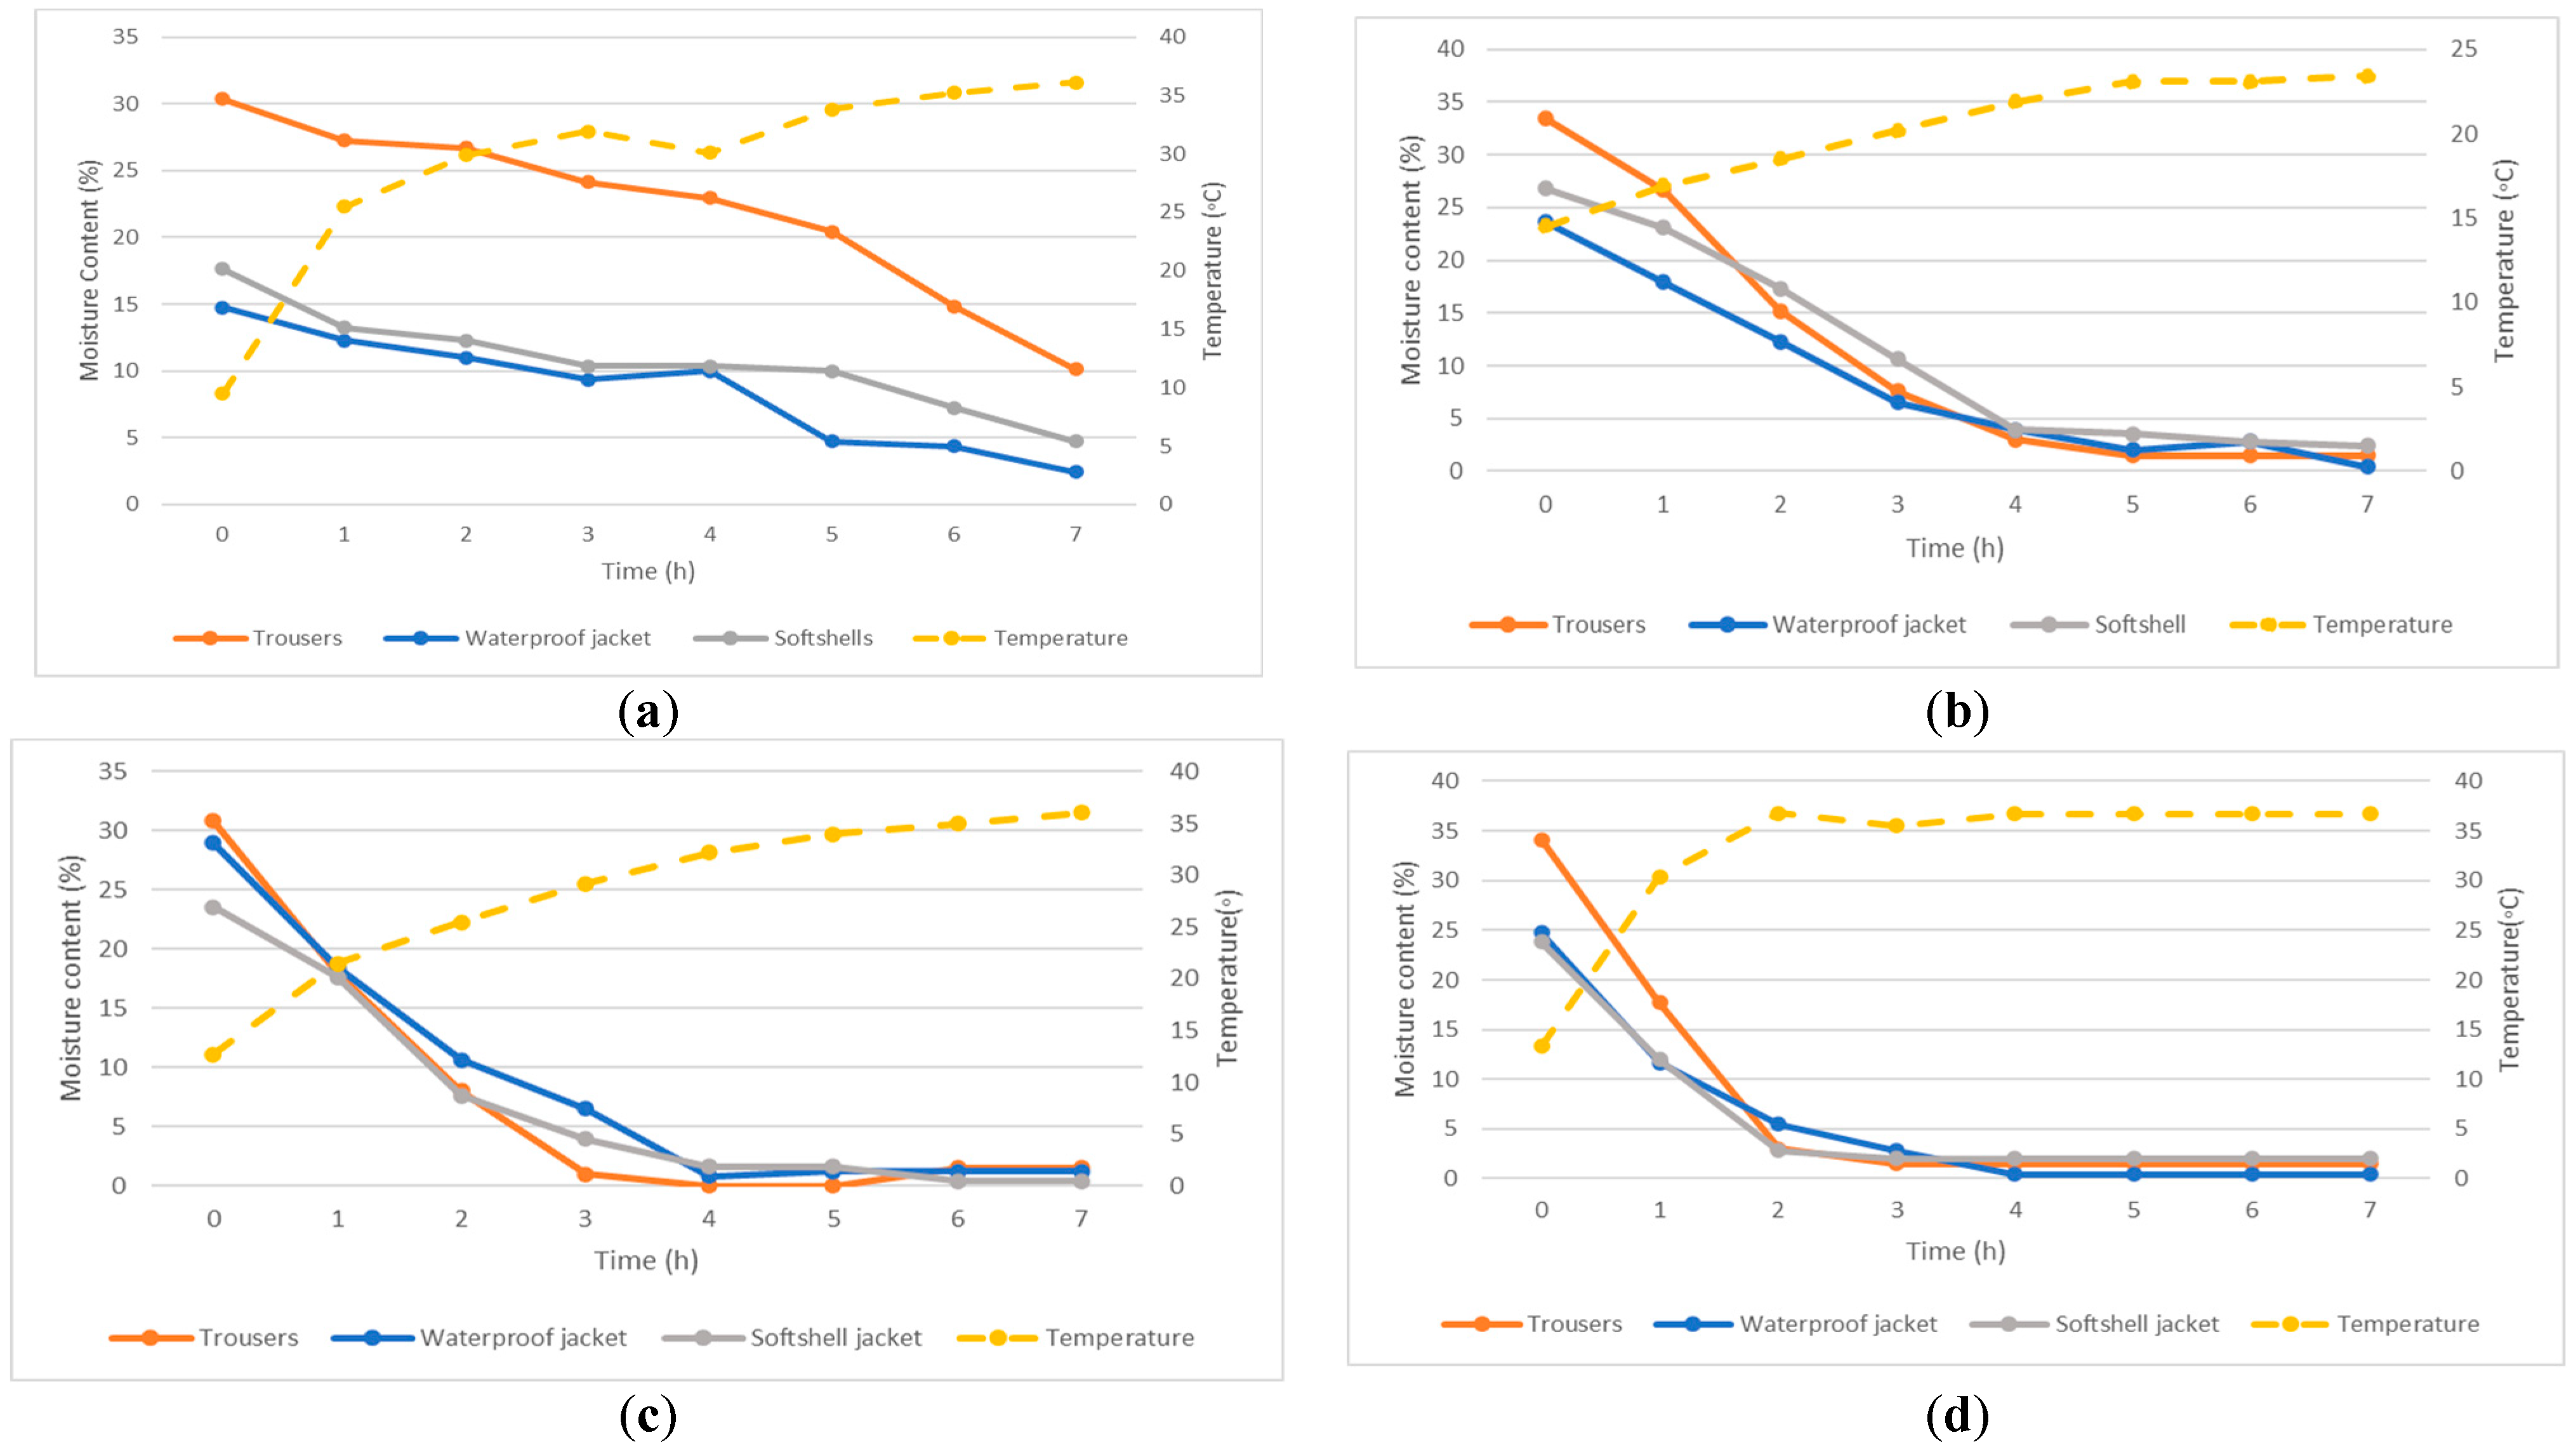
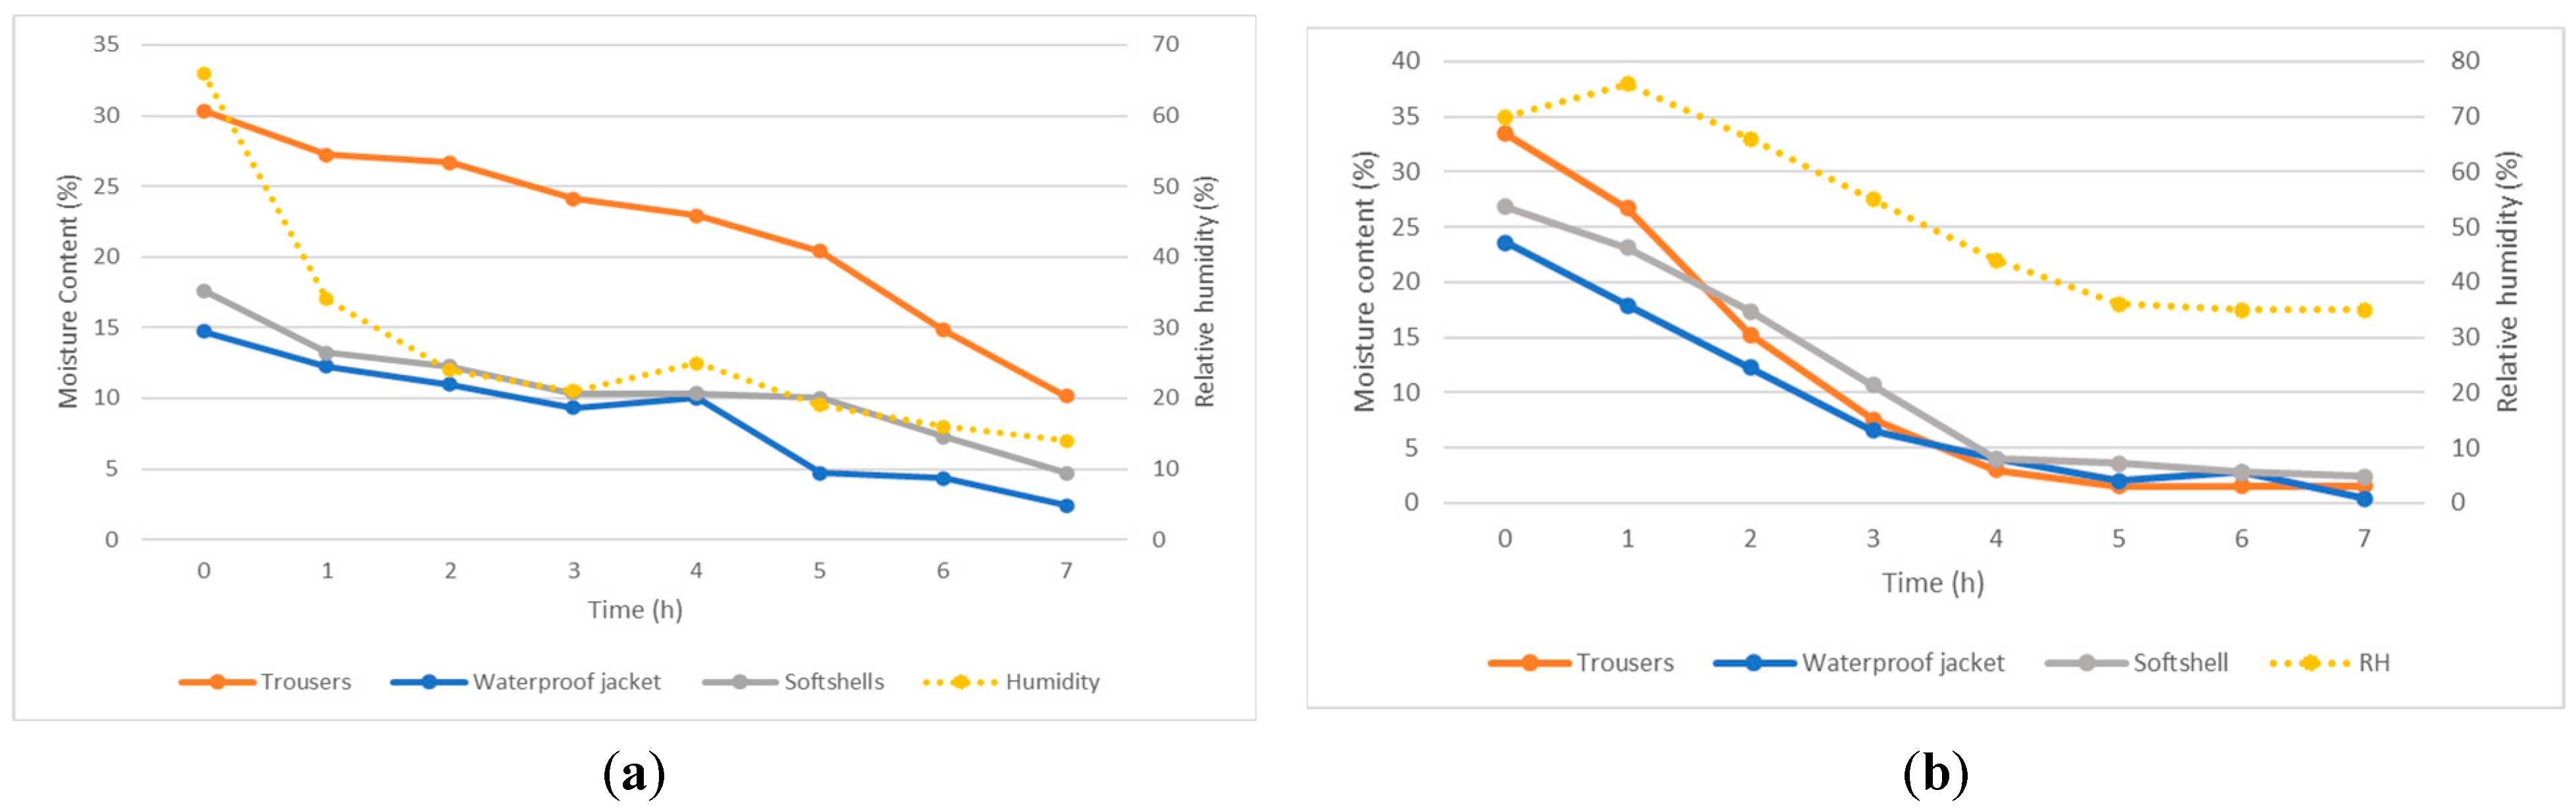
Equation (2) was used to calculate the moisture content in wet garments based on their weights to be able to determine the drying time. Regarding the final reading of the clothes’ weight, it was taken after 7 h; regarding temperature setpoint, it was set at 30 °C, and humidity was undefined, as the dehumidifier was set to work continuously during the experiment.
where
Mw = moisture content (wet basis), %;
Ww = moisture weight, kg;
Wd = dry matter weight, kg.


 ,
, 