Abstract
Neonatal seizures are the most common clinical presentation of neurological dysfunction, requiring immediate attention and treatment. Manual detection of seizure events from continuous electroencephalogram (EEG) recordings is laborious and time-consuming. In this study, a novel graph-based method for automated neonatal seizure detection is proposed. The proposed method aims to improve the detection performance by the thorough representation of multi-channel EEG signals and the adaptive classification of multi-band graph representations. To achieve this, a band-wise feature extraction method is performed on the raw EEG to provide more detailed information for classification. In addition, a novel classification model, namely the multi-band graph neural network (MBGNN), is proposed, which utilizes the attention mechanism and can take full advantage of the multi-band graph representations to improve the classification performance. The proposed method is evaluated using the EEG recordings of 39 neonates from the Helsinki database. The MBGNN model gives an average area under the receiver operating characteristic curve (AUC) of 99.11%, an average positive predictive value (PPV) of 95.34%, and an average negative predictive value (NPV) of 96.66%. The experimental results show that the proposed method could fully exploit the multi-band EEG information and facilitate the classification of seizure/non-seizure EEG epochs, making it more appealing for patient-specific clinical applications.
1. Introduction
Seizure is one of the most common clinical manifestations of neurological insult or nervous system dysfunction in neonates. It could have adverse effects on neurodevelopment and potentially increase the risk of cognitive, behavioral, or epileptic problems in the future. As a result, the accurate detection and prompt treatment of seizures is a high priority in the neonatal intensive care unit (NICU).
Visual diagnosis of seizures is challenging, partly because clinically silent seizures can account for up to 85% of the total seizure burden [1]. Continuous electroencephalography (EEG) monitoring is the most commonly used method for seizure detection [2]. EEG is a type of complex bioelectrical signal and is prone to rhythmic artifacts that can mimic seizure patterns. Proper interpretation of neonatal EEG recordings requires highly trained and experienced medicinal professionals. Furthermore, manual interpretation of massive clinical data is laborious and time-consuming, which could be a heavy burden for NICUs. Therefore, an automated method that is able to accurately annotate epileptic neonatal EEGs would be extremely useful to NICU clinicians.
Earlier studies were based on heuristic rules and empirical thresholds. The basic route was to explore seizure-related morphological characteristics of neonatal EEGs, such as periodicity, disorderliness, rhythmic discharges, or spikiness. EEG segments were classified as “seizure” or “non-seizure” by comparing these clinical characteristics with pre-defined thresholds. For instance, Liu et al. [3] proposed a method based on autocorrelation analysis that characterizes periodic activity in neonatal EEGs and distinguishes seizures from normal background activity. Gotman et al. [4] presented a method to detect neonatal seizure patterns using spectral analysis, where the rhythmicity, power and spectral stability characteristics of a given epoch are compared to those of a constantly updated background. Navakatikyan et al. [5] developed a real-time neonatal seizure detection system. EEG waves with increased regularity, characterized by wave intervals, amplitudes and shapes, were detected as indicators of seizure discharges. Deburchgraeve et al. [6] identified two major neonatal seizure patterns and developed two separate detectors in parallel. The first detector was designed to detect high-frequency activity, while the second detector was designed to detect low-frequency activity, corresponding to the “spike train seizures” and “oscillatory seizures”, respectively. Considering the specificity of neonatal EEG and the inter-individual variability, these methods are not sufficiently reliable for routine use in NICUs.
More recently, data-driven methods based on machine learning techniques have been proposed for neonatal seizure detection. In these methods, features are mostly defined in the time, frequency, and information theory domains and fed into machine learning-based classifiers. The rules and thresholds for decision making could be learned from the data through supervised, semi-supervised or unsupervised algorithms. For instance, Thomas et al. [7] proposed a neonatal seizure detection system based on Gaussian mixture models (GMM) classifiers. A set of 55 features was extracted from each EEG epoch. For a better classification performance, principal component analysis (PCA) and linear discriminant analysis (LDA) were implemented to reduce the dimension of feature space. GMM classifiers were trained on the transformed features and provided the probability that a certain epoch belongs to the seizure or non-seizure class. In the study presented by Temko et al. [8], the GMM classifiers in [7] were replaced by support vector machine (SVM) classifiers. Tapani et al. [9] developed a neonatal seizure detection algorithm based on autocorrelation analysis and SVM. From each epoch, a set of 21 features were extracted, defined in time, frequency, and time-frequency domains, as well as characteristics of autocorrelation analysis. These features were then fed into SVM classifiers for binary decision. Although the overall performance is satisfactory, there are still obvious drawbacks of this type of method. Accurate spatial annotation of seizure-containing EEG channels is indispensable for the proper training of classifiers, which requires additional inspection or preprocessing. In addition, conventional classifiers used in these methods have shown limitations in dealing with spatiotemporal features.
In recent decades, neural network theory has advanced rapidly, leading to the emergence of a variety of network architectures that have demonstrated their potential as viable alternatives to traditional machine learning frameworks in several research fields [10,11,12,13], including neonatal seizure detection. Ansari et al. [14] proposed a hybrid CNN-RF architecture that employed a convolutional neural network (CNN) for feature extraction, followed by a random forest (RF) for feature classification to enhance the overall detection performance. In the study by O’Shea et al. [15], a deep learning framework based on the fully convolutional neural network (FCNN) was developed, which achieved end-to-end optimization of the feature extraction and classification. The experimental results demonstrate that the proposed FCNN system outperforms the two baseline systems based on SVM. Tanveer et al. [16] proposed a 2D CNN framework for automated feature extraction and neonatal seizure detection. Three individual 2D CNN models were separately trained on a database annotated by three different experts. Subsequently, an ensemble model was created to predict seizure states by incorporating the opinions of the three CNN models. Compared to traditional machine learning frameworks, neural network frameworks have the advantage of holistically incorporating information from all channels and automatically optimizing the feature extraction and classification through the training process. However, the underlying interdependencies among different EEG channels have been overlooked. These interdependencies could provide critical insights into cerebral function and potentially improve the detection performance.
In order to fully exploit the interdependencies of multi-channel EEG signals, graph-based methods have been developed in recent studies. Typically, these methods include two key components: graph generation and graph classification. In graph generation, the characteristics within each channel and the interdependencies between different channels are computed. Thus, a graph can be constructed by assigning the intra-channel features as graph nodes and the inter-channel features as graph edges. Graph classification involves graph-level feature extraction and feature classification, which can be integrated using graph convolutional neural networks (GCNNs). GCNN and its variants have distinct advantages in processing irregular data with graphical structures and have been employed in a number of EEG-based seizure detection studies. In the study by Zhao et al. [17], the raw EEG of each channel was used as the node features, and the Pearson correlation coefficients between channels were calculated as the adjacency matrix. The graphs were fed into the linear graph convolution network (LGCN) for further extraction and classification. Zeng et al. [18] proposed a seizure detection method based on the hierarchy graph convolution network (HGCN), where the node features of the graph were extracted from the time and frequency domains and the adjacency matrices of the graph were defined according to the longitudinal and transverse spatial relationships between channels, respectively. Raeisi et al. [19] developed a neonatal seizure detection method based on the GCNN. Three different measures were alternatively used to compute the adjacency matrices for the graph generation, namely the phase locking value (PLV), the magnitude squared coherence (MSC), and the spatial distance. Nelson et al. [20] proposed a neonatal seizure identification method using spectral and spatial graph neural networks (SSGNNs). Spectral and spatial GNNs were combined and optimized with the Aquila algorithm to enhance seizure detection accuracy in affected children. Despite the good results obtained with these graph-based methods, scant consideration has been paid to the variances of multi-channel interdependencies over different frequency bands and the effectiveness of graph embedding before final classification.
Given the aforementioned properties of existing methods, this paper proposes a novel graph-based method for neonatal seizure detection, focusing on the thorough representation and the adaptive classification of multi-channel EEG signals. In the graph generation section, the raw EEG is decomposed into a range of sub-band signals using wavelet packet decomposition (WPD), from which the temporal features within each channel and the synchronicity between different channels are extracted. Thus, for each EEG epoch, a set of band-wise graphs are constructed based on these narrowband features, which can provide more detailed information for classification. In the graph classification section, a novel network framework, namely the multi-band graph neural network (MBGNN), is developed to deal with the graph sets. In the MBGNN, the graph attention network (GAT) and the DIFFPOOL are combined to exploit the graph features and produce an effective graph embedding that preserves the graphical structure information. In addition, in order to take full advantage of the detailed information from different frequency bands, an attention mechanism is introduced in the proposed MBGNN. The multi-band graph embeddings are adaptively integrated through the band-wise attention mechanism, owing to which the classification performance of the MBGNN can be optimized for each object through the training process.
The rest of the paper is organized as follows: Section 2 introduces the EEG database used in this paper. The details of the proposed method will be described in Section 3, including the preprocessing step, the graph generation method, and the MBGNN model. Section 4 presents the experimental scheme and results. Section 5 discusses the advantages and disadvantages of the proposed study with previous studies, as well as the potential for future work. Section 6 concludes the study.
2. Database
In this study, a public neonatal EEG database [21], which was recorded at the University Hospital of Helsinki, is used for validation purposes. The database contains scalp EEG recordings from 79 term neonates. The recordings were manually annotated by three highly experienced clinical experts. A total of 343 seizures from 39 neonates WERE annotated consistently by all the three experts. EEG was recorded at a sampling rate of 256 Hz using the NicOne EEG amplifier with 19 electrodes positioned according to the international 10–20 system. A bipolar montage was generated for annotation according to the standard longitudinal bipolar layout: Fp2-F4, F4-C4, C4-P4, P4-O2, Fp1-F3, F3-C3, C3-P3, P3-O1, Fp2-F8, F8-T4, T4-T6, T6-O2, Fp1-F7, F7-T3, T3-T5, T5-O1, Fz-Cz, and Cz-Pz, as shown in Figure 1. More details about the above mentioned 39 neonates are given in Table 1.
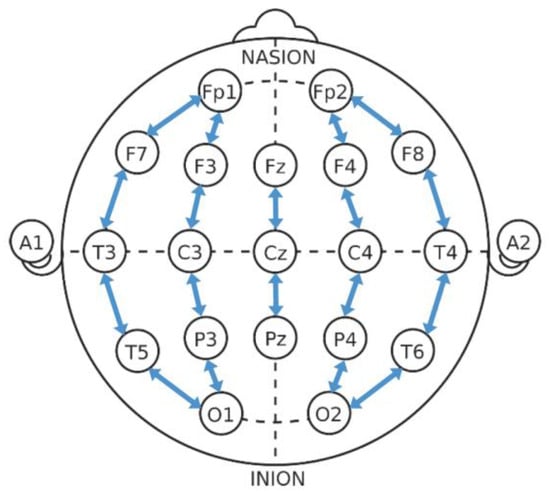
Figure 1.
Bipolar EEG montage of the 10–20 system.

Table 1.
Detailed information of the 39 neonates from the Helsinki database.
3. Methods
This section presents the methodology used for seizure detection in neonatal EEG. The overall pipeline of the proposed method is shown in Figure 2. Section 3.1 will address the preprocessing step of raw EEG. Section 3.2 and Section 3.3 will illustrate the graph generation scheme and the classification model, respectively.
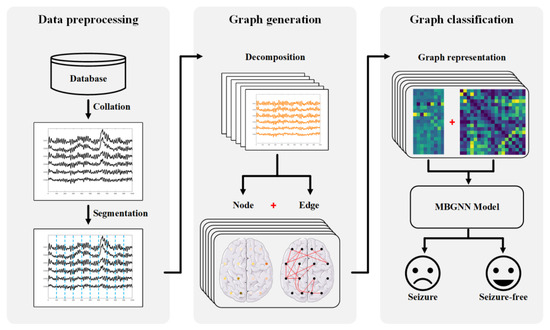
Figure 2.
Schematic of the proposed method for neonatal seizure detection.
3.1. Preprocessing
EEG preprocessing typically consists of two steps, the filtering step and the segmentation step. The filtering step can be omitted in this study since the frequency components below 0.5 Hz or above 32 Hz were excluded in the subsequent decomposition step by WPD. In the segmentation step, the EEG signals were segmented into non-overlapping epochs of 1 s so that a strict correspondence between EEG epochs and expert annotations could be achieved. Furthermore, the 1 s time window was chosen to ensure the quasi-stationarity property within the EEG epochs and to allow a time-varying analysis even for short seizures (about 10–20 s of time duration).
3.2. Graph Generation
3.2.1. Decomposition
In the EEG classification task, it is a routine practice to slice the continuous recordings into segments. In order to match the features for all segments, the consistency of the frequency range should be ensured when decomposing the segments into sub-band signals. WPD is a powerful decomposition method derived from wavelet decomposition (WD). In WPD, a complete binary tree is created by decomposing both detail coefficients and approximation coefficients of the previous level without omission or redundancy. As a result, WPD can provide a multi-scale signal set with higher frequency resolution and more detailed information.
Given that h and g are quadrature mirror filters associated with scaling function and mother wavelet function, the wavelet packet coefficients at the n-th node on the j-th level can be obtained by the following:
where k is the localization parameter and l is the time index. Accordingly, the reconstruction formula is given by the following:
In this paper, an 8-level WPD is implemented on the raw EEG signals with Daubechies 4 (db4) wavelet, which is widely used for analyzing EEG data, especially epileptic EEG [22,23,24]. According to the intrinsic frequency bands commonly used in human brain researches, the wavelet packet coefficients are combined to reconstruct the signals in six sub-bands that are sub-band 1 (0.5–3 Hz), sub-band 2 (3–8 Hz), sub-band 3 (8–14 Hz), sub-band 4 (14–20 Hz), sub-band 5 (20–26 Hz), and sub-band 6 (26–32 Hz).
3.2.2. Graph Edge Generation
The patterns of neural synchronization are considered to be an important indicator of consciousness function and dysfunction [25,26]. In this paper, the synchronization is calculated as the connection strength between different channels. Thus, a weighted graph can be constructed based on the connection matrix by considering each channel as a node. The PLV is a commonly used bivariate measurement that reflects the degree of phase synchronization in a particular frequency band.
Given that is the input time series signal, the Hilbert transform (HT) of is defined as follows:
where P denotes the Cauchy principal value [27]. The analytic representation of can be written as follows:
where A is the amplitude term and is the exponential term. is the instantaneous phase of at time point t, calculated by the following:
Given that and are the instantaneous phase of the input signal and at time point t, respectively, the instantaneous phase difference could be calculated by the following:
where and are the weights of phases which are both set to “1” here. Consequently, the PLV of the input signal and is the average of phase differences in a time window, calculated by the following:
where N is the window length and n is the time index in the window. The PLVs range from “0” to “1”, where “0” means two signals are completely asynchronized and “1” means two signals are fully synchronized.
3.2.3. Graph Node Generation
To complete the graph node representation of the EEG epochs, a set of features was extracted from each channel-wise time series. A total of 9 statistical features were combined as the node representation based on the following considerations. Firstly, the aim should be concentrated on characterizing the morphology of the time series since the raw EEG has been decomposed into narrowband signals. Secondly, it is necessary to exclude complex features so that the computation latency can be reduced for the real-time monitoring. Thirdly, the feature dimension should be restricted to mitigate the effect of the overfitting problem. Consequently, the node feature set includes the following features: the mean, the median, the standard deviation, the skewness, the kurtosis, the sum over the absolute value of consecutive changes, the complexity-invariant distance [28], the length of the longest consecutive subsequence above the mean, and the length of the longest consecutive subsequence below the mean.
3.3. Multi-Band Graph Neural Network
The architecture of the proposed multi-band graph neural network is shown in Figure 3. The front end of MBGNN is a multi-band graph convolution module with six channels for six sub-band graphs. Each route has a two-stack graph convolution and pooling structure consisting of GAT convolution layers and DIFFPOOL layers, where BN and ReLU stand for batch normalization layer and activation function layer, respectively. The back end of MBGNN is a successive chain of band-wise attention layer, linear layer, and softmax layer. Further details on model parameters are given in Table 2.
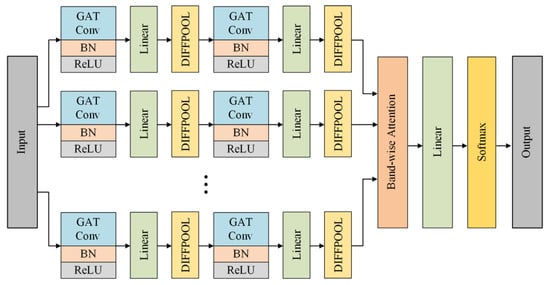
Figure 3.
Architecture of the proposed multi-band graph neural network with band-wise attention mechanism.
Table 2.
Individual layer parameters and sizes of MBGNN model.
The graph representations of the EEG epoch in each sub-band are separately fed to the graph convolution and graph pooling layers. Then, the band-wise attention layer is used to adaptively aggregate the high-level information of all bands. Finally, the aggregated information is forwarded to the softmax layer for classification. Details of the graph convolution, graph pooling and graph aggregation algorithms are given in the following subsections.
3.3.1. Graph Convolution
To comprehensively explore the structural evolution pattern of multi-channel EEG signals, the GAT [29] is employed as the front end of the proposed MBGNN. The GAT layer extracts information from multi-channel EEG signals by treating the channels as nodes and the correlation coefficients between channels as edges. In contrast to typical spatial graph convolution operations, such as GNN [30] and GraphSAGE [31], GAT implicitly assigns different convolution kernels to neighboring nodes through an attention mechanism, thus allowing an adaptive aggregation of neighborhood information. In other words, GAT fully takes into account the correlation differences between channel pairs during the advanced extraction of multi-channel EEG signals.
Suppose the input of a GAT layer is , where is the feature vector of the i-th node. Firstly, a linear transformation is applied to map the input features to higher-level features, parametrized by a shared weight matrix . Then, the self-attention coefficients are computed as follows:
where is the mapping of . The self-attention coefficient indicates the importance of the j-th node to the i-th node. Instead of allocating attention to all nodes in the graph, which results in a loss of structural information, the attention coefficients of the first-order neighbors are computed for each node as follows:
where represents the first-order neighbor set of the i-th node. After the application of nonlinearity with the LeakyReLU activation function, the fully expanded calculation of the attention coefficient can be expressed as follows:
where is the weight parameter of a single-layer feedforward neural network and represents the concatenation operation. To improve the fitting performance of the network, a multi-head attention mechanism is applied based on the above process. Consequently, the aggregated features produced by the GAT layer are given by the following:
where is an activation function, are normalized attention coefficients computed by the q-th attention mechanism, and is the weight matrix corresponding to the input linear transformation.
3.3.2. Graph Pooling
Based on the node-level representations produced by the GAT layer, a graph-level representation is required for the downstream classification task. The DIFFPOOL [32] is a hierarchical graph representation algorithm that maps graph nodes to a set of clusters using a differentiable soft cluster assignment method. Unlike the commonly used global pooling algorithms, the DIFFPOOL sequentially collapses nodes into smaller clusters until there is only a single node with the final embedding, which incorporates the topology information of the graph. Thus, the DIFFPOOL is used in the proposed MBGNN model to produce a coarsened input for the subsequent band-wise attention layer.
Suppose a graph is represented by a dense adjacency matrix and a feature matrix , where is the number of nodes and is the feature dimension. The DIFFPOOL operator at layer computes the updated versions of and as follows:
Specifically, a GNN architecture is duplicated to compute a new embedding and an assignment matrix as follows:
where is the number of nodes at layer , is the new number of nodes, and is the new feature dimension. The operator ends with the creation of the new node embedding matrix and the adjacency matrix, to be entered into the next layer:
where and .
3.3.3. Graph Aggregation
The attention mechanism in machine learning is an emulation of the human visual system, which aims to automatically extract the critical information for a given task. For the EEG classification task, the features of different frequency bands should be evaluated and flexibly integrated to provide the more distinguishable information. Thus, in this paper, a soft attention mechanism is used in the form of a multi-layer perceptron (MLP).
Supposing that is the output vector of the front-end graph network corresponding to the f-th sub-band EEG signal, the band-wise attention mechanism is defined as follows:
where and are trainable parameters. The integrated vector exported from the band-wise attention layer is forwarded to the linear layer and then to the softmax layer.
4. Experimental Results
The proposed MBGNN model is evaluated using 39 cases selected from the Helsinki database. The EEG epoch is labelled as a seizure epoch if all the three experts agreed; otherwise, it is labelled as a non-seizure epoch. A 10-fold cross validation is performed on each case independently. The dataset of each case was randomly divided into ten equal-sized folds. Each fold is used once for testing and the other nine for training, resulting in 10 different performance metrics that are gathered for a comprehensive assessment. The Adam algorithm [33] is used as the optimizer for model training, with the number of training epochs set to 200 and the learning rate set to 1 × 10⁻⁵.
Considering that the neonatal seizure detection is an imbalanced classification problem, the following metrics are generated to demonstrate the overall performance of the MBGNN model:
- Area under the receiver operating characteristic curve (AUC): The receiver operating characteristic (ROC) curve is a plot of sensitivity versus (1-specificity) and the AUC illustrates the performance of a binary classifier with varied decision threshold. The AUC values range from “0” to “1”, and an ideal classifier will have an AUC equal to “1”;
- Positive predictive value (PPV): The PPV is the probability that epochs with positive labels are truly seizure epochs. In this paper, the PPV illustrates the ability of a classifier to capture the real seizure epochs;
- Negative predictive value (NPV): The NPV is the probability that epochs with negative labels are truly non-seizure epochs. In this paper, the NPV illustrates the ability of a classifier to avoid false alarms.
As a note, the decision threshold for PPV and NPV is set according to the optimal Youden index [34]. All the metrics are given in the form of mean ± standard deviation. Table 3 presents the patient-specific classification performance of the proposed MBGNN model. In most cases, the MBGNN shows promising performance, with the PPV and NPV both exceeding 90% and close in value, which means the proposed method could identify seizure epochs accurately with few false alarms. In cases 11, 13, 20, and 23, the PPV and NPV values are relatively low or show significant imbalance, which hinders the overall performance of the proposed method to some extent. The mean AUC, PPV, and NPV in 39 neonates are 99.11%, 95.34%, and 96.66%, respectively.
Table 3.
Performance of MBGNN-based seizure detection method for 39 cases.
5. Discussion
In this paper, a novel graph-based method is proposed for the automated detection of neonatal seizures. Compared with existing graph-based methods, the emphasis of this work is on the graph embedding and the graph aggregation of different frequency bands.
Specifically, the GAT layer and the DIFFPOOL layer are serially stacked as the front end of the MBGNN model for the graph embedding. To visualize the effectiveness of the graph embedding, the input and the output data of the front end of MBGNN are extracted and transformed into 2D maps using the t-distributed stochastic neighbor embedding(t-SNE) method [35], respectively, as shown in Figure 4. The red and blue scattered points stand for the data of seizure and non-seizure samples, respectively. The distribution of scattered points in 2D maps visually reveals the separability of seizure and non-seizure samples before and after the graph embedding in different frequency bands.
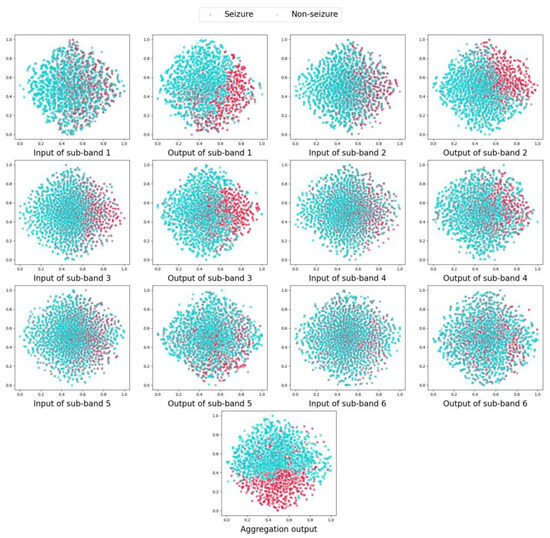
Figure 4.
Two-dimensional map of graph embeddings in MBGNN for ID 21.
As we can see, the seizure samples and the non-seizure samples of ID 21 are highly overlapped in the input maps of all sub-bands. After the graph embedding of the front end in MBGNN, the distribution of the output data has changed and varies across different sub-bands. The seizure samples and the non-seizure samples are significantly separated in sub-band 1, sub-band 2, and sub-band 3. However, there is still a wide overlapping range in the output maps of sub-band 4, sub-band 5, and sub-band 6. This indicates that the epileptic neuron disorder could be detected in particular frequency bands. Additionally, the frequency bands with abnormalities may differ among patients. Therefore, it is crucial to utilize the information from various frequency bands in a comprehensive and adaptive manner. In the proposed MBGNN model, the band-wise attention layer can innovatively handle the graph representations from different frequency bands. The output data of the front end are adaptively aggregated by the aggregation coefficients so that the data with better classification potential can be emphasized. The aggregation coefficients of 39 cases are given in Figure 5. As shown in the figure, the aggregation coefficients of six sub-bands vary across 39 cases, exhibiting varying degrees of contribution to the final classification. A higher aggregation coefficient, represented by a bigger proportion of the bar, indicates a stronger impact of the corresponding sub-band on the final decision. For ID 21, the aggregation coefficients of sub-band 1, sub-band 2, and sub-band 3 are significantly higher than those of the other sub-bands, which is consistent with the visualization result in Figure 4, where the distribution of seizure and non-seizure samples shows higher separability in these three sub-bands.
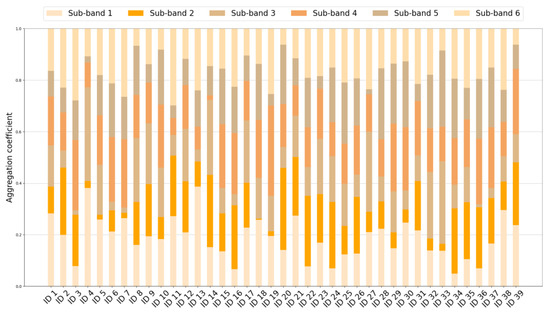
Figure 5.
Stacked bar chart of aggregation coefficients in MBGNN.
Seizure detection metrics in different frequency bands are calculated based on the single-channel version of MBGNN, which only analyzes the EEG graphs from a single band and removes the band-wise attention layer. The mean AUC, PPV, and NPV of 10-fold cross validation on 39 cases are presented as a box plot in Figure 6. As shown in the figure, the mean AUC, PPV, and NPV of 39 cases are relatively high in sub-band 5 (20–26 Hz) and sub-band 6 (26–32 Hz), with a smaller variance across different cases. The comparison results show that the high half range of the Beta band are most indicative of epileptic EEG in neonates. However, the accuracy and reliability of seizure detection using a single frequency band are significantly inferior to that of multiple frequency bands, which verifies the necessity of adaptive feature fusion of different frequency bands.
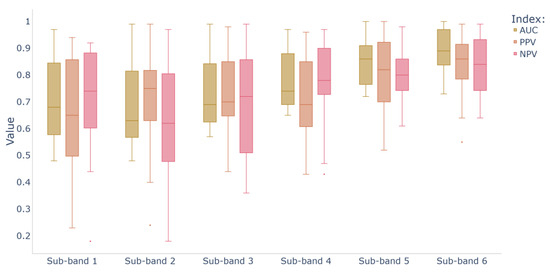
Figure 6.
Box plot of seizure detection metrics on 39 cases in different frequency bands.
The performance of the proposed method is compared with previous studies based on the Helsinki database, as shown in Table 4. In this study, the seizure detection is conducted in a patient-specific manner; thus, a 10-fold cross-validation is performed separately in each neonatal EEG case. The overall performance can be evaluated by the AUC value. Although most of the methods in the table achieve an AUC value higher than 90%, achieving an AUC value higher than 99% is quite a challenge.
It should also be noted that the performance of seizure detection methods could be affected by several other factors besides the classification model. In previous studies of seizure detection, the length of EEG epochs ranges from 0.5 s to 32 s [4,15,19,36,37,38]. A relatively short epoch (i.e., 0.5 s) [37] has difficulty providing useful EEG features of seizure states since plenty of low-frequency components are contained in scalp EEG, which may result in a lower PPV. On the other side, a long EEG epoch could provide sufficient information for classification but may result in long latency and low temporal precision in real-time EEG monitoring. In this study, the length of EEG epochs is set to 1 s, and the proposed seizure detection method achieves a relatively high PPV of 95.34%.
The imbalance between seizure and non-seizure epochs is another factor that can affect the detection performance. Traditional classifiers may be biased towards the majority class, thus producing poor predictive accuracy over the minority class. Tanveer et al. [16] used a half-overlapping segmentation for seizure regions and a non-overlapping segmentation for non-seizure regions, as such doubling the total number of seizure epochs. They achieved a PPV of 96.7% and a NPV of 95.9%. In this study, a non-overlapping segmentation is used for both seizure and non-seizure regions. The separability of the data is enhanced by the multi-band feature extraction method and the band-wise attention mechanism, which effectively alleviates the imbalance problem. The PPV and NPV of the proposed method are 95.34% and 96.66%, respectively.
The label quality also potentially influences the detection performance. The recordings in Helsinki database were manually annotated by three highly experienced clinical experts. Tanveer et al. [16] proposed an ensemble model composed of three CNN models which were trained separately using the annotations of three experts. In the study of Caliskan et al. [39], the EEG epoch was labelled as a seizure epoch if at least two experts agreed; otherwise, it was labelled as a non-seizure epoch. Zhou et al. [40] also used “majority principle” in the label processing and selected patients whose annotations are relatively consistent among the three experts. In this study, the EEG epoch is labelled as a seizure epoch if all the three experts agreed; otherwise, it is labelled as a non-seizure epoch. The labelling scheme in this study ensures the quality of the seizure sample set but may reduce the quality of the non-seizure sample set and decrease detection performance in a few cases.
Table 4.
Performance comparison of different methods on the Helsinki database.
Table 4.
Performance comparison of different methods on the Helsinki database.
| Author | Subject | Method | Validation | AUC (%) |
|---|---|---|---|---|
| Tapani et al. [9] | 79 | SVM | Leave-one-out cross-validation | 95.7 |
| O’Shea et al. [15] | 79 | 2D CNN | Leave-one-out cross-validation | 95.6 |
| Caliskan et al. [39] | 39 | Pretrained DCNN | Training (50%) and test (50%) | 99.2 |
| Tanveer et al. [16] | 39 | Ensemble 2D CNN | 10-fold cross-validation | 99.3 |
| Abbas et al. [41] | 14 | t-test and ROC analysis | - | 77.9 |
| Raeisi et al. [19] | 39 | GCNN | Leave-one-out cross-validation | 94.7 |
| Diykh et al. [42] | 39 | Ensemble classifiers | Leave-one-out cross-validation | 94.0 |
| Zhou et al. [40] | 15 | LMA-EEGNet | 5-fold cross-validation | 98.6 |
| Nelson et al. [20] | - | SSGNN | K-fold cross-validation | 97.5 |
| Proposed method | 39 | MBGNN | 10-fold cross-validation | 99.1 |
6. Conclusions
Manual inspection of long-term EEG recordings to detect neonatal seizure events is challenging and inefficient for the NICU. This study has presented a graph-based method for automated neonatal seizure detection. Unlike existing graph-based methods, we innovatively employed a band-wise EEG classification scheme to fully exploit the multi-band EEG information by combining the band-wise feature extraction method and the MBGNN model. For each EEG epoch, a set of band-wise graph representations were constructed based on the temporal features within each channel and the synchronicity between different channels. In the classification section, the proposed MBGNN model transformed the multi-band graph representations into an aggregated graph embedding via the GAT, the DIFFPOOL, and the band-wise aggregation algorithm. The proposed method was tested on the Helsinki database using the 10-fold cross validation method and compared with related works on the same database. The proposed method shows a promising performance in neonatal seizure detection and could provide a new sight for EEG-related research.
Author Contributions
Conceptualization, L.T.; methodology, L.T.; investigation, L.T. and M.Z.; writing—original draft, L.T.; supervision, M.Z. All authors have read and agreed to the published version of the manuscript.
Funding
This research received no external funding.
Institutional Review Board Statement
Not applicable.
Informed Consent Statement
Not applicable.
Data Availability Statement
The Helsinki database is open-access and available on the website: https://zenodo.org/records/2547147 (accessed on 19 April 2023).
Acknowledgments
This research was supported in parts by Changzhou Key Laboratory of Biomedical Information Technology.
Conflicts of Interest
The authors declare no conflicts of interest.
References
- Bye, A.M.E.; Flanagan, D. Spatial and Temporal Characteristics of Neonatal Seizures. Epilepsia 1995, 36, 1009–1016. [Google Scholar] [CrossRef] [PubMed]
- Wietstock, S.O.; Bonifacio, S.L.; Sullivan, J.E.; Nash, K.B.; Glass, H.C. Continuous Video Electroencephalographic (EEG) Monitoring for Electrographic Seizure Diagnosis in Neonates: A Single-Center Study. J. Child Neurol. 2016, 31, 328–332. [Google Scholar] [CrossRef] [PubMed]
- Liu, A.; Hahn, J.S.; Heldt, G.P.; Coen, R.W. Detection of Neonatal Seizures through Computerized EEG Analysis. Electroencephalogr. Clin. Neurophysiol. 1992, 82, 30–37. [Google Scholar] [CrossRef] [PubMed]
- Gotman, J.; Flanagan, D.; Zhang, J.; Rosenblatt, B. Automatic Seizure Detection in the Newborn: Methods and Initial Evaluation. Electroencephalogr. Clin. Neurophysiol. 1997, 103, 356–362. [Google Scholar] [CrossRef] [PubMed]
- Navakatikyan, M.A.; Colditz, P.B.; Burke, C.J.; Inder, T.E.; Richmond, J.; Williams, C.E. Seizure Detection Algorithm for Neonates Based on Wave-Sequence Analysis. Clin. Neurophysiol. 2006, 117, 1190–1203. [Google Scholar] [CrossRef]
- Deburchgraeve, W.; Cherian, P.J.; De Vos, M.; Swarte, R.M.; Blok, J.H.; Visser, G.H.; Govaert, P.; Van Huffel, S. Automated Neonatal Seizure Detection Mimicking a Human Observer Reading EEG. Clin. Neurophysiol. 2008, 119, 2447–2454. [Google Scholar] [CrossRef]
- Thomas, E.M.; Temko, A.; Lightbody, G.; Marnane, W.P.; Boylan, G.B. Gaussian Mixture Models for Classification of Neonatal Seizures Using EEG. Physiol. Meas. 2010, 31, 1047–1064. [Google Scholar] [CrossRef]
- Temko, A.; Thomas, E.; Marnane, W.; Lightbody, G.; Boylan, G. EEG-Based Neonatal Seizure Detection with Support Vector Machines. Clin. Neurophysiol. 2011, 122, 464–473. [Google Scholar] [CrossRef]
- Tapani, K.T.; Vanhatalo, S.; Stevenson, N.J. Time-Varying EEG Correlations Improve Automated Neonatal Seizure Detection. Int. J. Neural Syst. 2019, 29, 1850030. [Google Scholar] [CrossRef]
- Zhou, M.; Duan, N.; Liu, S.; Shum, H.-Y. Progress in Neural NLP: Modeling, Learning, and Reasoning. Engineering 2020, 6, 275–290. [Google Scholar] [CrossRef]
- Nazir, S.; Dickson, D.M.; Akram, M.U. Survey of Explainable Artificial Intelligence Techniques for Biomedical Imaging with Deep Neural Networks. Comput. Biol. Med. 2023, 156, 106668. [Google Scholar] [CrossRef] [PubMed]
- Chan, K.Y.; Abu-Salih, B.; Qaddoura, R.; Al-Zoubi, A.M.; Palade, V.; Pham, D.-S.; Ser, J.D.; Muhammad, K. Deep Neural Networks in the Cloud: Review, Applications, Challenges and Research Directions. Neurocomputing 2023, 545, 126327. [Google Scholar] [CrossRef]
- Islam, M.M.; Nooruddin, S.; Karray, F.; Muhammad, G. Human Activity Recognition Using Tools of Convolutional Neural Networks: A State of the Art Review, Data Sets, Challenges, and Future Prospects. Comput. Biol. Med. 2022, 149, 106060. [Google Scholar] [CrossRef]
- Ansari, A.H.; Cherian, P.J.; Caicedo, A.; Naulaers, G.; Vos, M.D.; Huffel, S.V. Neonatal Seizure Detection Using Deep Convolutional Neural Networks. Int. J. Neural Syst. 2019, 29, 1850011. [Google Scholar] [CrossRef] [PubMed]
- O’Shea, A.; Lightbody, G.; Boylan, G.; Temko, A. Neonatal Seizure Detection from Raw Multi-Channel EEG Using a Fully Convolutional Architecture. Neural Netw. 2020, 123, 12–25. [Google Scholar] [CrossRef] [PubMed]
- Tanveer, M.A.; Khan, M.J.; Sajid, H.; Naseer, N. Convolutional Neural Networks Ensemble Model for Neonatal Seizure Detection. J. Neurosci. Methods 2021, 358, 109197. [Google Scholar] [CrossRef]
- Zhao, Y.; Dong, C.; Zhang, G.; Wang, Y.; Chen, X.; Jia, W.; Yuan, Q.; Xu, F.; Zheng, Y. EEG-Based Seizure Detection Using Linear Graph Convolution Network with Focal Loss. Comput. Methods Programs Biomed. 2021, 208, 106277. [Google Scholar] [CrossRef]
- Zeng, D.; Huang, K.; Xu, C.; Shen, H.; Chen, Z. Hierarchy Graph Convolution Network and Tree Classification for Epileptic Detection on Electroencephalography Signals. IEEE Trans. Cogn. Dev. Syst. 2021, 13, 955–968. [Google Scholar] [CrossRef]
- Raeisi, K.; Khazaei, M.; Croce, P.; Tamburro, G.; Comani, S.; Zappasodi, F. A Graph Convolutional Neural Network for the Automated Detection of Seizures in the Neonatal EEG. Comput. Methods Programs Biomed. 2022, 222, 106950. [Google Scholar] [CrossRef]
- Nelson, M.; Rajendran, S.; Khalaf, O.I.; Hamam, H.; Nelson, M.; Rajendran, S.; Khalaf, O.I.; Hamam, H. Deep-Learning-Based Intelligent Neonatal Seizure Identification Using Spatial and Spectral GNN Optimized with the Aquila Algorithm. MATH 2024, 9, 19645–19669. [Google Scholar] [CrossRef]
- Stevenson, N.J.; Tapani, K.; Lauronen, L.; Vanhatalo, S. A Dataset of Neonatal EEG Recordings with Seizure Annotations. Sci. Data 2019, 6, 190039. [Google Scholar] [CrossRef]
- Song, M.; Li, L.; Guo, J.; Liu, T.; Li, S.; Wang, Y.; Qurat Ul Ain; Wang, J. A New Method for Muscular Visual Fatigue Detection Using Electrooculogram. Biomed. Signal Process. Control 2020, 58, 101865. [Google Scholar] [CrossRef]
- Safder, S.N.-U.-H.; Akram, M.U.; Dar, M.N.; Khan, A.A.; Khawaja, S.G.; Subhani, A.R.; Niazi, I.K.; Gul, S. Analysis of EEG Signals Using Deep Learning to Highlight Effects of Vibration-Based Therapy on Brain. Biomed. Signal Process. Control 2023, 83, 104605. [Google Scholar] [CrossRef]
- Faust, O.; Acharya, U.R.; Adeli, H.; Adeli, A. Wavelet-Based EEG Processing for Computer-Aided Seizure Detection and Epilepsy Diagnosis. Seizure 2015, 26, 56–64. [Google Scholar] [CrossRef] [PubMed]
- Light, G.A.; Hsu, J.L.; Hsieh, M.H.; Meyer-Gomes, K.; Sprock, J.; Swerdlow, N.R.; Braff, D.L. Gamma Band Oscillations Reveal Neural Network Cortical Coherence Dysfunction in Schizophrenia Patients. Biol. Psychiatry 2006, 60, 1231–1240. [Google Scholar] [CrossRef] [PubMed]
- Uhlhaas, P.J.; Singer, W. Neural Synchrony in Brain Disorders: Relevance for Cognitive Dysfunctions and Pathophysiology. Neuron 2006, 52, 155–168. [Google Scholar] [CrossRef]
- Huang, N.E.; Shen, Z.; Long, S.R.; Wu, M.C.; Shih, H.H.; Zheng, Q.; Yen, N.C.; Tung, C.C.; Liu, H.H. The empirical mode decomposition and the Hilbert spectrum for nonlinear and non-stationary time series analysis. Proc. R. Soc. London. Ser. Math. Phys. Eng. Sci. 1998, 454, 903–995. [Google Scholar] [CrossRef]
- Batista, G.E.A.P.A.; Keogh, E.J.; Tataw, O.M.; de Souza, V.M.A. CID: An Efficient Complexity-Invariant Distance for Time Series. Data Min. Knowl. Disc. 2014, 28, 634–669. [Google Scholar] [CrossRef]
- Veličković, P.; Cucurull, G.; Casanova, A.; Romero, A.; Liò, P.; Bengio, Y. Graph Attention Networks. arXiv 2018, arXiv:1710.10903. [Google Scholar] [CrossRef]
- Hechtlinger, Y.; Chakravarti, P.; Qin, J. A Generalization of Convolutional Neural Networks to Graph-Structured Data. arXiv 2017, arXiv:1704.08165. [Google Scholar] [CrossRef]
- Hamilton, W.L.; Ying, R.; Leskovec, J. Inductive Representation Learning on Large Graphs. arXiv 2017, arXiv:1706.02216. [Google Scholar] [CrossRef]
- Ying, R.; You, J.; Morris, C.; Ren, X.; Hamilton, W.L.; Leskovec, J. Hierarchical Graph Representation Learning with Differentiable Pooling. Adv. Neural Inf. Process. Syst. 2018, 31. [Google Scholar] [CrossRef]
- Kingma, D.P.; Ba, J. Adam: A Method for Stochastic Optimization. arXiv 2014, arXiv:1412.6980. [Google Scholar] [CrossRef]
- Fluss, R.; Faraggi, D.; Reiser, B. Estimation of the Youden Index and Its Associated Cutoff Point. Biom. J. 2005, 47, 458–472. [Google Scholar] [CrossRef]
- Shi, S. Visualizing Data Using GTSNE. arXiv 2021, arXiv:2108.01301. [Google Scholar] [CrossRef]
- Usman, S.M.; Usman, M.; Fong, S. Epileptic Seizures Prediction Using Machine Learning Methods. Comput. Math. Methods Med. 2017, 9074759. [Google Scholar] [CrossRef]
- Emami, A.; Kunii, N.; Matsuo, T.; Shinozaki, T.; Kawai, K.; Takahashi, H. Seizure Detection by Convolutional Neural Network-Based Analysis of Scalp Electroencephalography Plot Images. NeuroImage Clin. 2019, 22, 101684. [Google Scholar] [CrossRef]
- Açıkoğlu, M.; Tuncer, S.A. Incorporating Feature Selection Methods into a Machine Learning-Based Neonatal Seizure Diagnosis. Med. Hypotheses 2020, 135, 109464. [Google Scholar] [CrossRef]
- Caliskan, A.; Rencuzogullari, S. Transfer Learning to Detect Neonatal Seizure from Electroencephalography Signals. Neural Comput. Applic. 2021, 33, 12087–12101. [Google Scholar] [CrossRef]
- Zhou, W.; Zheng, W.; Feng, Y.; Li, X. LMA-EEGNet: A Lightweight Multi-Attention Network for Neonatal Seizure Detection Using EEG Signals. Electronics 2024, 13, 2354. [Google Scholar] [CrossRef]
- Abbas, A.K.; Azemi, G.; Ravanshadi, S.; Omidvarnia, A. An EEG-Based Methodology for the Estimation of Functional Brain Connectivity Networks: Application to the Analysis of Newborn EEG Seizure. Biomed. Signal Process. Control 2021, 63, 102229. [Google Scholar] [CrossRef]
- Diykh, M.; Miften, F.S.; Abdulla, S.; Deo, R.C.; Siuly, S.; Green, J.H.; Oudahb, A.Y. Texture Analysis Based Graph Approach for Automatic Detection of Neonatal Seizure from Multi-Channel EEG Signals. Measurement 2022, 190, 110731. [Google Scholar] [CrossRef]
Disclaimer/Publisher’s Note: The statements, opinions and data contained in all publications are solely those of the individual author(s) and contributor(s) and not of MDPI and/or the editor(s). MDPI and/or the editor(s) disclaim responsibility for any injury to people or property resulting from any ideas, methods, instructions or products referred to in the content. |
© 2024 by the authors. Licensee MDPI, Basel, Switzerland. This article is an open access article distributed under the terms and conditions of the Creative Commons Attribution (CC BY) license (https://creativecommons.org/licenses/by/4.0/).