

The Assessment of the Influence of Low-Frequency Electromagnetic Fields Originated from the Power Infrastructure on Humans’ Health
 , ,
, ,  ,
, 
Abstract
1. Introduction
2. Materials and Methods
3. Results
3.1. Measurements of the EMF Strength around Energy Infrastructure
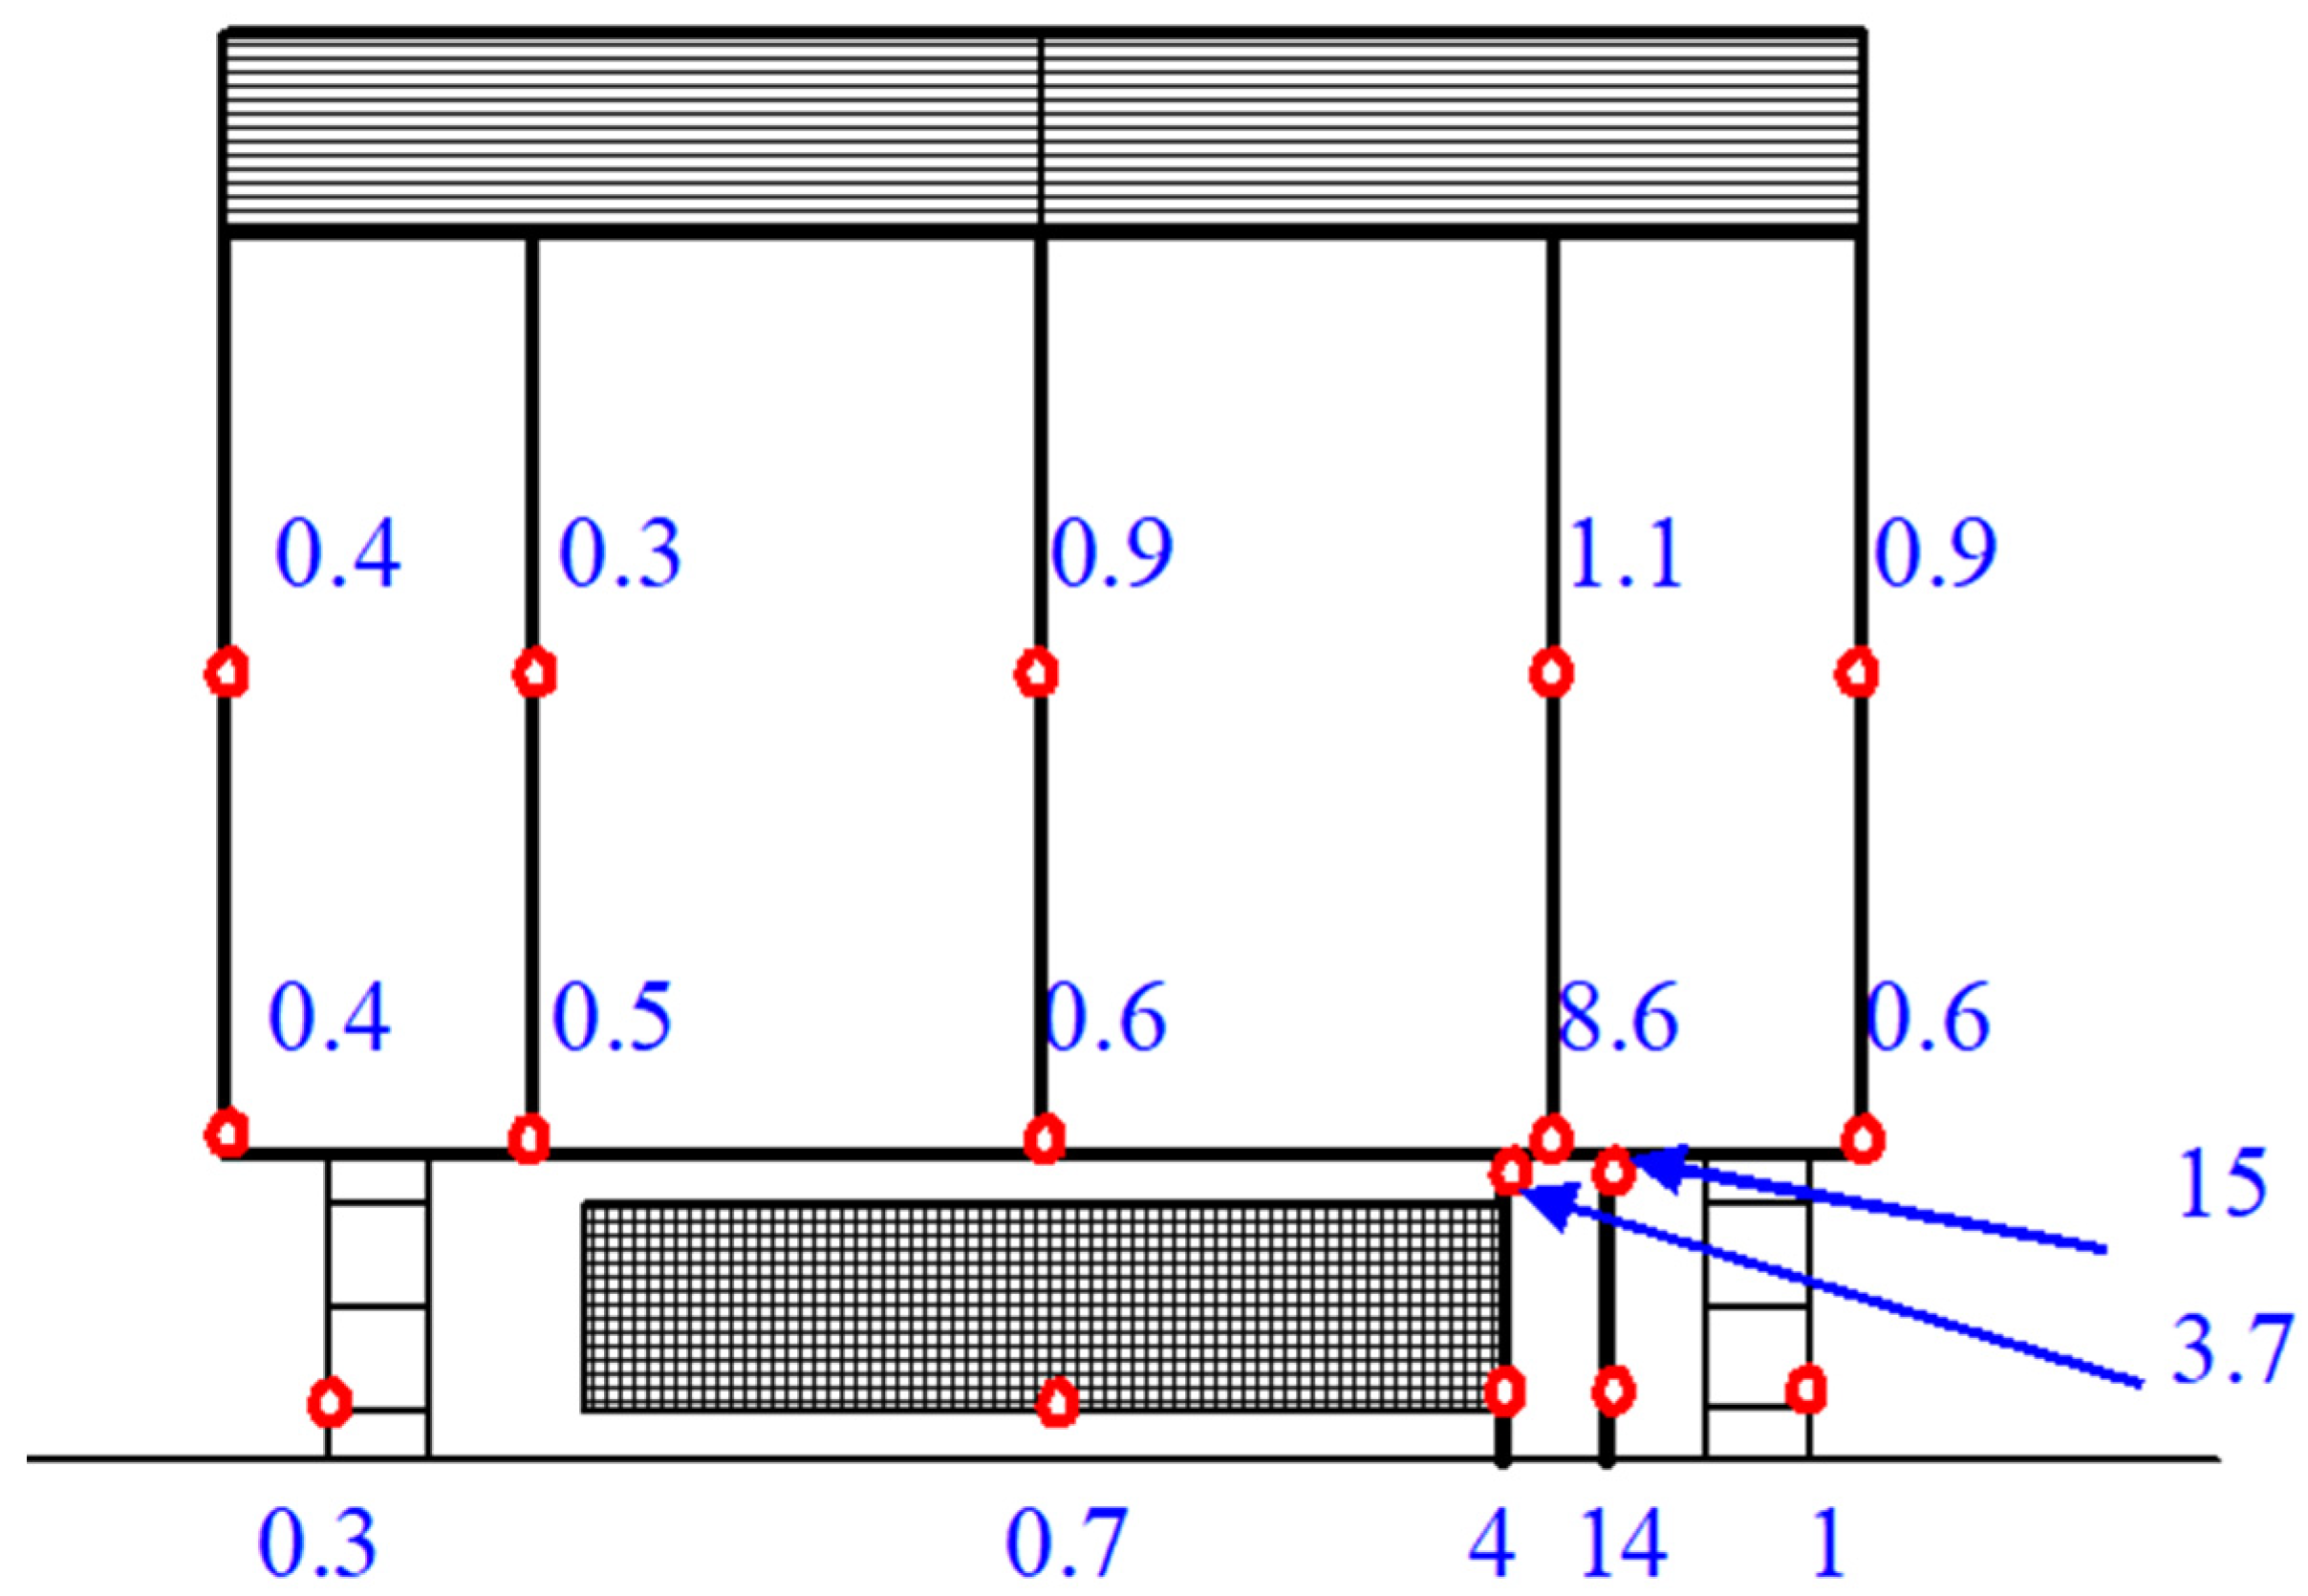
- A multi-family building with balconies near 110 kV overhead line: Measurements of the vertical component of E were taken under a high-voltage line at a height of 2 m above the ground on a straight line connecting the power pole with the corner of the building, near the pole and on the balcony on the fourth floor. The E values at a height of 2 m above the ground do not exceed 0.5 kV/m. Higher field intensities were measured at a distance of 2 m from the balcony grate, i.e., 1.8 kV/m, and above the balcony balustrade, 1 kV/m;
- An office space with inappropriate equipotential bonding: The highest B values were found in the room near the computer monitor screen (0.58 μT). At a distance of 0.1 m from the monitor surface, the value of B is reduced to 0.3 μT. Higher B values were noted in rooms through which the gas connection made of steel pipe passed. The probable cause of the observed phenomenon was the lack of an insulating insert on the gas connection or incorrectly made equalization connections in the building. The MFs measured directly on the pipe surface outside the building reached B ≈ 5 μT, which is the result of the main frequency current flow;
- A room above the MV/LV indoor station: Measurements were performed on the floor surface above the room where the 15/0.4 kV transformer was installed. The highest H of about 4 A/m was found for f of 50 Hz with a current flow in the order of 200 A in the busbars. The reinforcement elements of the ceiling of the transformer room caused EF to be damped to a level of only 0.005 kV/m;
- An LV switchboard: The MF did not exceed B ≈ 20 μT, which corresponds to H of 16 A/m. The highest field value was measured outside the switchboard cover. The H values above the top and bottom edge of the cover are 8.8 A/m and 12 A/m, respectively. On the other hand, H in front of the computer screen is 3 A/m, and at the window, it is 6 A/m. For comparison, only 0.3 A/m was measured at the entrance door to the room behind which the switchboard is located. This result clearly locates the source of the MF in the switchboard.
3.2. Numerical Simulations of Electric and Magnetic Field Intensities around Energy Infrastructure
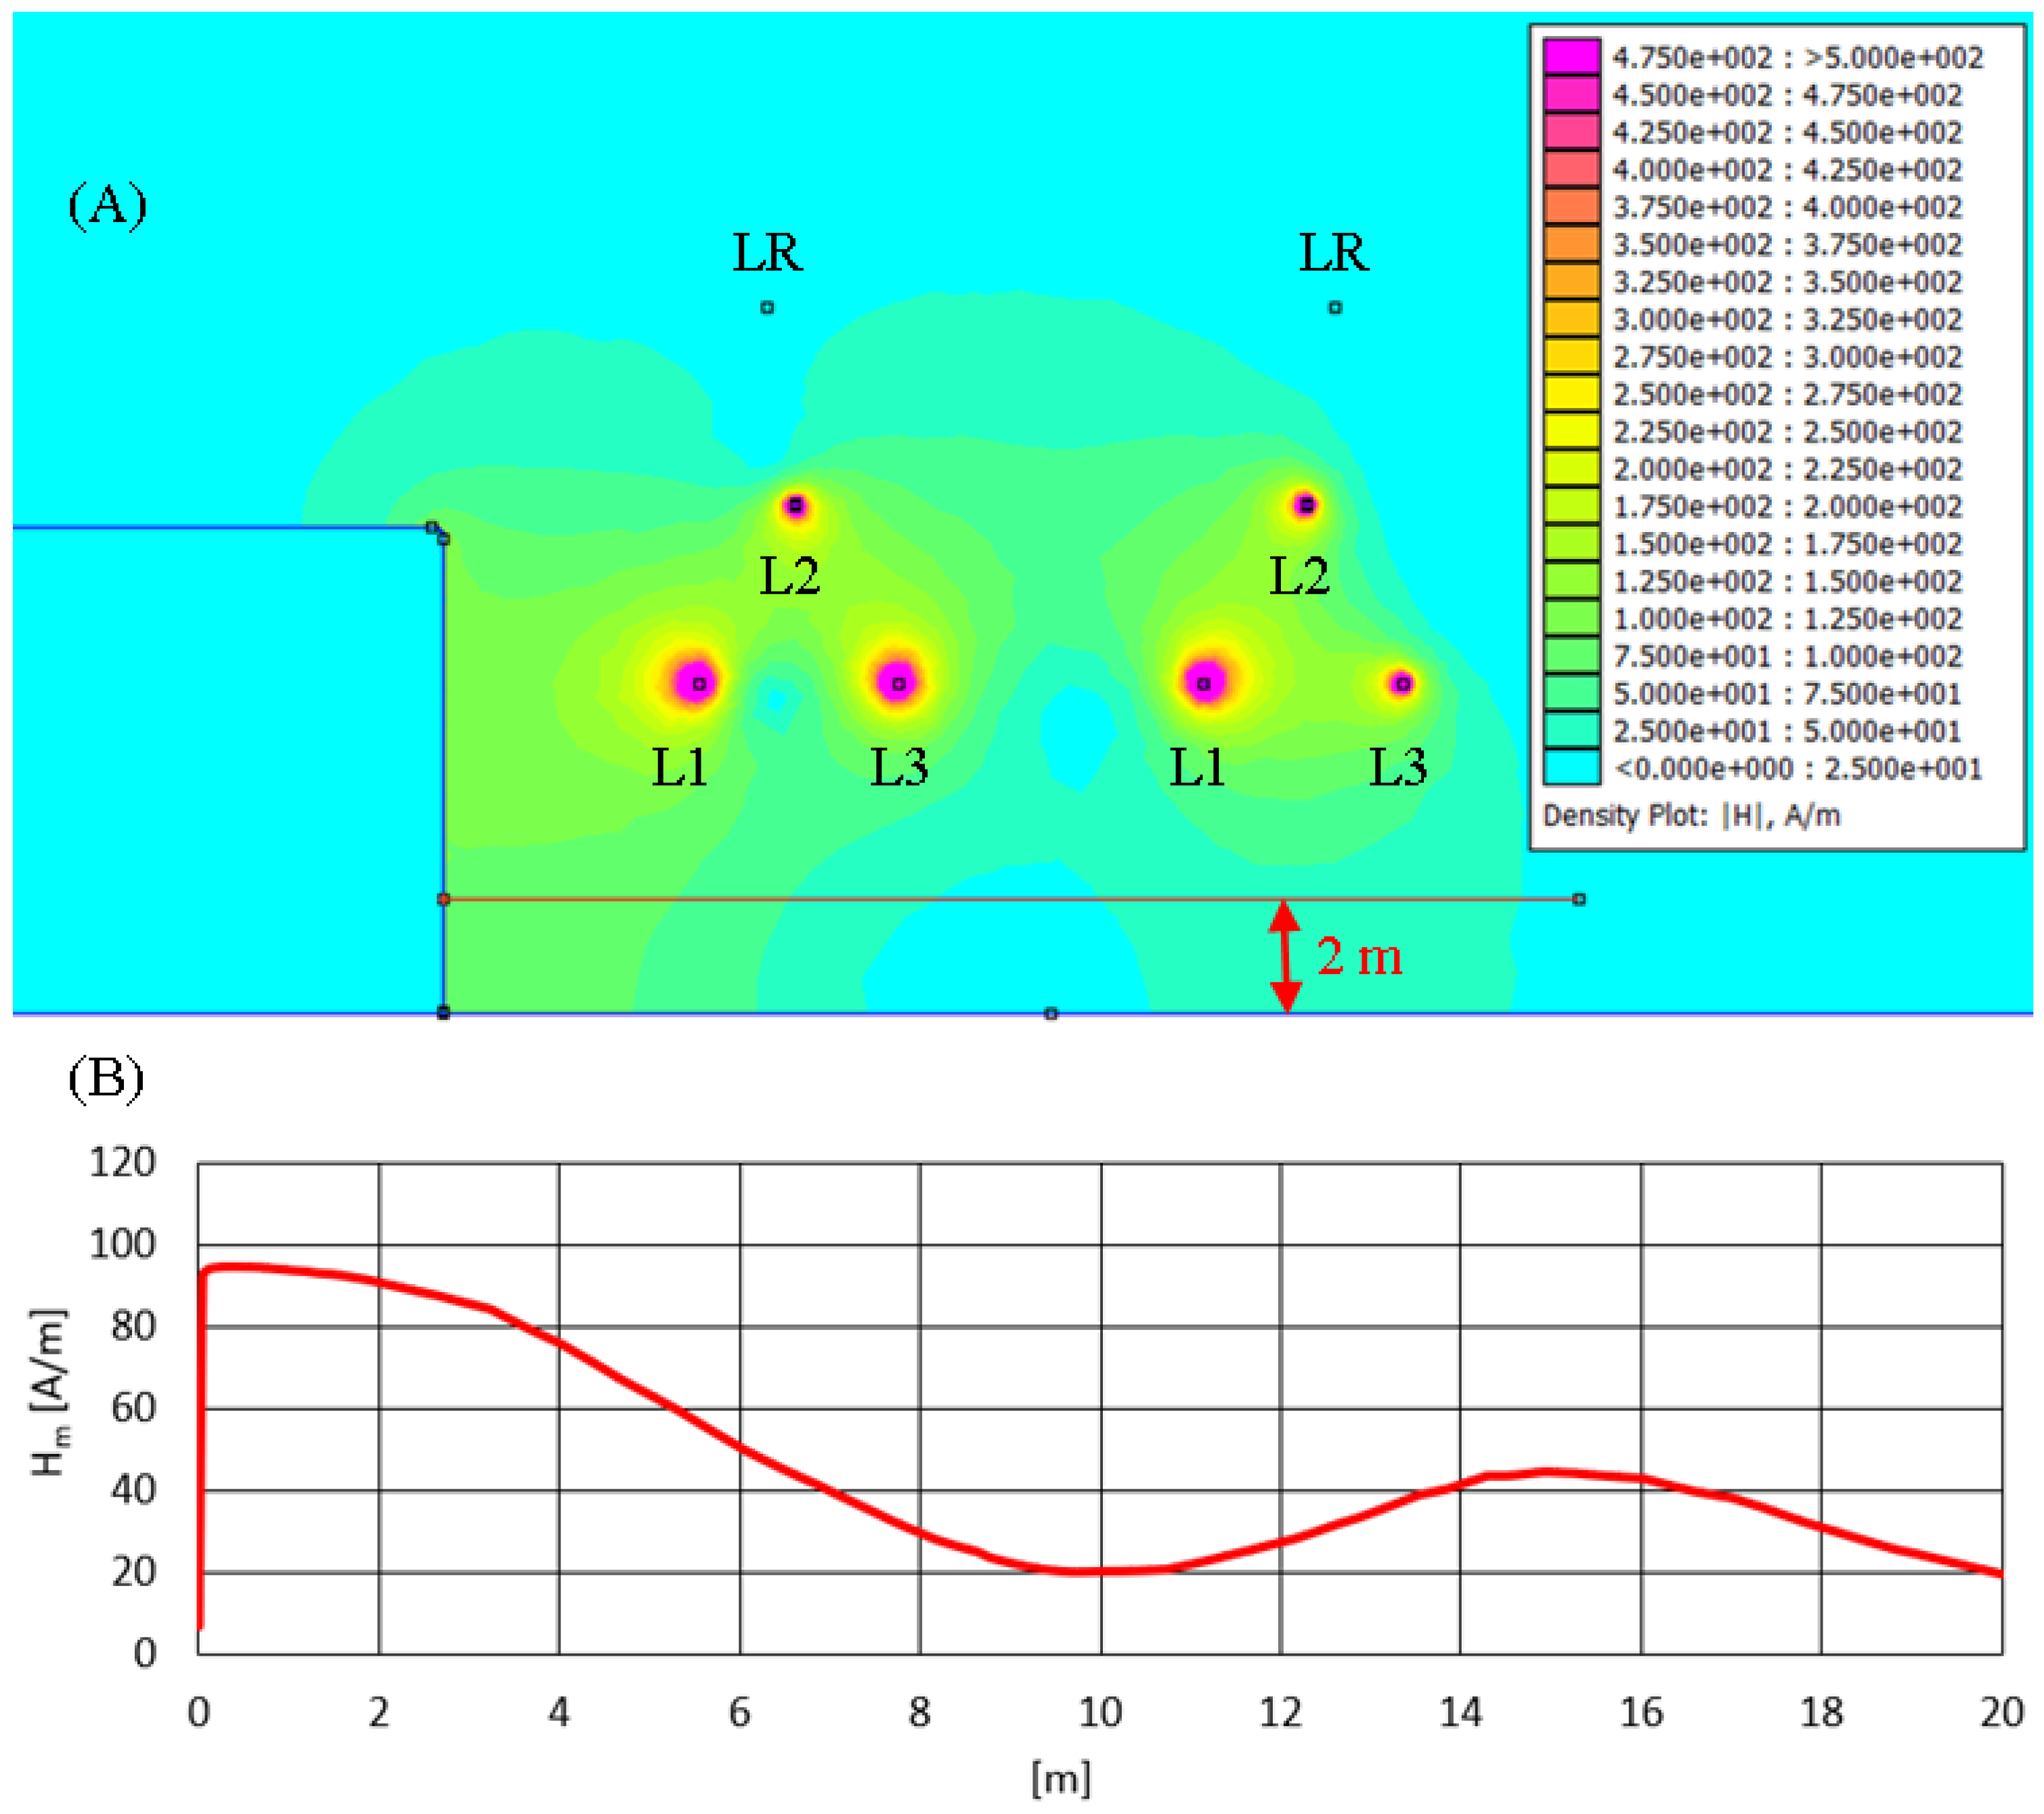
- A multi-family building with balconies near double-track 110 kV overhead lines: The analysis was carried out under the following assumptions: the building on the side of the line has balconies placed, according to the design, at a minimum distance of 6 m from the line (horizontal projection). The double-circuit line is characterized by the following technical parameters of poles and conductors (the heights of suspension are given in relation to the base of the poles, taking into account the dimensions of the insulators): OS24 P+5-type poles, a suspension height of the lowest conductor of 19.4 m and a span length equal to 240 m. The minimum suspension height of the lowest phase wire was estimated at 11.9 m. For the line located closer to the building, the maximum phase current value is 460 A. For the other line, the maximum phase current value is 230.0 A;
- A shopping center under a 110 kV overhead line: A commercial building located partially under a high-voltage line with the following parameters: an SW24 ON120+10 pole with a suspension height of the lowest conductor of 23.9 m and an S24 ON120+10 pole with a suspension height of the lowest conductor of 21.8 m. In the analyzed case, the span length was 256.1 m. The value of the long-term current-carrying capacity in the phase cables was 634 A. For the simulation purposes, the maximum permissible cable proximity of 6.4 m to the roof of the building was assumed;
- A residential building next to double-track overhead 110 kV lines: A single-family house located in the vicinity of a 110 kV double-circuit overhead line. The minimum distance of the building wall from the extreme high-voltage line wire is 7.4 m. Line parameters: OS24 P-type pole with a suspension height of the lowest wire of 15 m and OS24 ON150-type pole with a suspension height of the lowest wire of 12 m, a span length is 215 m. The minimum suspension height of the lowest phase wire was estimated at 8.05 m. In order to tighten the simulation results, the highest effective value of the phase voltage of 68.4 kV was assumed in the L1-phase wires (based on energy quality measurements, the average value of the phase-to-phase voltage was 118.4 kV). In the remaining L2- and L3-phase wires, the values then occur at (–34.2) kV. The maximum phase current values for the first and the second circuit are 437.1 A and 310.1 A, respectively;
- Parking under a 110 kV overhead line: Parking for cars and trucks located under a 110 kV high-voltage line with the following parameters: a maximum long-term load capacity of 709 A. The minimum suspension height was determined on the basis of geodetic measurements carried out at a temperature of 2 °C. For phase L1 (–3.37 m from the line axis) and L3 (3.13 m from the line axis), the suspension height was 12.28 m, and for phase L2 (2.32 m from the line axis), the suspension height was determined at 15.76 m. The obtained heights were reduced by a distance of 1.3 m, which results from a higher temperature of the conductor or catastrophic conditions;
- Terraced buildings near 110 kV double-track overhead lines: A residential building located 9 m from the extreme conductor (phase L1) of a double-circuit overhead line with a voltage of 110 kV. The analyzed line section is characterized by the following parameters: an AEG ON-type pole with a suspension height of the lowest conductor of 12.65 m and an AEG O-type pole for which the suspension height of the lowest conductor is 14.75 m (the suspension heights are given in relation to the base of the poles, taking into account the dimensions of the insulators), a span length of 131.14 m. The minimum suspension height was estimated as 9.5 m. A maximum current of 475 A was assumed in each of the line circuits;
- A multi-family building with balconies near a 15 kV overhead line: A residential building constructed 3.8 m from the end pole of the 15 kV MV overhead line. A medium-voltage line terminated with a Kgo-13.5/25 MV cable connection. The long-term load capacity of the investigated line was equal to 280 A;
- A multi-family building under a 110 kV overhead line: A residential building for which the smallest distance to the extreme conductors of the 110 kV HV line is 6.12 m. The analyzed line section is characterized by the following parameters: an SW24 ON120+5-type pole with a suspension height of 70.36 m and an SW24 KN60+10-type pole with a suspension height of 43.58 m (the suspension heights are given in relation to the zero reference level defined by sea level). The minimum suspension height over the analyzed building was estimated as 53.3 m. A maximum current of 675 A was assumed in each of the line circuits.
4. Discussion
4.1. The Overview of Legal Regulations and Standards
4.2. The Impact of LF EMF on Humans
5. Conclusions
Author Contributions
Funding
Institutional Review Board Statement
Informed Consent Statement
Data Availability Statement
Conflicts of Interest
Abbreviations
| B | magnetic induction |
| B2m | magnetic induction at height of 2 m |
| Bmax | the maximum value of magnetic induction |
| E | intensity of electric field |
| E2m | intensity of electric field at height of 2 m |
| Emax | the maximum value of intensity of electric field |
| EF | electric field |
| EMF | electromagnetic field |
| EMR | electromagnetic radiation |
| f | frequency |
| H | intensity of magnetic field |
| H2m | intensity of magnetic field at height of 2 m |
| Hmax | the maximum value of intensity of magnetic field |
| LF EMF | low-frequency electromagnetic field |
| MF | magnetic field |
References
- Guidelines for Limiting Exposure to Electromagnetic Fields (100 kHz to 300 GHz). Available online: https://ntnuopen.ntnu.no/ntnu-xmlui/handle/11250/2737117 (accessed on 14 October 2024).
- Szuba, M. Linie i Stacje Elektroenergetyczne w Środowisku Człowieka; Informator PSE-Operator SA: Warszawa, Poland, 2008. [Google Scholar]
- Saliev, T.; Begimbetova, D.; Masoud, A.-R.; Matkarimov, B. Biological effects of non-ionizing electromagnetic fields: Two sides of a coin. Prog. Biophys. Mol. Biol. 2018, 141, 25–36. [Google Scholar] [CrossRef] [PubMed]
- Wertheimer, N.; Savitz, D.A.; Leeper, E. Childhood cancer in relation to indicators of magnetic fields from current sources. Bioelectromagnetics 1995, 16, 86–96. [Google Scholar] [CrossRef] [PubMed]
- Wertheimer, N.; Leeper, E. Electrical wiring configurations and childhood cancer. Am. J. Epidemiol. 1979, 109, 273–284. [Google Scholar] [CrossRef] [PubMed]
- Savitz, D.A.; Wachtel, H.; Barnes, F.A.; John, E.M.; Tvrdik, J.G. Case-control study of childhood cancer and exposure to 60-hz magnetic fields. Am. J. Epidemiol. 1988, 128, 21–38. [Google Scholar] [CrossRef] [PubMed]
- Carles, C.; Esquirol, Y.; Turuban, M.; Piel, C.; Migault, L.; Pouchieu, C.; Bouvier, G.; Fabbro-Peray, P.; Lebailly, P.; Baldi, I. Residential proximity to power lines and risk of brain tumor in the general population. Environ. Res. 2020, 185, 109473. [Google Scholar] [CrossRef] [PubMed]
- Moon, J.-H. Health effects of electromagnetic fields on children. Clin. Exp. Pediatr. 2020, 63, 422–428. [Google Scholar] [CrossRef] [PubMed]
- N. I. of Environmental Health Sciences and others. Assessment of Health Effects from Exposure to Power-Line Frequency Electric and Magnetic Fields; National Institutes of Health: Research Triangle Park, NJ, USA, 1998.
- Feychting, M.; Alhbom, M. Magnetic Fields and Cancer in Children Residing Near Swedish High-voltage Power Lines. Am. J. Epidemiology 1993, 138, 467–481. [Google Scholar] [CrossRef] [PubMed]
- Olsen, J.H.; Nielsen, A.; Schulgen, G. Residence near high voltage facilities and risk of cancer in children. BMJ 1993, 307, 891–895. [Google Scholar] [CrossRef] [PubMed]
- Verkasalo, P.K.; Pukkala, E.; Kaprio, J.; Heikkila, K.V.; Koskenvuo, M. Magnetic fields of high voltage power lines and risk of cancer in Finnish adults: Nationwide cohort study. BMJ 1996, 313, 1047–1051. [Google Scholar] [CrossRef] [PubMed]
- Crespi, C.M.; Swanson, J.; Vergara, X.P.; Kheifets, L. Childhood leukemia risk in the California Power Line Study: Magnetic fields versus distance from power lines. Environ. Res. 2019, 171, 530–535. [Google Scholar] [CrossRef] [PubMed]
- Swanson, J.; Kheifets, L.; Vergara, X. Changes over time in the reported risk for childhood leukaemia and magnetic fields. J. Radiol. Prot. 2019, 39, 470–488. [Google Scholar] [CrossRef] [PubMed]
- Carpenter, D.O. Extremely low frequency electromagnetic fields and cancer: How source of funding affects results. Environ. Res. 2019, 178, 108688. [Google Scholar] [CrossRef] [PubMed]
- Huo, F.; Lu, W.; Qiu, Z.; Huang, D.; Huang, C. Study on electric field distribution characteristics of the maintenance area when UHV AC transmission line crossing 220 kV tower. J. Eng. 2019, 2019, 2986–2990. [Google Scholar] [CrossRef]
- ICNIRP. Aim, Status & History. Available online: www.icnirp.org/en/about-icnirp/aim-status-history/index.html (accessed on 16 March 2024).
- International Commission on Non-Ionizing Radiation Protection. Guidelines for limiting exposure to time-varying electric, magnetic, and electromagnetic fields (up to 300 GHz). Health Phys. 1998, 74, 494–522. [Google Scholar]
- I. C. on Non-Ionizing Radiation Protection and others. Guidelines for limiting exposure to time-varying electric and magnetic fields (1 Hz to 100 kHz). Health Phys. 2010, 99, 818–836. [Google Scholar] [CrossRef] [PubMed]
- Recommendation, Council. Recommendation and Others, Limitation of Exposure of the General Public to Electromagnetic Fields (0 hz to 300 ghz). Available online: https://osha.europa.eu/pl/legislation/guidelines/council-recommendation-1999519ec-limitation-exposure-general-public-electromagnetic-fields-0-hz-300-ghz (accessed on 14 October 2024).
- Diário da República n.o 275/2004, Série I-B de 2004-11-23. Available online: https://diariodarepublica.pt/dr/detalhe/diario-republica/275-2004-122583 (accessed on 14 October 2024).
- Décret n 2002-775 du 3 mai 2002. Available online: https://www.legifrance.gouv.fr/loda/id/JORFTEXT000000226401 (accessed on 14 October 2024).
- BGBl. I S. 3266. Available online: https://www.gesetze-im-internet.de/bimschv_26/BJNR196600996.html (accessed on 14 October 2024).
- LOI n° 2015-136 du 9 Février 2015. Available online: https://www.legifrance.gouv.fr/loda/id/JORFTEXT000030212642 (accessed on 14 October 2024).
- Stam, R. Comparison of International Policies on Electromagnetic Fields: (Power Frequency and Radiofrequency Fields). 2018. Available online: https://www.arpansa.gov.au/comparison-international-policies-electromagnetic-fields-power-frequency-and-radiofrequency-fields (accessed on 14 October 2024).
- UK Government Web Archive. Available online: https://www.nationalarchives.gov.uk/webarchive/ (accessed on 14 October 2024).
- Landeselektrizitätsgesetz-Novelle. Available online: www.salzburg.gv.at (accessed on 14 October 2024).
- La Normativa Italiana: DPCM 8 Luglio 2003. Available online: https://www.repertoriosalute.it/ (accessed on 14 October 2024).
- EMFS Info. Available online: https://www.emfs.info/limits/world/ (accessed on 14 October 2024).
- Dz. U. 2019 poz. 1448. Available online: https://isap.sejm.gov.pl/isap.nsf/DocDetails.xsp?id=WDU20190002448 (accessed on 14 October 2024).
- BBMEG. Available online: https://www.bbemg.uliege.be/belgian-legislation/ (accessed on 14 October 2024).
- Verordnung über den Schutz vor Nichtionisierender Strahlung (NISV) vom Dezember 1999 (Stand am November 2023). Available online: https://www.fedlex.admin.ch/eli/cc/2000/38/de (accessed on 14 October 2024).
- Law on Protection against Non-Ionizing Radiation (" ", ). Official Gazette of RS. volume No. 36/09. Available online: https://leap.unep.org/en/countries/rs/national-legislation/law-protection-non-ionizing-radiation (accessed on 14 October 2024).
- Health Canada. Available online: www.canada.ca/en/health-canada/services/publications/health-risks-safety/limits-human-exposure-radiofrequency-electromagnetic-energy-range-3-300.html (accessed on 14 October 2024).
- Electric and Magnetic Field (EMF) Safety Program. Environmental Health & Safety. Available online: https://ehs.utoronto.ca/our-services/radiation-safety/emf-safety-program/#ICNIRP2010 (accessed on 14 October 2024).
- T. and I. No. 34 of 2013 Order of the Ministry of Economy. Ministerial Order to Provide Technical Standards for Electrical Appliances and Materials. Available online: https://www.japaneselawtranslation.go.jp/en/laws/view/2961/en (accessed on 14 October 2024).
- GB 8702-1988 Standard; Regulations for Electromagnetic Radiation Protection. State Environmental Protection Agency: Beijing, China, 1988.
- GB 9175-88 Standard; Hygienic Standard for Environmental Electromagnetic Waves. State Environmental Protection Agency: Beijing, China, 1988.
- International Commission on Non-Ionizing Radiation Protection. Guidelines on limiting exposure to static magnetic fields. Health Phys. 2009, 9, 504–514. [Google Scholar]
- Wu, T.; Shao, Q.; Yang, L.; Qi, D.; Lin, J.; Lin, X.; Yu, Z. A large-scale measurement of electromagnetic fields near GSM base stations in Guangxi, China for risk communication. Radiat. Prot. Dosim. 2012, 155, 25–31. [Google Scholar] [CrossRef] [PubMed]
- IARC. Available online: https://www.iarc.who.int (accessed on 14 October 2024).
- Microwavenews. Available online: https://microwavenews.com/short-takes-archive/iarc-urged-reassess-rf (accessed on 14 October 2024).


| Investigated Object | Emax [kV/m] | Hmax [A/m] | |
|---|---|---|---|
| 1 | Transformer-distribution station 15 kV/0.4 kV | <0.05 | 5.3 |
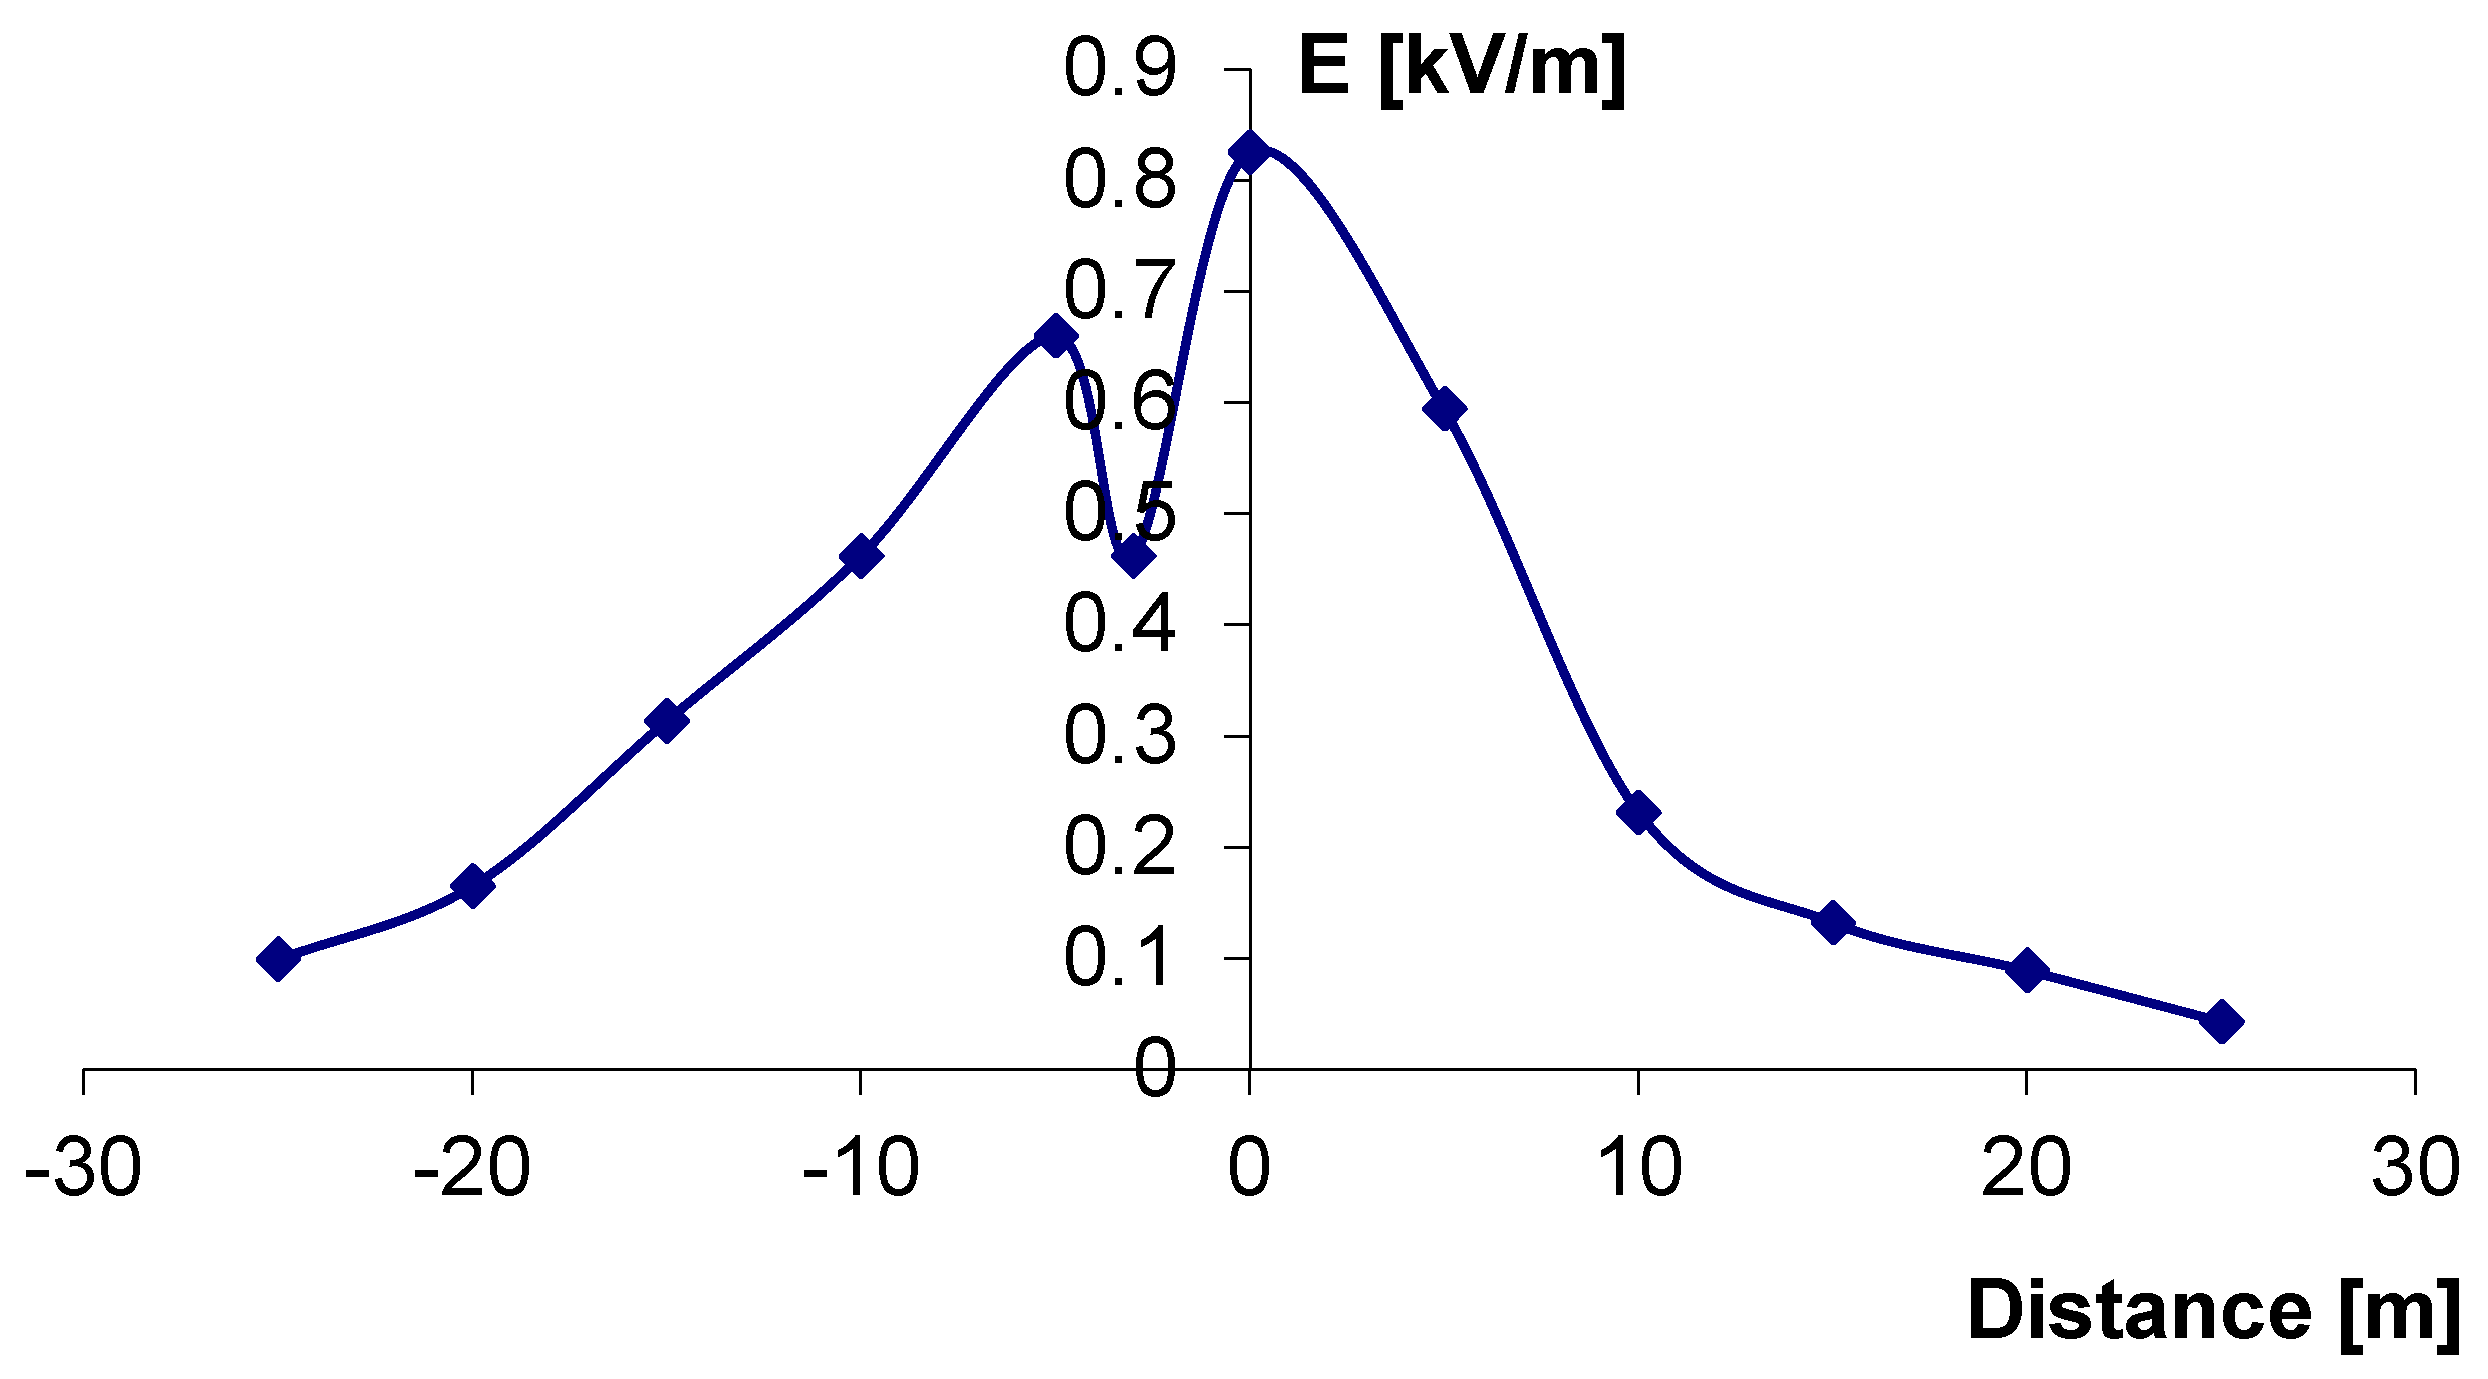
| 2 | Building plot under 110 kV overhead line (only E) | 0.83 | - |
| 3 | Multi-family building with balconies near 110 kV overhead line | 1.2 | <0.2 |
| 4 | Office space with inappropriate equipotential bonding (only H) | - | 4 |
| 5 | Room above the MV/LV indoor station (only E) | 4.01 | - |
| 6 | LV switchboard (only H) | - | <16 |
| Calculated Case | Emax [kV/m] | E2m [kV/m] | Hmax [A/m] | H2m [A/m] | |
|---|---|---|---|---|---|
| 1 | Warehouse hall near 110 kV double-track overhead lines | 4.0 | 3.0 | 125.0 | 96.0 |
| 2 | Multi-family building with balconies near double-track 110 kV overhead lines | 3.95 | 0.89 | 46.1 | 12.6 |
| 3 | Shopping center under 110 kV overhead line | 2.2 | 0.3 | 46.0 | 27.0 |
| 4 | Residential building next to double-track overhead 110 kV lines | 2.2 | 1.25 | 39.8 | 48.2 |
| 5 | Parking under 110 kV overhead line | 1.4 | 0.82 | 65.0 | 12.0 |
| 6 | Terraced buildings near 110 kV double-track overhead lines | 1.6 | 0.9 | 15.0 | 15.0 |
| 7 | Multi-family building with balconies near 15 kV overhead line | 0.55 | 1.3 | 9.2 | 4.4 |
| 8 | Multi-family building under 110 kV overhead line | 3.5 | 0.1 | 26.1 | 7.5 |
| <1 Hz | 1–8 Hz | 8–25 Hz | 0.025–0.8 kHz | 0.8–3 kHz | 3–150 kHz | 0.15–1 MHz | 1–10 MHz | 10–400 MHz | 400–2000 MHz | 2–300 GHz | |
|---|---|---|---|---|---|---|---|---|---|---|---|
| E [kV/m] | - | 10,000 | 10,000 | 250/f | 250/f | 87 | 87 | 87/(f0.5) | 28 | 1.375(f0.5) | 61 |
| H [A/m] | 3.2 × 10⁴ | 3.2 × 10⁴/(f2) | 4000/f | 4/f | 5 | 5 | 0.73/f | 0.73/f | 0.073 | 0.0037/(f0.5) | 0.20 |
| B [μT] | 4 × 10⁴ | 4 × 10⁴/(f2) | 5000/f | 5/f | 6.25 | 6.25 | 0.92/f | 0.92/f | 0.092 | 0.0046∙ f0.5 | 0.20 |
| 1998 | 2010 | 2020 | |
|---|---|---|---|
| Scope of regulation (frequencies) | Up to 300 GHz | 1 Hz–100 kHz | 100 kHz–300 GHz |
| Physical quantities regulated | Electric field strength, magnetic field strength, magnetic flux density | Electric field strength, magnetic field strength, magnetic flux density | Electric field strength, magnetic field strength, power density S (W/m2) |
| E for general public (f = 50 Hz) | 5 kV | 5 kV | Not affected |
| B for general public (f = 50Hz) | 100 μT | 200 μT | Not affected |
| Country | Ref. | EMF Restrictions |
|---|---|---|
| Italy | [28] | Basic limit as in 1999/519/EC, but in restricted places (schools, nurseries, residential dwellings), allowed B is only 10 μT, new installations are not to exceed 3 μT, and in 3 regions (Veneto, Tuscany, Emilia-Romagna), allowed B is 0.2 μT [29] |
| Poland | [30] | E of 1 kV and B of 75 μT allowed in residential buildings, E of 10 kV and B of 75 μT allowed in public places |
| Belgium | [31] | Differences between provinces; the value of E varies between 5 kV and 10 kV; B is reduced in dwellings or house interiors and is usually 10 μT |
| Switzerland | [32] | Basic limit as in 1999/519/EC, but in new installations and/or objects of “sensitive use”, B allowed is 1 μT |
| ICNIRP 1998 | ICNIRP 2010 | 1999/519/EC | Portugal | Germany | France | Belgium | Italy | Poland | The Netherlands | Switzerland | UK | Spain | Canada | USA | Japan | China | Australia | |
|---|---|---|---|---|---|---|---|---|---|---|---|---|---|---|---|---|---|---|
| E [kV/m] | 5 | 5 | 5 | 5 | 5 | 5 | 5–10 1 | 5 | 1/10 2 | 5 | 5 | 5 | 5 | 5 | 1–12 1 | 3 | 4 | 5 |
| B [μT] | 100 | 200 | 100 | 100 | 100 | 100 | 10 | 3–100 1 | 75 | 100 | 1/100 3 | 100 | 100 | 100 | - | 200 | 100 | 100 |
| H [A/m] | 80 | 160 | 80 | 80 | 80 | 80 | 8 | 2.4–80 1 | 60 | 80 | 0.8–80 3 | 80 | 80 | 80 | - | 160 | 80 | 80 |
| Standards | Local Regulations | |||||||||
|---|---|---|---|---|---|---|---|---|---|---|
| ICNIRP 1998 | ICNIRP 2010 | 1999/519/EC | Belgium | Italy | Switzerland | Poland | Japan | China | ||
| Measurements | Transformer-distribution station 15 kV/0.4 kV | YES | YES | YES | YES | NO 1 | NO 2 | YES | YES | YES |
| Multi-family building with balconies near 110 kV overhead line | YES | YES | YES | YES | YES | YES | NO | YES | YES | |
| Building plot under 110 kV overhead line (only E) | YES | YES | YES | YES | YES | YES | YES | YES | YES | |
| Office space with inappropriate equipotential bonding (only H) | YES | YES | YES | YES | NO 1 | NO 2 | YES | YES | YES | |
| Room above the MV/LV indoor station (only E) | YES | YES | YES | YES | YES | YES | NO | NO | NO | |
| LV switchboard (only H) | YES | YES | YES | NO | NO 1 | NO 2 | YES | YES | YES | |
| Numerical simulations | Warehouse hall near 110 kV double-track overhead lines | NO | YES | NO | NO | NO | NO | NO | NO | NO |
| Multi-family building with balconies near two 110 kV overhead lines | YES | YES | YES | NO | NO 1 | NO 2 | NO | NO | YES | |
| Shopping center under 110 kV overhead line | YES | YES | YES | NO | NO 1 | NO 2 | YES | YES | YES | |
| Residential building next to double-track overhead 110 kV lines | YES | YES | YES | NO | NO 1 | NO 2 | NO | YES | YES | |
| Parking under 110 kV overhead line | YES | YES | YES | NO | NO 1 | NO 2 | NO | YES | YES | |
| Terraced buildings near 110 kV double-track overhead lines | YES | YES | YES | NO | NO 1 | NO 2 | NO | YES | YES | |
| Multi-family building with balconies near 15 kV overhead line | YES | YES | YES | NO | NO 1 | NO 2 | NO | YES | YES | |
| Multi-family building under 110 kV overhead line | YES | YES | YES | NO | NO 1 | NO 2 | NO | NO | YES | |
Disclaimer/Publisher’s Note: The statements, opinions and data contained in all publications are solely those of the individual author(s) and contributor(s) and not of MDPI and/or the editor(s). MDPI and/or the editor(s) disclaim responsibility for any injury to people or property resulting from any ideas, methods, instructions or products referred to in the content. |
© 2024 by the authors. Licensee MDPI, Basel, Switzerland. This article is an open access article distributed under the terms and conditions of the Creative Commons Attribution (CC BY) license (https://creativecommons.org/licenses/by/4.0/).
Share and Cite
Litzbarski, L.S.; Olesz, M.; Redlarski, G.; Tojza, P.M.; Żak, A.; Gifuni, E.; Cieślikowska, Z.; Czapliński, M. The Assessment of the Influence of Low-Frequency Electromagnetic Fields Originated from the Power Infrastructure on Humans’ Health. Appl. Sci. 2024, 14, 9668. https://doi.org/10.3390/app14219668
Litzbarski LS, Olesz M, Redlarski G, Tojza PM, Żak A, Gifuni E, Cieślikowska Z, Czapliński M. The Assessment of the Influence of Low-Frequency Electromagnetic Fields Originated from the Power Infrastructure on Humans’ Health. Applied Sciences. 2024; 14(21):9668. https://doi.org/10.3390/app14219668
Chicago/Turabian StyleLitzbarski, Leszek Sławomir, Marek Olesz, Grzegorz Redlarski, Piotr Mateusz Tojza, Arkadiusz Żak, Emanuel Gifuni, Zuzanna Cieślikowska, and Mieszko Czapliński. 2024. "The Assessment of the Influence of Low-Frequency Electromagnetic Fields Originated from the Power Infrastructure on Humans’ Health" Applied Sciences 14, no. 21: 9668. https://doi.org/10.3390/app14219668
APA StyleLitzbarski, L. S., Olesz, M., Redlarski, G., Tojza, P. M., Żak, A., Gifuni, E., Cieślikowska, Z., & Czapliński, M. (2024). The Assessment of the Influence of Low-Frequency Electromagnetic Fields Originated from the Power Infrastructure on Humans’ Health. Applied Sciences, 14(21), 9668. https://doi.org/10.3390/app14219668