1. Introduction
Light nonaqueous phase fluids (LNAPLs) can contaminate soil and groundwater and even endanger human life in the event of leaks. In oil extraction and petrochemical production areas, oil spills damage soil structure, reduce soil permeability, and affect microbial growth. Approximately 8 million tons of oil enter the environment every year globally [
1], with approximately 600,000 t in China, of which approximately 70,000 t flows into the soil, causing soil pollution [
2]. Following soil contamination, oil can easily seep into groundwater through precipitation, surface water, and irrigation channel water [
3], thereby polluting the groundwater. In addition, LNAPLs can volatilize into the atmosphere and be taken into the human body via breathing, skin contact, and ingestion, for example, affecting the normal functions of the liver, kidneys, and other organs, and even have considerable carcinogenic, teratogenic, and mutagenic effects on the human body [
4]. In 2004, a pipeline leaked thousands of tons of crude oil at Yan’an in Shaanxi Province, resulting in the contamination of hundreds of acres of farmland [
5]. In 2015, an oil leak from the Changqing oilfield contaminated dozens of kilometers of rivers, causing serious contamination of the soil environment in Wuqi County, Yan’an. Chemically contaminated sites account for 44.1% of the Beijing–Tianjin–Hebei Construction Land Soil Pollution Risk Control and Remediation List, with petroleum hydrocarbons accounting for up to 42.10% [
6]. In 2009, a diesel spill occurred in the Weinan branch of the China National Petroleum Corporation’s Lanzhou–Zhengzhou–Changsha oil pipeline during the commissioning of the sub-transmission, which resulted in around 100 kiloliters of diesel flowing into the Chishui River, a tributary of the Wei River. According to Russian scientists, 7% of global crude oil extracted each year enters the environment and contaminates soil and groundwater [
7]. Thus, there is an urgent need to investigate the migration mechanism of LNAPLs as well as their occurrence state.
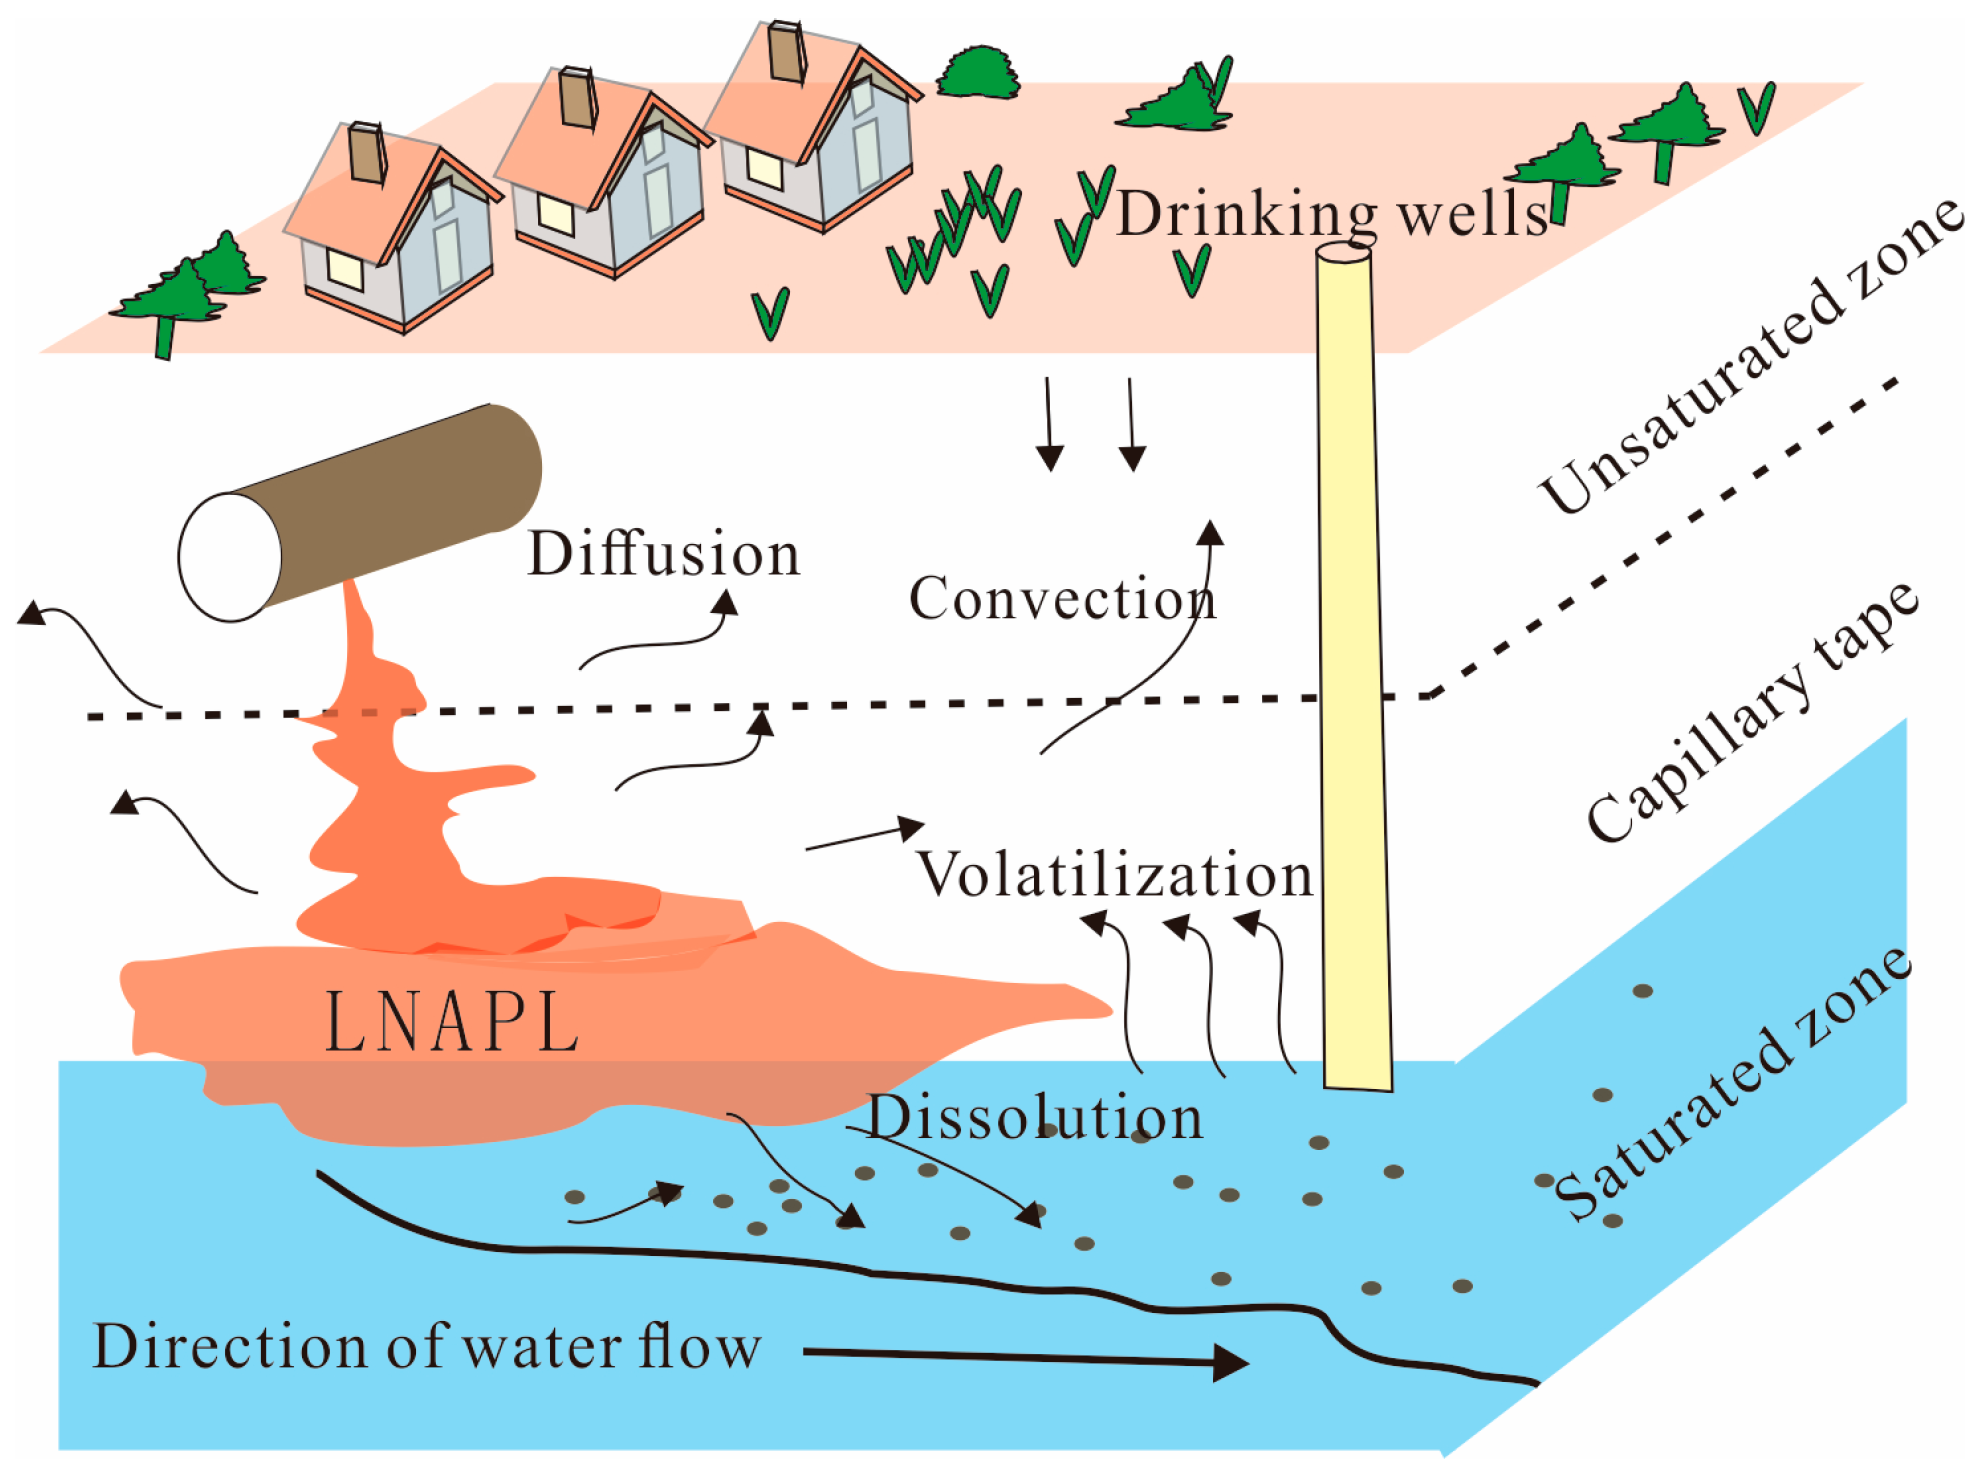
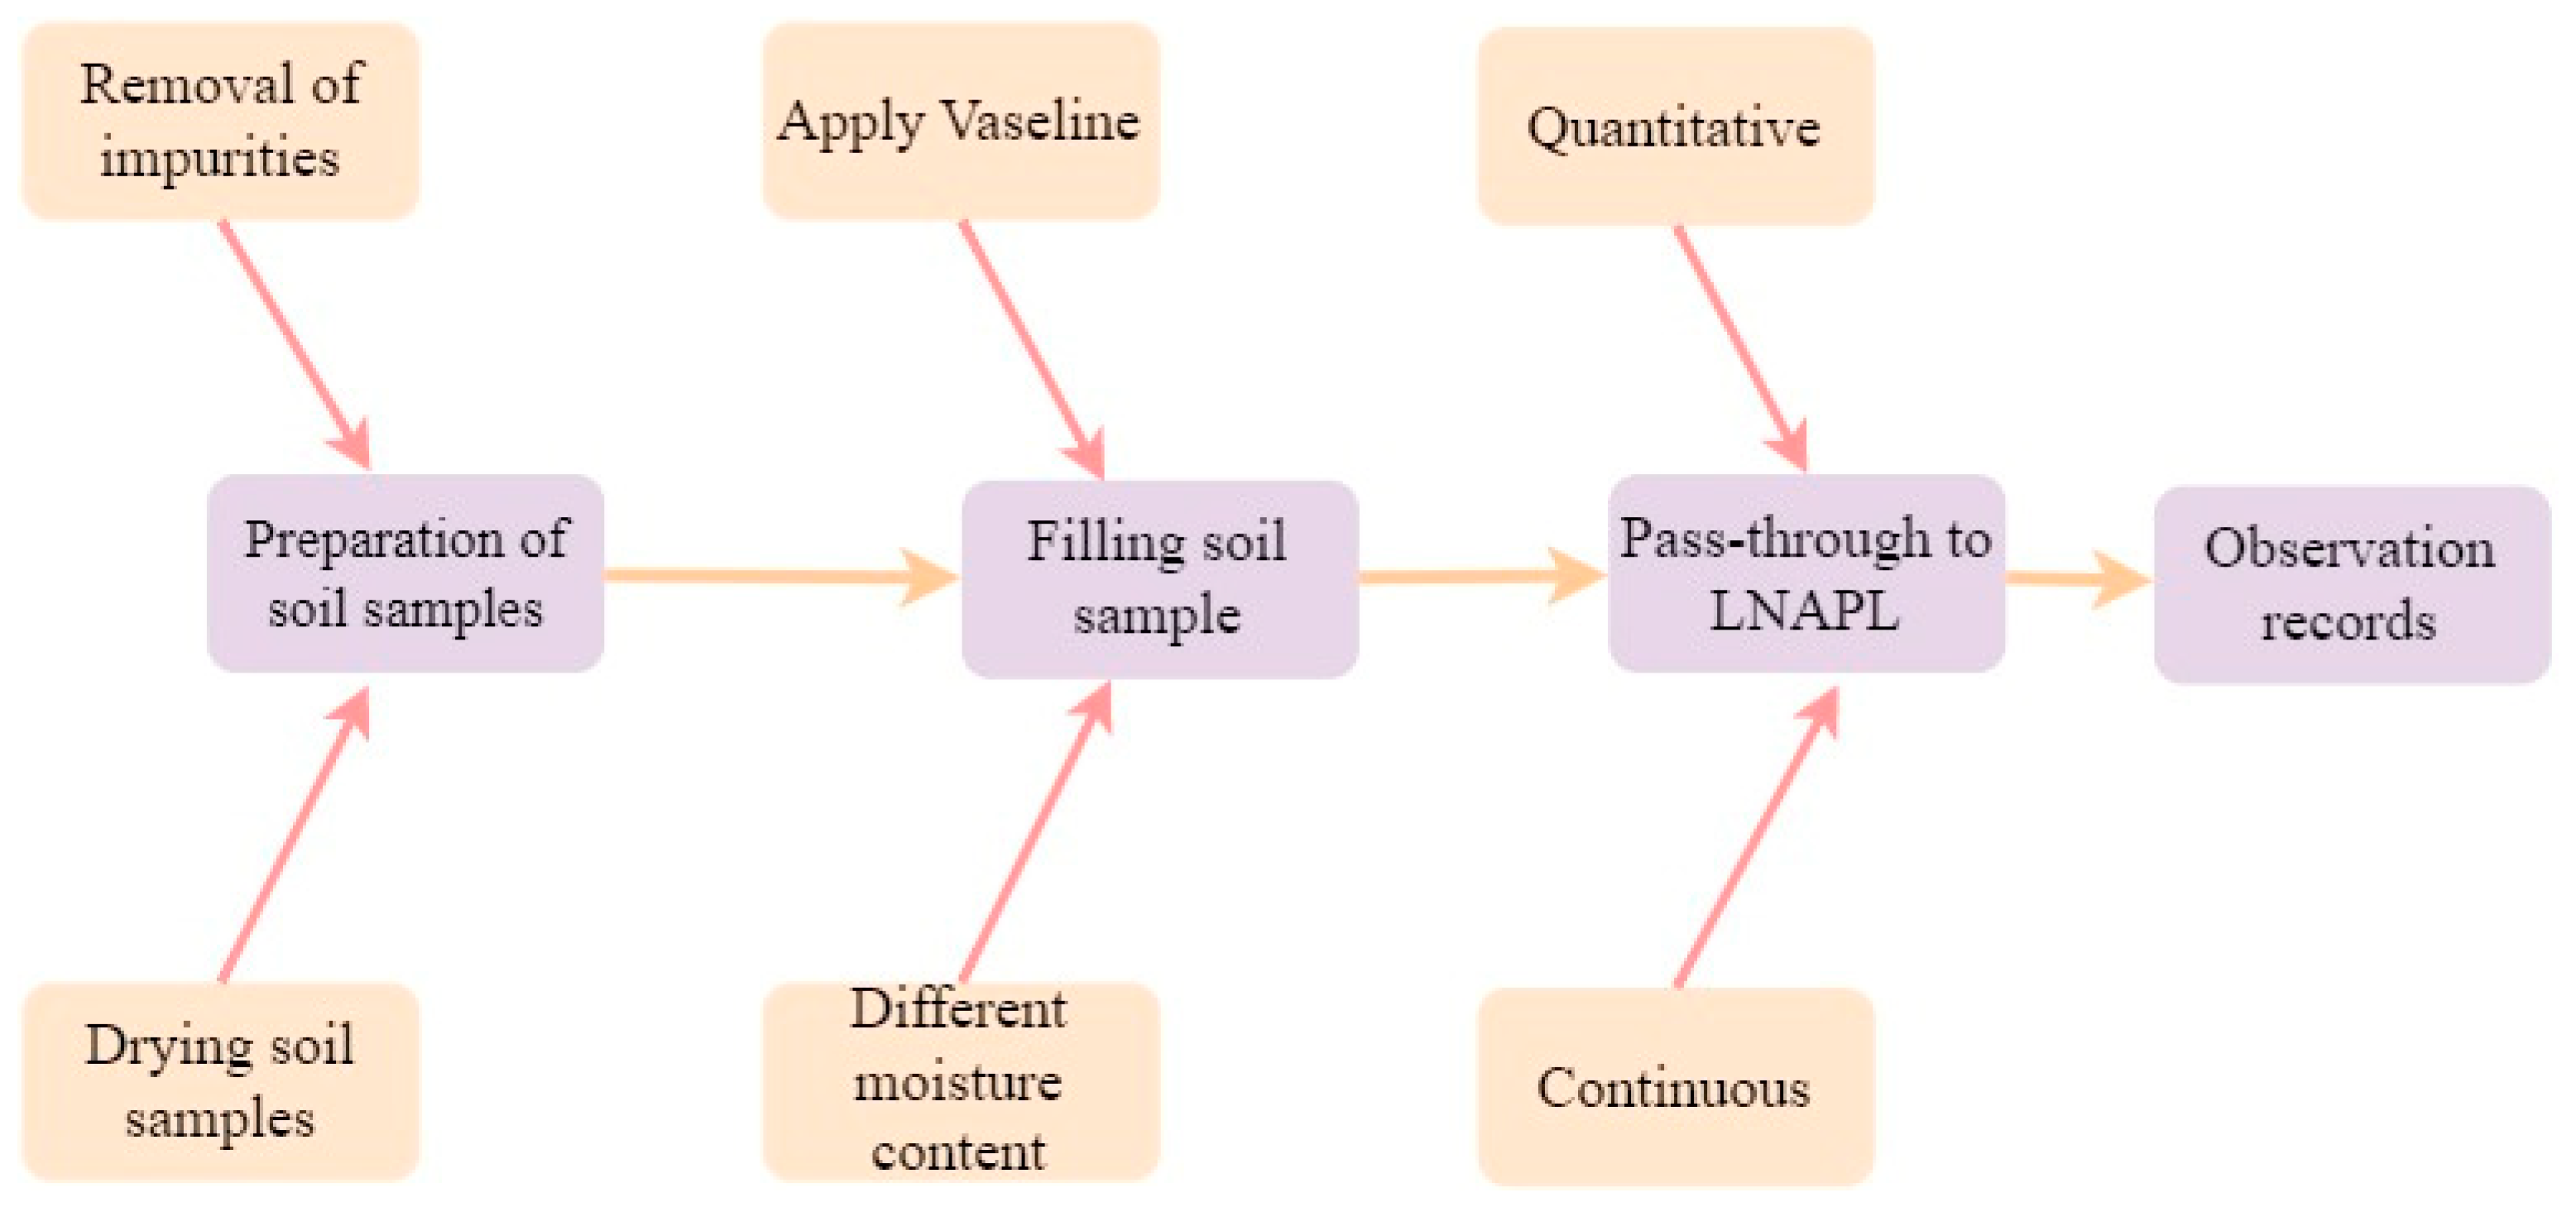
The process of petroleum pollutant migration includes convection, diffusion, dispersion, dissolution, volatilization, adsorption, and desorption (
Figure 1). Along with groundwater level fluctuations, different pollutant components are continuously exchanged, migrated, adsorbed, desorbed, and diffused in the unsaturated zone, groundwater fluctuation zone, and aquifer [
6,
8]. Jing et al. [
9] combined HYDRUS-1D software and the TOUGH program to establish numerical simulations and study the effects of migration and retention of LNAPLs during dynamic fluctuations of groundwater level caused by the freeze–thaw process. Atteia et al. [
10] presented a model to study the influence of groundwater table fluctuations on oil thickness in a well related to an LNAPL-contaminated aquifer, which was compared with field data obtained by continuous measurement of the vertical position of LNAPL in wells. Zhou et al. [
11] developed an LNAPL simulator to simulate the migration process of LNAPL under water table fluctuations, which is capable of portraying the migration of pollutants relatively accurately. LNAPL moves downward vertically in the unsaturated zone, gradually replacing capillary water. Following an oil leak, it migrates downward into the unsaturated zone through gravity. When it reaches the groundwater level, it floats on the water surface and diffuses laterally, but the overall trend is downward migration [
12,
13]. The distribution of water content in the unsaturated zone is the main factor controlling the distribution pattern of LNAPL. The occurrence of LNAPLs in the unsaturated zone can be divided into four categories: free-flowing liquid phase, adsorbed phase (adsorbed on the surface of soil particles), dissolved phase (dissolved in water), and volatile phase (volatilized in the atmosphere) [
4,
14]. In the saturated zone, the oil phase and water phase exist.
The migration and transformation of LNAPL in the subsurface environment is extremely complicated. Using a UV spectrophotometer, Zhu et al. [
15] simulated the migration process of diesel fuel in porous media under different conditions using a one-dimensional soil column experiment and analyzed the vertical migration of diesel fuel in two different grain sizes of sandy soil. Wu et al. [
16] simulated diesel–water two-phase flow in a porous medium with different particle sizes of glass sand in the saturated zone and obtained the saturation distribution of oil–water two-phase flow via image analysis, thus enabling quantitative analysis of saturation in multiphase flow. Xing [
17] combined numerical simulations with a centrifugal model test, simulating the transport process of LNAPL in unsaturated soils under homogeneous and inter-layered conditions using finite element analysis of multiphase flow in porous media. Wang [
18] applied multiphase flow theory to analyze the mechanisms influencing the infiltration and redistribution processes of LNAPLs in different types and structures of soils. Rui et al. [
19] examined the retention process of the capillary zone during the migration of LNAPL pollutants in fine sand and silt media and simulated the migration process of LNAPL under a shallow point source leakage scenario with two-dimensional sand tank experiments. Shen et al. [
20] built a multiphase numerical flow model based on COMSOL. They investigated the migration behavior of LNAPL in sand-filled fractured media with a combination of indoor experiments and numerical simulations. Govindarajan et al. [
21] employed magnetic resonance imaging to observe the mobilization of LNAPL trapped in wet sand under natural drying conditions of a wet porous medium. Teramoto et al. [
22] estimated the volume and the distribution of LNAPLs more precisely based on the high-resolution laser-induced fluorescence technique. The migration of LNAPL in the groundwater environment is complex and involves a combination of physical, chemical, and biological processes [
23]. The complexity of LNAPL migration in groundwater environmental systems is mainly manifested by the complexities of influencing factors as well as migration processes. Various factors, such as the thickness of the aquifer, characteristics of the soil in the stratum, organic matter content, depth and flow direction and velocity of groundwater, and hydrogeological conditions in which the groundwater is located, all affect the migration process, migration rate, migration volume, and the occurrence state of LNAPLs in the groundwater environment [
24].
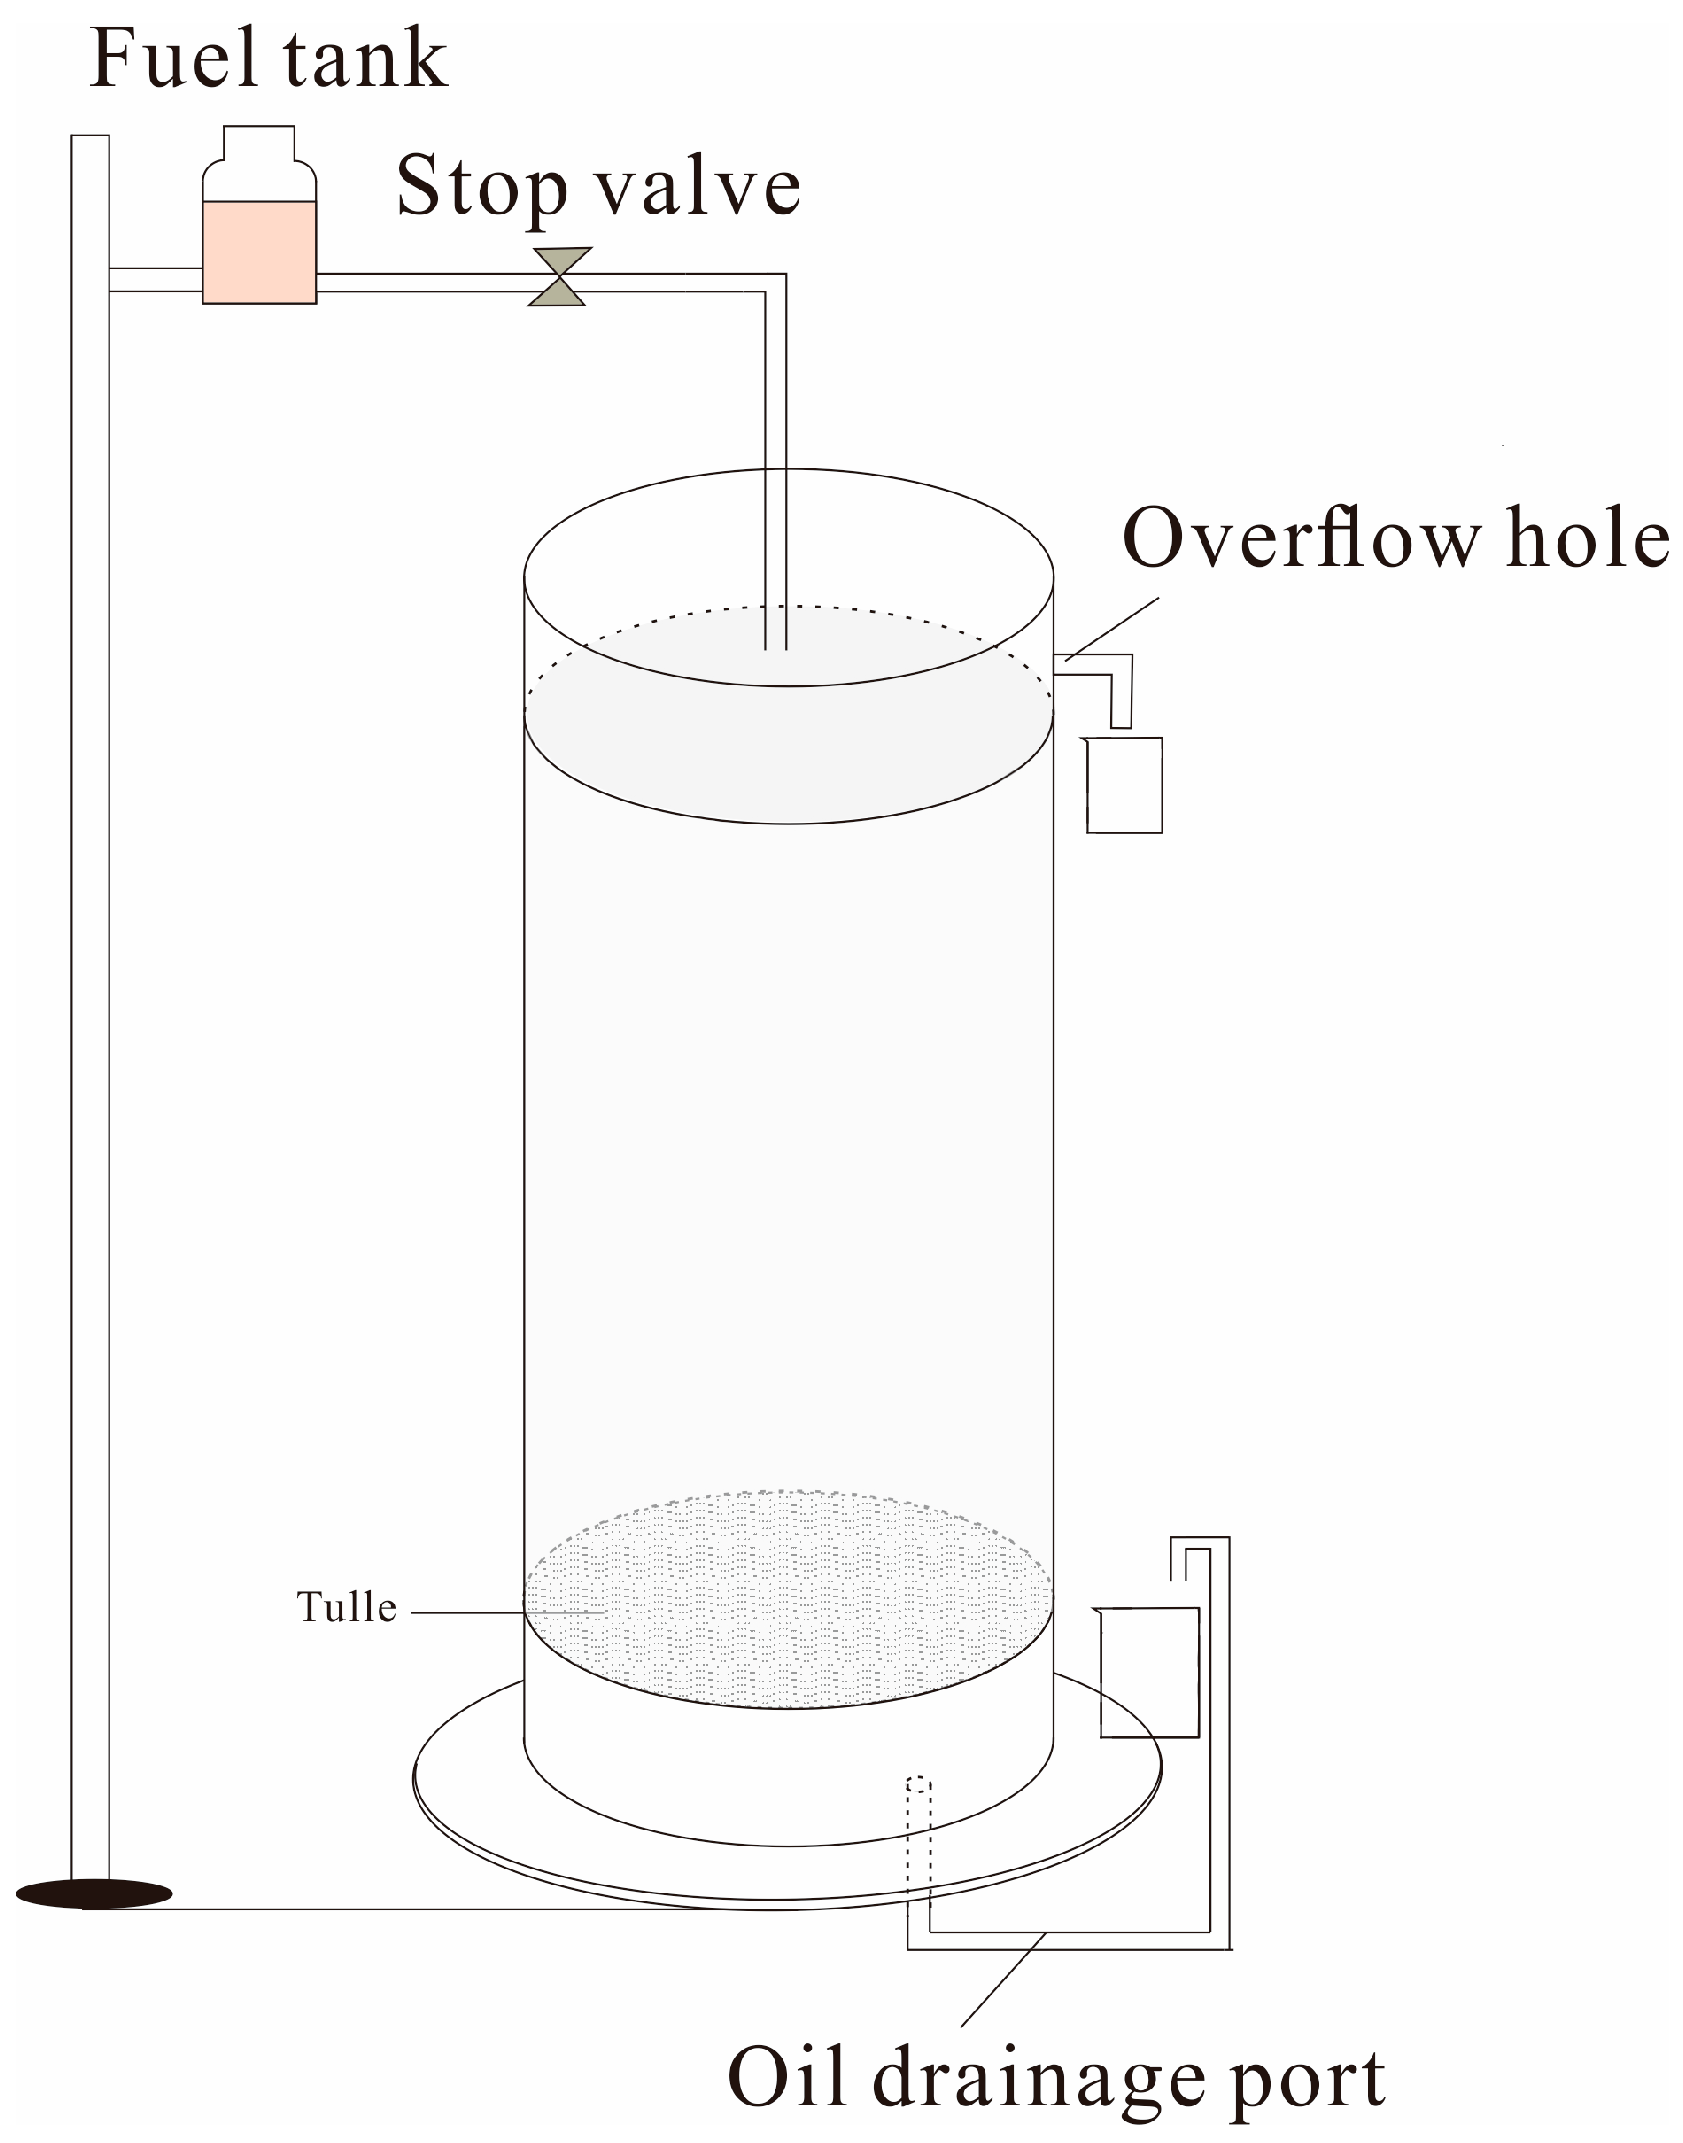
The specific issue addressed in this study is the impact of water content on the migration of light nonaqueous phase liquids (LNAPLs) in sandy soils, a critical yet under-researched aspect of subsurface contamination. To tackle this, we employed indoor simulated vertical, one-dimensional, multiphase flow soil column experiments, utilizing the orthogonal experimental method to systematically evaluate the effects of varying water contents on the occurrence state and migration rate of LNAPLs, which is important for solving environmental problems associated with LNAPL pollution in the unsaturated zone. The main research objectives of this study are as follows: (1) Analyze the effects of gravity and capillary forces on the migration rate of LNAPLs via simulations of both surface infiltration and subsurface imbibition; (2) quantitatively simulate the effects of the water content and oil content of media on the adsorption rate of LNAPL and the migration rate change process based on a one-dimensional soil column experiment.
Here are the short definitions for the geological terms for the manuscript.
Unsaturated Zone: The unsaturated zone is the portion of the subsurface above the groundwater table where soil and rock contain both air and water in their pores. It is not a source of readily available water for human consumption but plays a crucial role in the movement of water from the land surface to the aquifer below.
Saturated Zone: The saturated zone, also known as the zone of saturation, is a subsurface layer where the soil and rock pores are completely filled with water. It is located below the water table and is a primary source of groundwater for human consumption and use.
Residual Saturation: Residual saturation refers to the amount of fluid that remains in the pore spaces of a rock or soil after the maximum amount has been drained under the influence of an external force, such as gravity or capillary action. It is the saturation below which a phase no longer drains significantly under the influence of a capillary pressure gradient.
3. Experimental Results and Analysis
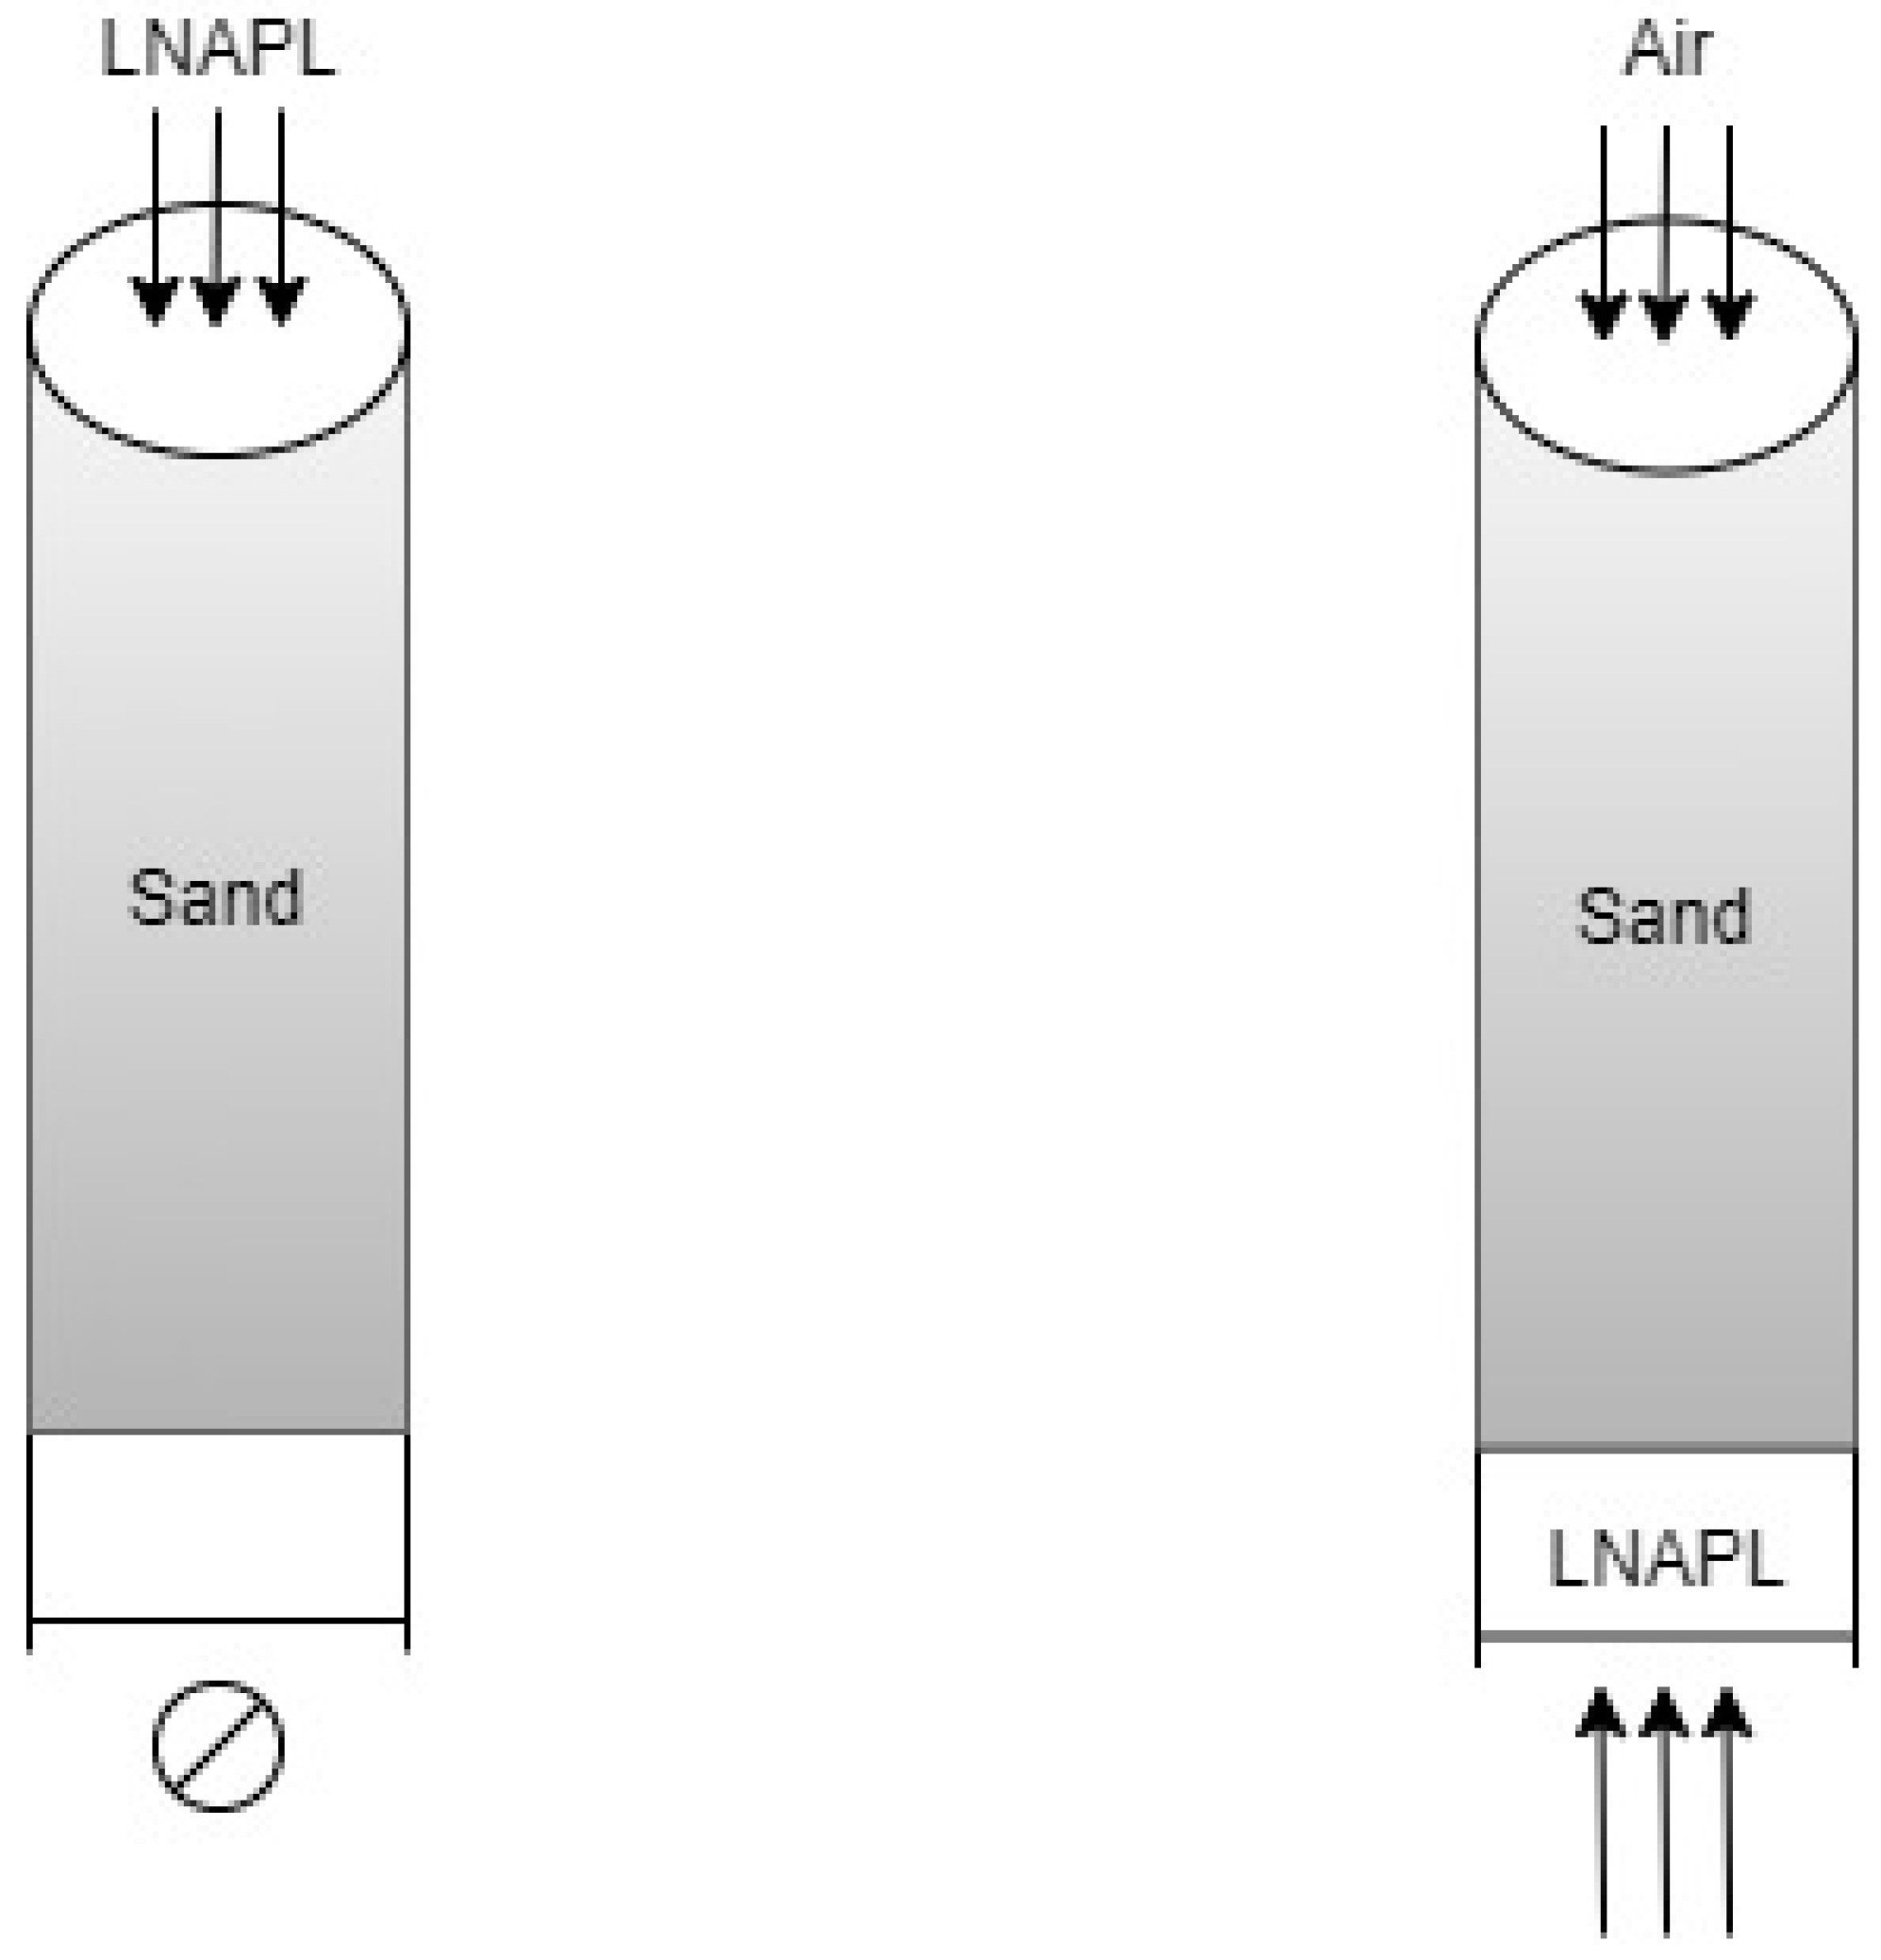
3.1. Relationship Between Infiltration Rate and Acting Force
Chukwuemeka et al. [
27] investigated LNAPL migration under capillary forces and gravity by simulating two different LNAPL leakage patterns with COMSOL numerical simulations and concluded that downward migration of pollutants by surface infiltration lasts longer, while upward migration by subsurface imbibition lasts until equilibrium is reached between gravity and capillary forces. Based on the existing literature, to analyze the effect of capillary force and gravity in the process of LNAPL migration, the relationships between LNAPL infiltration height, infiltration rate, and time were plotted and analyzed, and a residual analysis was performed in this work.
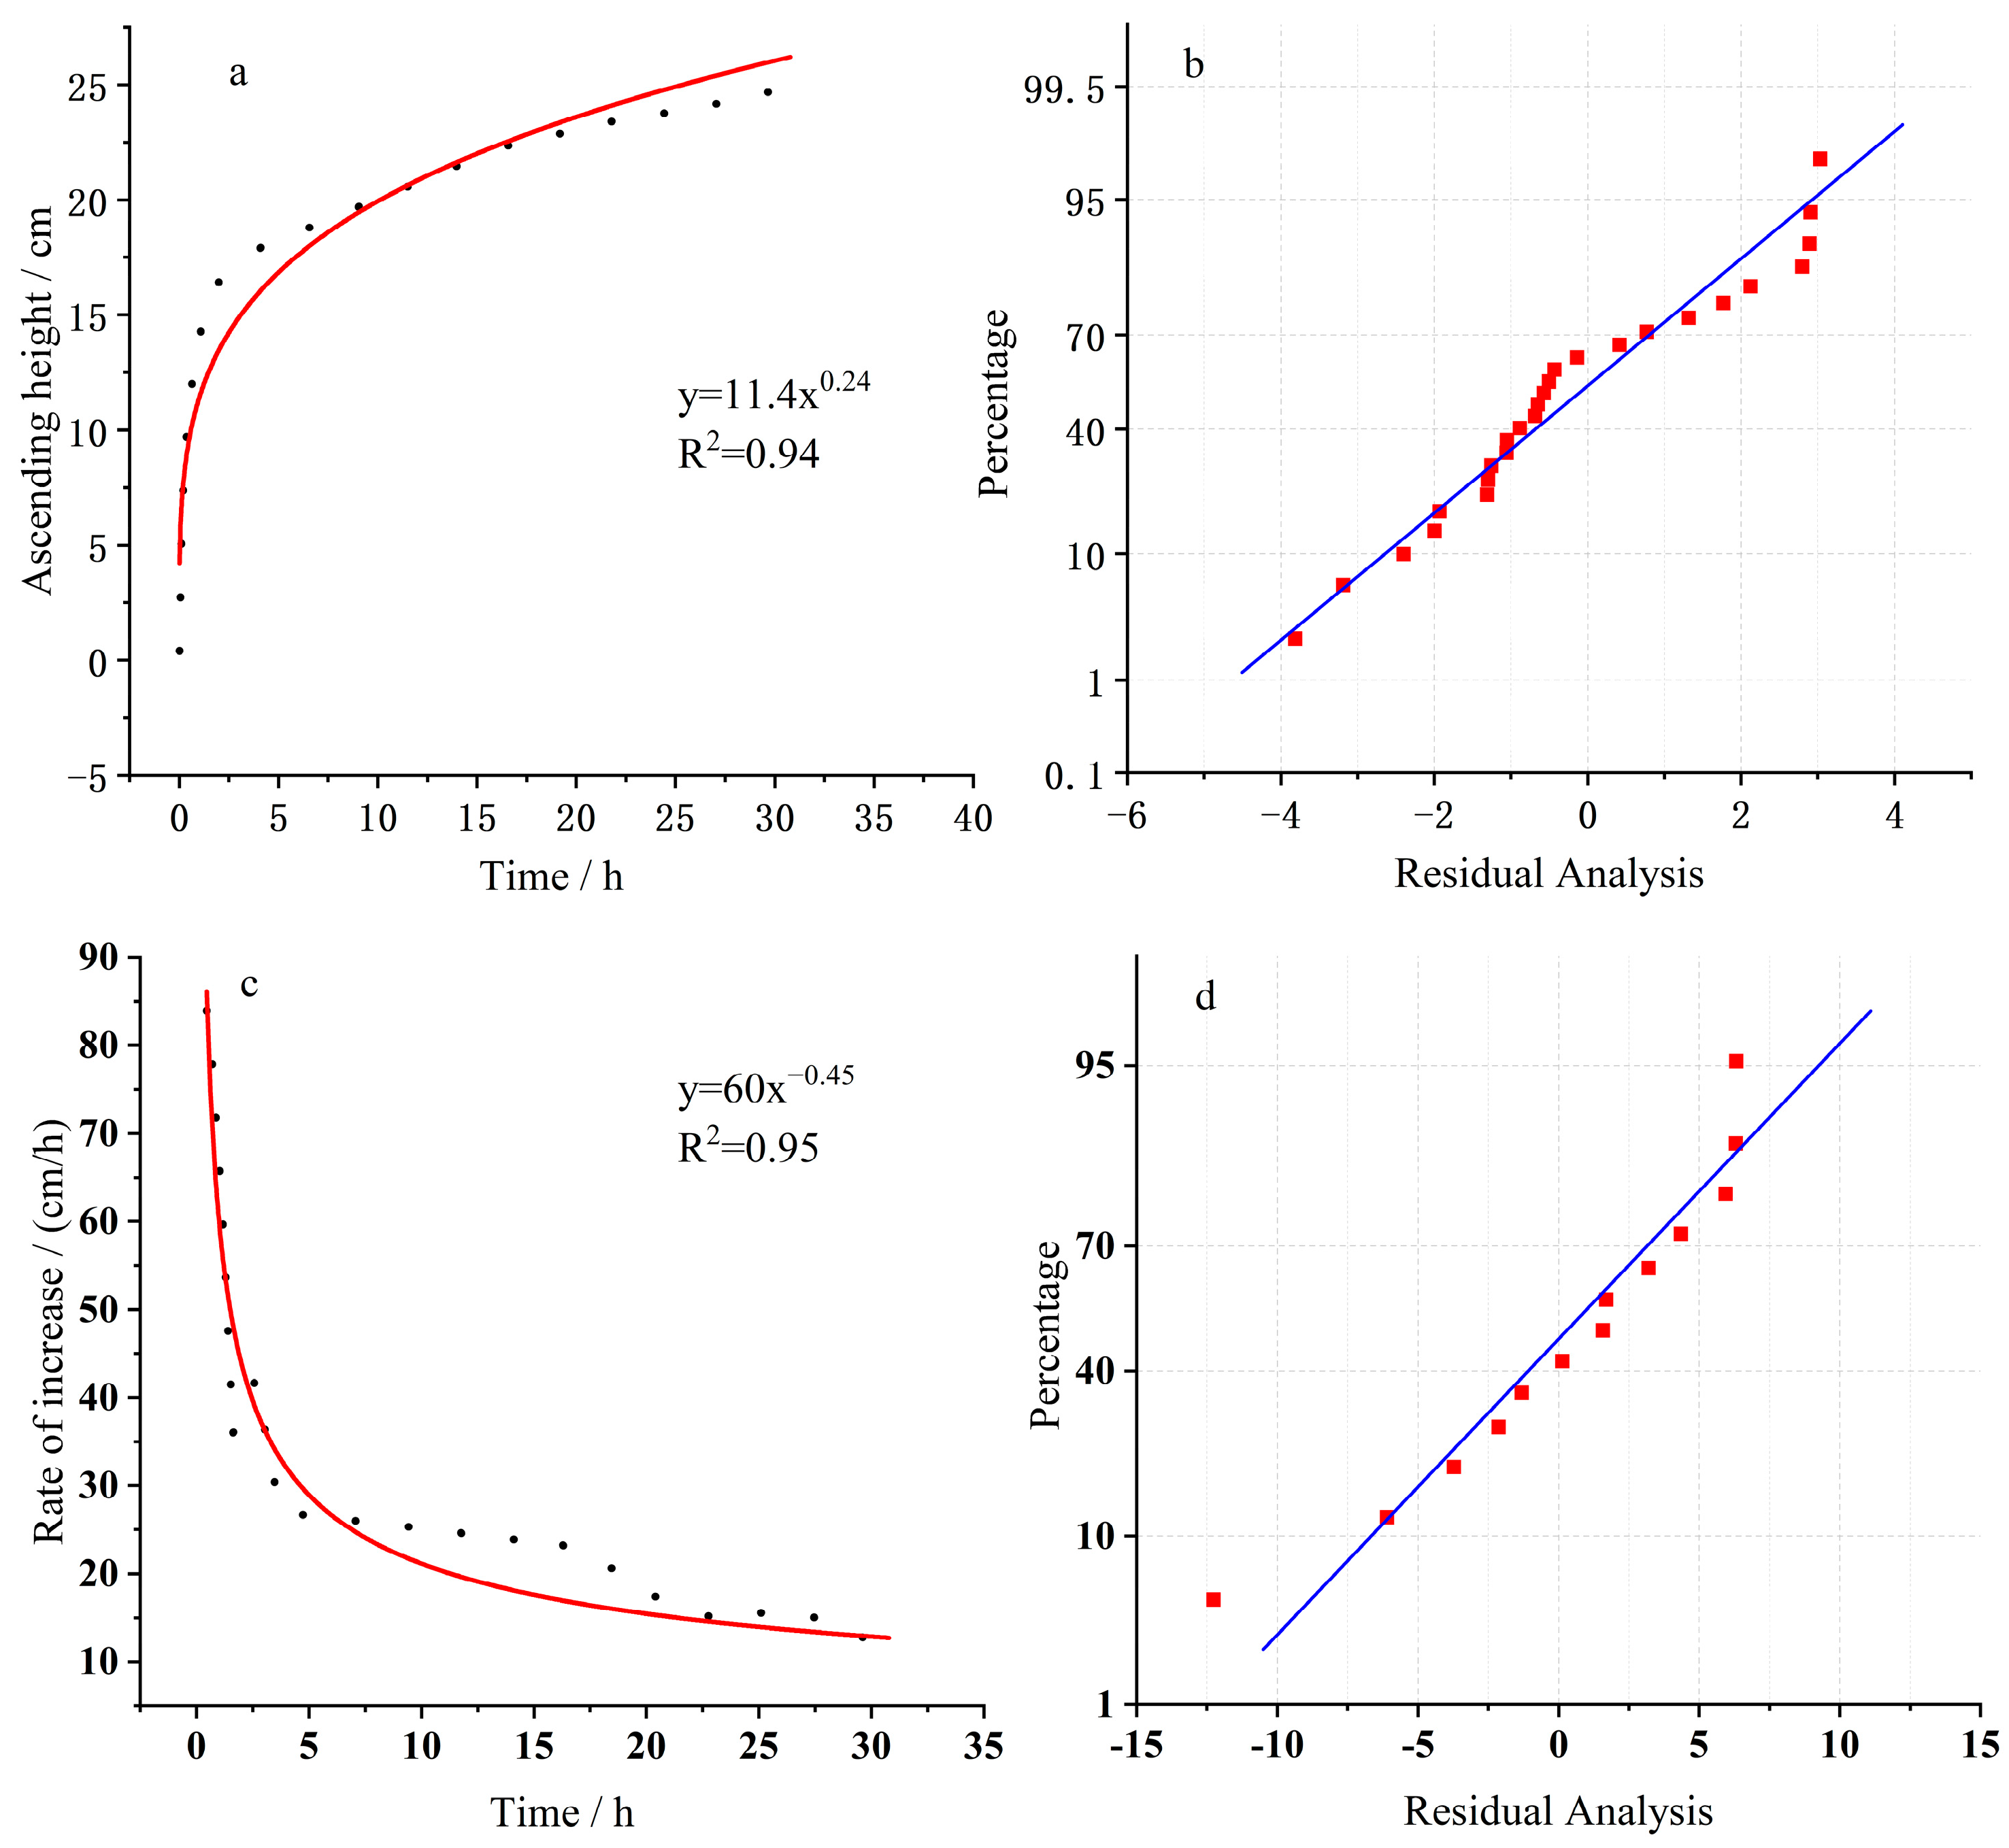
From
Figure 5, the imbibition height of LNAPL was 17.8 cm at 3.7 h, reaching the inflection point of the rising height, at which point the rising rate dropped to the inflection point and the migration rate produced an L-shaped trend, indicating a nonlinear relationship with migration time. The infiltration height migrated up from 17.8 to 22.8 cm at 3.7–18.7 h. Although the migration rate decreased significantly, a continuous upward migration trend was still observed, attributed to the process of transport mainly under the action of capillary forces. Capillary pressure is high at the beginning of imbibition. Over time, the oil content of the soil medium gradually increases, generating the downward force of gravity. At the beginning of imbibition, capillary force is greater than the gravity of LNAPL downward migration. When the imbibition height reaches 22.3 cm, capillary force gradually becomes balanced with gravity, but because the test medium used was dry sand, capillary force always exists in the soil column. Although the subsurface imbibition rate decreased, the imbibition height still rose.
It is found that the underground seepage height rises to 22.8 cm when the rise inflection point occurs; according to formula (1), it can be seen that the rise height is affected by the surface tension and density; the smaller the surface tension, the greater the density, the lower the rise height. If the surface tension of diesel is less than water, the rise height will be reduced, but if the density of diesel is less than water, the capillary rise height should be increased. It can be seen that in both positive and negative effects, surface tension dominates the position. In addition, chain reactions occur between diesel macromolecules, leading to an increase in the contact angle between the sand samples, resulting in a slower migration rate.
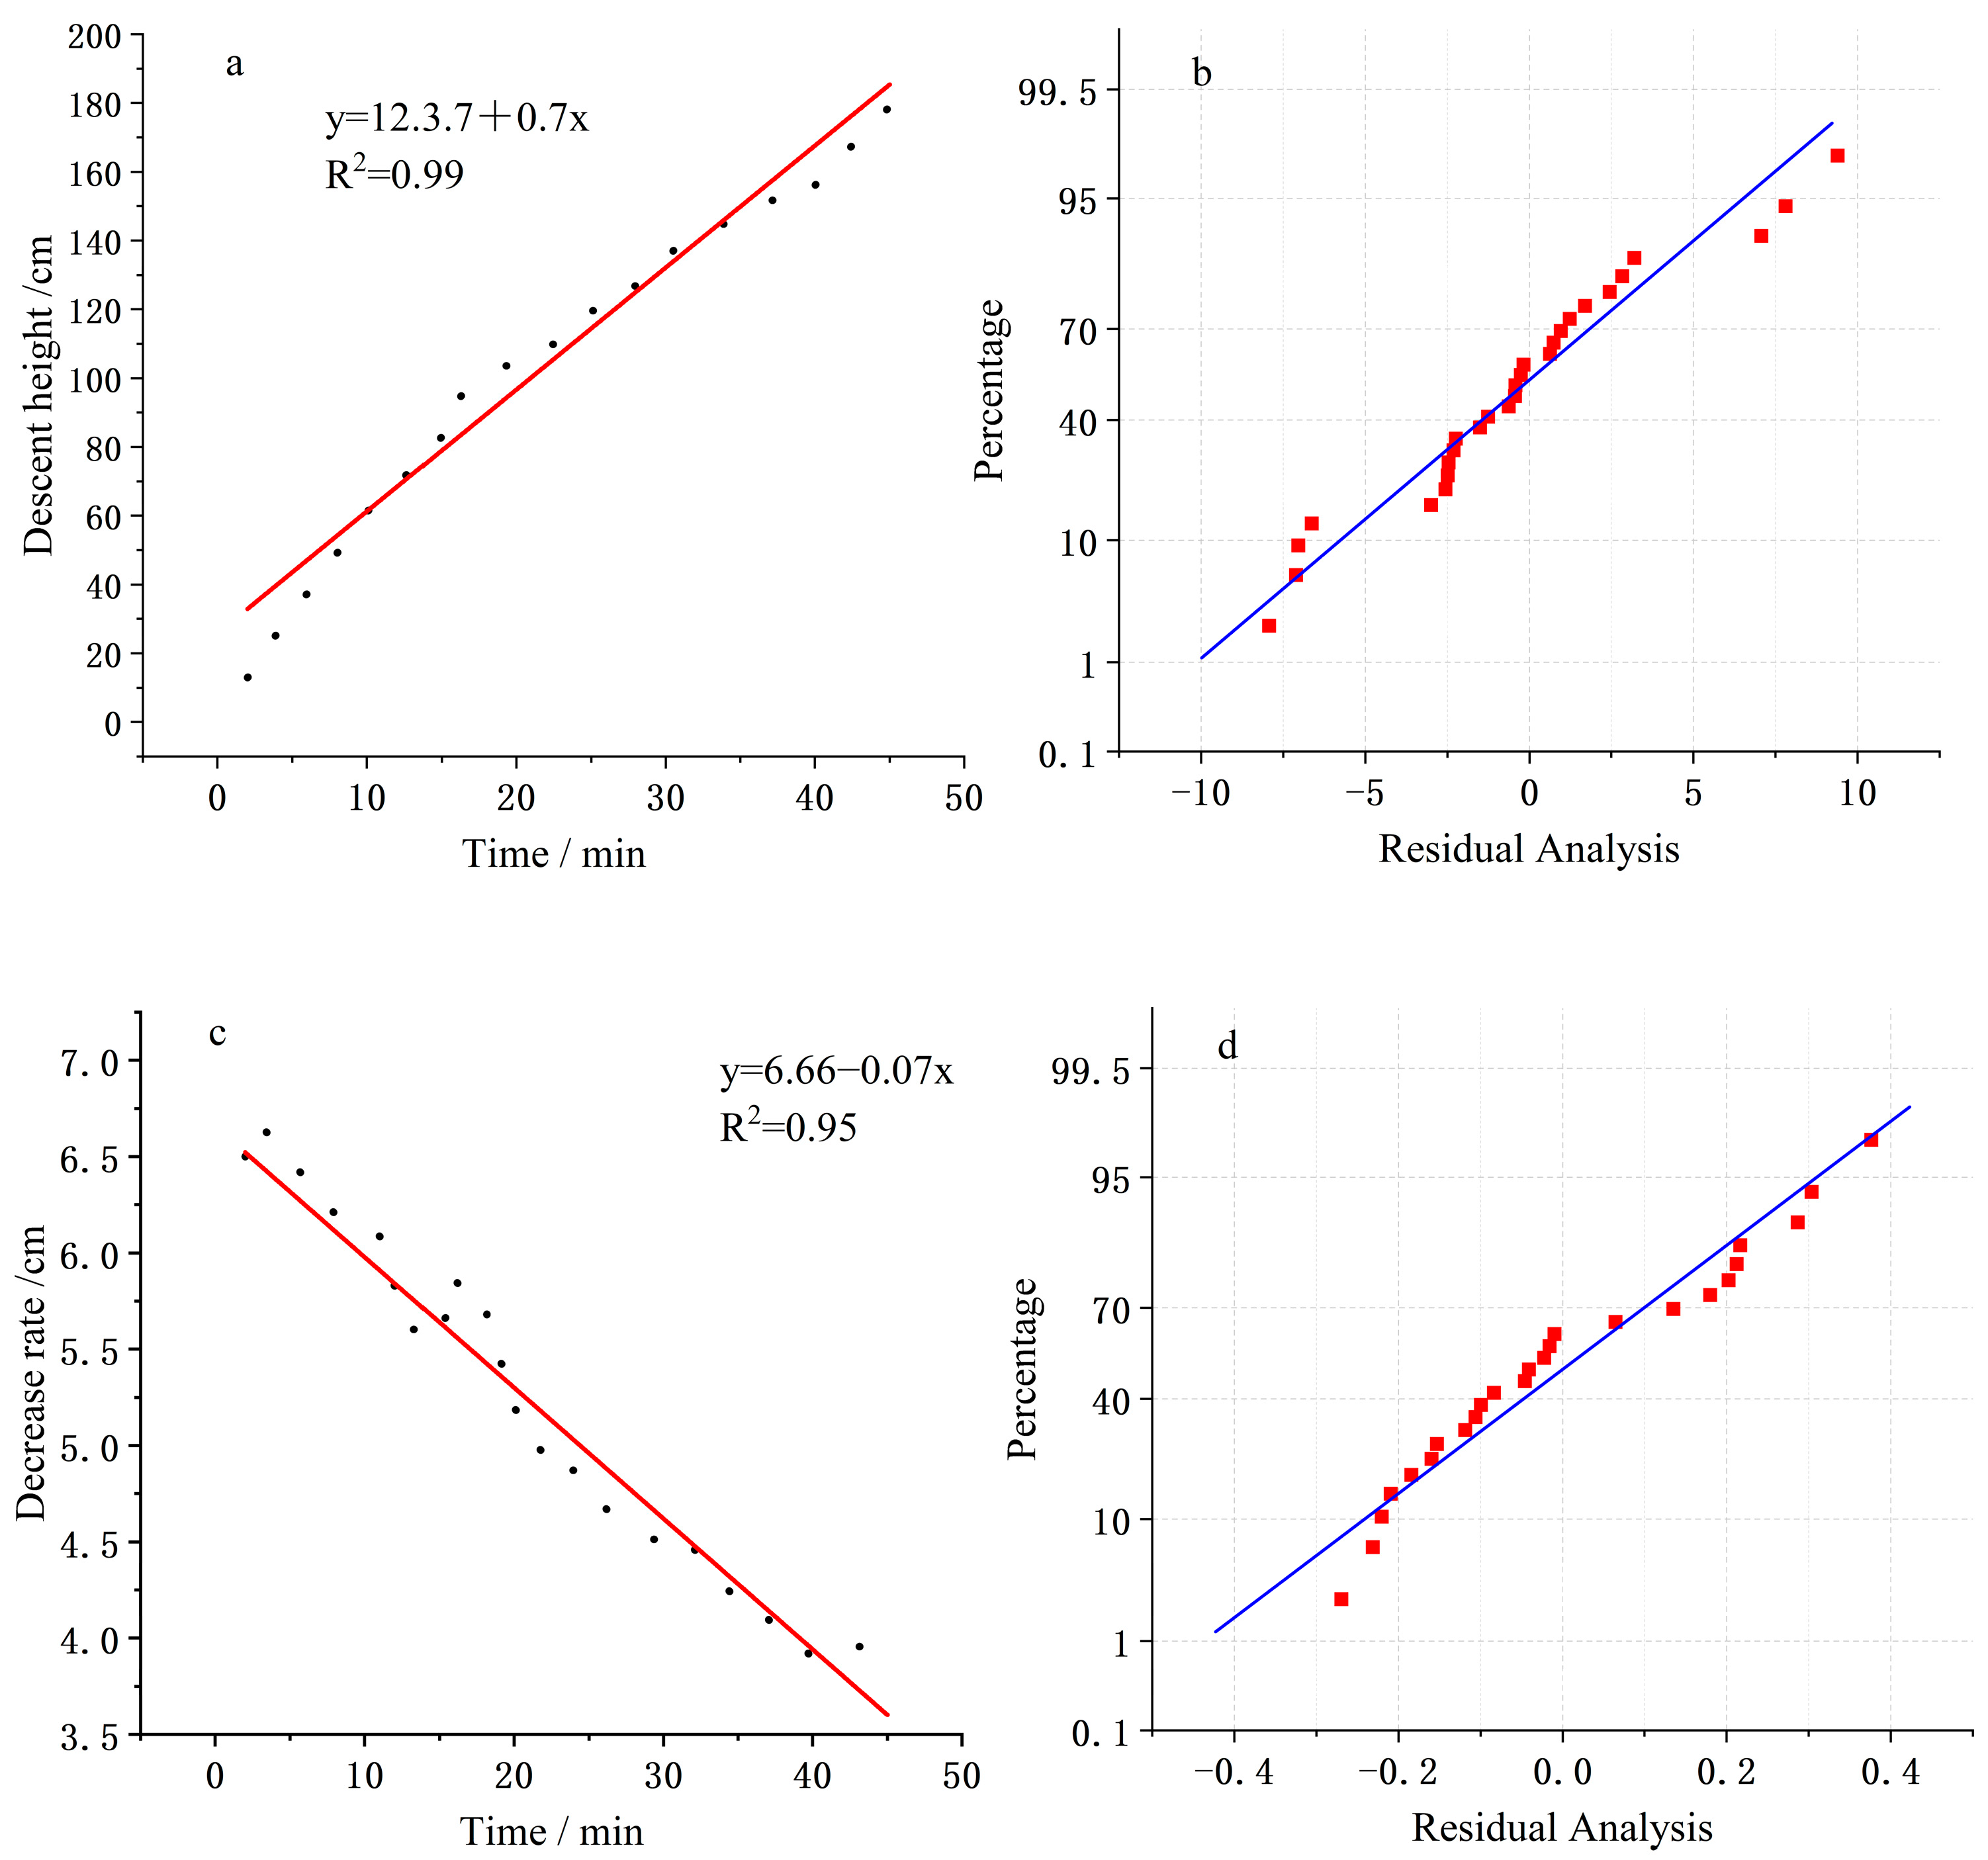
LNAPL mainly migrates vertically at the beginning of the leak and gradually occupies the pores of the soil to form a connected state after the leak. The analysis in
Figure 6 shows that when diesel fuel is passed into the soil column from top to bottom, it migrates downward mainly under the action of gravity, and the surface infiltration depth increases with time in a positive linear relationship, while the infiltration rate increases with time in a negative linear relationship. At 8 min, the LNAPL descent depth was 50 mm, and the descent rate was 6.25 mm/min. The descent depth was 83 mm at 15 min, and the descent rate decreased to 5.53 mm/min. Subsequently, the surface infiltration depth increased from 104 to 159 mm between 20 and 40 min. Although descent depth was not proportional, the overall migration was straight up because, during LNAPL downward migration, as discharge flow increased, the LNAPL pressure gradually increased and occupied the pores. Strong gravity and capillary force formed an oil phase channel. During downward migration, there is always upward capillary force, so the descent and time have a nonproportional relationship. Thus, the surface infiltration model was adopted below for the LNAPL migration process to better represent the relationship between the LNAPL migration process and water and oil content.
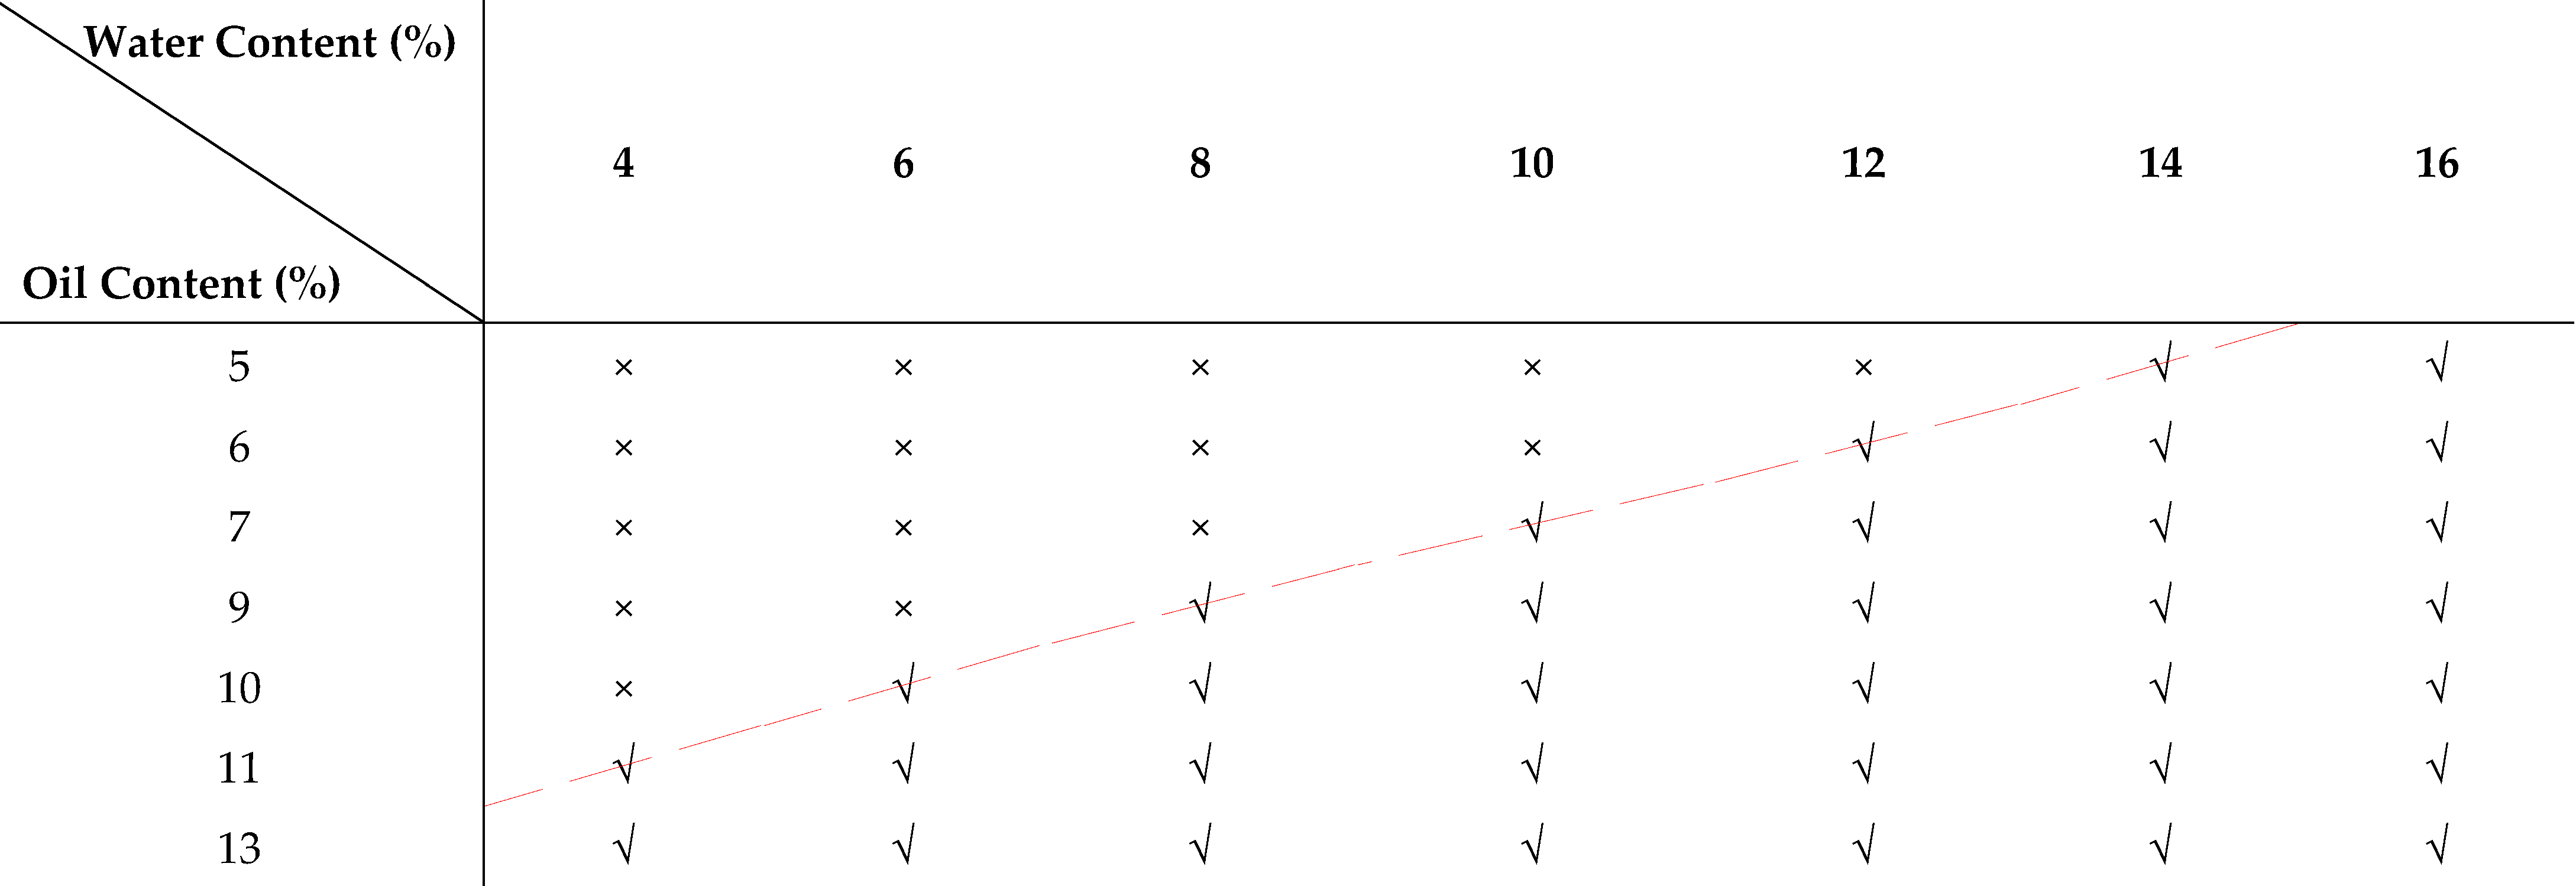
3.2. LNAPL Precipitation Law
Applying the above experiment method, each set of experiments was repeated several times using orthogonal array testing, and the sets with oil flow during the experiment process were recorded as √ and those without as ×. Only when the water–LNAPL in the medium’s pores reaches the critical value of two-phase saturation can free-phase LNAPL continue to migrate downward, and the greater the water content in the medium, the smaller this critical value becomes. The study found a certain linear relationship with the critical value of water–oil two-phase saturation, as shown by the red line in
Table 4, using Origin software (v.10.1) for curve fitting and analysis of the critical oil flow data to obtain the exponential function of oil content
y and water content
x under oil flow, i.e.,
where
y is the oil content,
x is the water content, and the fitted regression equation
= 0.96, indicating that the measured data fit well with the fitted function curve.
LNAPL exists in the unsaturated zone in the following forms: free-flowing liquid phase, adsorbed phase (adsorbed on the surface of soil particles), dissolved phase (dissolved in water), and volatile phase (volatilized in the atmosphere).
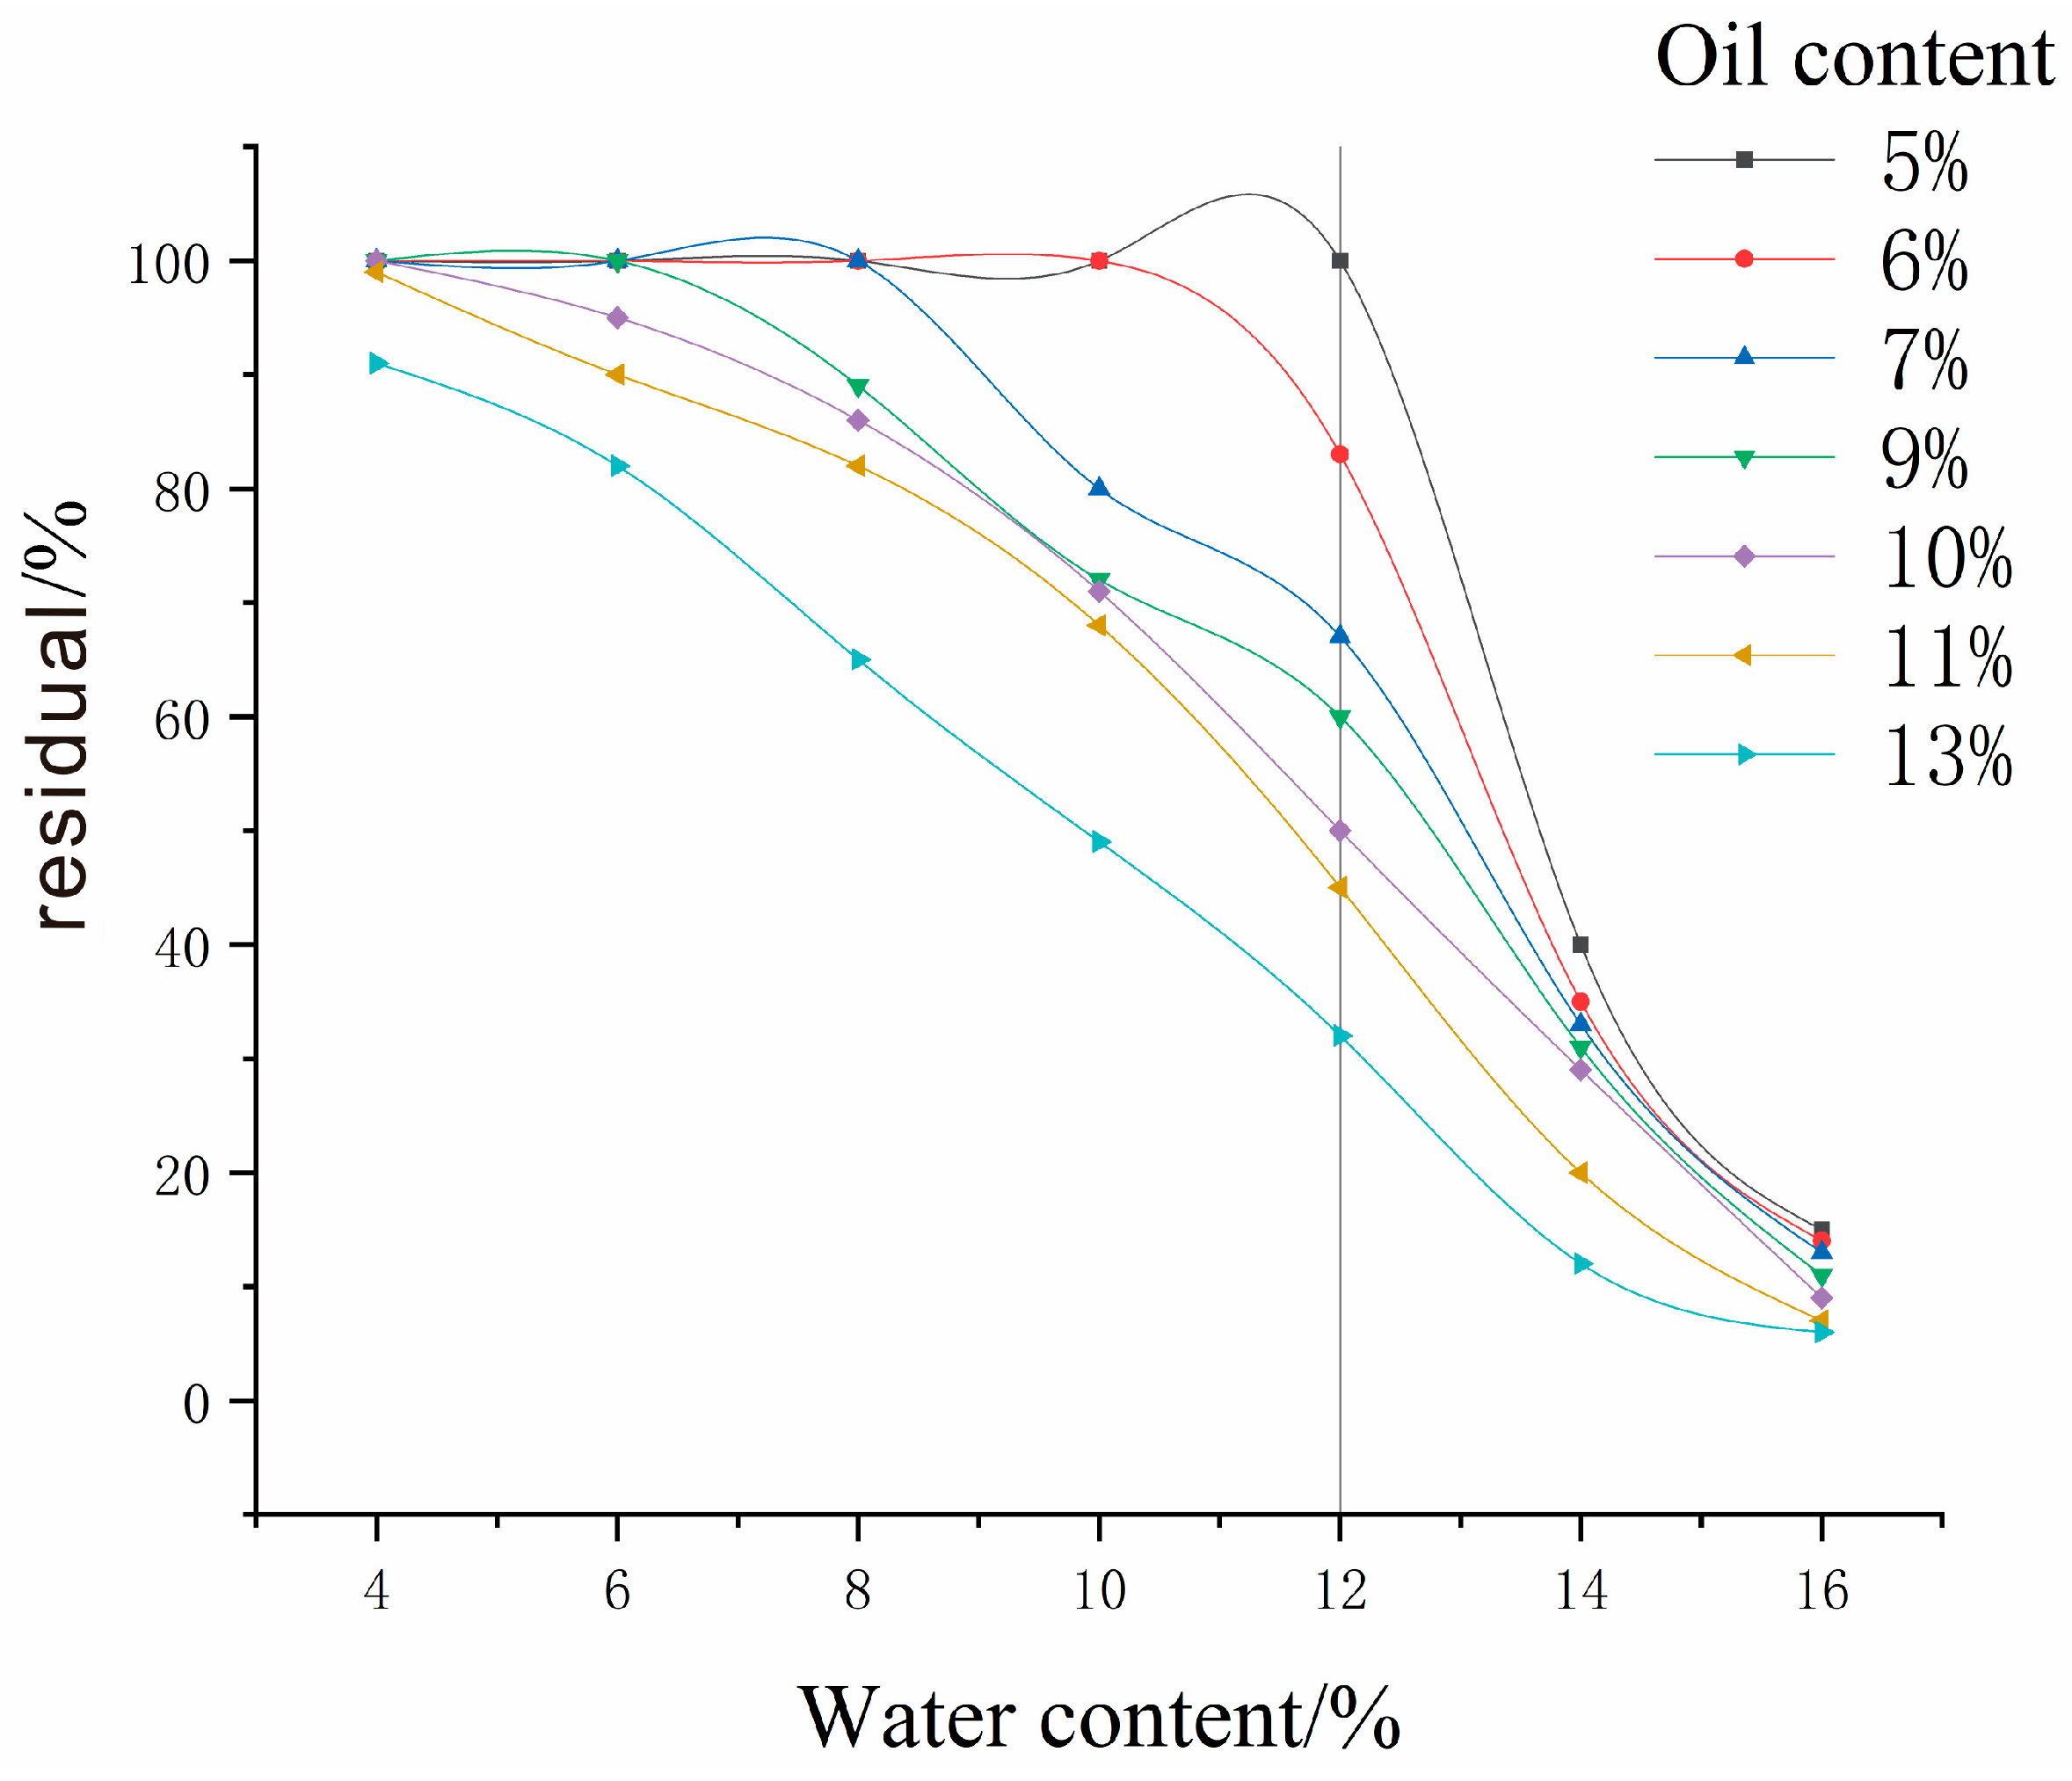
Table 4 shows that oil flow has a lower triangular 0-shaped matrix. When the LNAPL and water content in the soil are above the linearly fitted oil flow point, part of the LNAPL occurs in the soil as an adsorbed phase, and part of it migrates to the groundwater as a free phase, causing groundwater pollution. When the water content of the contaminated site is below 14%, or the oil content is below 11%, LNAPL will exist in a solid phase through adsorption. When the water content in the experiment was greater than 14%, or the oil content was greater than 11%, LNAPL pollutants appeared at the bottom of the glass wall of the test device. LNAPLs migrated to the saturated zone.
3.3. Residual LNAPL
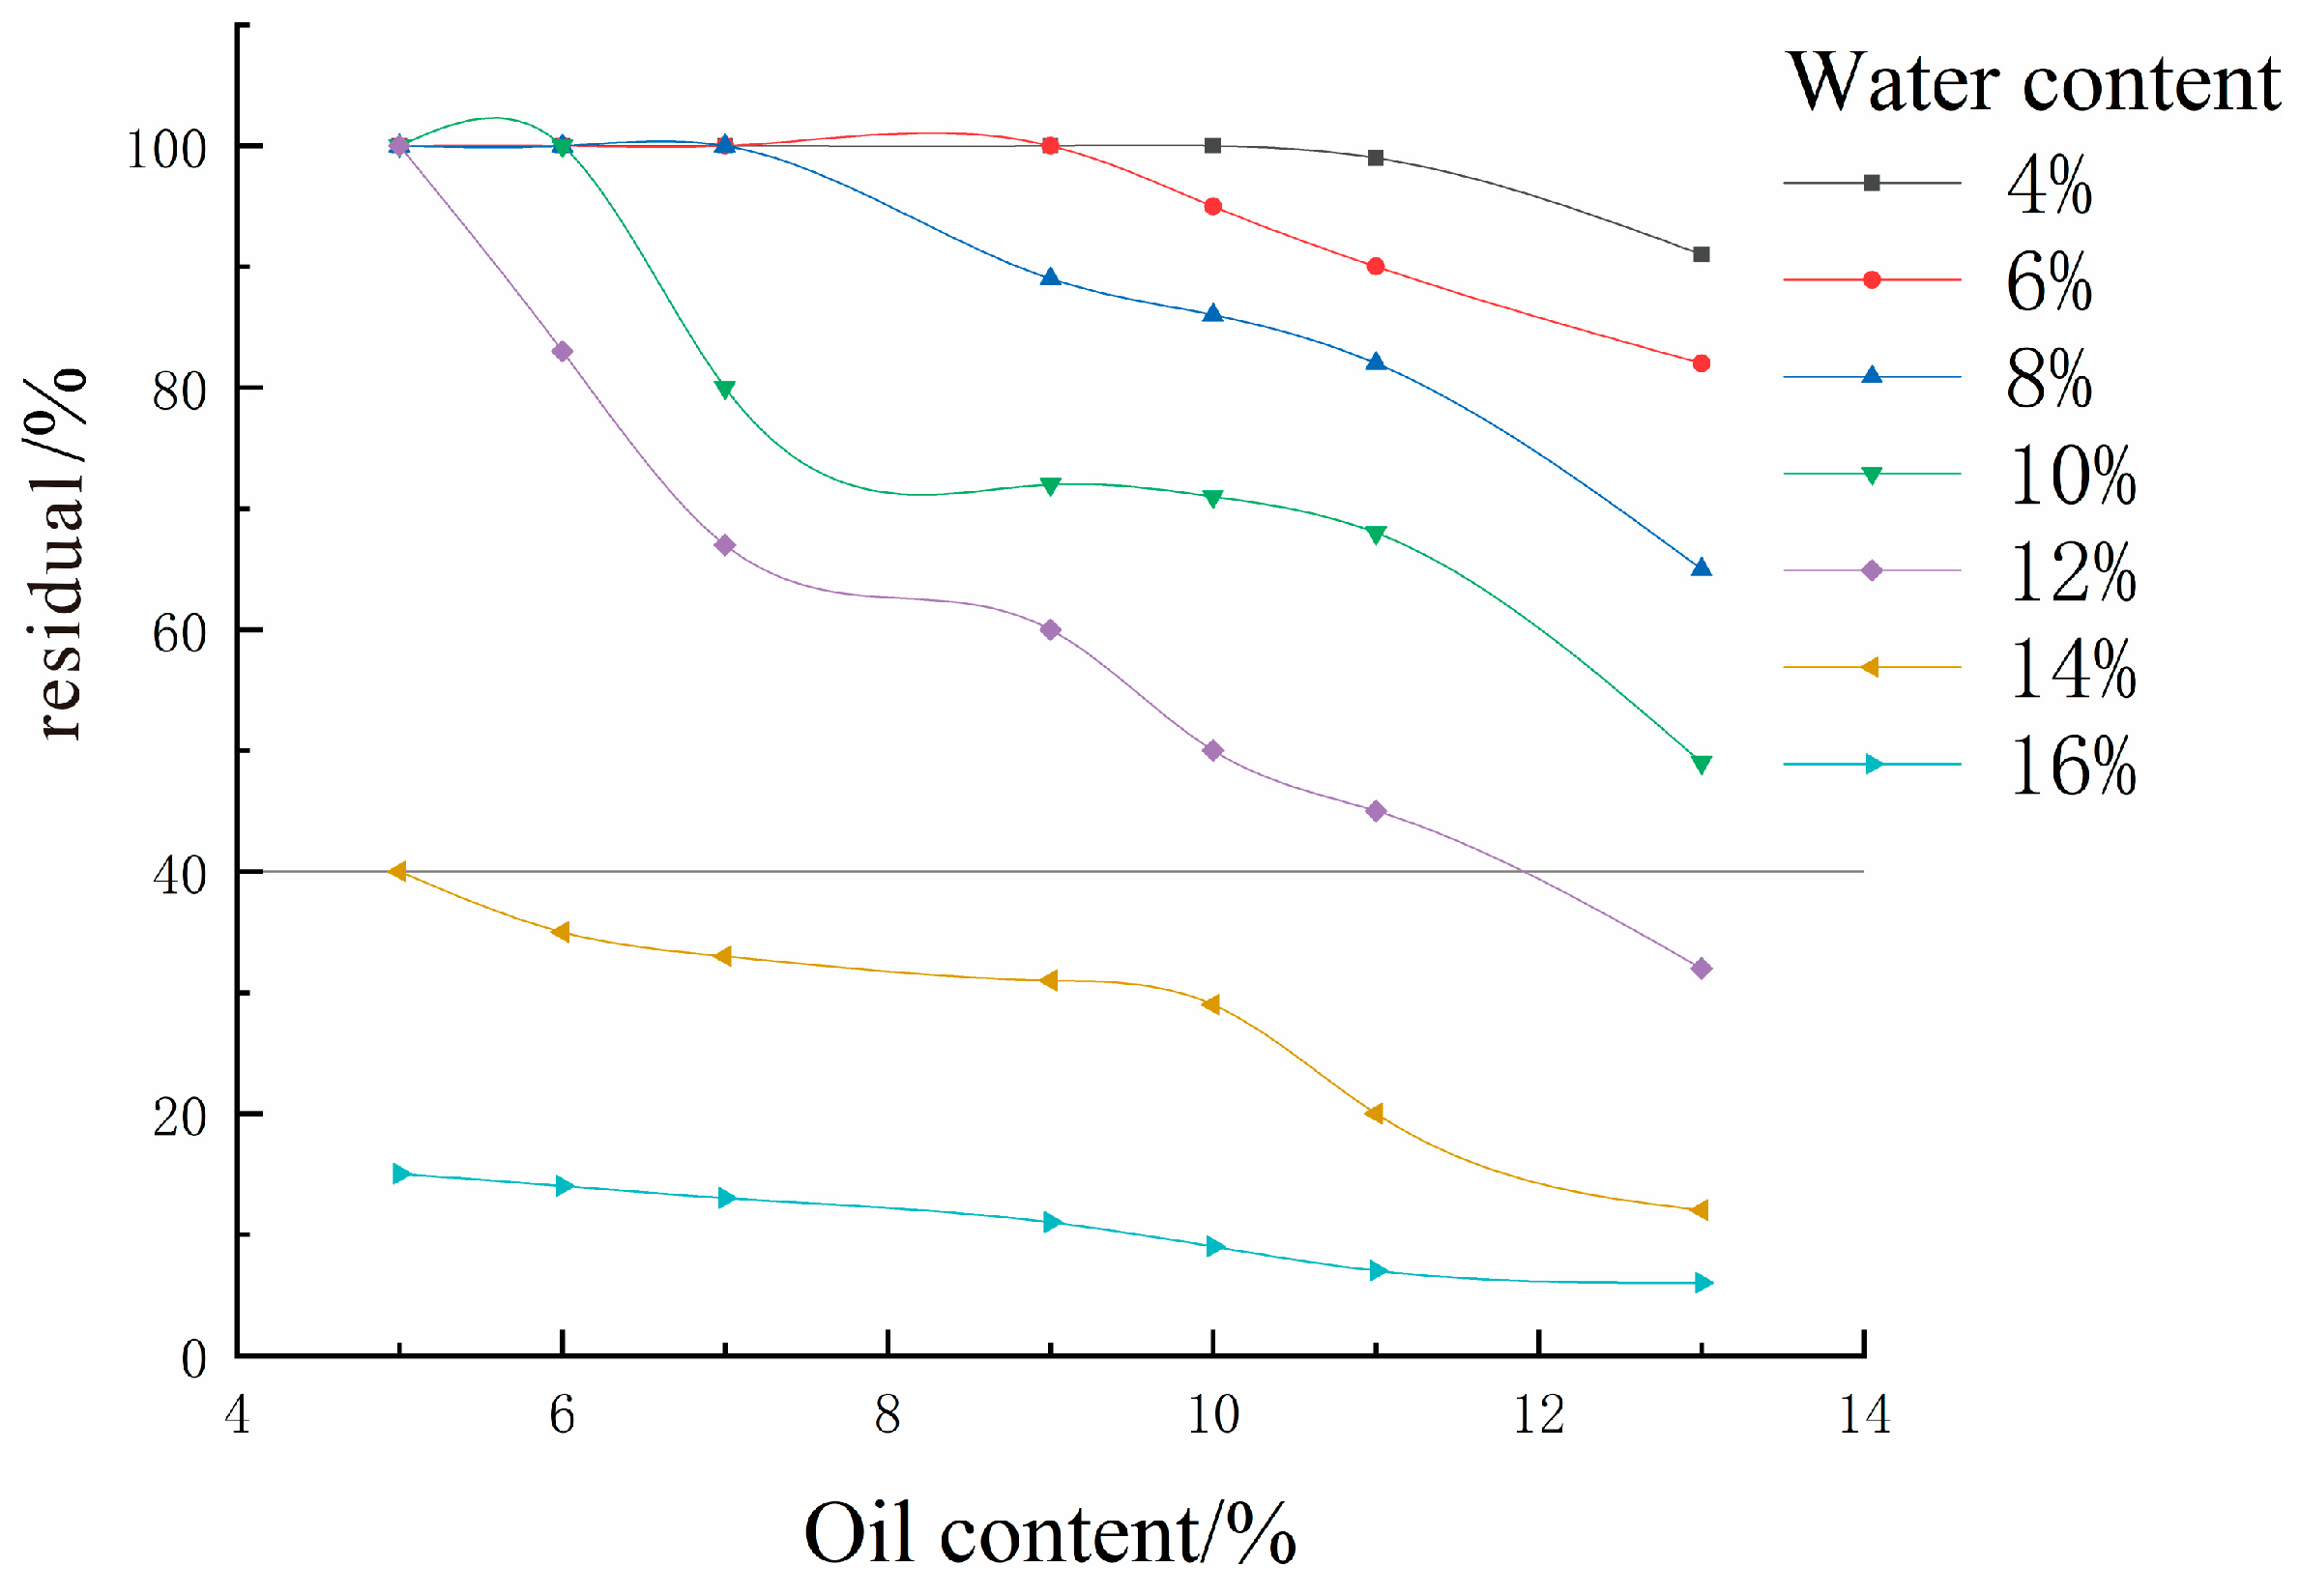
The results of the soil residual LNAPL content versus water content at different water contents are shown in
Figure 7. The results show that when a certain volume of diesel went into the medium,
Qr decreased gradually with increasing water content in the medium, and the relationship between them was nonlinear. When the medium’s water content was above 12%, and the initial quantity of oil exceeded 5%, part of the diesel oil in the soil occurs in a solid phase by residual, and part of the LNAPL migrates from the unsaturated zone to the saturated zone via vertical migration. As the water content increased, the residual oil content in the soil column gradually decreased. When the water content of the medium was greater than 12%, the residual LNAPL content in the medium decreased further.
The results (
Figure 8) show that when the water content of the medium is fixed, as the oil content through the medium increases,
Qr gradually decreases, and a nonlinear relationship was observed between the two. As the oil content increased, the residual LNAPL content in the soil column gradually decreased. When the water content exceeded 12%, and the initial oil content exceeded 5%, the residual LNAPL content of the test medium was less than 40%, and the residual LNAPL content in the medium with different water content decreased gradually as the oil content increased. This indicates that at least 60% of the LNAPL migrates downward in a free phase state. Notably, when the medium does not reach saturation, the large pores in the medium are filled by the water phase, but the small and medium pores are not filled. When LNAPL leakage occurs, a fluid channel forms, and as the LNAPL leakage increases, the pores in the medium will gradually be filled by the oil phase, eventually migrating to the saturated zone under the action of gravity and capillary forces. Soil water content during downward migration has a strong influence on the occurrence state of LNAPL.
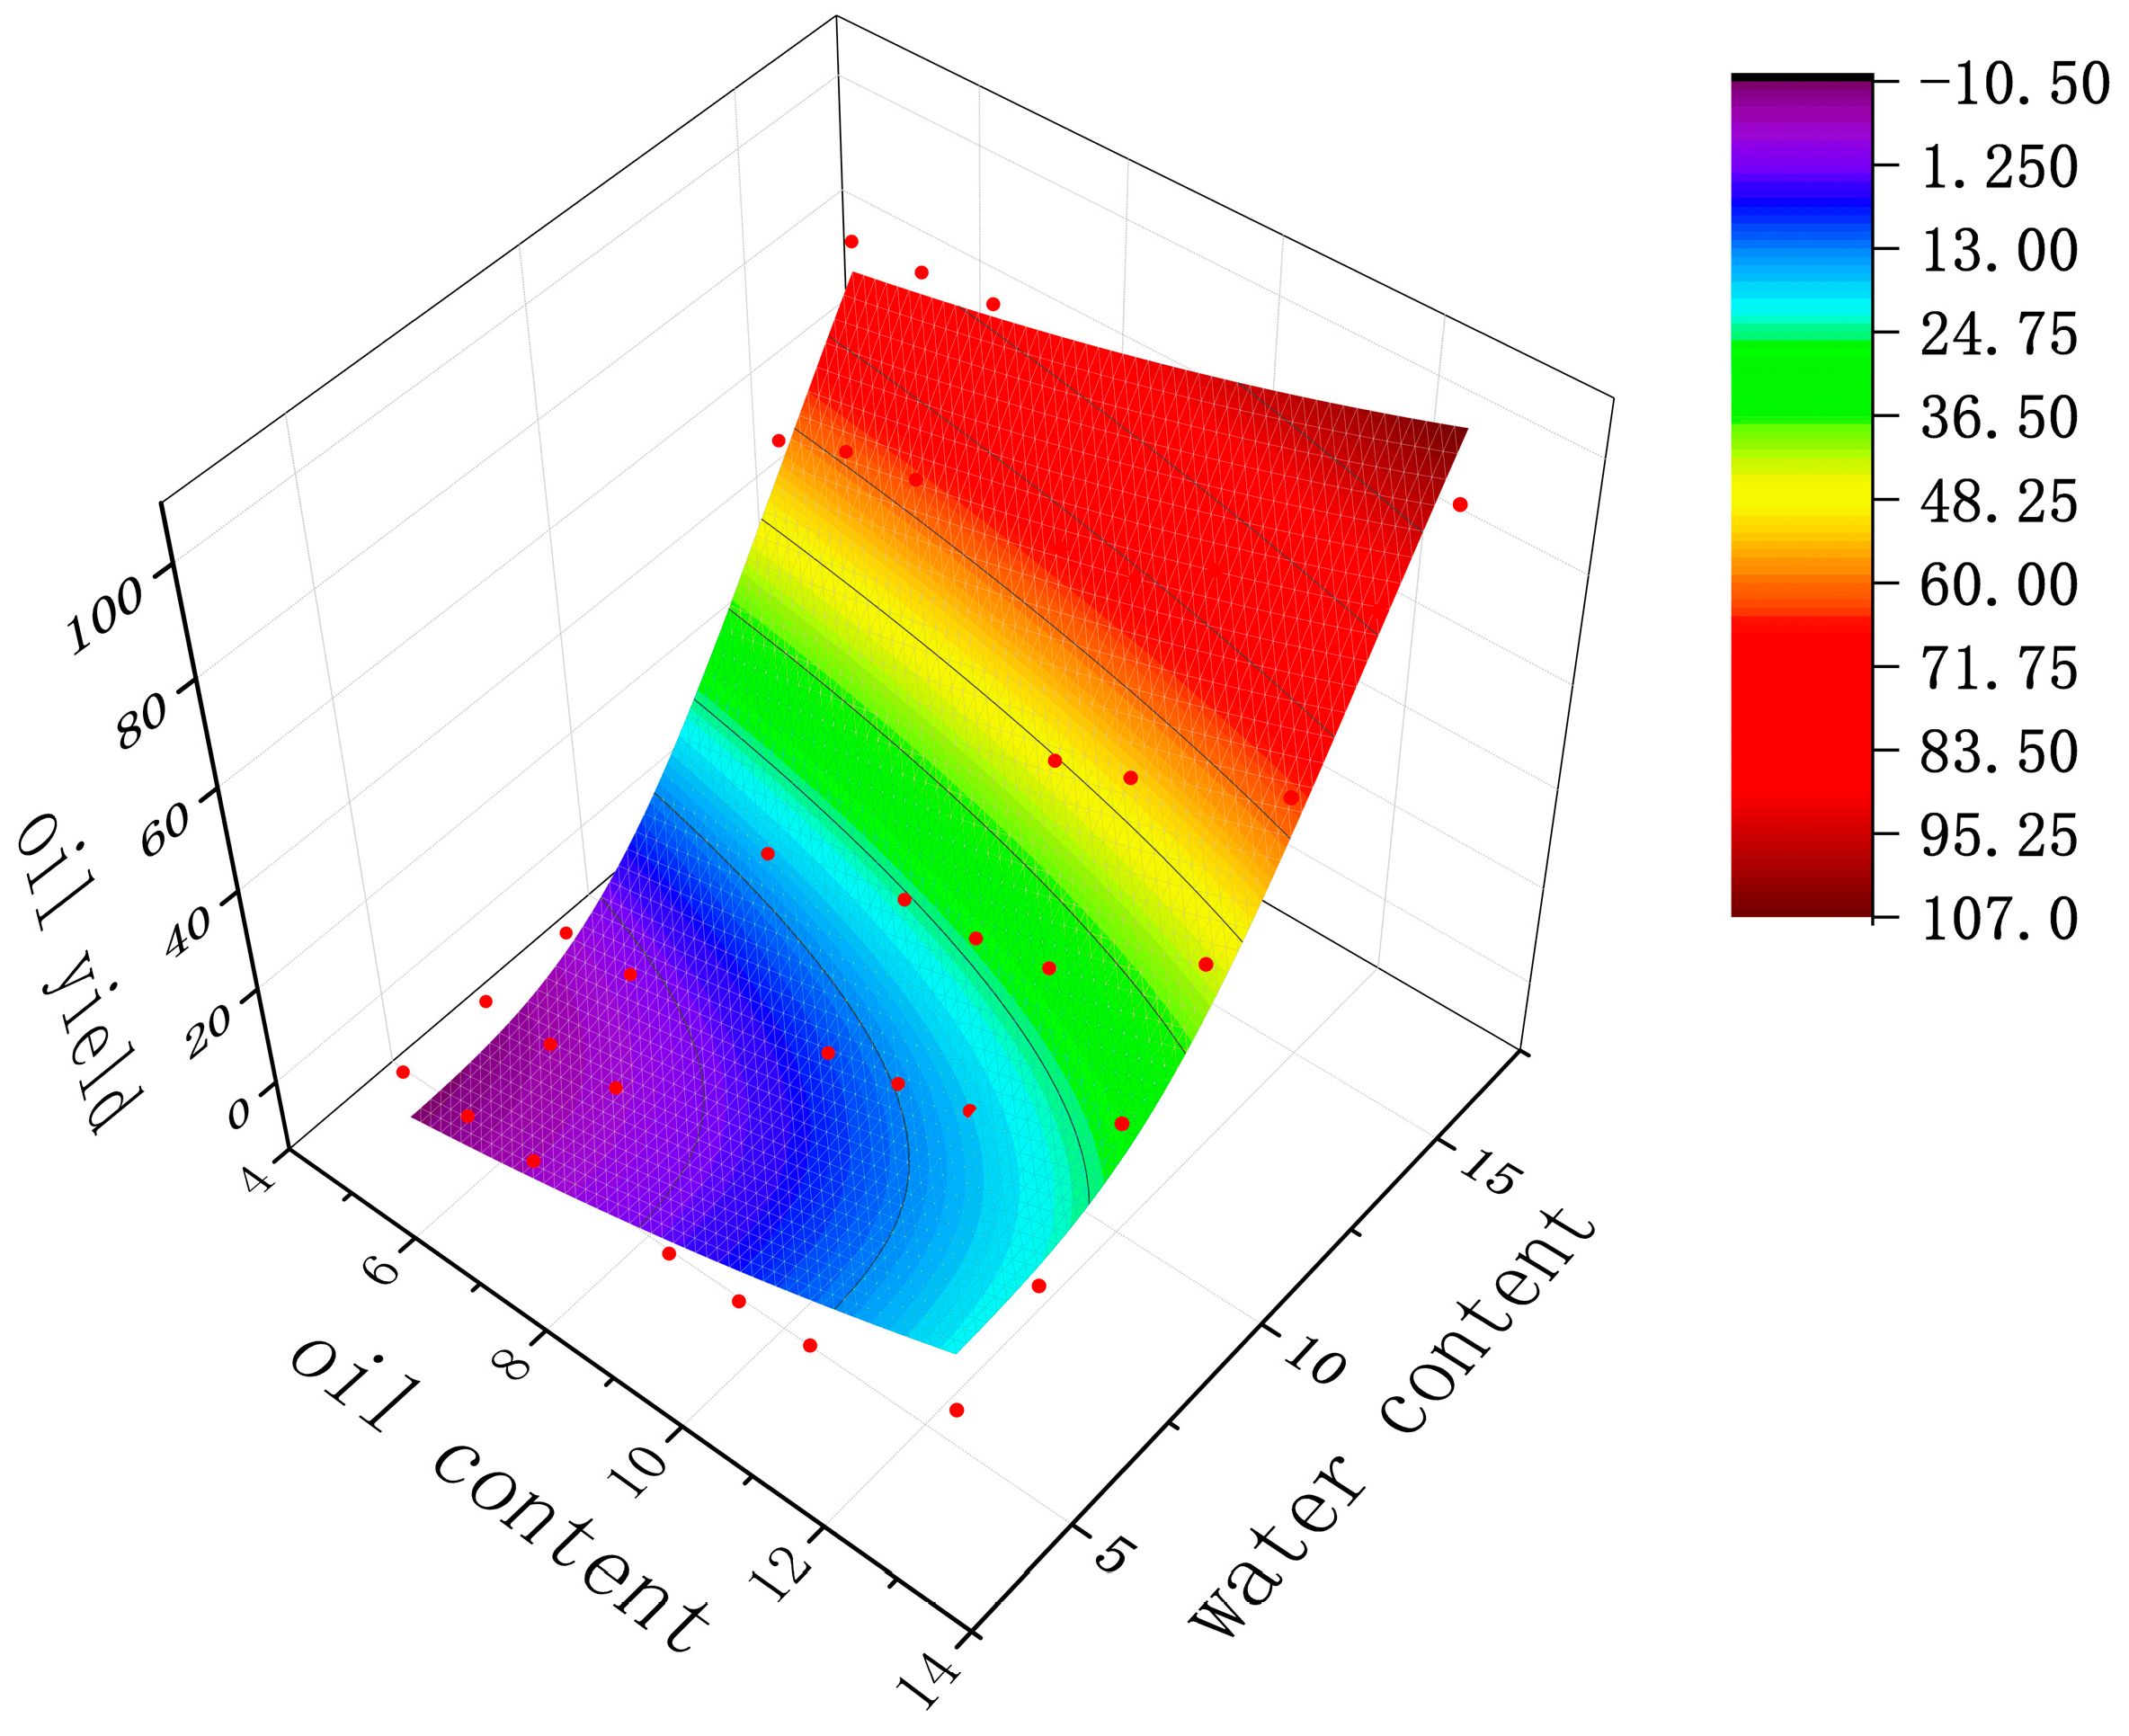
Figure 9 displays a surface chart of the relationship between water content, oil content, and oil flow. Analysis of
Figure 10 indicates that when the initial discharge rate of LNAPL is fixed, the water content has a greater influence on the oil flow, and the oil flow increases as the water content increases, but when the water content reaches 16%, the oil flow reaches 85%, attributed to the downward migration of LNAPL under the action of gravity. As time passes, the water phase in the soil column is gradually replaced by the oil phase, which gradually increases oil saturation in the soil column and increases the pressure of the oil phase; however, with the migration of LNAPL, the diesel saturation in the soil column will not reach complete saturation due to the hysteresis saturation effect under the action of capillary force.
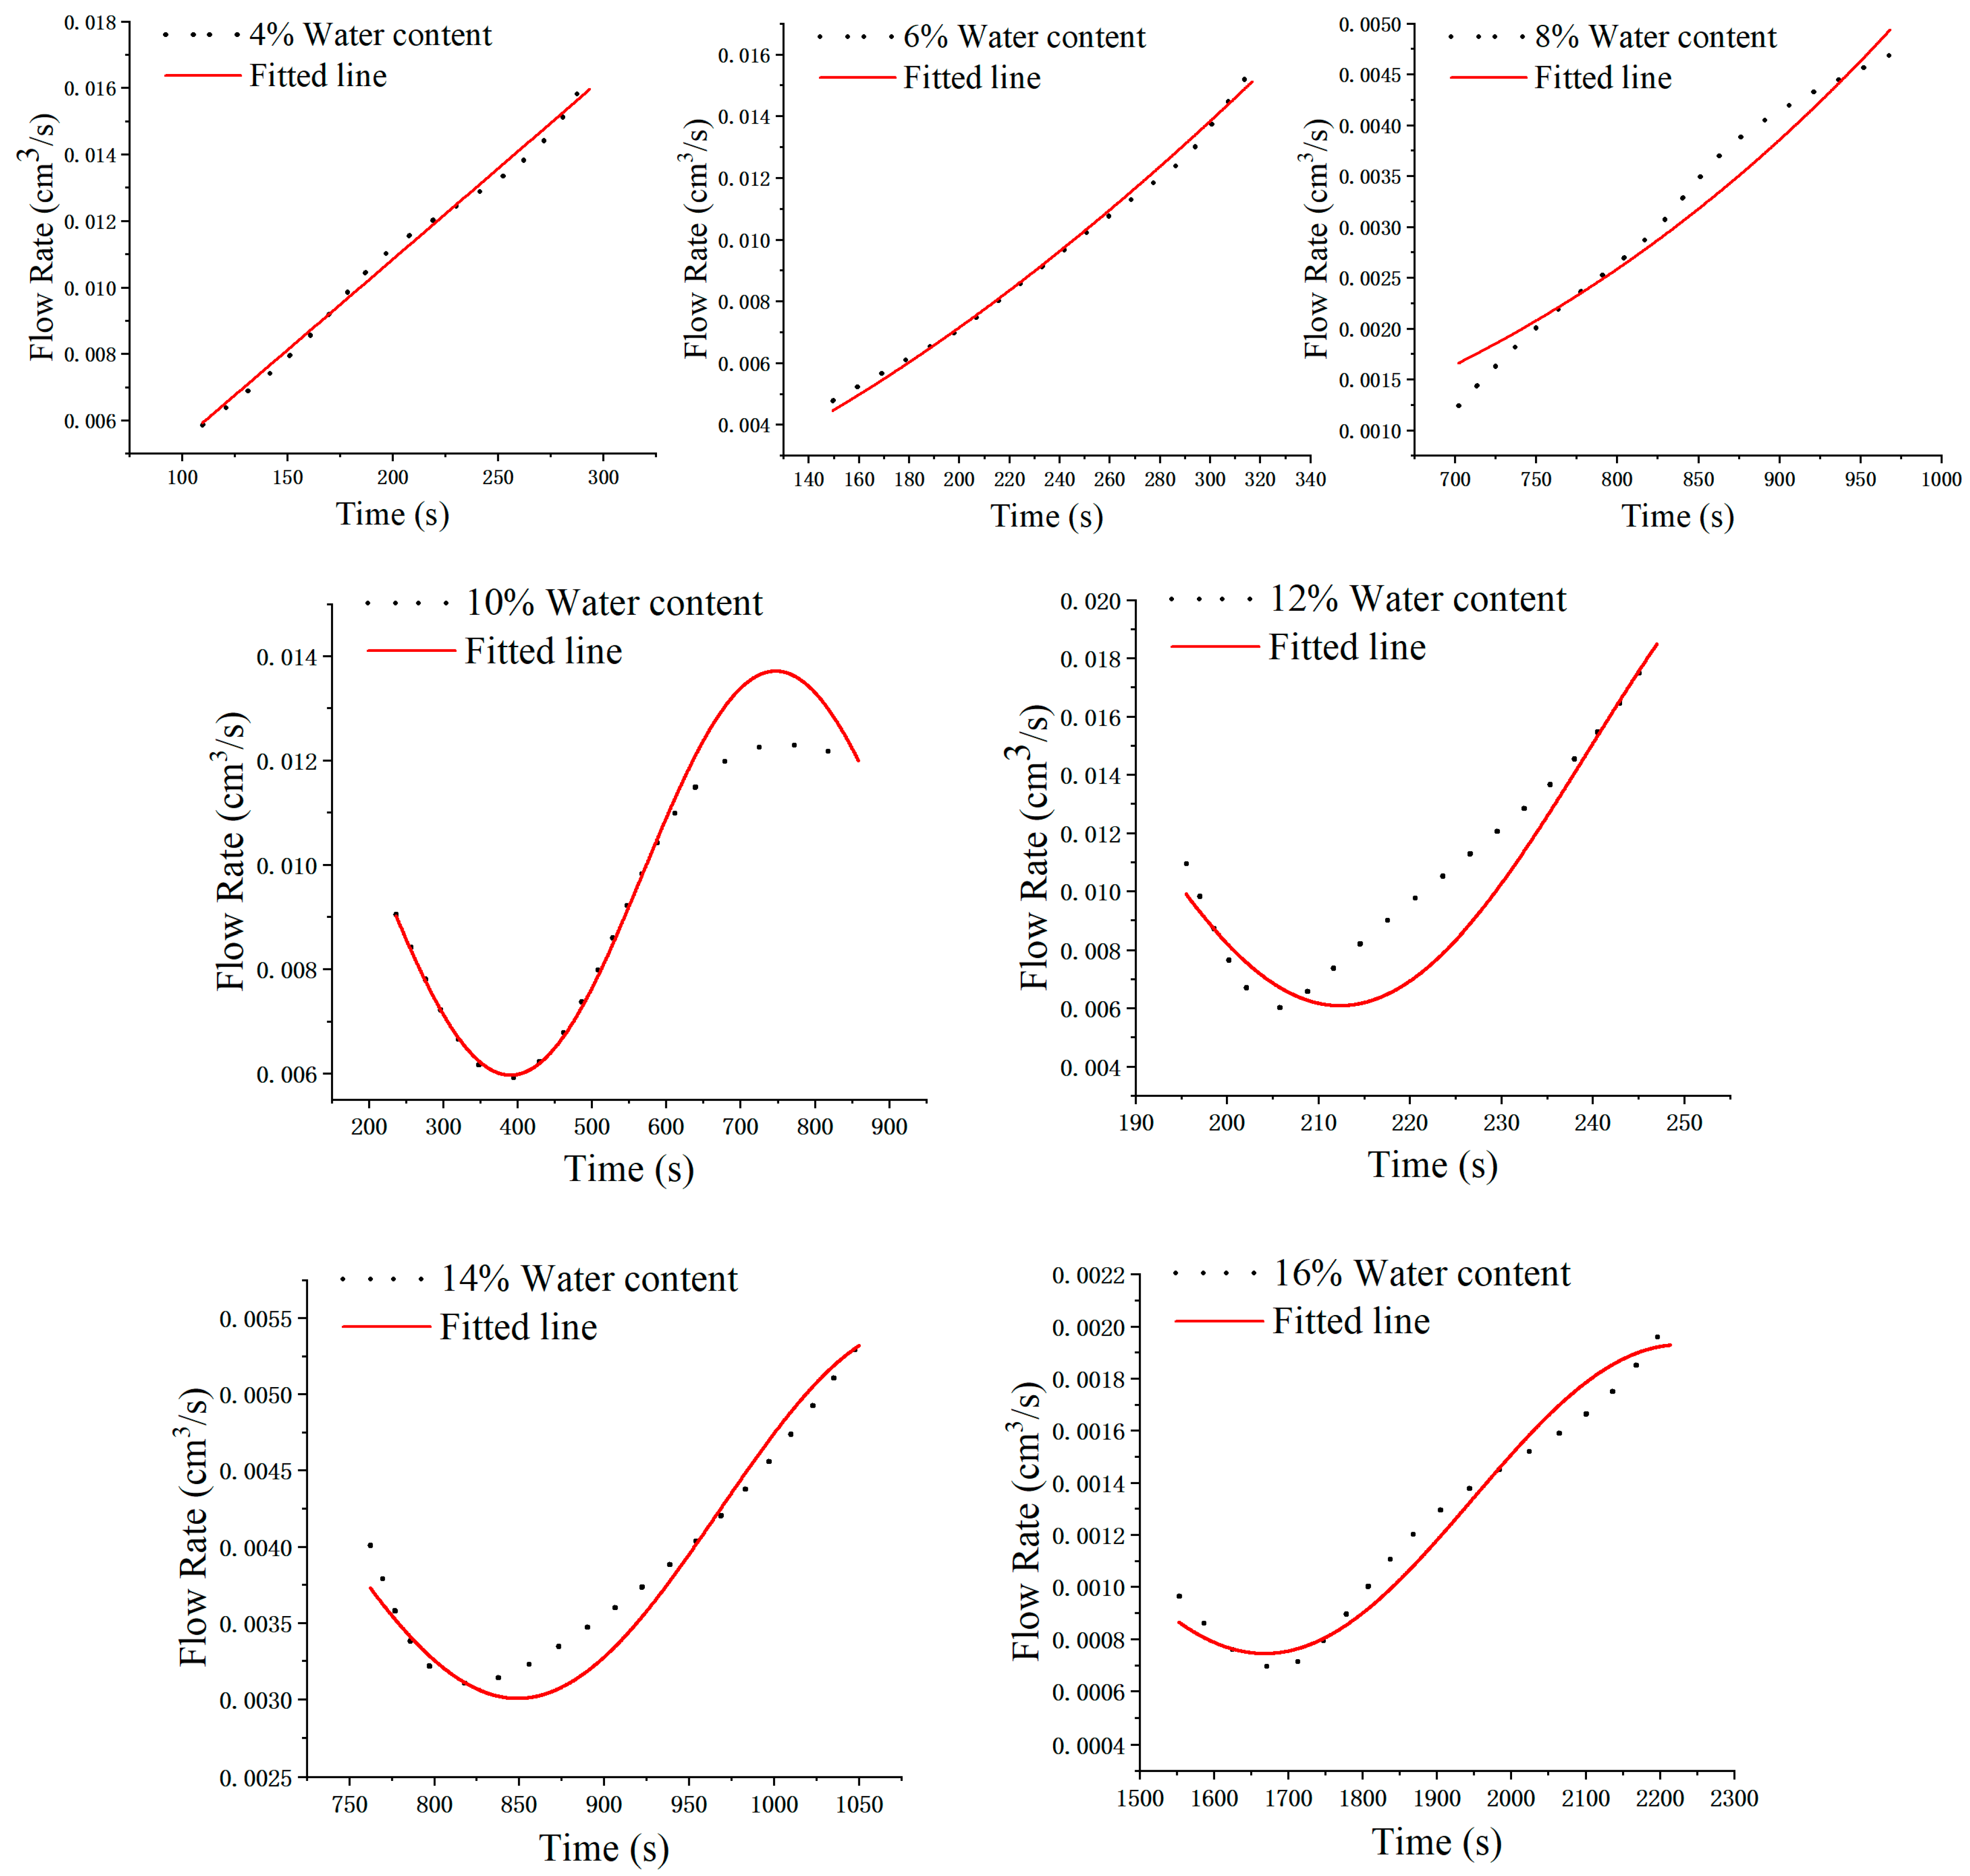
3.4. Relationship Between LNAPL Movement Rate and Water Content
Figure 10 presents the relationship between LNAPL flow rate and time under different water content conditions. Analysis of the data in the Figure indicates that the LNAPL flow rate increases slowly with time when the water content is 4%, 6%, and 8%, and there is a power function (math) relationship between the two. The fitting curve is
y =
a ×
xb. Nevertheless, as the water content in the soil column gradually increased, the LNAPL flow rate decreased and then increased at the water contents of 10%, 12%, 14%, and 16%. The nonlinear fitting curve was
y =
y0 +
A ×
sin (
π × (
x −
xc)/
w). The details of the nonlinear fitting functions for different water content conditions are provided in
Table 5.
To better understand the influence of water content in the soil column on the diesel flow rate, the duration of the experiment was increased, and the water content was found to have less effect on the LNAPL flow rate per unit time below 8%. After the water content exceeded 8%, the LNAPL flow rate decreased and then increased with an increase in time. At 10% water content, the diesel flow rate was 135 mL in 362.33 s when the flow rate inflection point occurred. The flow rate increased beyond this time and decreased at 362.33 s. When the water content was 12%, the diesel flow rate reached its lowest point at 204.05 s of 65 mL, and the flow rate exhibited an increasing trend beyond this point. When the water content was 14%, the diesel flow rate reached its lowest point at 783.47 s of 90 mL, and the flow rate presented a nonlinear increasing relationship beyond this point. At 16% water content, the diesel flow rate reached its lowest point at 55 mL in 1605.45 s, and the long-term flow rate had a nonlinear growth relationship with time beyond this point.
Thus, the greater the oil content of the medium, the less the migration of diesel and the slower the migration rate because in the oil–water two-phase flow in the porous medium, due to the influence of interfacial tension, a transition zone forms between the oil–water interfaces, whose size is affected by fluid. The upper edge of the transition zone has good changing interface characteristics. The distribution of both water and oil phases above the transition zone is uniform, and the oil phase below the transition zone is influenced by the water phase. The pressure difference at the oil–water interface is considerable, so LNAPL will migrate horizontally due to the large pressure difference. As a result, the LNAPL flow rate first decreases and then increases when the water content exceeds 10%, but as the LNAPL discharge rate increases, oil pressure increases, and the movement of the oil phase breaks through the tension at the oil–water interface.
4. Discussion
The present study provides a comprehensive analysis of the impact of water content on the migration of light nonaqueous phase liquids (LNAPLs) in sandy soil. The findings contribute to the understanding of LNAPL behavior in the subsurface environment, which is crucial for developing effective remediation strategies for contaminated sites. The experimental results clearly demonstrate that water content plays a pivotal role in LNAPL migration. In the unsaturated zone, LNAPL migration is influenced by both capillary action and gravity, with the latter becoming more dominant as the water content decreases. This observation is consistent with previous studies that highlighted the dual influence of capillary forces and gravity on LNAPL movement [
27]. However, our study extends these findings by providing a quantitative relationship between water content and LNAPL migration rates under controlled laboratory conditions.
The residual saturation of LNAPL in the soil was found to be negatively correlated with water content, indicating that as water content increases, the amount of LNAPL retained in the soil decreases. This finding is significant as it suggests that in wetter conditions, a greater proportion of LNAPL may migrate into the groundwater, posing a higher risk of contamination. This relationship between water content and residual LNAPL saturation has implications for the design of monitoring wells and the timing of remediation efforts. The nonlinear migration patterns observed in this study, particularly the L-shaped trend during subsurface imbibition, underscore the complexity of LNAPL movement in heterogeneous soil structures. These patterns may be attributed to the varying degrees of soil saturation and the interaction between LNAPL and water within the soil matrix. The nonlinear relationship between LNAPL migration rate and time suggests that migration processes are not constant and are influenced by changing soil conditions, such as water content and oil content.
While our study aligns with previous research in terms of the influence of water content on LNAPL migration, it offers new insights into the specific mechanisms governing this process in sandy soils. For example, our findings regarding the residual LNAPL saturation in different water content conditions contribute to a more nuanced understanding of LNAPL retention and release in the subsurface environment [
26]. Despite the valuable insights gained from this study, there are limitations that should be acknowledged. The experiments were conducted under controlled laboratory conditions, which may not fully replicate the complexity of field conditions. Future research should aim to validate these findings in real-world settings and consider the impact of other factors, such as soil type, temperature, and the presence of other contaminants.


