1. Introduction
Wood and wood-based materials have irreplaceable interior and exterior uses in many applications due to their mechanical and aesthetic properties, which can be reduced in outdoor environments [
1,
2]. By using surface inactivation, oil extraction substances can be expulsed onto the surface of the wood, preventing the access of hydroxyl groups to the wood cell wall. Some extracts from wood (namely, fatty acids, terpenes, phenols, and so on) may be displaced to the outside layer of the wood, becoming a resinous layer. Inactivating the surface layer for many wood applications shows improvements in terms of lower roughness and reduced losses in plane machining, resulting in higher-quality wood surfaces.
In order to achieve better physical and mechanical properties or a colour change, the use of a treatment process is important, and heat treatment is one of the most common methods for material treatment [
3]. Depending on the medium and material used in the treatment process, there are several types of heat treatment [
4]. Thermally modified wood can be found almost everywhere, and currently, the most common methods are, for example, ThermoWood in Finland, Plato Wood in the Netherlands, oil heat treatment (OHT) in Germany, and Les Bois Perdure and the rectification process (Retiwood) in France [
5,
6]. There are also lesser-known treatment processes that use superheated steam, such as Wood Treatment Technology (WTT) in Denmark and Firmolin technology in the Netherlands, or a partial vacuum, like Termovuoto in Italy [
7]. The overall process of heat treatment can be defined as a treatment in which wood is processed at high temperatures in ranges between 100 and 260 °C and in an environment without the use of a chemical substance but rather in a type of medium (steam, nitrogen, oil, etc.) [
6,
8].
In the furniture industry, woodworking processes such as milling are widespread; milling is achieved using tools—cutters with a rotating motion—the trajectory of which could be described as the movement of cutting teeth travelling along a cycloid curve. Depending on requirements and quality, the milling process has to achieve a certain accuracy and roughness of the surface [
9]. With the selection of certain milling parameters, one can achieve the increased surface quality of woodwork products [
10,
11,
12] and a better optimisation of energy consumption [
13,
14]. The results of empirical research show that heat-treated wood can be used for milling because the treatment does not affect the grain size of chips formed in sawing and milling [
15].
Even beyond the manufacturing sphere, the use of models created by an artificial intelligence machine learning algorithm is becoming more common. Based on data acquired via experiments, it is possible to create a prediction model that predicts the factors that influence the technical parameters of manufacturing [
16]. Machine learning consists of the computation of huge amounts of acquired data for the creation of a prediction model; three basic types of machine learning are used for this purpose: supervised learning, unsupervised learning, and feedback learning [
17]. To predict process parameters, tools are used to analyse the measured data and create the subsequent model. These tools include machine learning as a subfield in artificial intelligence, regression models, artificial neural networks, deep learning [
18,
19], decision trees, and support vector machines [
20]. Common algorithms used in unsupervised learning include hidden Markov models, k-means, hierarchical clustering, and Gaussian mixture models [
20].
Currently, there exist several types of approaches to machine learning for the purpose of the prediction of important parameters in machining processes [
21], such as cutting force, surface roughness [
22], and cutting performance [
23]. However, very few works are dedicated to the creation of models and the analysis of signals in the processing of wood-based materials. New approaches to the processing and analysis of measurable signals can also provide new insights in this field. The authors of [
24] demonstrated the dependence of the vibration amplitude on selected parameters during milling on a CNC machining centre. Furthermore, the currently ongoing digital revolution (Industry 4.0) provides powerful tools for the monitoring of and data collection in production processes and their remote online processing by using interconnected cybernetic physical systems and creating digital twins [
25].
In the phase of data training using an input database, there is an attempt to teach the algorithm to predict the output as closely as possible. During the training phase, iterations are implemented to improve the success of the algorithm, while the parameters are random or have initialisation values, and the results are predicted based on the given parameters. The actual values are subsequently compared with these values, and the parameters are adjusted. The data comparison process is repeated cyclically until the model reaches a point where it is no longer improves, i.e., until the accuracy of the prediction no longer shows improvement. There are two types of problems in the training process: underfitting and overfitting [
17].
In practice, based on experiments and research, there are several machine learning algorithms. In general, there is no algorithm that will always be the best or worst, and each has its advantages and disadvantages, so it is not even possible to compare them. According to [
20], the most well-known machine learning algorithms include the following:
This article deals with the use of cutting power data obtained during the milling of hydrothermally modified beech wood to create mathematical models of machine learning. First, the measured data are processed and evaluated statistically to determine the statistical significance of the effects of individual technical/technological milling parameters.
Following the statistical evaluation, the study progresses to the creation and parameterisation of machine learning models. These models are then rigorously tested to assess their suitability for the specific type of data. The evaluation is based on the correlation coefficient of measured and predicted data. The study concludes with insightful recommendations and comparisons with other authors’ work.
3. Results and Discussion
The descriptive statistics of cutting power are presented in
Table 6. The cutting power values were calculated according to Equation (2), i.e., as the difference between the recorded power when the milling machine was running and idling.
Aspects of the statistical significance of the effects of technical/technological parameters on cutting power were evaluated by ANOVA. At the same time, the cutting power values were calculated as the difference between milling and idling power consumption for every single milling process. The results are shown in
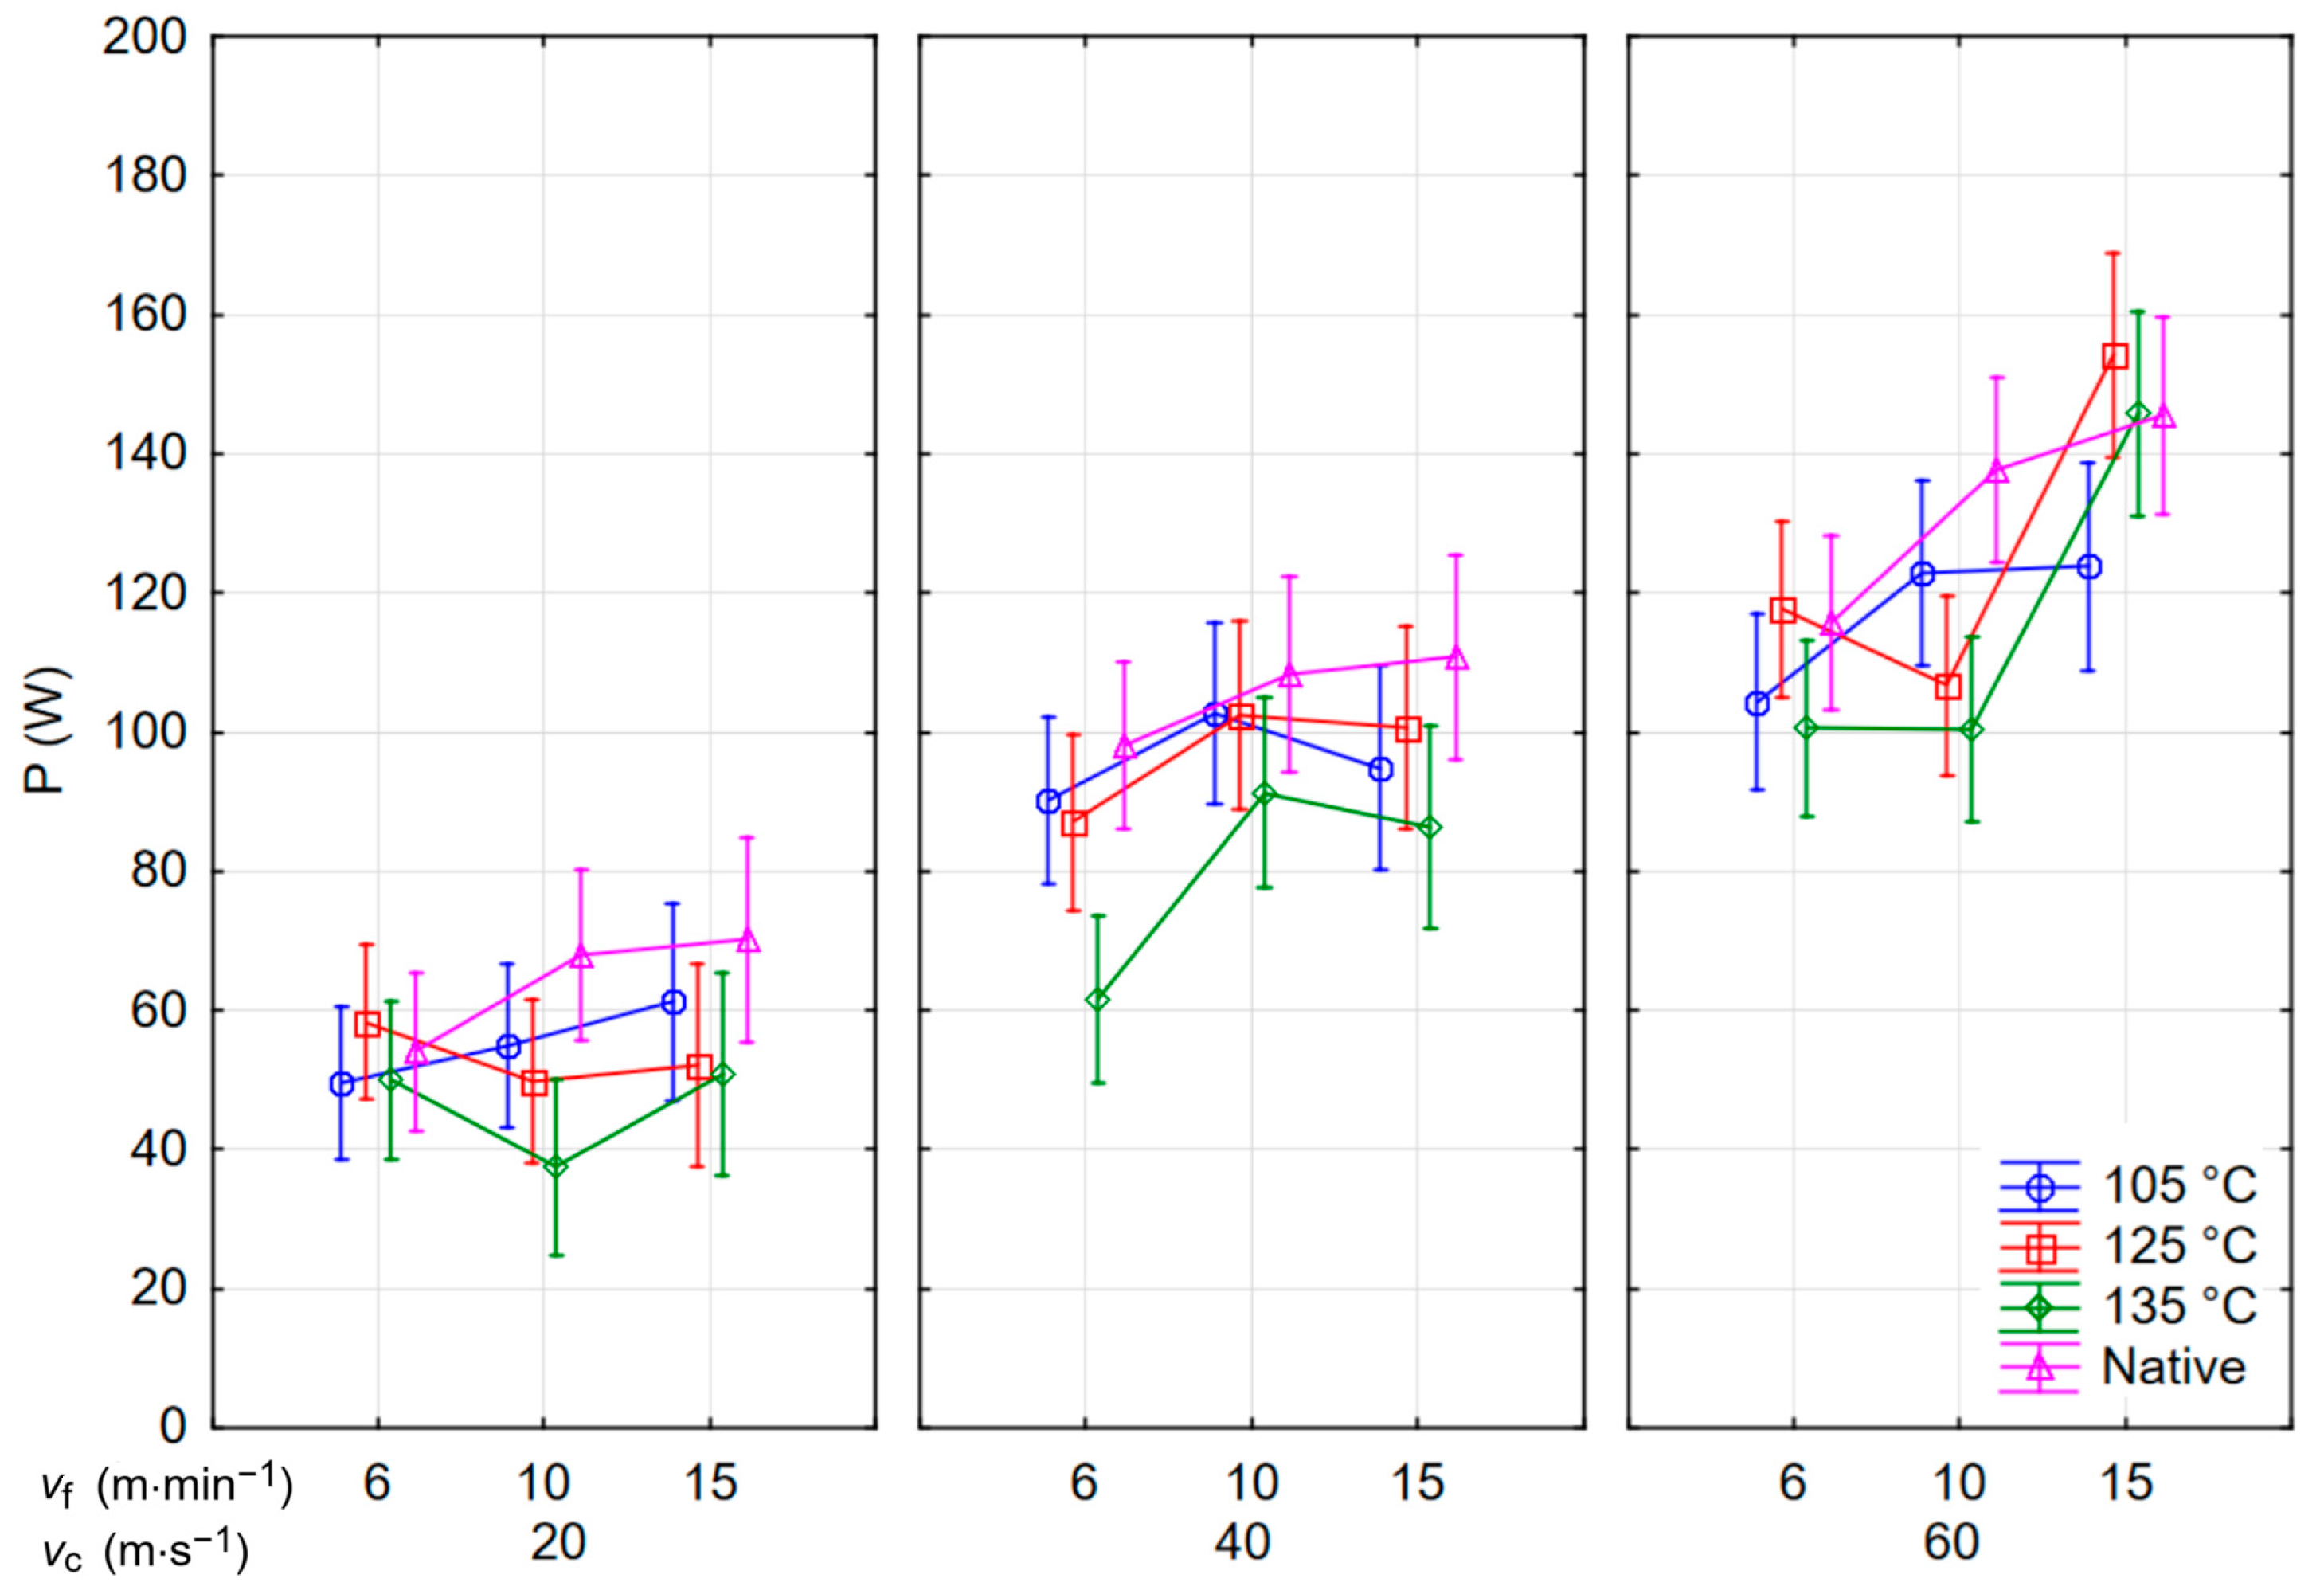
Figure 6, wherein vertical bars indicate a confidence interval of 95%. The cutting speed had the most significant impact on cutting power, as determined by the F-test (F-test: 127.04), followed by the rake angle (69.59) and material (F-test: 6.97). The feed speed had the lowest impact on the cutting input (F-test: 2.32). Similar correlations were also found by the authors of [
27].
From the curves in
Figure 6, it was confirmed that increasing the cutting speed increases the power required to remove the material with the cutting tool because cutting power is a product of the elementary cutting force and cutting speed [
28]. The same conclusions are confirmed by both older and more recent results of milling wood and wood-based materials, e.g., in [
29,
30,
31]. From the point of view of the material, the highest values of cutting power are obtained when milling natural wood and the lowest when milling wood treated at the highest temperature. This dependence is related to the density of the wood and the chemical processes that change it during hydrothermal treatment, which is also confirmed, for example, in [
32,
33]. However, a slight decrease in density was detected at a temperature of 105 °C.
The measured data were tested for the probability of similarity by Duncan’s post hoc test. Here, the effects of changing the cutting speed, feed speed, and rake angle were statistically significant. This means that the probability of the similarity of data sets for individual groups of variables was less than 5%. For the heat-treatment temperature, the similarity probabilities of the data sets were also below 5%, except for the data obtained at temperatures of 105 and 125 °C, where it was 33.2%.
The creation and testing of mathematical models were realised using STATISTICA 12 software with the data mining tool. Before testing the data, defining the dependent (target) and independent variables (input) for the most suitable mathematical model was necessary. The independent variables were the feed speed
vf, the angular geometry of the tool γ, the cutting speed
vc, and the hydrothermal modification of the material
T. The dependent variable was the cutting power
P. After definition, the type of each variable was chosen, either categorical or continuous, which is displayed in
Table 7. In the next step, data training and the calculation of the basic statistics of the model were performed, and all the data were used as input in the training stage. The data were evaluated as suitable for creating a mathematical model. The last step was the selection of methods, where the model methods were C&RT (classification and regression tree) decision trees, random forests, neural networks, support trees, and support vector machine (SVM).
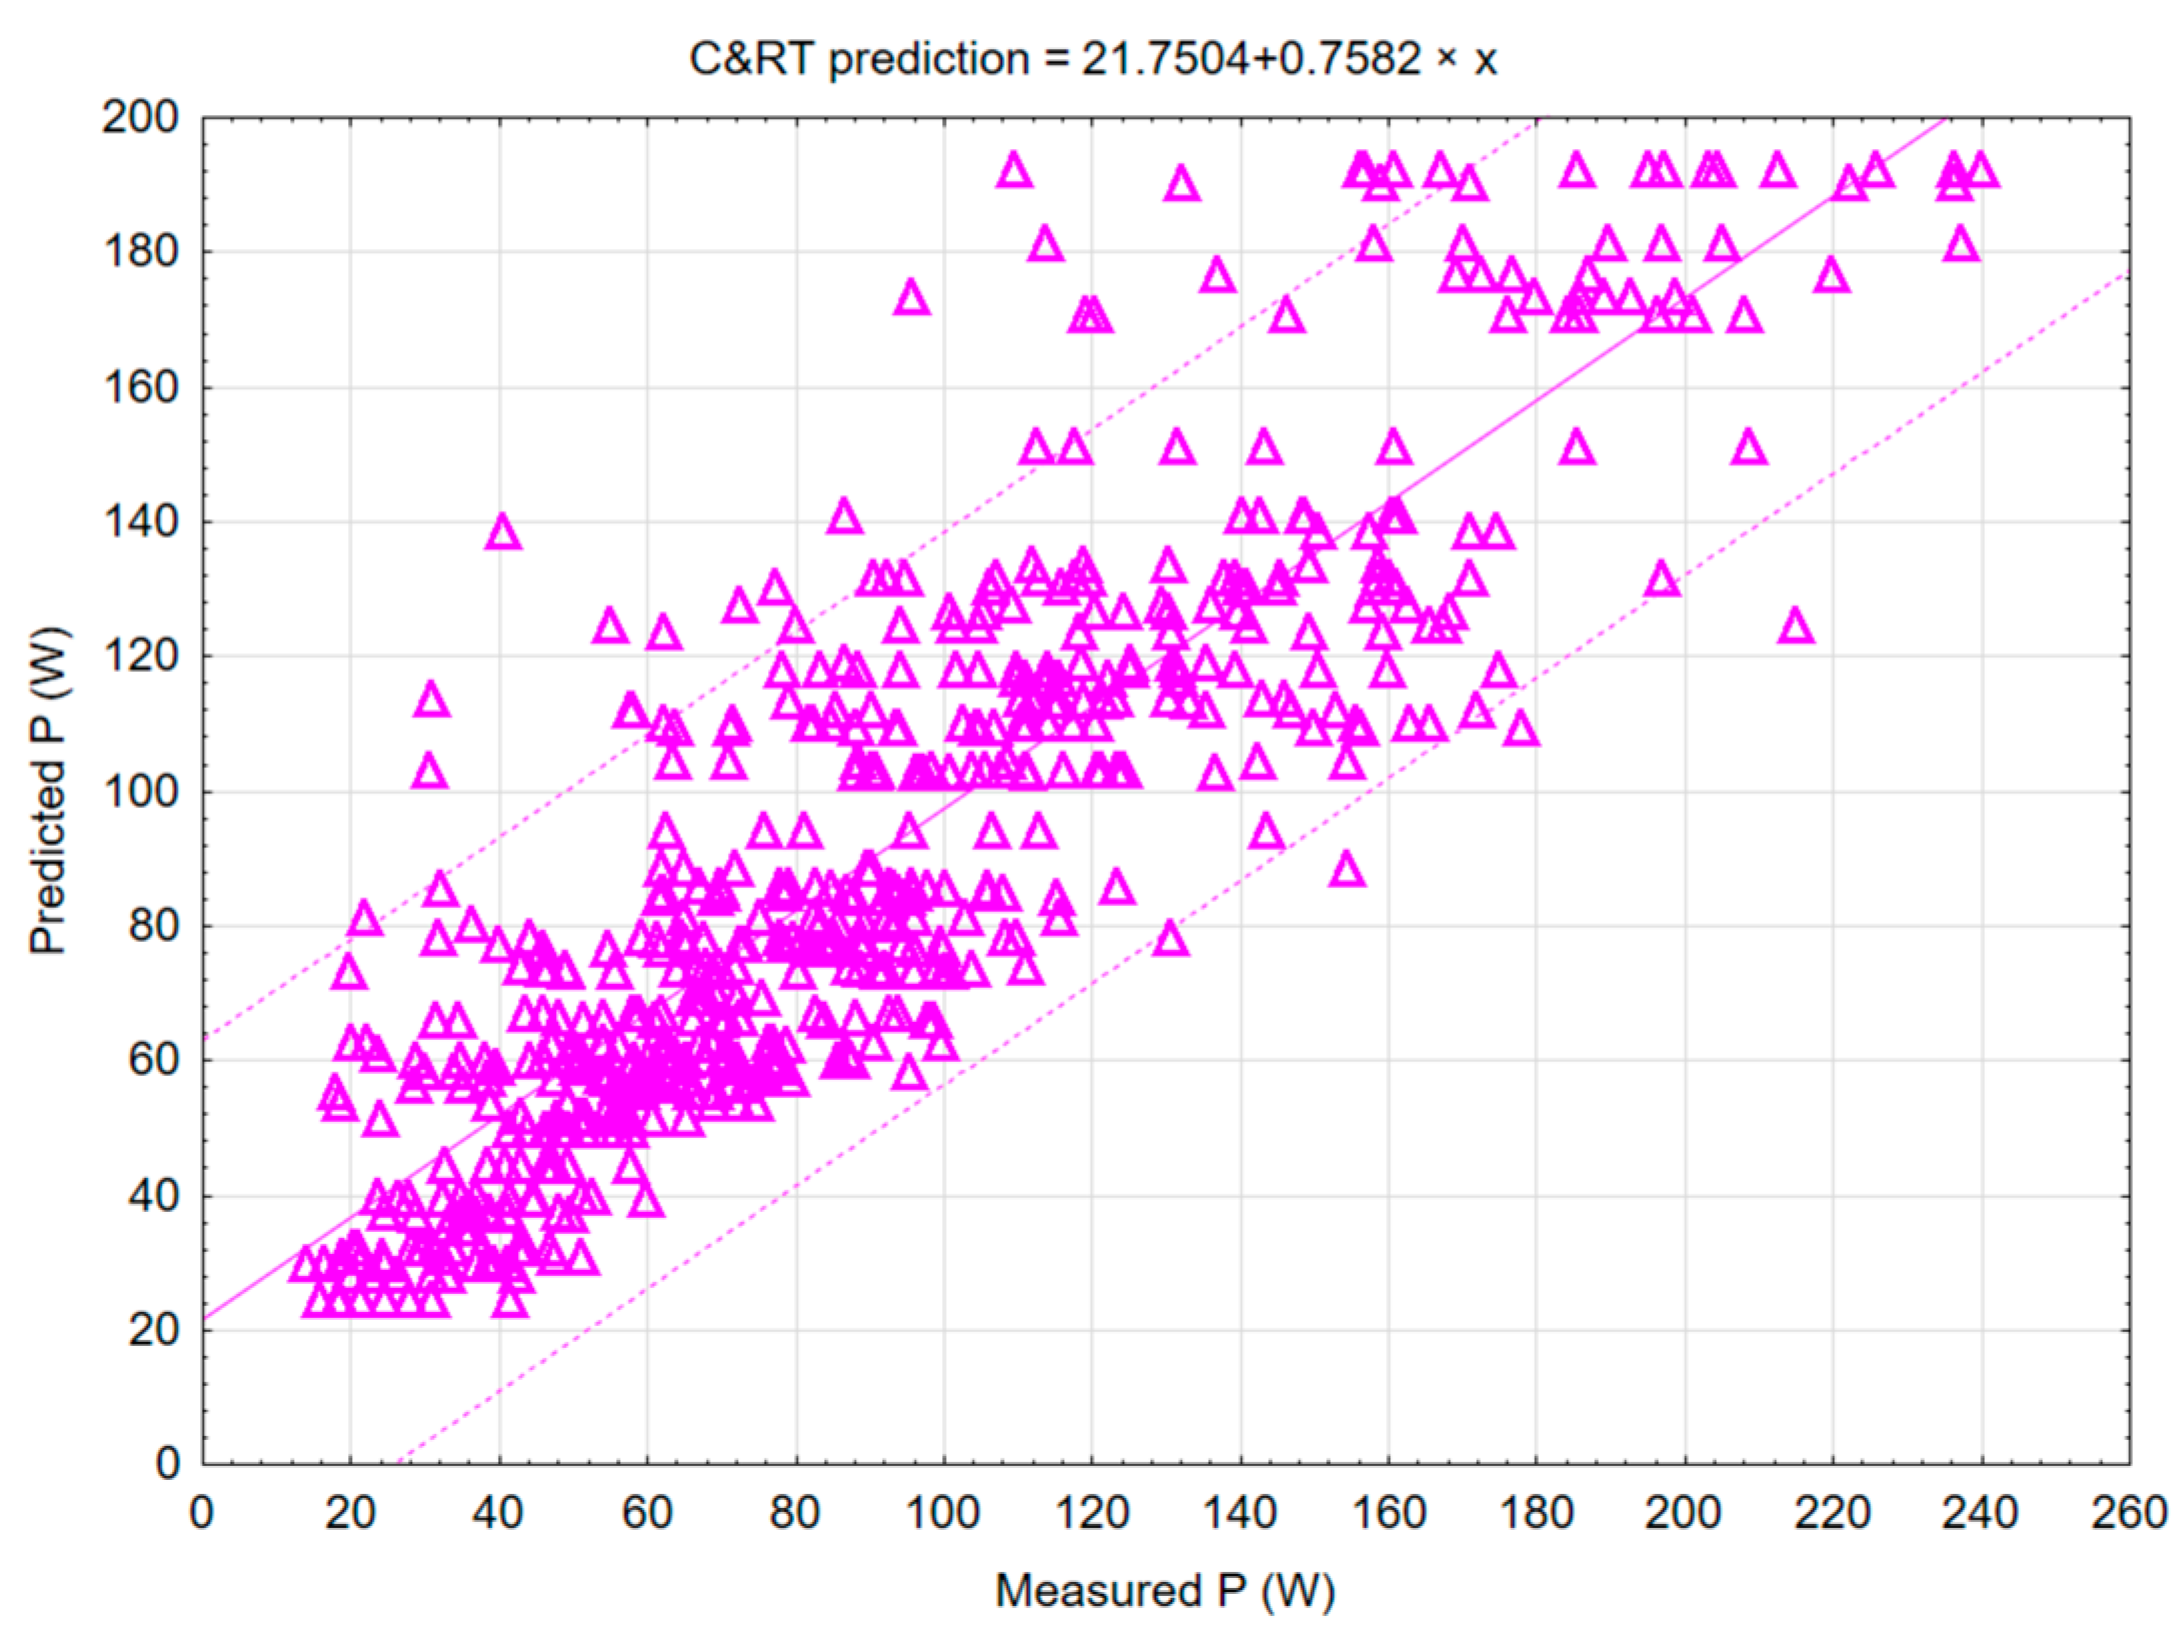
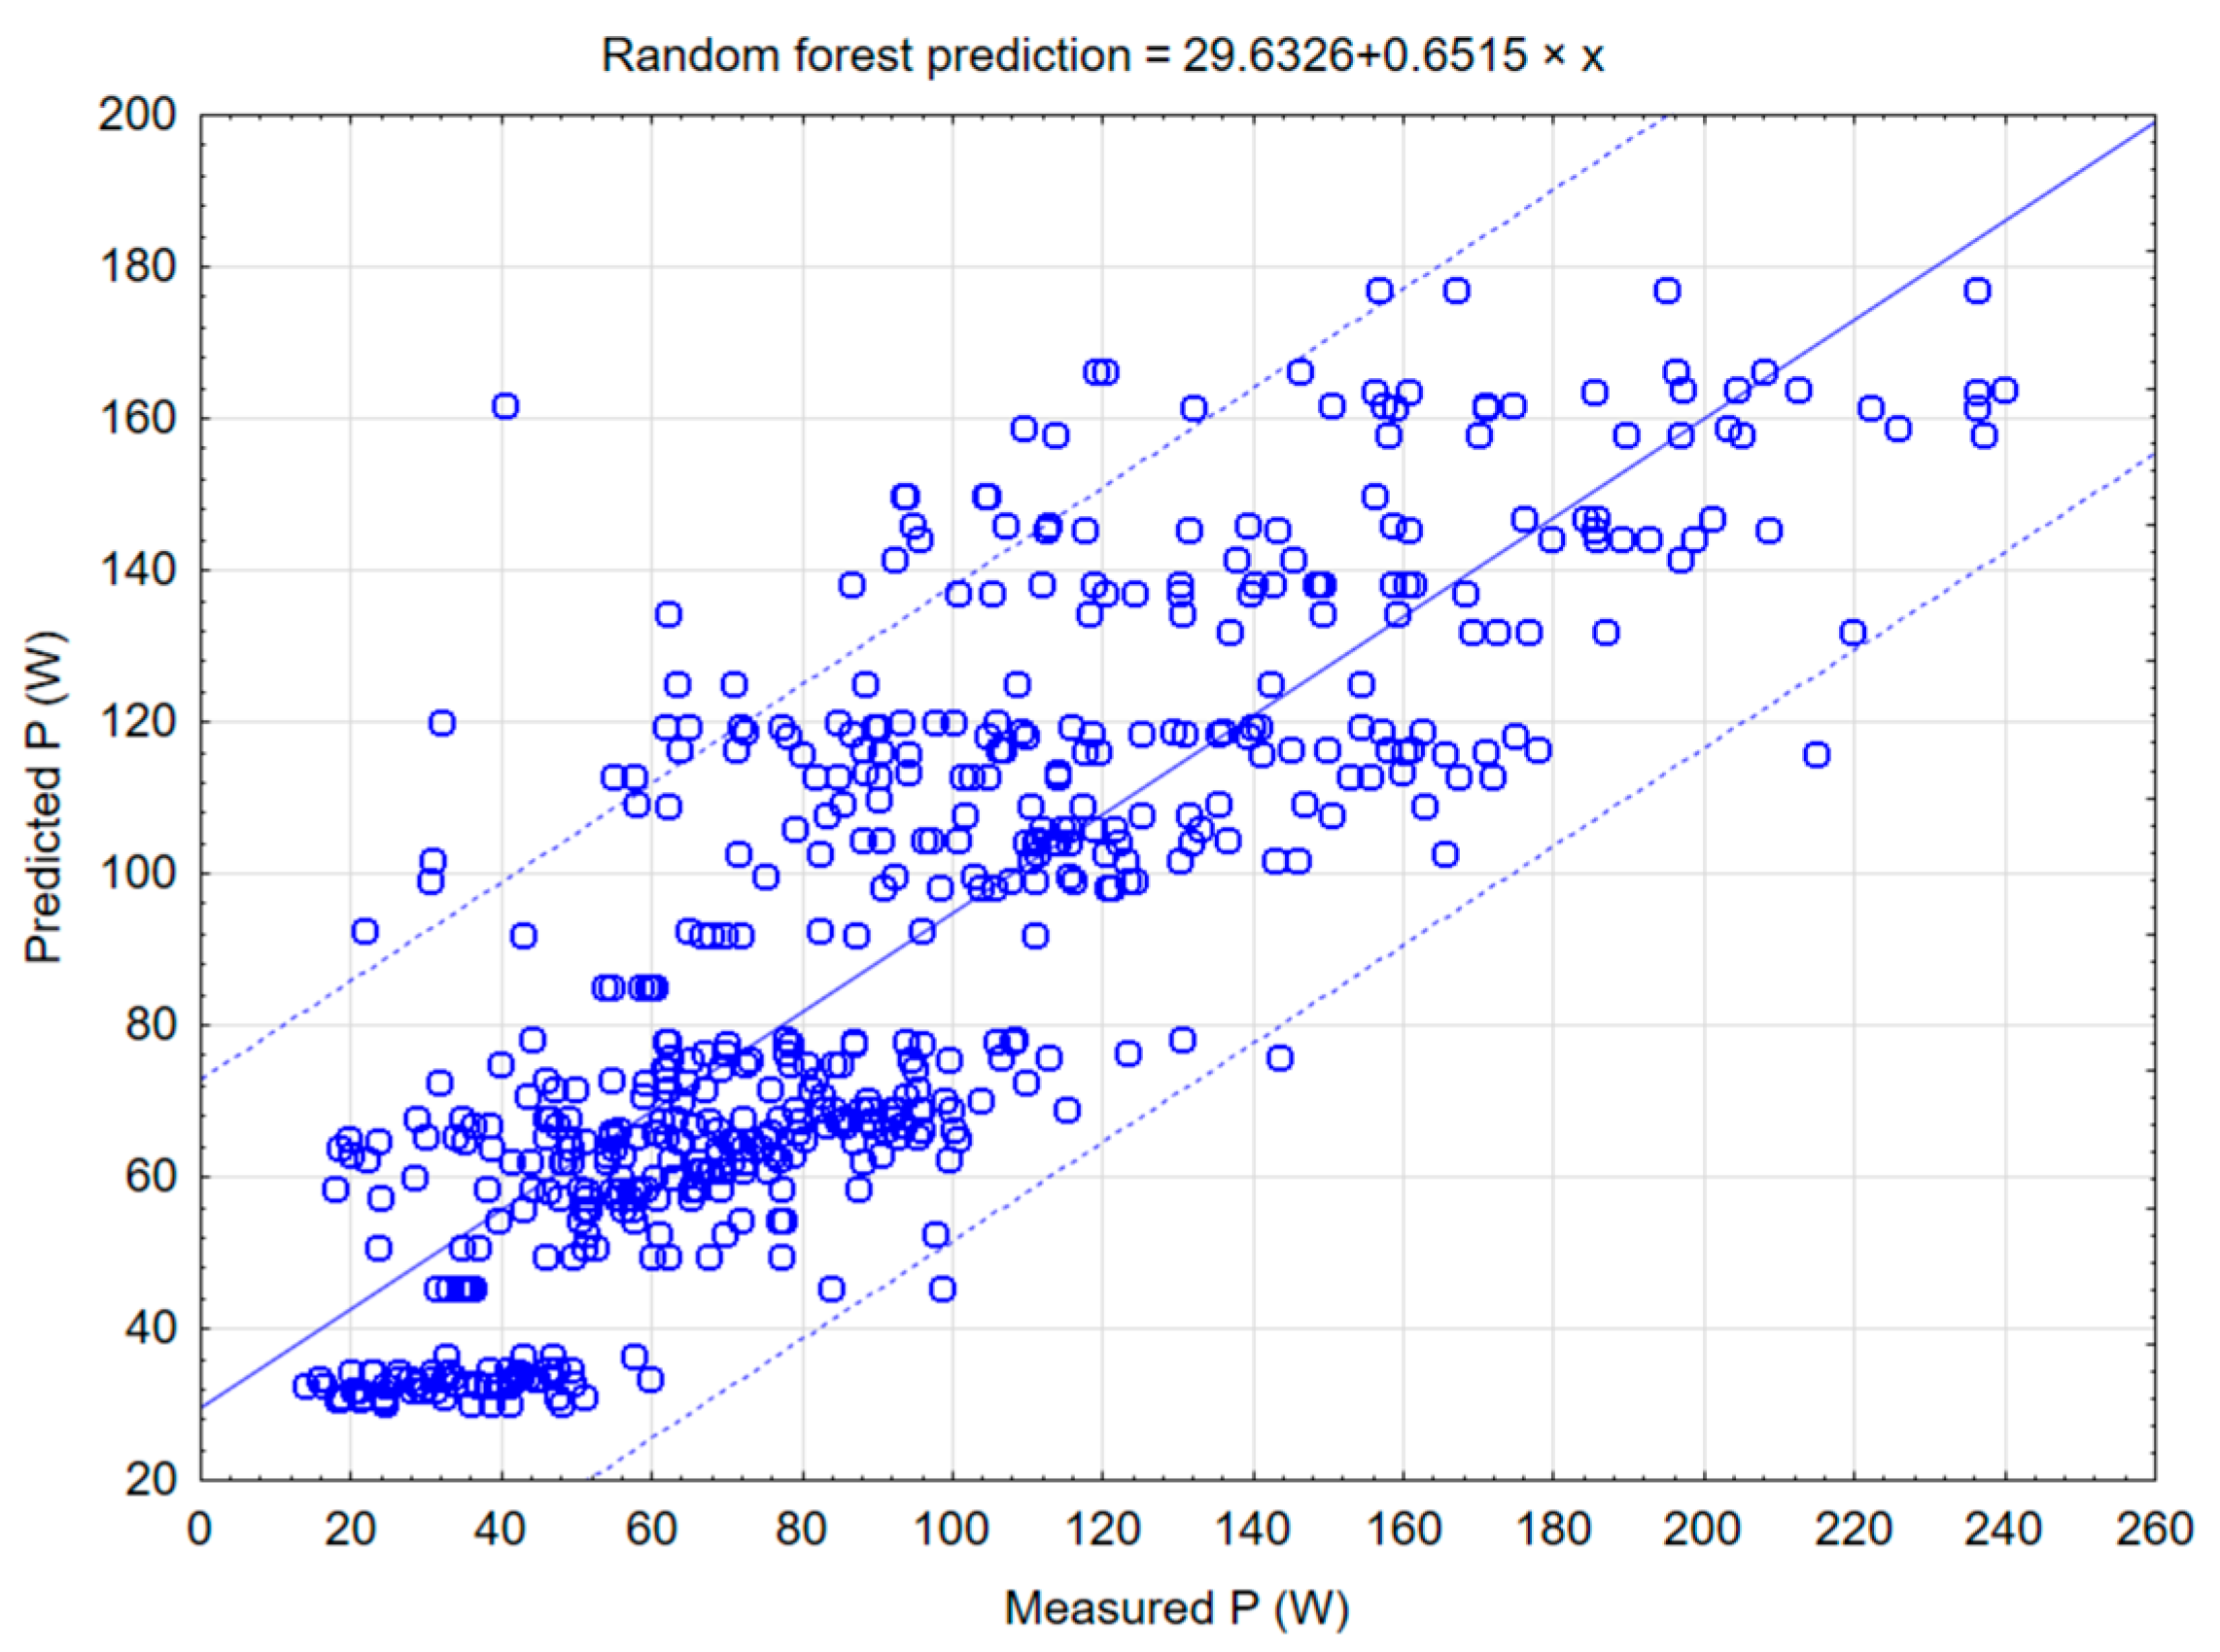
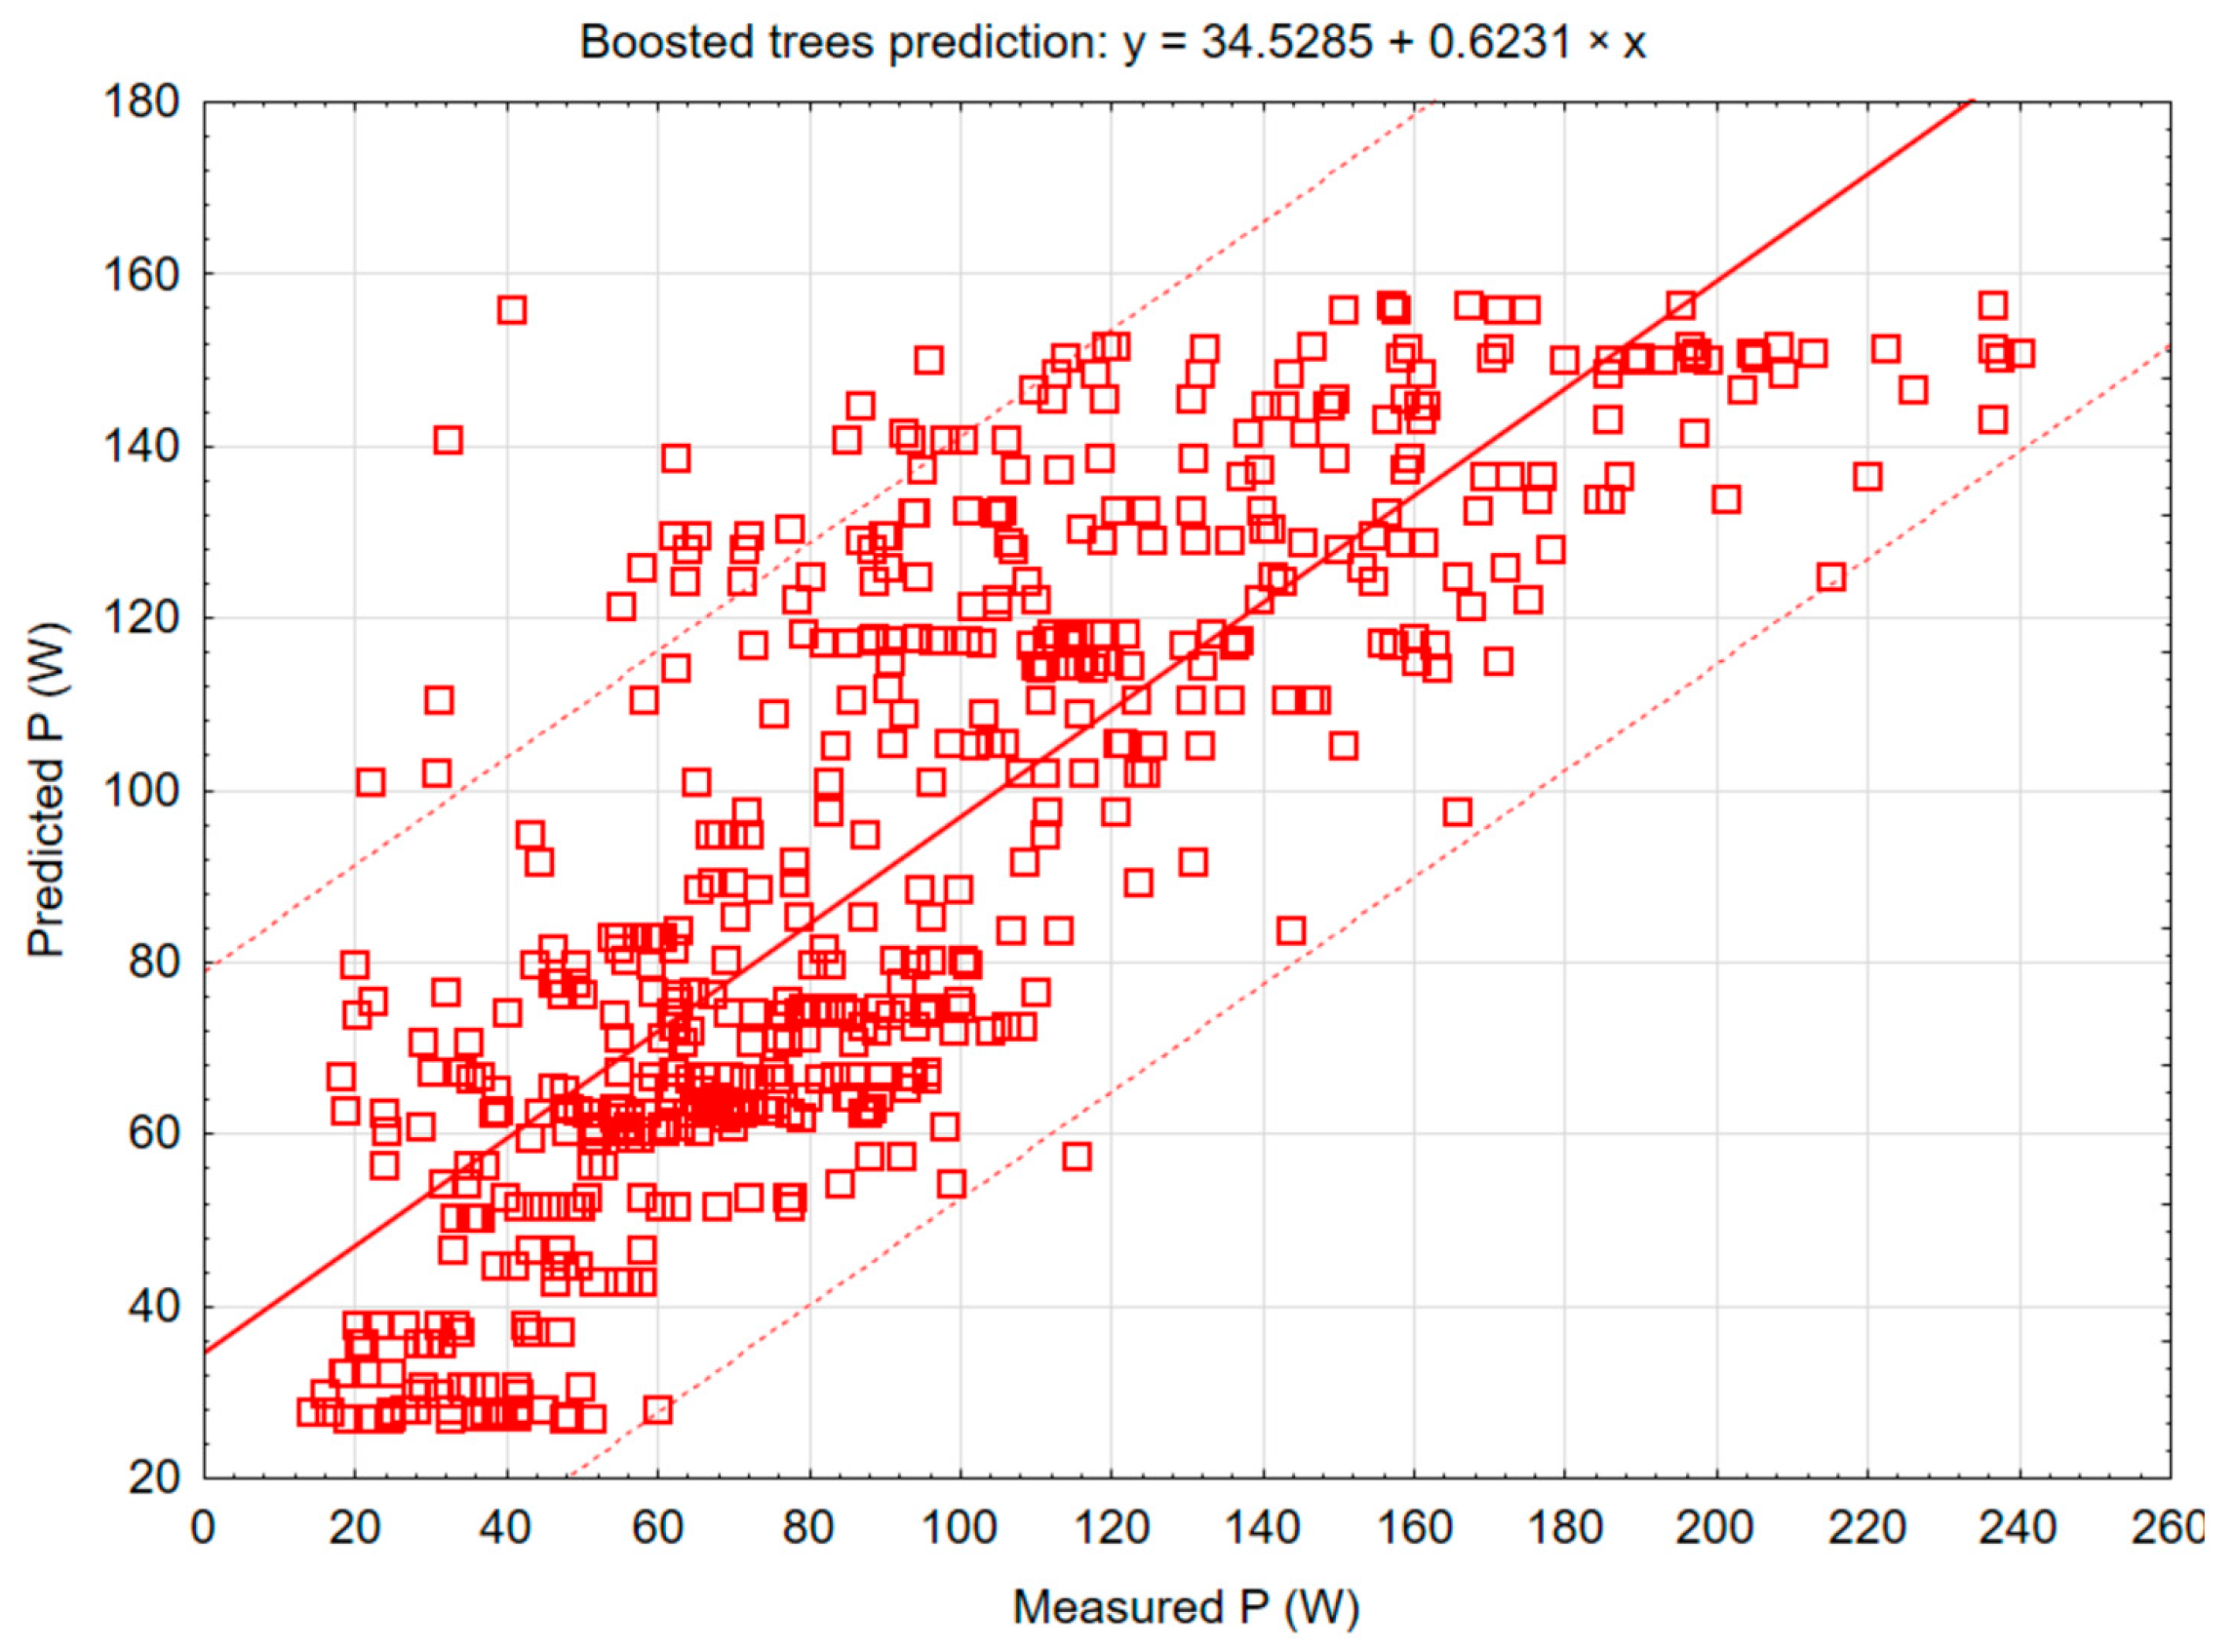
In
Figure 7,
Figure 8,
Figure 9,
Figure 10 and
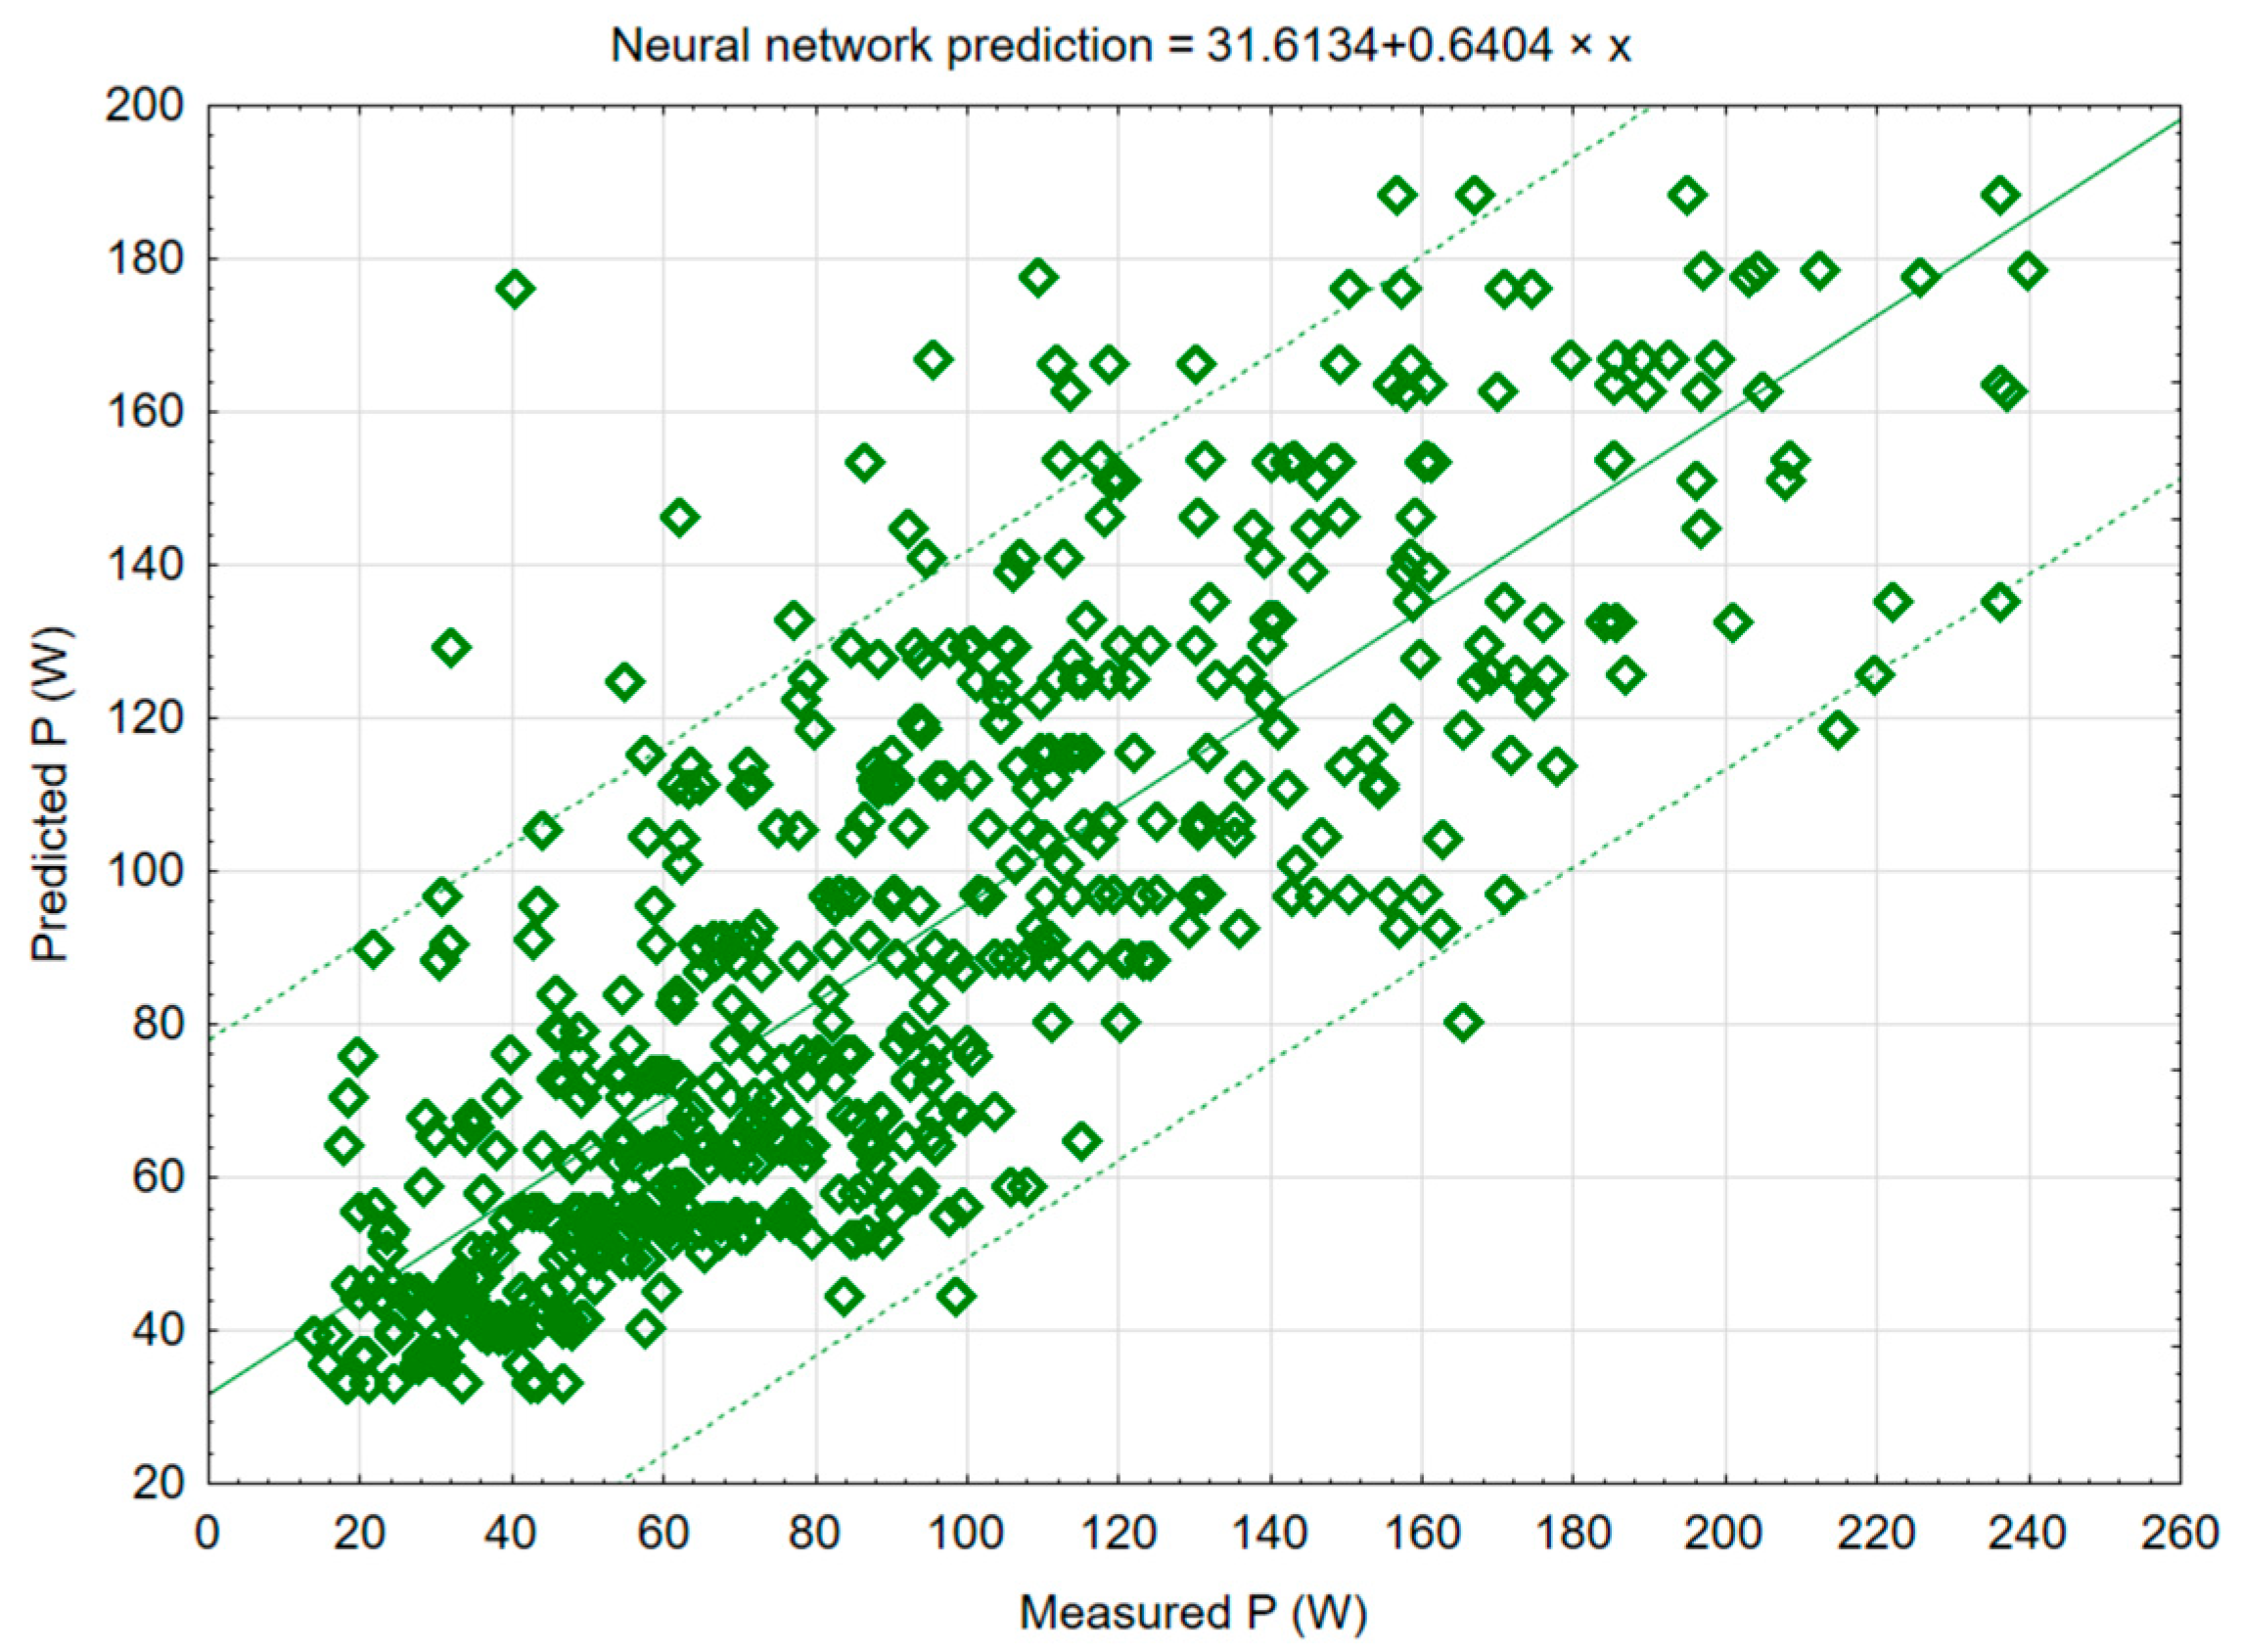
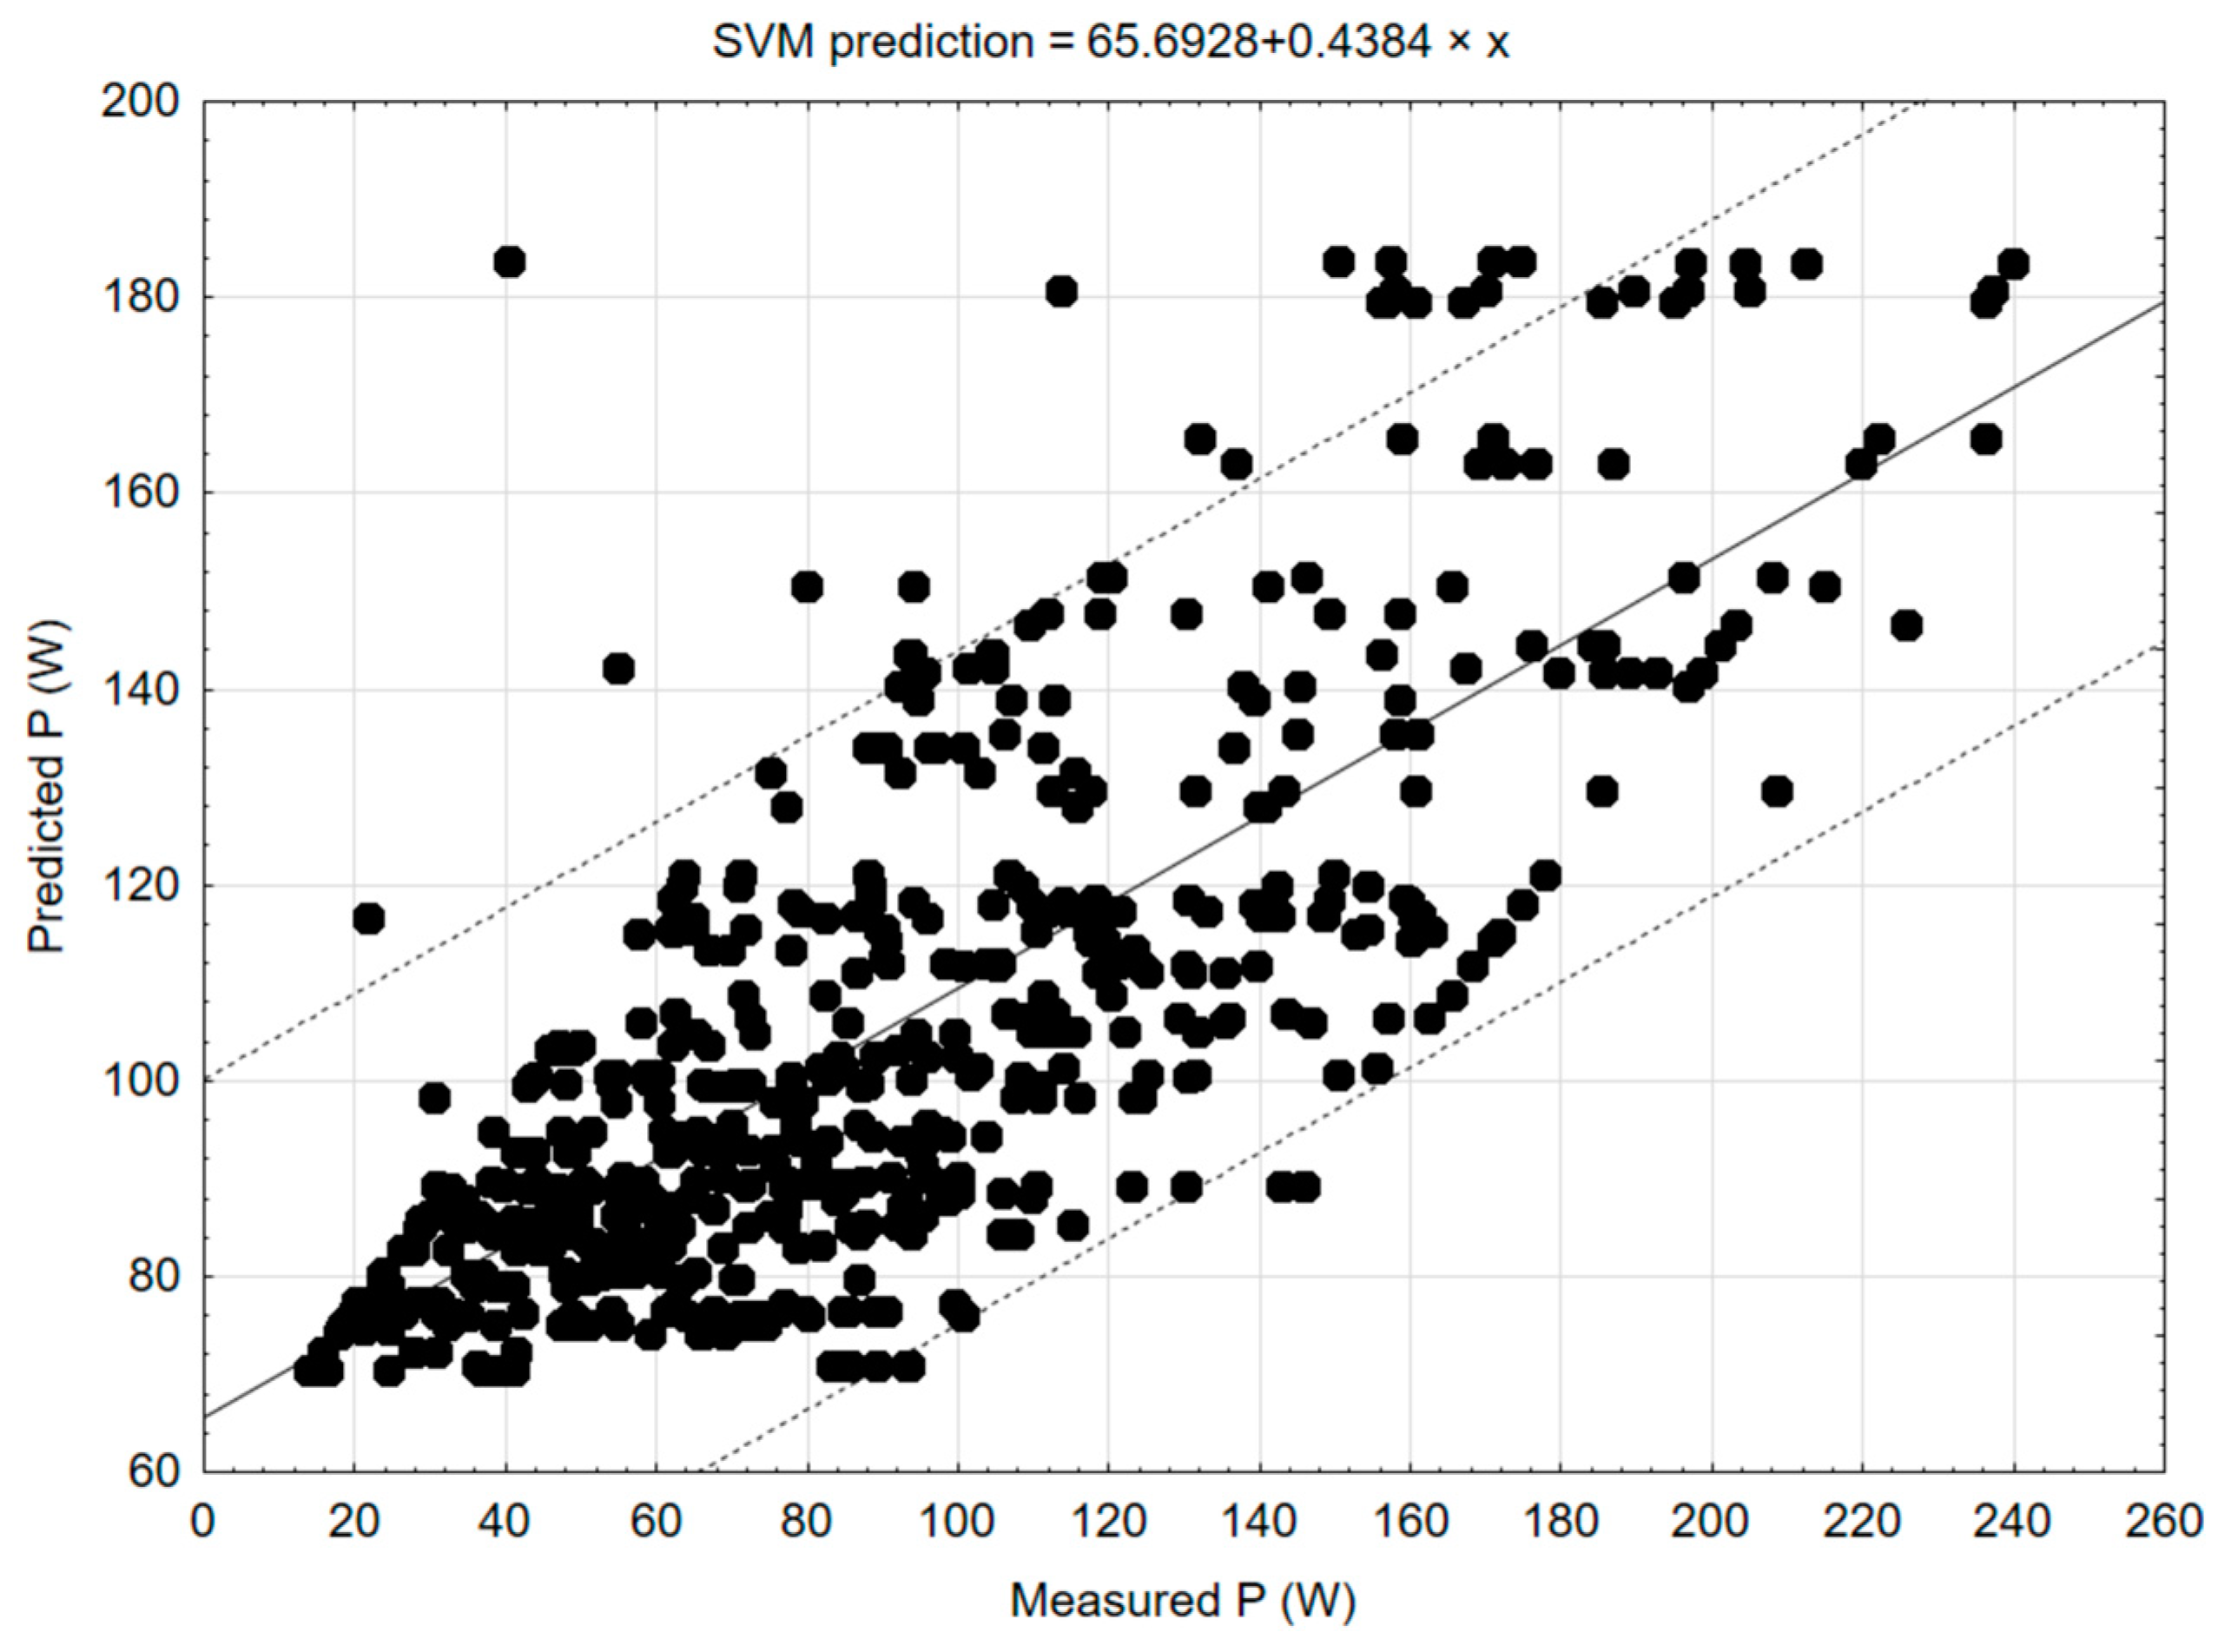
Figure 11, linear regression plots resulting from individual methods of modelling are shown with regression lines (solid lines) and 95% confidence intervals (dotted lines). On the x-axis are the cutting power values calculated according to Equation (1), which entered the model as output values; on the y-axis are the values predicted by the model. The regression equation is displayed above each graph.
Figure 7 shows the C&RT (classification and regression tree), which determines how the target values of variables can be predicted according to the predictor variable.
Figure 8 shows a random forest model that constructs many decision trees during the training period.
Figure 9 shows a boosted tree model that creates new trees according to the errors of trees in previous training rounds.
Figure 10 shows a neural network model based on artificial neural network algorithms.
Figure 11 shows a support vector machine model for classification and regression that tries to find the optimal hyperplane in an N-dimensional space, separating the data points into different classes.
Based on the linear regression results of the correlation matrix and training residuals (
Table 8), it was possible to determine the most appropriate mathematical method for modelling a woodworking process for this type of data.
As shown in
Table 8, the highest correlation coefficient r
2 was achieved with the C&RT decision tree method, where the value was 0.87. The correlation coefficient of the worst model changed by 12% compared to the best. However, it is still possible to claim that all models can be characterised as models with high explanatory power (correlations from 0.7 to 0.9). Therefore, based on the value of the correlation coefficient, the most appropriate method for creating the mathematical model is the C&RT method. The authors of [
34] used a quadratic model to model a medium-density fibreboard helical up-milling process. The authors of [
35] used response surface methodology to predict force during gypsum fibre composite milling. They achieved minimal relative errors between predicted and confirmatory test results, meaning that their models also had high prediction accuracy. The authors of [
36] stated that power consumption could be used for the predictive modelling of wood milling with correlations from 0.92 to 0.99.
The results of the correlation matrix can also be derived from the results of the linear regression graph based on the C&RT decision tree method, which is shown in
Figure 7. The values of cutting power
P obtained in the experiments are placed on the graph’s horizontal axis, and the model’s predicted values are placed on the vertical axis. It can be seen in the figure that the lowest deviation in the error rate was at lower values of cutting power, that is, at lower values of cutting speed, where the values were closest to the regression line, which represents the values predicted by the model. It is also evident from the graph that increasing the cutting power directly increases the error rate, i.e., the deviation from the values generated by the mathematical model.
The last step in creating a mathematical model was generating the decision tree of material processing based on the consumption of electricity, which is the cutting power
P, with the appropriate tree structure table. A part of the tree structure table is shown to explain individual abbreviations in the table (
Table 9).
In the decision tree table, it is possible to see the ID, which is the designation of the node in the tree structure and, at the same time, the position of the node in the table. The number of nodes in the given subgroup is displayed for the identifiers of individual nodes. For example, the first level of the decision tree has two nodes. The size of the node N defines the number of records, so in this case, for the first level, it is equal to 556 measurements, which remain for all subgroups of nodes of the decision tree. The value of the size of the node decreases with individual branches and with the nodes in the lowest subgroups. The average of a node is the average value of predicted cutting power at the given level of the decision tree. The variables defined in the next column are the cutting speed vc, the face angle γ, the hydrothermal modification of the material T, and the feed speed vf. The criteria of subgroups 1 and 2 are the values calculated and generated by the program while creating a mathematical model for achieving optimal cutting power values in the context of machining parameters. The number in parentheses is the number of the next node when a particular criterion is valid. The structure of the model assembled in this way calculates the predicted value of cutting power according to the input parameters of milling.
4. Conclusions
The first goal of this article was to determine the influence of technical and technological parameters on the cutting power when milling heat-treated beech wood. Evaluation via analysis of variance showed that cutting speed had the highest impact on cutting power, as determined by the F-test (F-test: 127.04), followed by the rake angle (F-test: 69.59) and material (F-test: 6.97). The feed speed had the smallest impact on cutting input (F-test: 2.32).
The second goal was to determine whether creating a regression model of the dependence of cutting power on independent technical and technological parameters during the milling of heat-treated beech wood was appropriate.
During the creation of the mathematical model in the STATISTICA 12 software, graphs for the primary methods of mathematical modelling were created, and the most suitable method was determined, which was the C&RT decision tree method, where the value of the correlation coefficient r2 was 0.87. However, the correlation coefficients of other models were also high: random forests (0.82), boosted trees (0.80), neural network (0.8), and SVM (0.77).
For a better understanding of the creation of the mathematical model, the overall table of the tree structure was explained to define the meaning of individual nodes. The creation of a mathematical model in the STATISTICA 12 program demonstrated the appropriateness of using the obtained research data for mathematical modelling at a level of 87%, which represents a 13% difference between the values obtained from the research and the values predicted by the mathematical model. The high explanatory power of the model’s prediction, with the suitability of all models ranging from 0.70 to 0.90, should provide confidence in the robustness of the results.
The comprehensive conclusion of this research is that energy consumption measurement is suitable for creating prediction models for machining not only homogeneous but also non-homogeneous materials such as wood. However, these require a larger amount of experimentally obtained data for the adequate training of prediction models. The research results, with their potential for the creation of dynamic models suitable for the adaptive control of the wood machining process, can serve as a source of inspiration for future studies. It is also assumed that the results will be used for the design and implementation of indirect measurements of machining parameters by also measuring vibrations, produced dust [
37], noise [
38], cutting forces, created surface quality, and subsequent regression modelling.

