Abstract
The objective of this study was to develop an artificial neural network (ANN) model for predicting the tensile strength of friction stir welding (FSW) joints between dissimilar materials, with a particular focus on aluminum and copper, using cryogenic processes. The research addresses the challenges posed by differences in material properties and the complex nature of FSW, where traditional experimental methods are time-consuming and costly. FSW experiments were conducted under a variety of conditions, and the resulting temperature data were utilized as input for a heat transfer analysis. The maximum temperature and temperature gradient obtained from the analysis were employed as input variables for training the ANN. The ANN was optimized using the Hyperband tuner and validated against experimental results. The model successfully predicted tensile strength with an average error of 5.4%, demonstrating its potential for predicting mechanical properties under different welding conditions. This approach offers a more efficient and accurate method for optimizing FSW processes.
1. Introduction
Friction stir welding (FSW) is a welding method developed by TWI (The Welding Institute) in the UK in 1991, in which a high-speed rotating non-consumable tool is inserted into the base material to be joined, and the softened base material is subjected to a forcible stirring action by the rotating tool, which is caused by the generation of frictional heat between the tool and the base material [1,2,3,4]. It is a solid-phase welding rather than fusion welding such as arc welding, gas welding, electron beam welding, etc., and has the advantages of small deformation, excellent mechanical strength of the welded part, and almost no defects such as pores and cracks [5,6,7]. FSW is suitable for joining lightweight alloys and casting parts, such as aluminum, copper, magnesium, and titanium, which is difficult to achieve with conventional welding technologies, so its application fields are expanding in the automotive, aviation, aerospace, shipbuilding, and electronics industries [8,9]. In recent years, there has been a growing need to manufacture parts by joining different materials in order to improve their strength, lightness, electrical properties, and other characteristics. This has led to a significant amount of research and development activity, driven by the economic and technological advantages associated with this approach [10,11,12]. In particular, the joining of copper and aluminum alloys is employed in a variety of applications due to their excellent thermal and electrical conductivity. In the automotive industry, copper and aluminum are utilized in automotive batteries due to the implementation of electric drive systems [13,14,15]. The inverter of an electric vehicle is a device that converts DC power from the battery into AC power to control the speed of the motor, and coolant circulates through the inverter housing to perform thermal management. Conventional inverter housing covers are made of aluminum, but they are being replaced with copper materials to increase efficiency. The joining of copper and aluminum is prone to defects due to differences in melting temperature, fluidity, and material properties, as well as the chemical composition of the materials [16,17,18]. In friction stir welding, the maximum temperature reached and the temperature gradient encountered during welding depend on the welding process conditions such as tool rotation speed, feed rate, tool geometry (shoulder diameter, pin pattern, pin length, pin diameter), and other factors. Consequently, the mechanical properties of the weld are also affected, including tensile strength and elongation [19,20,21,22]. Experimental methods to determine the mechanical properties of welds by parameters are time-consuming and expensive. To solve this problem, many studies have been conducted to predict mechanical properties using machine learning, a type of artificial intelligence [23,24]. Artificial neural network (ANN), a type of machine learning, is an algorithm that mimics the function of the human brain. Researchers who applied ANN to predict the mechanical properties of FSW built a neural network by setting various parameters as input variables and material properties such as elongation, tensile strength, and hardness as output variables. Jayaraman et al. [25] used tool rotation speed, welding speed, and axial force as input variables, and used RSM (Response Surface Model) and ANN to predict and compare the tensile strength of A356 Alloy. Vignesh et al. [26] used tool rotation speed, welding speed, pin diameter, and shoulder diameter as input variables and applied the LM (Language Model) algorithm and ANN trained with the BFGS (Broyden–Fletcher–Goldfarb–Shanno) quasi-Newton algorithm to predict the tensile strength of AA1100 aluminum alloy. Okuyucu et al. [27] used rotation speed and welding speed as input variables, and built a feed forward ANN to predict tensile strength, yield strength, elongation, and hardness, and compared the actual experimental data and simulation results with the predicted results. Maleki [28] used rotation speed, welding speed, downward force, tool hardness, shoulder diameter, and pin diameter as input variables, and tensile strength, yield strength, hardness, and tensile strength of notch as output variables to estimate FSW parameters for Al7075-T6 aluminum alloy using a neural network model with the back propagation algorithm. Previous studies using machine learning to predict the mechanical properties of FSW mainly used rotation speed, welding speed, shoulder diameter, etc., as input data. In this case, there was a limitation that various parameters such as pin diameter, pin height, plunge depth, pin thread, shoulder pattern, tilting angle, etc., were not considered. Accordingly, the temperature gradient and maximum temperature during the FSW process, which are representative of the FSW process parameters, were selected as new input data for the present study. First, in order to obtain the input variables required for ANN training, specimens were fabricated using copper and aluminum to perform FSW experiments under various process conditions. The temperature data for each process condition were then collected using thermocouples. The maximum temperature and temperature gradient were determined by correlating the collected temperature data with the results of the heat transfer analysis of the finite element analysis. The data were subsequently quantified and employed as input variables for the ANN. In order to train the ANN, the tensile strength obtained from the tensile test subsequent to FSW was employed as the output variable. The artificial neural network (ANN) model was constructed using the Python programming language, and the Hyperband tuner was employed to optimize the ANN’s hyperparameters. The overall process flow of this study is shown in Figure 1. Finally, to assess the efficacy of the constructed ANN model, the validation data were applied to the trained ANN model and the predicted tensile strength was compared with the actual tensile strength of the validation data.
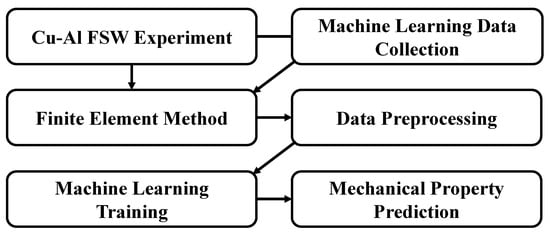
Figure 1.
Flow diagram of the process.
2. Dissimilar FSW Experiments
Copper and aluminum specimens were used for the FSW experiments. To simulate the FSW applied to the inverter housing of a real electric vehicle, a specimen with a mixture of butt and lap joints was used. A copper plate was FSWed to an aluminum casting, and 10 holes with a diameter of 1 mm were created to insert thermocouples at intervals of 5 to 10 mm from the weld centerline for temperature data measurement during FSW.
To collect temperature data, K-type thermocouples were inserted into the hole and heat-resistant tape was used to securely fix the thermocouple. The welding tool is made of tungsten carbide material. When welding hard and soft materials in FSW, the position in which the materials are clamped affects the quality of the weld [5,29,30,31]. In general, good weld quality is obtained when the hard material is clamped on the advancing side and the soft material is clamped on the retreating side [5,29]. In addition, in the Al/Cu joint, the weld quality depends on the offset of the tool pin, and a high-quality weld face is obtained when it is offset to the Al side [32,33]. Al-Roubaiyet et al. conducted a FSW study by fixing pure copper on the advancing side and Al 5086-H116 on the retracting side, and offsetting the tool pin to the Al side. The offset to the Al side was 0 to 0.4 mm, and the maximum weld strength was obtained at 0.2 mm offset [17]. Xue et al. reported that in the FSW of pure copper and Al 1060, a good weld surface without defects could be obtained when the copper plate was fixed on the advancing side and the tool pin was offset by more than 2 mm towards the aluminum side [32]. Bakkiyaraj et al. conducted FSW experiments on the joining of pure aluminum and copper by fixing the copper plate on the advancing side and the aluminum plate on the retracting side [33]. They reported that a sound weld surface was obtained when the tool pin was offset by 2 mm in the direction of the aluminum, and tunnel defects occurred when the tool pin was fixed in the center. Therefore, in this study, the copper plate was fixed on the advancing side and the aluminum plate was fixed on the retracting side. The welding tool was rotated clockwise and offset by 1.1 mm toward the aluminum plate so that the tip edge of the probe was located on the line where the dissimilar materials meet. Figure 2 shows a schematic and real of the overall FSW experiment.
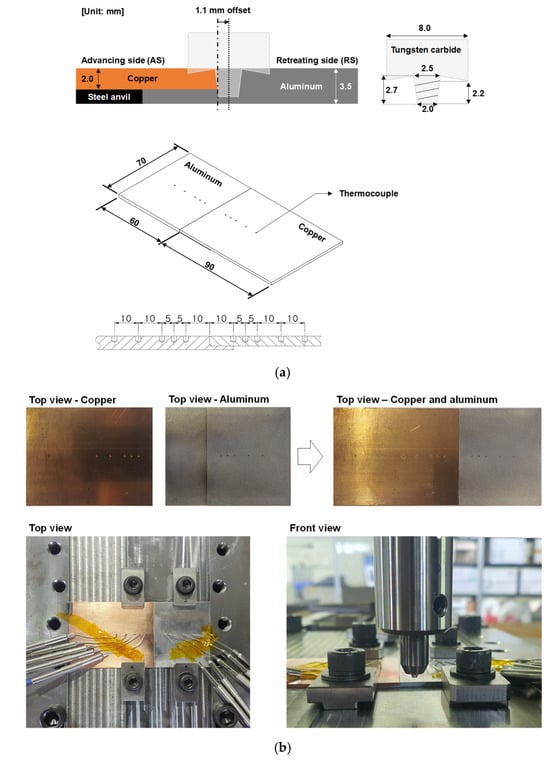
Figure 2.
Schematic (a) and real (b) of the overall FSW experiment.
After performing the dissimilar material FSW, the cross-section was observed as shown in Figure 3. The cross-section after FSW shows a good joint at line ① section, which is closest to the beginning of the weld. However, as the FSW progressed, internal tunneling defects were observed at ② section, and unfilled areas on the weld surface appeared at lines ③ and ④ section.
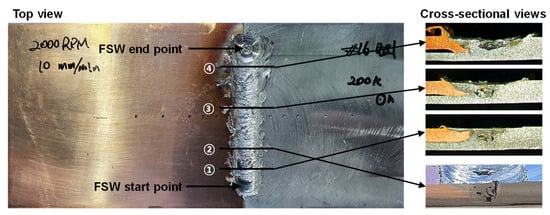
Figure 3.
Specimen and cross-section results after FSW.
This was due to the different melting points and fluidity of the two materials, as well as the high temperature of the FSW tool, which caused the base material to stick to the tool as shown in Figure 4. The defects observed in Figure 3 are a result of the FSW tool probe no longer fulfilling its function as a stirrer and passing over the weld line.
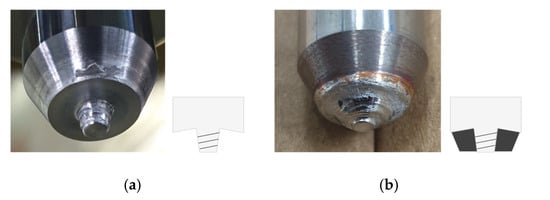
Figure 4.
Base material sticks to the tool probe: (a) before FSW; (b) after FSW.
To overcome the issue of the workpiece adhering to the FSW tool probe, a solution was devised whereby liquid nitrogen (LN2) at a temperature of −196 °C was sprayed onto the side of the FSW tool. This was an effective method of reducing the temperature of the tool. As a result, the quality of the weld joint was visibly improved, as shown in Figure 5. Experiments were conducted under different rotational speeds and feed rates to obtain data for the construction and training of the ANN. The experimental conditions are shown in Table 1 and were performed in the order shown.
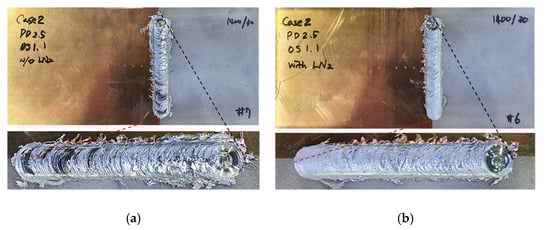
Figure 5.
Dissimilar FSWed joint results: (a) FSW process without LN2; (b) FSW process with LN2.

Table 1.
FSW experiment condition for training set.
The experimental conditions to obtain data for training the ANN were set with rotational speeds ranging from 1000 to 1600 rpm and feed rates from 25 to 1000 mm/min, and the experiments were conducted under a total of 24 cases. As mentioned before, the temperature was measured in 10 channels during the FSW process. Since the FSW tool was offset by 1.1 mm from the aluminum specimen during welding, the highest temperature values were measured in the channel closest to the weld line of the aluminum specimen. Table 2 shows the maximum temperature values measured using thermocouples for each process condition. The results for the 1200 RPM-25 mm/min and 1600 RPM-300 mm/min conditions were excluded because the temperature values were not measured properly during the experiment.
Table 2.
Maximum temperature data of FSW experiment condition.
In previous studies, the temperature trend according to rotation speed and feed rate showed that when the rotation speed is constant, the temperature tends to increase as the speed of the feed rate decreases [34,35,36]. However, in this study, the temperature measured here shows that the lower the feed rate of the tool, the lower the temperature. Based on this result, it is believed that the lower temperature gradient as the tool feed rate decreased was caused by the increased time the FSW tool was exposed to LN2 as the feed rate decreased. In addition, as shown in Figure 6, the actual FSW experiment showed that the weld surface cracked as the feed rate decreased, which is believed to be caused by heat loss due to cracking of the weld during FSW. The experimentally measured temperature data were used as heat source values in the heat transfer analysis of the finite element analysis.
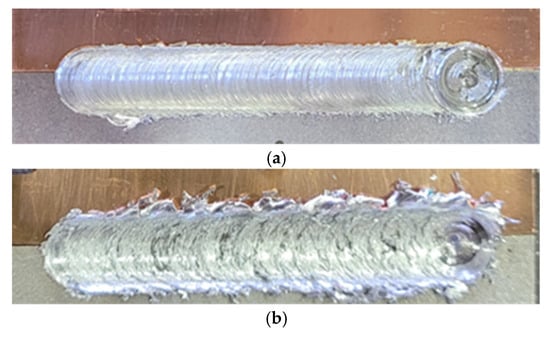
Figure 6.
Surface results after FSW experiment with LN2: (a) 1000 RPM-1000 mm/min; (b) 1000 RPM-25 mm/min.
The tensile test was conducted using an Instron-type tensile tester (SHIMADZU, AG-IS, 5 Ton, Kyoto, Japan) at a crosshead speed of 1 mm/min at room temperature. The test specimens, which adhered to ASTM-E8 specifications, were machined using electric discharge perpendicular to the welding line, as illustrated in Figure 7. For each FSW condition, three tensile specimens were made and the tensile strength was measured as shown in Figure 7. The average value of the three tensile strengths was used as output data for machine learning in Section 4.
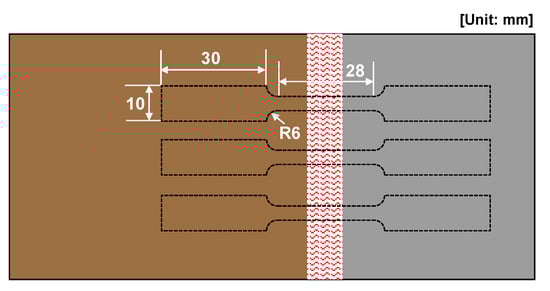
Figure 7.
Uniaxial tensile test specimens.
3. Heat Transfer Analysis Using Finite Element Method
As previously stated, the input data for the machine learning model are the temperature gradient and the maximum temperature value, which depend on the specific welding process conditions. To obtain these data, the temperature data measured in the experiment was correlated with the heat transfer analysis results. Then, the temperature gradient perpendicular to the weld line and the maximum temperature during the process were calculated. For this purpose, a heat transfer analysis using the finite element method was performed.
3.1. Finite Element Model and Mesh
To calculate the temperature gradient and maximum temperature of the FSW process, heat transfer analysis was performed using the commercial software ANSYS Workbench 2022 R2. The finite element model used in the heat transfer analysis was the same size as the specimens used in the FSW experiment, as shown in Figure 8. To create an environment similar to the actual experiment, a backing plate was created under the specimen model. In addition, the area of the specimen was divided to reflect the location where temperature measurements were taken and the direction and length of tool travel.
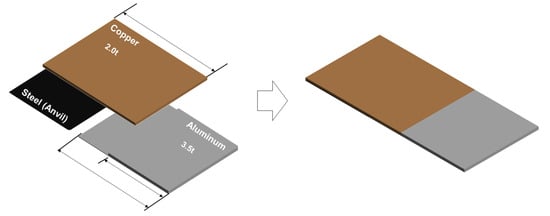
Figure 8.
Three-dimensional finite element model for heat transfer analysis.
The elements in the analysis model were tetrahedral elements with 1.0 mm near the FSW tool path and 2.0 mm elsewhere. The number of nodes was 25,051 and the number of elements was 103,663. Figure 9 shows the mesh for heat transfer analysis.
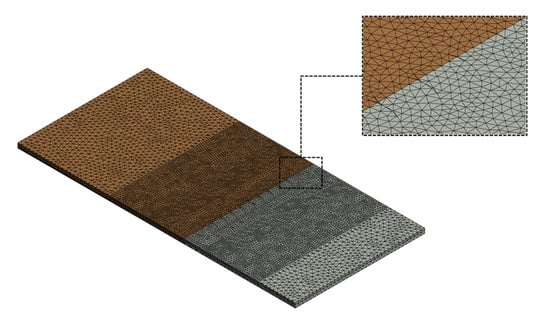
Figure 9.
Finite element mesh model for heat transfer analysis.
3.2. Material Properties and Boundary Conditions
The temperature-dependent material properties such as density, specific heat, and thermal conductivity of aluminum and copper used in the dissimilar FSW transient heat transfer analysis are shown in Table 3 and Table 4 [37,38].
Table 3.
Temperature-dependent material properties of aluminum [37].
Table 4.
Temperature-dependent material properties of copper [38].
The heat source value was calculated by correlation analysis with the temperature results measured in the experiment. The transient heat transfer analysis was used to consider the moving heat source. To consider convective heat transfer, 20 W/m2°C was applied to the surface exposed to the air, and 200 W/m2°C was applied to the bottom surface [39]. By correlating the temperature distribution results measured in Section 2 with the heat transfer analysis results using the finite element method, the temperature distribution along the vertical direction of the weld line during FSW was calculated and is presented in Figure 10.
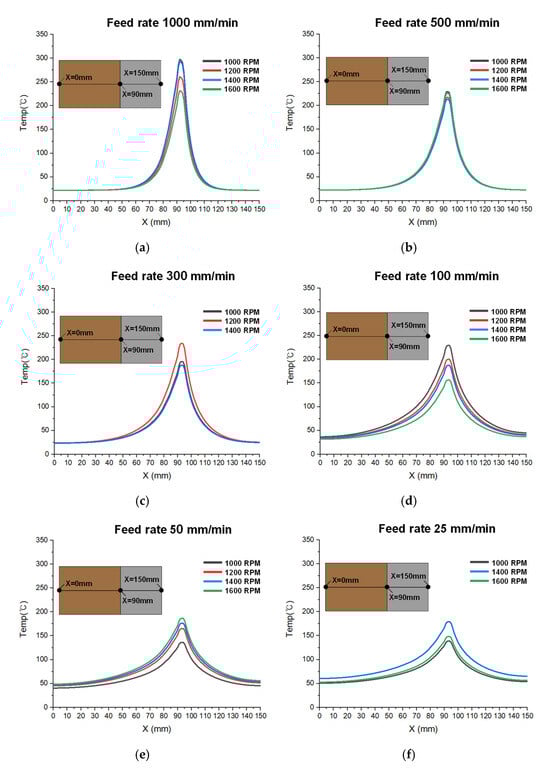
Figure 10.
Temperature distribution results along the perpendicular direction of the weld line using heat transfer analysis: (a) Feed rate 1000 mm/min; (b) Feed rate 500 mm/min; (c) Feed rate 300 mm/min; (d) Feed rate 100 mm/min; (e) Feed rate 50 mm/min; (f) Feed rate 25 mm/min.
4. Artificial Neural Network
An artificial neural network is a machine learning algorithm that mimics the principles and structure of neural networks in the human brain or animal brains and is used to solve a variety of problems in many applications. An artificial neural network is a network structure of interconnected nodes that mimic neurons and consists of nodes, an input layer, a hidden layer, and an output layer, as shown in Figure 11.
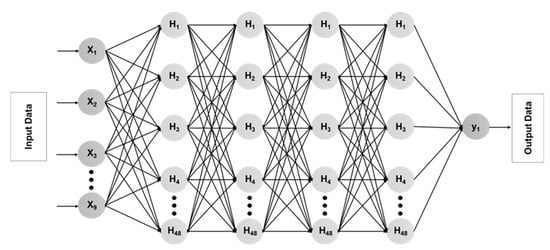
Figure 11.
Artificial neural network structure.
The nodes in an ANN play an important role in processing and transmitting information, connecting the layers. When data enter the input layer, they are propagated to the hidden layer with a given weight and activation function, and the data trained in the hidden layer are propagated to the output layer in the same way to produce the output result. The activation function is a function that converts the sum of the input signals into an output signal and determines whether the input signal is output or not, allowing nonlinearity to be represented. Activation functions include Sigmoid, Tanh, and ReLU. The Sigmoid function outputs values between 0 and 1, but when the input is very large or small, the output becomes nearly zero, leading to the vanishing gradient problem. The Tanh function outputs values between −1 and 1 and is slightly better than Sigmoid, but it can still suffer from the vanishing gradient problem. The vanishing gradient problem refers to a phenomenon where the gradient becomes too small, preventing the weights from being updated. In contrast, the ReLU function is effective in addressing this issue. The ReLU function (Rectified Linear Unit function) is expressed as shown in Equation (1):
x = max (0, x)
If the value of x is negative, it outputs 0, and if it is positive, it outputs x as it is. It is the most popular activation function because it is simple to compute and fast to learn. Weights control the importance of each input signal to the output signal, and biases determine the conditions under which neurons are activated. Weights and biases are the key parameters of an artificial neural network and are adjusted through the learning process. Gradient descent is an optimization algorithm that adjusts the neural network model to minimize the loss function by adjusting the weights and biases. During the initial training stage, the model calculates the loss error between the predicted and actual values and then derives the gradient for each variable through differentiation. This process is repeated until the gradients reach a minimum value. If the temperature gradient has a significant impact on the predictive model, the weight for this variable will be adjusted more substantially to reduce the loss. Conversely, if the maximum temperature has a smaller impact on the loss, the adjustment to this variable’s weight will be smaller.
4.1. Artificial Neural Network for Friction Stir Welding
In this study, the ReLU function was used as the activation function of the neural network model, and the gradient descent method was used to minimize the loss function. TensorFlow (2.7.0) is an open-source software library developed by Google, offering various features that make it easy to use machine learning and deep learning in a Python environment. It is specifically designed to simplify the construction and execution of complex computations, such as neural networks. Therefore, in this study, the neural network was built and trained using TensorFlow in a Python environment. The input variables for training were the temperature gradient and maximum temperature values derived from FSW experiments and heat transfer analysis. The temperature gradient values were separated into copper plate side temperature gradient values and aluminum plate side temperature gradient values to reduce the error, and then the natural logarithm was taken to reduce the slope of the graph as shown in Figure 12. The slope-reduced temperature gradient values were represented by a third-order polynomial using a trend line. The input variables for the ANN were four third-order polynomial coefficients of the temperature gradient on the copper plate side, four third-order polynomial coefficients on the aluminum plate side, and one maximum temperature. The output data were the tensile strength values obtained from the tensile test, and the final data used in the ANN are shown in Table 5.
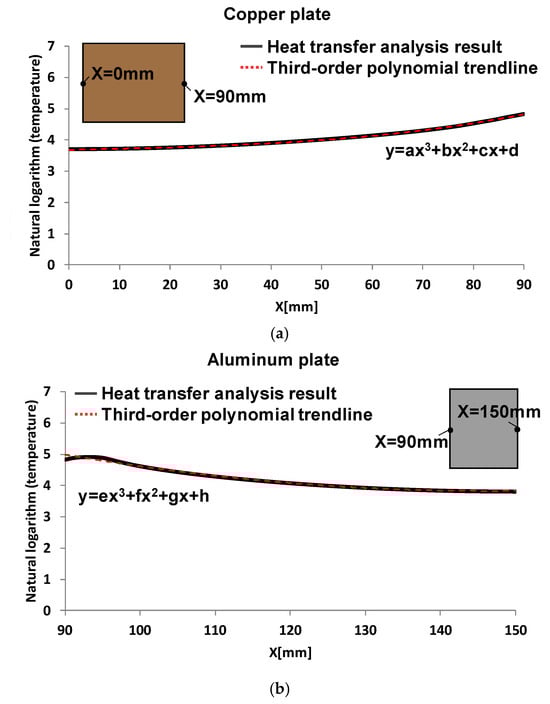
Figure 12.
Temperature data and trend line for input data of artificial neural networks.
Table 5.
Artificial neural networks data for dissimilar FSW.
In neural network models, hyperparameters such as the number of neurons in each layer, batch size, learning rate, and weight reduction depending on parameters are important for the performance of the model. To optimize the performance of the model through these hyperparameters, we used TensorFlow’s Keras Tuner library, which is used to automate hyperparameter tuning and find the optimal model configuration. Keras Tuner has several built-in tuners, of which we used Hyperband Tuner in this paper. Hyperband progressively increases the amount of resources allocated to each hyperparameter configuration during testing. Initially, a small amount of resources is assigned to each hyperparameter to quickly evaluate performance. Then, configurations with lower performance are terminated early to save resources, allowing more resources to be allocated to other configurations. This approach enables Hyperband to focus more resources on configurations with superior performance, ultimately deriving the optimal hyperparameters. The optimization results showed that the best results were obtained using forty-eight nodes and four hidden layers. Therefore, the neural network architecture used in the study consisted of an input layer with five nodes, four hidden layers with forty-eight nodes, and an output layer with one node. The accuracy of an ANN model depends on the quality and quantity of training data. In our experiments, we used 22 input and output datasets, 90% of which were used for training and 10% for testing. Mean squared error (MSE) was used as a loss function to evaluate the difference between the predicted values of the neural network and the values of the actual data. MSE calculates the mean squared error between the predicted and actual values and serves as an intuitive metric for evaluating model performance. Additionally, since MSE is mathematically differentiable, it is often used when applying optimization algorithms such as gradient descent. The MSE is expressed as in Equation (2), where the number of epochs used was 5000.
Figure 13 shows the evolution of the loss function as the number of epochs increases. We observe that the loss function decreases and then remains constant as the number of epochs increases.
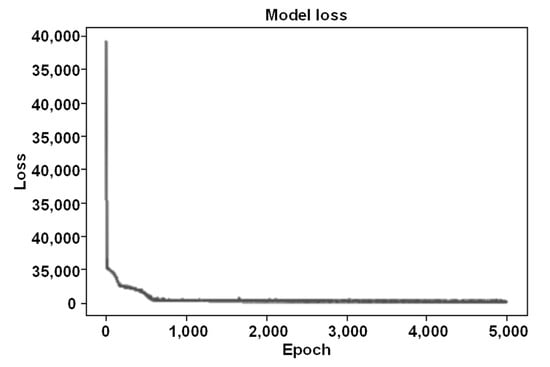
Figure 13.
Loss function with respect to number of epochs.
4.2. Artificial Neural Network Verification for Friction Stir Welding
Further experiments were conducted to verify the prediction accuracy of the trained ANN model on new input data. The experimental conditions were the same as the previous experimental method, and the experiments were conducted under the conditions of five FSW cases, with the welding conditions set to 800–1400 rpm and the feed rate set to 20–200 mm/min, as shown in Table 6. The temperature data measured by the experiment were used as the heat source value for the heat transfer analysis of the finite element analysis. The maximum temperatures obtained through heat transfer analysis and the temperature gradient values were taken as natural logarithms to reduce the slope of the graph and represented as third-order polynomials using trend lines. As before, the coefficients of the third-order polynomial and the maximum temperature were set as input data, and the data used for verification are shown in Table 7. Here, the output data are the tensile strength values from the actual experiment. The error was calculated by comparing the tensile strength predicted by inputting the validation data to the trained ANN model with the actual tensile strength of the validation data, and is shown in Table 8. The error between the tensile strength predicted by the verification data and the actual tensile strength is 5.4% on average and 7.4% on the maximum, which shows that it is possible to predict the tensile strength according to the new process conditions.
Table 6.
FSW experiment condition for verification set.
Table 7.
Verification dataset for artificial neural networks.
Table 8.
Verification of artificial neural networks results.
5. Conclusions
In this study, an artificial neural network was used to predict the mechanical properties of FSW of dissimilar materials using a cryogenic process (LN2). In order to accurately predict the mechanical properties after FSW, new input data different from previous studies were considered. The temperature gradient and data obtained through experiments and finite element analysis were used as input data for machine learning by setting the coefficients of a third-order polynomial using trend lines, and the tensile strength derived from tensile test results was used as output data for the artificial neural network. By applying the validation data obtained from the experiment to the neural network model trained with the new input data, the error between the predicted results and the experimental results was within 10%. It is expected that this neural network structure can be utilized to predict mechanical properties under new welding conditions.
Author Contributions
Conceptualization, M.C. and S.K.; methodology, J.H.K.; software, M.C.; validation, M.C. and S.K.; formal analysis, M.C.; investigation, J.G.; resources, S.K.; data curation, J.G.; writing—original draft preparation, M.C.; writing—review and editing, S.K.; visualization, J.G.; supervision, J.H.K.; project administration, S.K.; funding acquisition, S.K. All authors have read and agreed to the published version of the manuscript.
Funding
This study has been conducted with the support of the Korea Institute of Industrial Technology as “Predicting the quality of friction stir weld joint on curved lines XAI (JE240016)”. And The APC was funded by Changwon National University.
Data Availability Statement
The original contributions presented in the study are included in the article, further inquiries can be directed to the corresponding author.
Conflicts of Interest
The authors declare no conflicts of interest.
References
- Thaiping, C. Process parameters study on FSW joint of dissimilar metals for aluminum-steel. J. Mater. Sci. 2009, 44, 2573–2580. [Google Scholar]
- Morishige, T.; Kawaguchi, A.; Tsujikawa, M.; Higashi, K. Dissimilar Welding of Al and Mg Alloys by FSW. Mater. Trans. 2008, 49, 1129–1131. [Google Scholar] [CrossRef]
- Pietras, A.; Zadroga, L.; Lomozik, M. Characteristics of welds formed by pressure welding incorporating stirring of the weld material (FSW). Weld. Int. 2010, 18, 5–10. [Google Scholar] [CrossRef]
- Bruce, H.; John, F.H. Friction Stir Welding (FSW) of Littoral Combat Ship Deckhouse Structure. J. Ship Prod. Des. 2007, 23, 161–163. [Google Scholar]
- Tanaka, T.; Morishige, T.; Hirata, T. Comprehensive analysis of joint strength for dissimilar friction stir welds of mild steel to aluminum alloy. Scr. Mater. 2009, 61, 756–759. [Google Scholar] [CrossRef]
- Wang, G.; Zhao, Y.; Hao, Y. Friction stir welding of high-strength aerospace aluminum alloy and application in rocket tank manufacturing. J. Mater. Sci. Technol. 2018, 34, 73–91. [Google Scholar] [CrossRef]
- Li, B.; Shen, Y.; Hu, W. The study on defects in aluminum 2219-T6 thick butt friction stir welds with the application of multiple non-destructive testing methods. Mater. Des. 2011, 32, 2073–2084. [Google Scholar] [CrossRef]
- Prakash, K.S.; Sukhomay, P.; Surjya, K.P.; Rahul, J. Influence of plate position, tool offset and tool rotational speed on mechanical properties and microstructures of dissimilar Al/Cu friction stir welding joints. J. Mater. Process. Technol. 2016, 235, 55–67. [Google Scholar]
- Tan, C.W.; Jiang, Z.G.; Chen, Y.B.; Chen, X.Y. Microstructure evolution mechanical properties of dissimilar Al-Cu joints produced by friction stir welding. Mater. Des. 2013, 51, 466–473. [Google Scholar] [CrossRef]
- Mononen, J.; Siren, M.; Hanninen, H. Cost Comparison of FSW and MIG Welded Aluminium Panels. Weld. World 2003, 47, 32–35. [Google Scholar] [CrossRef]
- Kallee, S.W. 5-Industrial applications of Friction stir welding. In Friction Stir Welding; Woodhead Publishing Series in Welding and other Joining Technologies; Woodhead Publishing: Sawston, UK, 2010; pp. 118–163. [Google Scholar]
- Pedemonte, M.; Gambaro, C.; Lertora, E.; Mandolfino, C. Fatigue assessment of AA 8090 friction stir butt welds after surface finishing treatment. Aerosp. Sci. Technol. 2013, 27, 188–192. [Google Scholar] [CrossRef]
- Isa, M.S.M.; Moghadasi, K.; Ariffin, M.A.; Raja, S.; bin Muhamad, M.R.; Yusof, F.; Jamaludin, M.F.; bin Yusoff, N.; bin Ab Karim, M.S. Recent research progress in friction stir welding of aluminum and copper dissimilar joint: A review. J. Mater. Res. Technol. 2021, 15, 2735–2780. [Google Scholar]
- Vivek, P.; Jeroen, D.B.; Henrik, H.; Mattias, I.; Saeed, A.; Joel, A.; Jorgen, S. High-speed friction stir welding in light weight battery trays for the EV industry. Sci. Technol. Weld. Join. 2022, 27, 250–255. [Google Scholar]
- Omkar, M.; Tarig, A.; Desham, M.; Surjya, K.P.; Prakash, S. Characterization and modelling of Al and Cu busbar during charging and discharging of Li-ion battery for electric vehicles. Appl. Therm. Eng. 2023, 218, 119239. [Google Scholar]
- Beygi, R.; Kazeminezhad, M.; Kokabi, A.H. Butt joining Al-Cu bilayer sheet through friction stir welding. Trans. Nonferrous Met. Soc. China 2012, 22, 2925–2929. [Google Scholar] [CrossRef]
- Al-Roubaiy, A.O.; Nabat, S.M.; Batako, A.D.L. Experimental and theoretical analysis of friction stir welding of Al-Cu joints. Int. J. Adv. Manuf. Technol. 2014, 71, 1631–1642. [Google Scholar] [CrossRef]
- Liu, P.; Shi, Q.; Wang, W.; Wang, X.; Zhang, Z. Microstructure and XRD analysis of FSW joints for copper T2/aluminum 5A06 dissimilar materials. Mater. Lett. 2008, 62, 4106–4108. [Google Scholar] [CrossRef]
- Arun, K.K.; Pankaj, B. The study of material flow behaviour in dissimilar material FSW of AA6061 and Cu-B370 alloys plates. J. Manuf. Process. 2018, 34, 96–105. [Google Scholar]
- Khodaverdizadeh, H.; Mahmoudi, A.; Heidarzadeh, A.; Nazari, E. Effect of friction stir welding(FSW) Parameters on strain hardening nehavior of pure copper joints. Mater. Des. 2012, 35, 330–334. [Google Scholar] [CrossRef]
- Yang, J.; Wang, D.; Xiao, B.L.; Ni, D.R.; Ma, Z.Y. Effects of Rotation Rates on Microstructure, Mechanical Properties, and Fracture Behavior of Friction stir-Welded (FSW) AZ31 Magnesium Alloy. Metall. Mater. Trans. A 2013, 44, 517–530. [Google Scholar] [CrossRef]
- Elmetwally, H.T.; SaadAllah, H.N.; AbdElhady, M.S.; AbdelMagied, R.K. Optimum combination of rotational and wlding speeds for welding of Al/Cu-butt joint by friction stir welding. Int. J. Adv. Manuf. Technol. 2020, 110, 163–175. [Google Scholar] [CrossRef]
- Tauqir, N.; Mohammed, A.; Qasim, Z.; Davut, S. Applications of Machine Learning to Friction Stir Welding Process Optimization. J. Kejuruter. 2020, 32, 171–186. [Google Scholar]
- Abdelhakim, D.; Fouzi, H.; Ying, S. Exploring Deep Learning Methods to Forecast Mechanical Behavior of FSW Aluminum Sheets. J. Mater. Eng. Perform. 2023, 32, 4047–4063. [Google Scholar]
- Jayaraman, M.; Sivasubramanian, R.; Balasubramanian, V.; Lakshminarayanan, A.K. Application of RSM and ANN to predict the tensile strength of Friction Stir Welded A319 cast aluminium alloy. Int. J. Manuf. Res. 2009, 4, 306–323. [Google Scholar] [CrossRef]
- Vignesh, R.V.; Padmanaban, R. Comparison of ANN Training Algorithms for Predicting the Tensile Strength of Friction Stir Welded Aluminium Alloy AA1100. Int. J. Veh. Struct. Syst. 2018, 10, 98–102. [Google Scholar] [CrossRef]
- Okuyucu, H.; Kurt, A.; Arcaklioglu, E. Artificial neural network application to the friction stir welding of aluminum plate. Mater. Des. 2007, 28, 78–84. [Google Scholar] [CrossRef]
- Maleki, E. Artificial neural network application for modeling of friction stir welding effects on mechanical properties of 7075-T6 aluminum alloy. In IOP Conference Series: Materials Science and Engineering; IOP Publishing: Bristol, UK, 2015; Volume 103. [Google Scholar]
- Watanabe, T.; Takayama, T.; Yanagisawa, A. Joining of aluminum alloy to steel by friction stir welding. J. Mater. Process. Technol. 2006, 178, 342–349. [Google Scholar] [CrossRef]
- DebRoy, T.; Bhadeshia, H.K.D.H. Friction stir welding of dissimilar alloys—A perspective. Sci. Technol. Weld. Join. 2010, 15, 266–270. [Google Scholar] [CrossRef]
- Choi, D.H.; Lee, C.Y.; Ahn, B.W.; Yeng, Y.M.; Park, S.H.C.; Sato, Y.S.; Kokawa, H.; Jung, S.B. Effect of fixed location variation in friction stir welding of steel with different carbon contents. Sci. Technol. Weld. Join. 2010, 15, 266–336. [Google Scholar] [CrossRef]
- Xue, P.; Ni, D.R.; Wang, D.; Xiao, B.L.; Ma, Z.Y. Effect of friction stir welding parameters on the microstructure and mechanical properties of the dissimilar Al-Cu joints. Mater. Sci. Eng. A 2011, 528, 4683–4689. [Google Scholar] [CrossRef]
- Bakkiyaraj, M.; Stephen Bernard, S.; Saikrishnan, G.; Guruyogesh, S.; Guruprasanna, T.G.; Dineshkumar, K. Effect of tool offset condition on mechanical and metallurgical properties of FSW dissimilar Al-Cu joint. Mater. Today Proc. 2021, 43, 824–827. [Google Scholar] [CrossRef]
- Chetkin, E.; Kilickap, E.; Celik, Y.H. Investigation of the Effects of Welding Force, Vibration and Temperature on Mechanical Properties and Microstructure in FSW Welding. J. Polytech. 2023, 26, 445–455. [Google Scholar]
- Sakthivel, T.; Sengar, G.S.; Mukhopadhyay, J. Effect of welding speed on microstructure and mechanical properties of friction-stir-welding aluminum. Int. J. Adv. Manuf. Technol. 2009, 43, 468–473. [Google Scholar] [CrossRef]
- El-Rayes, M.M.; Soliman, M.S.; Abbas, A.T.; Pimenov, D.Y.; Erdakov, I.N.; Abdel-mawla, M.M. Effect of Feed Rate in FSW on the Mechanical and Microstructural Properties of AA5754 Joint. Adv. Mater. Sci. Eng. 2019, 12, 4156176. [Google Scholar] [CrossRef]
- Kang, S.W.; Kim, J.W.; Jang, Y.J.; Lee, K.J. Welding Deformation Analysis, Using an Inherent Strain Method for Friction Stir Welded Electric Vehicle Aluminum Battery Housing, Considering Productivity. Appl. Sci. 2019, 9, 3848. [Google Scholar] [CrossRef]
- Mughal, M.P.; Fawad, H.; Mufti, R. Parametric thermal analysis of a single molten metal droplet as applied to layered manufacturing. Heat Mass Transf. 2006, 42, 226–237. [Google Scholar] [CrossRef]
- Kang, S.W.; Jang, B.S. Comparisons with friction stir welding heat transfer analysis methods and parametric study on unspecified input variables. J. Mech. Sci. Technol. 2014, 28, 4233–4246. [Google Scholar] [CrossRef]
Disclaimer/Publisher’s Note: The statements, opinions and data contained in all publications are solely those of the individual author(s) and contributor(s) and not of MDPI and/or the editor(s). MDPI and/or the editor(s) disclaim responsibility for any injury to people or property resulting from any ideas, methods, instructions or products referred to in the content. |
© 2024 by the authors. Licensee MDPI, Basel, Switzerland. This article is an open access article distributed under the terms and conditions of the Creative Commons Attribution (CC BY) license (https://creativecommons.org/licenses/by/4.0/).