Article

Blackcurrant Pomace as a Rich Source of Anthocyanins: Ultrasound-Assisted Extraction under Different Parameters

by
Bartosz Kruszewski
1,* and
Emanuele Boselli
2
1
Department of Food Technology and Assessment, Institute of Food Sciences, Warsaw University of Life Sciences—SGGW, 02-776 Warsaw, Poland
2
Faculty of Science and Technology, Free University of Bozen-Bolzano, Piazza Università 1, 39100 Bolzano, Italy
*
Author to whom correspondence should be addressed.
Appl. Sci. 2024, 14(2), 821; https://doi.org/10.3390/app14020821
Submission received: 17 November 2023 / Revised: 8 January 2024 / Accepted: 15 January 2024 / Published: 18 January 2024
(This article belongs to the Special Issue Food Preservation and Analysis: Technologies and Applications)

Abstract

:

Featured Application

The results show that ultrasound can be successfully implemented for the efficient extraction of anthocyanins from blackcurrant pomace. From a circular economy perspective, this research is dedicated to the food and pharmaceutical industries to show that blackcurrant pomace, considered a waste, can be a very valuable raw material for obtaining anthocyanins or food coloring. The article provides information for the industry on what anthocyanin extraction parameters are best, taking into account solvent, pomace/solvent share, temperature and time.

Abstract

The industry is currently trying to manage the waste generated during juice pressing. Berry pomace is an especially rich source of many bioactive compounds. Blackcurrant pomace is particularly valuable because of the large amount of extractable anthocyanins remaining in the fruit skin. The aim of the study was to evaluate the effect of ultrasound-assisted extraction (UAE) parameters on the content of anthocyanins and color parameters of blackcurrant pomace extracts. The pomace used for the study was very rich in anthocyanins—an average content of 853.2 mg/100 g fresh weight. The effect of temperature (25, 35, 45 °C), time (15, 30, 60 min) and material/solvent ratio (1:20 or 1:7) on extraction yield was analyzed. The extracts were obtained using two solvents: water–ethanol acidified with HCl and water acidified with citric acid. Either solvent type, as well as the other parameters of the extraction process, have an impact on the level of anthocyanins in the extracts. The lowest range of extraction yield (63–68%) was obtained for a 1:7 ratio with water–citric acid solvent. The highest range of extraction yield (74–93%) was obtained for a 1:7 ratio with water–ethanol solvent. The most efficient method was extraction in a water–ethanol solvent (50/50 v/v) acidified with HCl, at a 1:7 material/solvent ratio, at 35 °C, for 15 min, providing 93% process efficiency. A strong relationship (r > 0.991) was also found between anthocyanin content and color saturation (C*) or hue (h°) in the obtained extracts. Based on the E1% coloring strength results, all the extracts obtained can be considered strong colorants, especially those obtained with the water–citric acid solvent. Ultrasonic extraction can be successfully applied to extract pigments from blackcurrant pomace and obtain, for example, food coloring.

1. Introduction

After the raw juice of vegetables or fruits is pressed, which can be further processed to produce concentrated juices, beverages, wines and more, a waste mass called pomace remains. Post-production pomace can account for 10% to as much as 60% of the initial weight of the raw material [1,2]. It is estimated that the world fruit industry alone generates 0.5 billion tons of post-production waste annually, mainly pomace. Pomace and other by-products generated from fruit and vegetable processing are some of the richest organic materials obtained as by-products in the agriculture and food industry. Studies show that many valuable nutrients remain in the pomace, such as proteins, lipids, saccharides, fiber, vitamins, coloring and aromatic substances [1,2,3]. The industry, in line with sustainable development goals, is trying to use pomace for various purposes. In addition, food manufacturers are realizing that with the right technology, their processing is cost-effective and increases the company’s product portfolio. However, the disadvantage of pomace is its high non-storability and susceptibility to microbial growth, which requires rapid processing and creates organizational difficulties in handling this material.
In the food industry, pomace is processed for various purposes, including animal feed and isolation of valuable ingredients, for example, pectins, pigments and vitamins [4]. Moreover, pomace is also added to tea blends as an additive that enhances the desired flavor, aroma and color [5]. Fruit or vegetable pomaces are ideal as an additive that can enrich foods with proteins, vitamins, polyphenols, organic acids or minerals [6]. Another application is its use for ethanol and vinegar production [7]. An integral part of fruits and tomato pomace are seeds, from which high-quality oil can be extracted [3]. Pomace is also used for biotechnology purposes as part of the microbial growth medium and, most importantly, for biogas production [8,9]. There are also attempts to extract plant pigments to dye wool fibers and other textiles [10].
Blackcurrant (Ribes nigrum L.) is known for its strong health properties (antimicrobial, antioxidant, anti-inflammatory, facilitating the biosynthesis of collagen, aiding in the production of some peptide hormones, and many others) due to its high content of ascorbic acid, anthocyanins and flavonoids [11,12,13]. Studies have shown that currant pomace, along with that of grapes and chokeberry, contains a large amount of these components after the juice pressing process [5,14]. In particular, anthocyanins are of interest because of their high content in the skin and because they can be extracted relatively easily. The extracted anthocyanins are used for pharmaceutical purposes and as a food coloring additive (E163).
Ultrasound-assisted extraction (UAE) is an advanced technique that is being proposed as one of the sustainable alternatives to conventional extraction, showing the potential to reduce extraction time, energy and solvent consumption and simultaneously increase extraction yield [15,16,17,18]. UAE is based on the interaction of high-frequency sound waves with the plant matrix. Cavitation, friction on interfacial surfaces, absorption of the acoustic wave energy, as well as the associated heat release, cause UAE to increase solubility, diffusion, solvent penetration and transport of compounds, greatly increasing efficiency [19]. Ultrasound is successfully used for the extraction of phenolic compounds, carotenoids, anthocyanins, oils, polysaccharides, etc., from various plant parts and agricultural by-products [15,16].
Methanol, ethanol or acetone are best suited for extracting bioactive compounds from blackcurrant plant parts or pomace [13]. However, neither methanol nor acetone can be used to obtain extracts later used in food production. On the other hand, ethanol is an expensive solvent, so water or mixtures of water with ethanol are used for economical industrial extraction. Previous studies have shown that acidification of the solvent greatly increases the amount of extracted anthocyanins, hydroxycinnamic acids or flavonols from blackcurrant pomace, also improving the color of the extracts [14,20]. To date, the use of various extraction techniques for berry pomace has been reported: conventional extraction in water bath shakers [20], microwave-assisted extraction (MAE) [21], ultrasound-assisted extraction (UAE) [15,16,21,22], enzyme-assisted extraction (ESE) [16,23,24], pulsed-electric field-assisted extraction (PEFE) [25], and supercritical carbon dioxide extraction (SFE-CO2) [24].
In this study, blackcurrant pomace was used as a substrate for ultrasound-assisted extraction (UAE) of anthocyanins. The objective was to obtain the highest possible extraction efficiency considering four variable parameters: (1) type of solvent, (2) pomace/solvent ratio, (3) temperature, and (4) time. The extracts obtained were characterized in terms of their suitability for subsequent use in the food industry (anthocyanin content, color parameters, coloring strength and pH value).

2. Materials and Methods

2.1. Blackcurrant Pomace

The experimental material for this study was a blackcurrant pomace of the Tiben variety obtained by pressing the juice on an HPL14 hydraulic press (BUCHER Unipectin AG, Niederweningen, Switzerland) with the assistance of Pectinex® Ultra Color enzyme (Novozymes S.A., Mazowieckie, Poland). The enzyme was chosen because of its specifications for obtaining material with more intense color and better color stability (free from color-destroying glycosidases). After pressing, pomace was frozen and stored at −20 °C before freeze-drying. Frozen blackcurrant pomace was then freeze-dried in the freeze-dryer Alpha 1–4 LSCplus (Martin Christ Gefriertrocknungsanlagen GmbH, Osterode am Harz, Germany) at less than 1 mbar, ice condenser temperature −55 °C for 48 h. The freeze-dried pomace was immediately pulverized using a GRINDOMIX GM200 knife mill (Retsch GmbH, Bindlach, Germany) for 60 s at 5000 rpm and sieved on a 0.2 mm mesh sieve. The pomace thus prepared was stored, under nitrogen, in an airtight laboratory bottle with a Schott cap at −20 °C, protected from light. Then, it was used for UAE. The entire procedure described above regarding the acquisition of the research material was carried out in the laboratories of the Department of Food Technology and Assessment at Warsaw University of Life Sciences—SGGW.

2.2. Preparation of Solvents for Extraction

Data in the literature have shown that acidified ethanol and aqueous solvents are the most effective in extracting anthocyanins from berries and pomace [16,20]. Aqueous solvents are also the most commonly used in the food or pharmaceutical industry because they are an environmentally friendly and low-cost solution for obtaining biologically active compounds from natural materials.
One of the solvents used in the experiments was a mixture of water with ethanol (50/50 v/v) acidified with HCl to pH 1.5. The second solvent was water acidified with citric acid to pH 1.5 (0.67 M). The pH of both solutions was measured with a HI 221 device (Hanna Instruments Inc., Smithfield, RI, USA).
For solvent preparations, ultra-pure water was used (Milli-Q® system, resistivity of 18.2 MΩ cm, Merck Millipore, Darmstadt, Germany). The ethanol, hydrochloric and anhydrous citric acids were reagent grade, purchased from Merck KGaA (Darmstadt, Germany).

2.3. Conditions of Ultrasound-Assisted Extraction

An appropriate amount of freeze-dried ground blackcurrant pomace sample was weighed on a WPA 120/K analytical balance (RADWAG, Wielkopolskie, Poland) to the nearest 0.001 g, and the selected solvent was poured into a volumetric flask to obtain a 1:20 or 1:7 material/solvent ratio. The mixtures were premixed manually for 1 min and then subjected to UAE in an SW 3H (SONOSWISS, Ramsen, Switzerland) device at the appropriate water temperature of 25, 35 or 45 °C and time duration of 15, 30 or 60 min, in a dark room without light access. Temperature and time were chosen based on discussions with some representatives of the fruit and vegetable industry in Poland who were interested in berry pomace utilization. The parameters of the ultrasonic unit were always constant: a wave intensity of 4.1 W/cm2 and a wave frequency of 38 kHz. Adequate water temperature was maintained by circulating water with a heat exchanger. A single extraction of pomace material was performed, replicating industrial conditions. The extracts obtained were filtered through a Buchner funnel with MUNKTELL-FILTRAK type 389 filter paper using a LABOPORT® vacuum pump (KNF GmbH, Freiburg, Germany). The filtered extracts were stored at 4 °C in dark glass until analysis.
Taking into account extraction time and temperature, solvent type and material/solvent ratio, 36 variants of extracts were obtained and submitted for analysis. Each extraction was performed in triplicate.

2.4. Moisture, Water Activity, Protein Content and Color Determination of Pomace

The gravimetrical method was used to measure moisture content. For drying, sand was added to increase the evaporation surface of the pomace samples and to prevent the formation of crusts on the upper layer, which makes drying difficult. Samples with sand were weighed on a WPA 120/K analytical balance (RADWAG, Wielkopolskie, Poland) with an accuracy of 0.001 g. The samples were dried in a Heratherm OMS60 laboratory drier (Thermo Fisher Scientific Inc., Waltham, MA, USA) at 105 °C for 6 h to constant weight.
Water activity in the pomace was measured using an AquaLab 3TE apparatus (Decagon Devices Inc., Pullman, WA, USA) at 20 °C in a humidity-controlled room.
Protein content was determined according to the Kjeldahl method [26] with a conversion factor of 6.25.
Instrumental measurement of pomace color parameters was performed in the CIE L*a*b* system (L*—lightness; a*—red to green; b*—yellow to blue) using a Konica Minolta CM-3600d colorimeter (Osaka, Japan). Determination of L*, C* and h° values was carried out in reflection mode, with the following settings: illuminant D65, observation angle of 10°, diaphragm 25.4 mm, using a glass cuvette with a layer thickness of 20 mm.
All mentioned measurements were performed in triplicate.

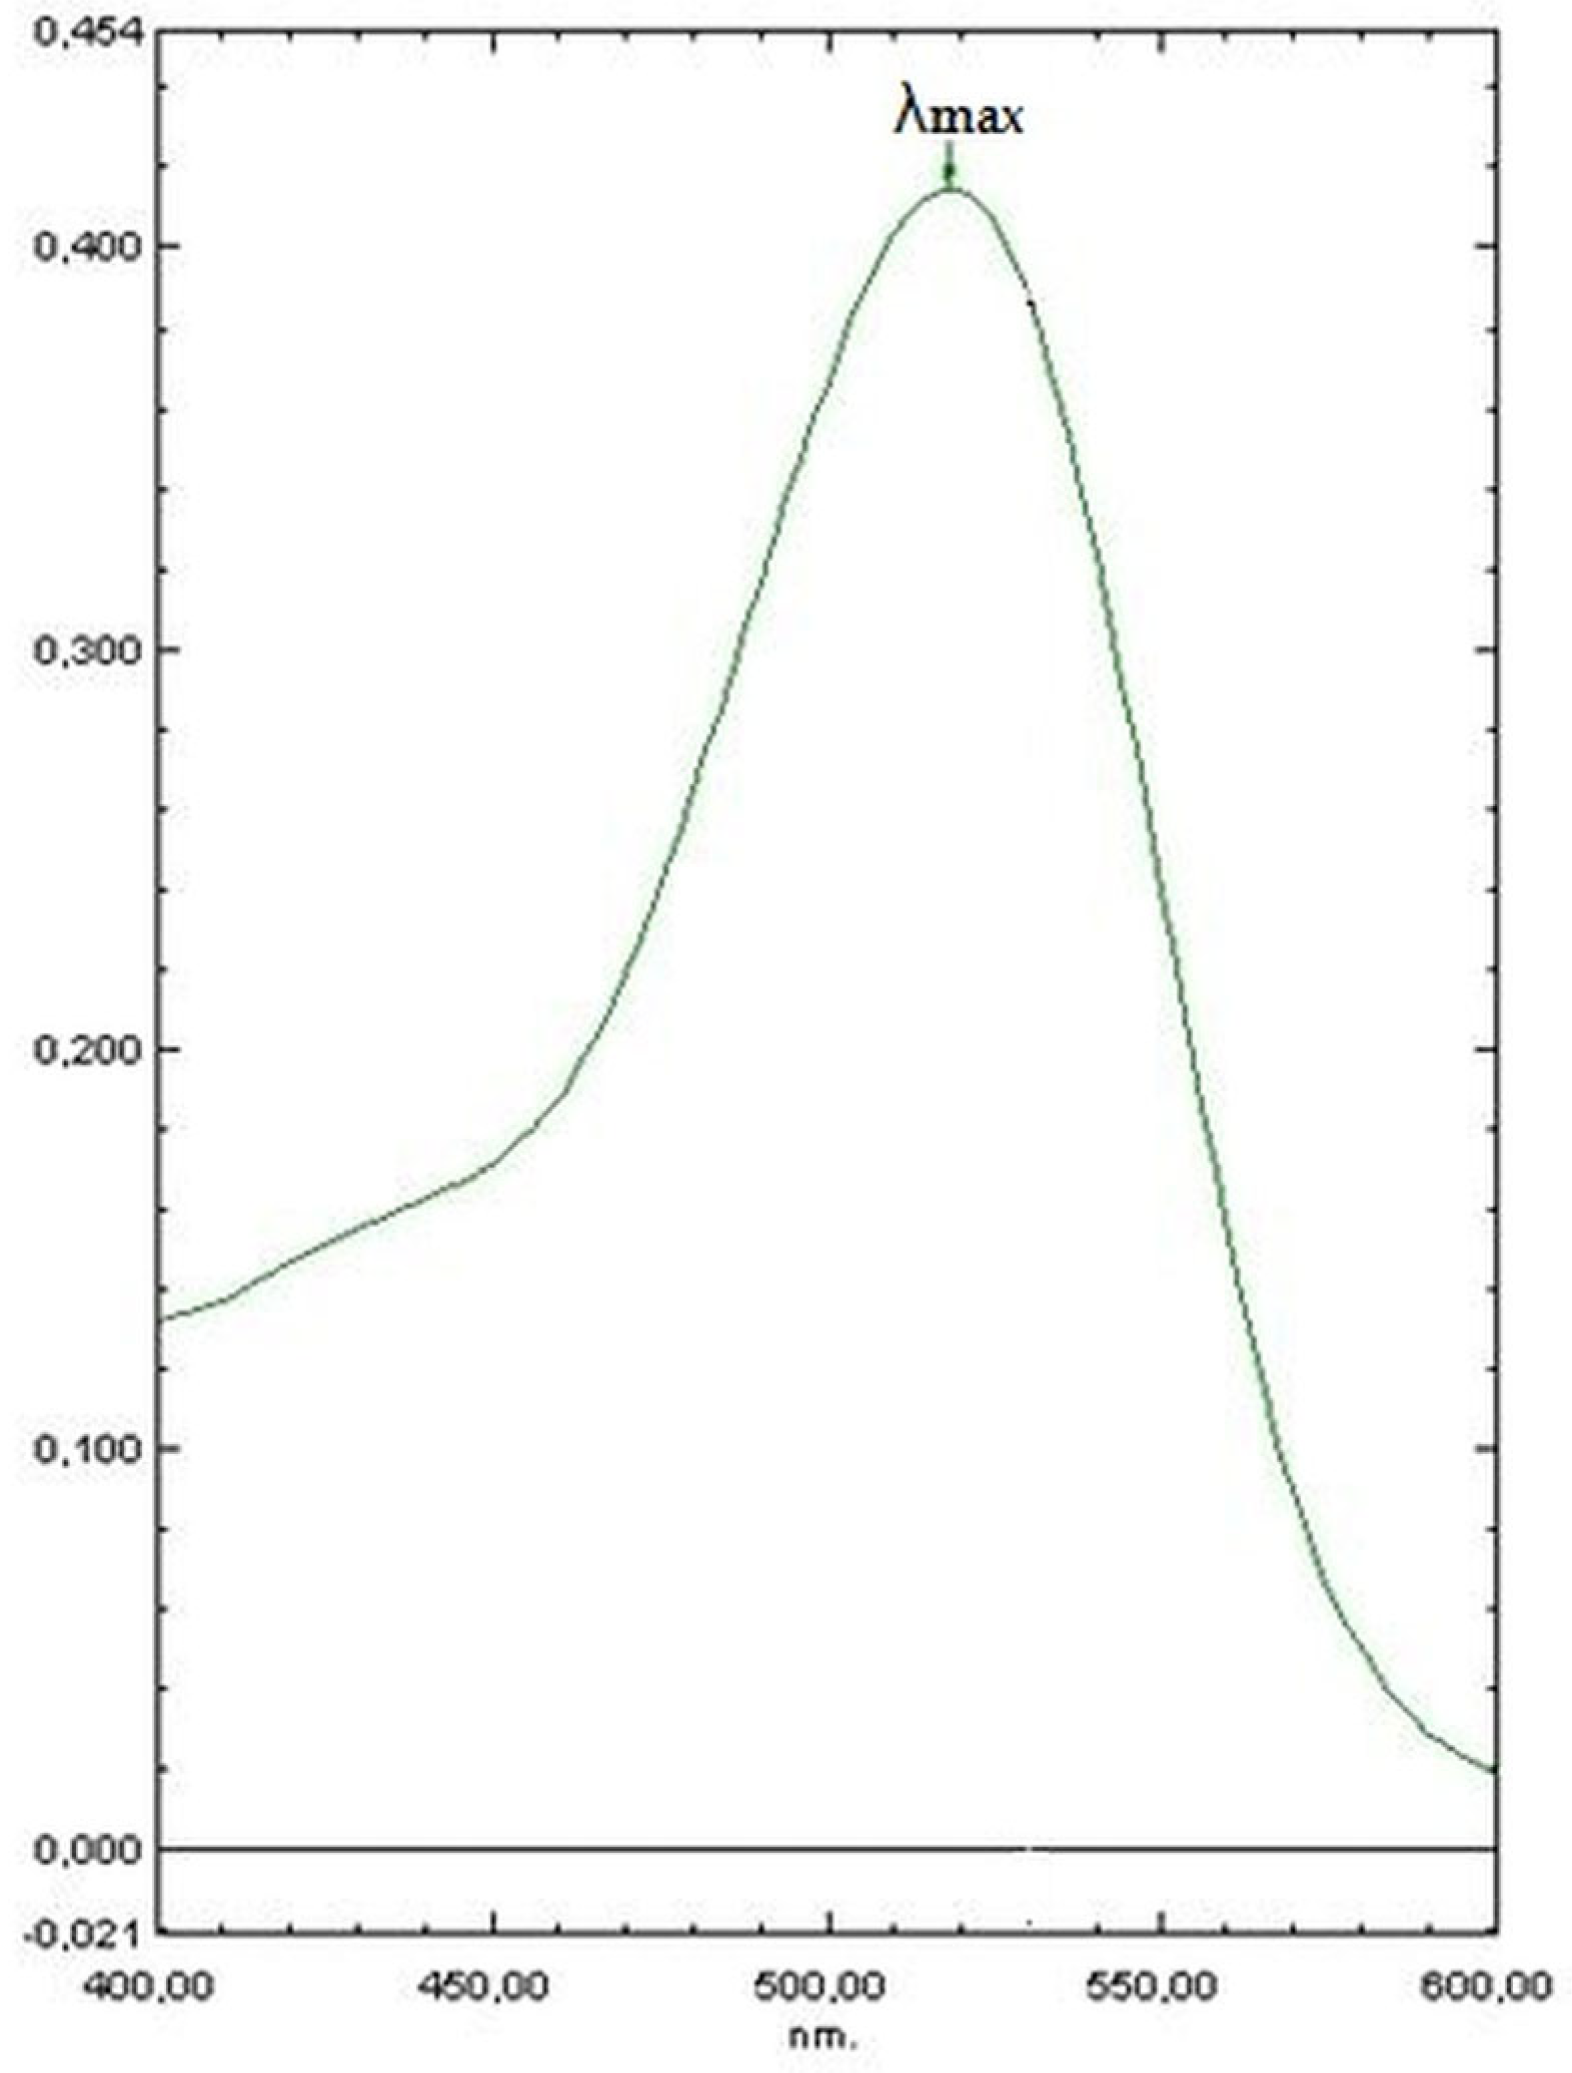
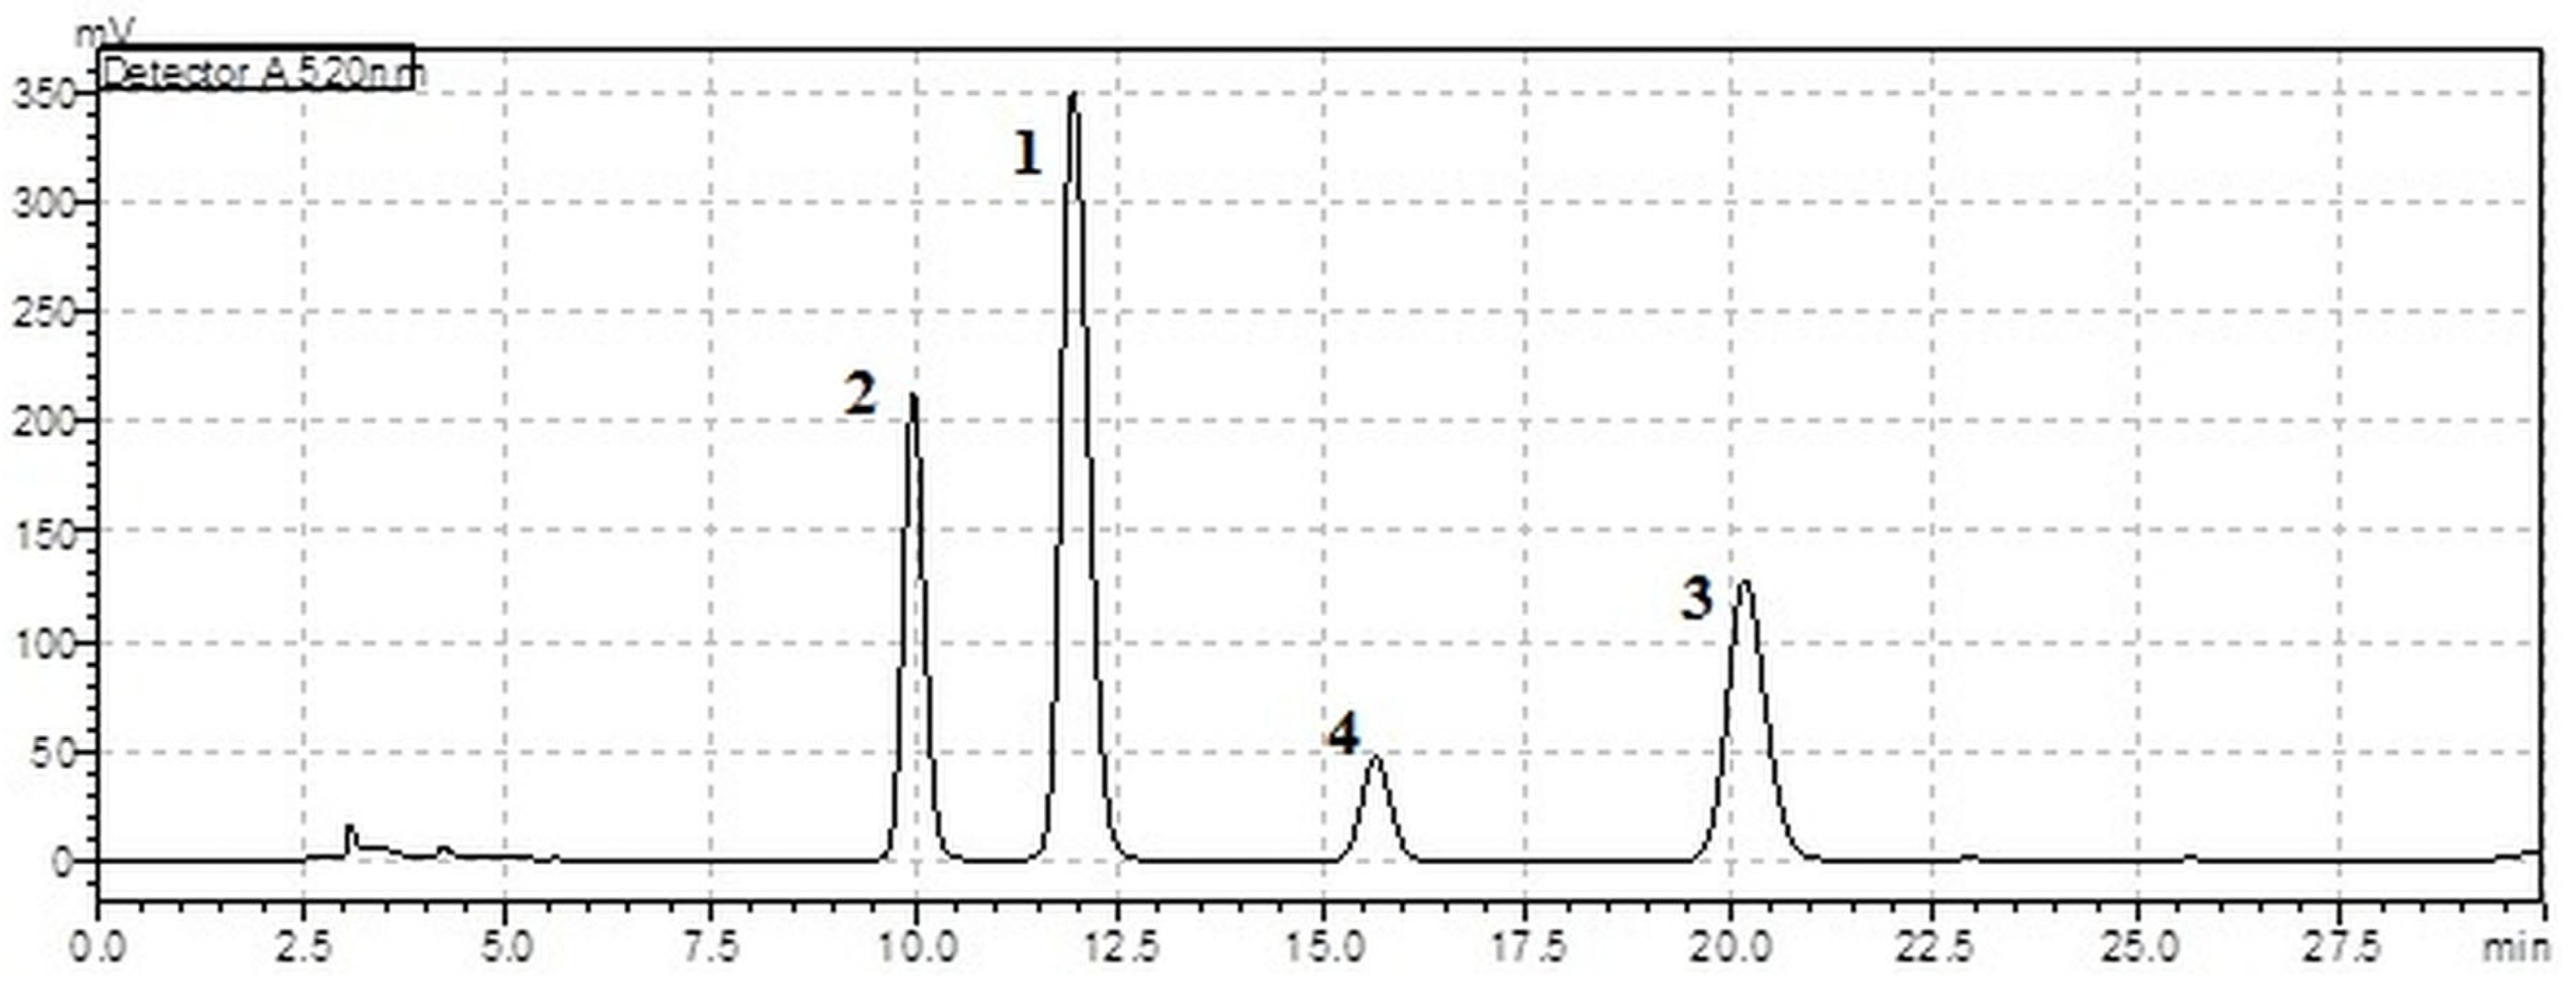
2.5. Chromatographic Determination of Anthocyanins

2.5.1. Preparation of Primary Extract from Pomace

To determine the anthocyanin content in the blackcurrant pomace, a primary extract was made. To prepare the primary extract for HPLC analysis, 0.5 g of freeze-dried pomace was repeatedly extracted with 1% hydrochloric acid aqueous solution until the sample was completely discolored. Each time, the mixture was ultrasonically extracted for 10 min and centrifuged (5000 rpm, 10 min); the supernatant was collected in a volumetric flask.

2.5.2. Chromatographic Parameters

Chromatographic analysis of anthocyanins, their identification and quantification was performed according to an identical procedure published earlier [27].
An amount of 2 mL of primary extract from pomace or one of 36 variants of extracts obtained as a result of the experiments was added to a 10 mL volumetric flask and filled to the mark with distilled water. The contents were mixed thoroughly and, after 5 min, were poured into a beaker. Then, 1 mL of the prepared solution was passed through a 0.45 µm pore size hydrophilic PTFE Alfatec syringe filter into vials, discarding the first few drops of filtrate.
Analysis of anthocyanin compounds was carried out using a high-performance liquid chromatograph (HPLC) equipped with LC-10ATvp pump, SPD-10Avp UV-Vis detector, CTD-10AsVp column thermostat and DEGASEXTM DG-4400 degasser (Shimadzu Corporation, Kyoto, Japan). Analyses were performed on a Luna 5 µm C18 100Å, 250 × 4.6 mm column from Phenomenex (Torrance, CA, USA). Separation of anthocyanins was carried out using an isocratic system at 25 °C and a flow rate of 1 mL/min. A solution of water, acetonitrile and formic acid in the ratio 415:35:50 (v) was used as the eluent. Data recording was carried out at a wavelength of λ = 520 nm. The analysis time was 30 min. Monomers of the anthocyanins were identified by comparing their retention times with the retention times library of standards of four main blackcurrant anthocyanins. In addition, the resulting chromatograms were compared with those published by Goiffon et al. [28]. The content of each monomer was calculated based on the calibration curve for cyanidin-3-O-glucoside standard solutions and expressed for extracts as mg of cyanidin-3-glucoside in 100 mL, while for pomace as mg of cyanidin-3-glucoside in 100 g of pomace fresh weight (f.w.).

2.6. Other Analyses Conducted on Extracts

2.6.1. Color Parameters

Instrumental measurement of the color parameters of the extracts was performed in the CIE L*a*b* system (L*—lightness; a*—red to green; b*—yellow to blue) using a Konica Minolta CM-3600d colorimeter (Osaka, Japan). Determination of L*, C* and h° values in fourfold repetition for each sample was carried out in transmission mode, with the following settings: illuminant D65, 10° observation angle, diaphragm 25.4 mm, using a glass cuvette with a layer thickness of 10 mm.

2.6.2. Determination of Coloring Strength

To evaluate the coloring strength of the extracts regardless of the type of solvent used, a 1% solution of the extracts in water at pH 3.5 was prepared. Coloring strength E1% was obtained by spectrophotometric analysis using a glass cuvette with a layer thickness of 10 mm and expressed as absorptivity at λ = 520 nm. The highest absorbance in the spectrum was obtained in the wavelength range of 400–600 nm (Figure 1) using the Shimadzu UV-1650PC spectrophotometer (Shimadzu Corp., Kyoto, Japan).

2.6.3. Analysis of pH

The pH of the extract samples was analyzed in triplicate using a TitroLine® 5000 automated titrator (SI Analytics®, Mainz am Rhein, Germany). Before analyses, the titrator was calibrated with buffer solutions and the temperature of the juice samples was adjusted to 20 °C.

2.7. Statistics

All data were presented as the mean with standard deviation for three replicates of each measurement made for each of the two independent repetitions of the UAE extraction experiments. Statistical analyses were conducted using Statistica 13.3 (TIBCO Software Inc., Carlsbad, CA, USA). The effects of different extraction conditions on the measured anthocyanin content and other parameters of the extracts were determined using one-way ANOVA (also two-way ANOVA for checking the interactions between time and temperature). Differences between the means were evaluated with the Tukey HSD post hoc test (α = 95%). Pearson’s correlation coefficients (r) between anthocyanin content and color parameters of the extracts were determined.

3. Results and Discussion

3.1. Characteristics of Blackcurrant Pomace

The moisture content in fresh blackcurrant pomace was 57.3% (Table 1). This is the typical water content of pomace obtained from berries treated by enzymatic processing. Other studies have reported moisture content in treated berry pomaces from 51.6% to 62.2% [29]. Enzymatic treatment increased the efficiency of juice pressing. Pectinases loosen fruit tissue by degrading pectin, while hemicellulases break down and hydrolyzate xylans, galactans, mannans and arabans. However, less moist pomace can be obtained in combination with an advanced hydraulic piston-cylinder press. Because of the high moisture content, the water activity (aw) value was also high (Table 1), which means that the pomace is highly susceptible to microbial spoilage, and rapid transfer to further processing is necessary.
When extracting with alcohol-containing solvents, especially at low pH, it is important to analyze the protein content in the matrix because it can bind to polyphenols and precipitate during the process. The protein content of the pomace analyzed was low, about 5.2% of fresh weight, which allowed the extraction to proceed correctly. In other studies, the protein content of blackcurrant pomace was between 4.0 and 8.1% of fresh weight [1,29].
The color of blackcurrant pomace was dark red/purple, indicating its richness in anthocyanins. Fragments or whole seeds were visible in the pomace mass. However, blackcurrant fruits contain many seeds, which are not convenient to remove during extraction. Similar color properties of blackcurrant pomace were found in another study [29].
The anthocyanin content in the blackcurrant pomace studied was 853.2 mg per 100 g fresh weight. The high content of anthocyanins in berry pomace is due to their accumulation mainly in the skin. Therefore, they are a valuable by-product of the food industry with the possibility of further uses, such as pigment extraction or food coloring. According to chromatographic analysis, delphinidin-3-O-rutinoside was the predominant anthocyanin (45.5% of total anthocyanins) (Table 1). Cyanidin-3-O-rutinoside and delphinidin-3-O-glucoside accounted for a similar share, 24.1% and 23.5%, respectively. The smallest share of all anthocyanins was represented by cyanidin-3-O-glucoside (7.0%). The literature shows different proportions of these four major anthocyanins in blackcurrant fruits and pomace [12,30]. However, these four anthocyanins account for 97% or more of the total anthocyanin content [31]. It should be remembered that the differences in results depend on the blackcurrant variety, the agronomic method and place of cultivation, the year of harvesting and the technological processes used during juice pressing [32].

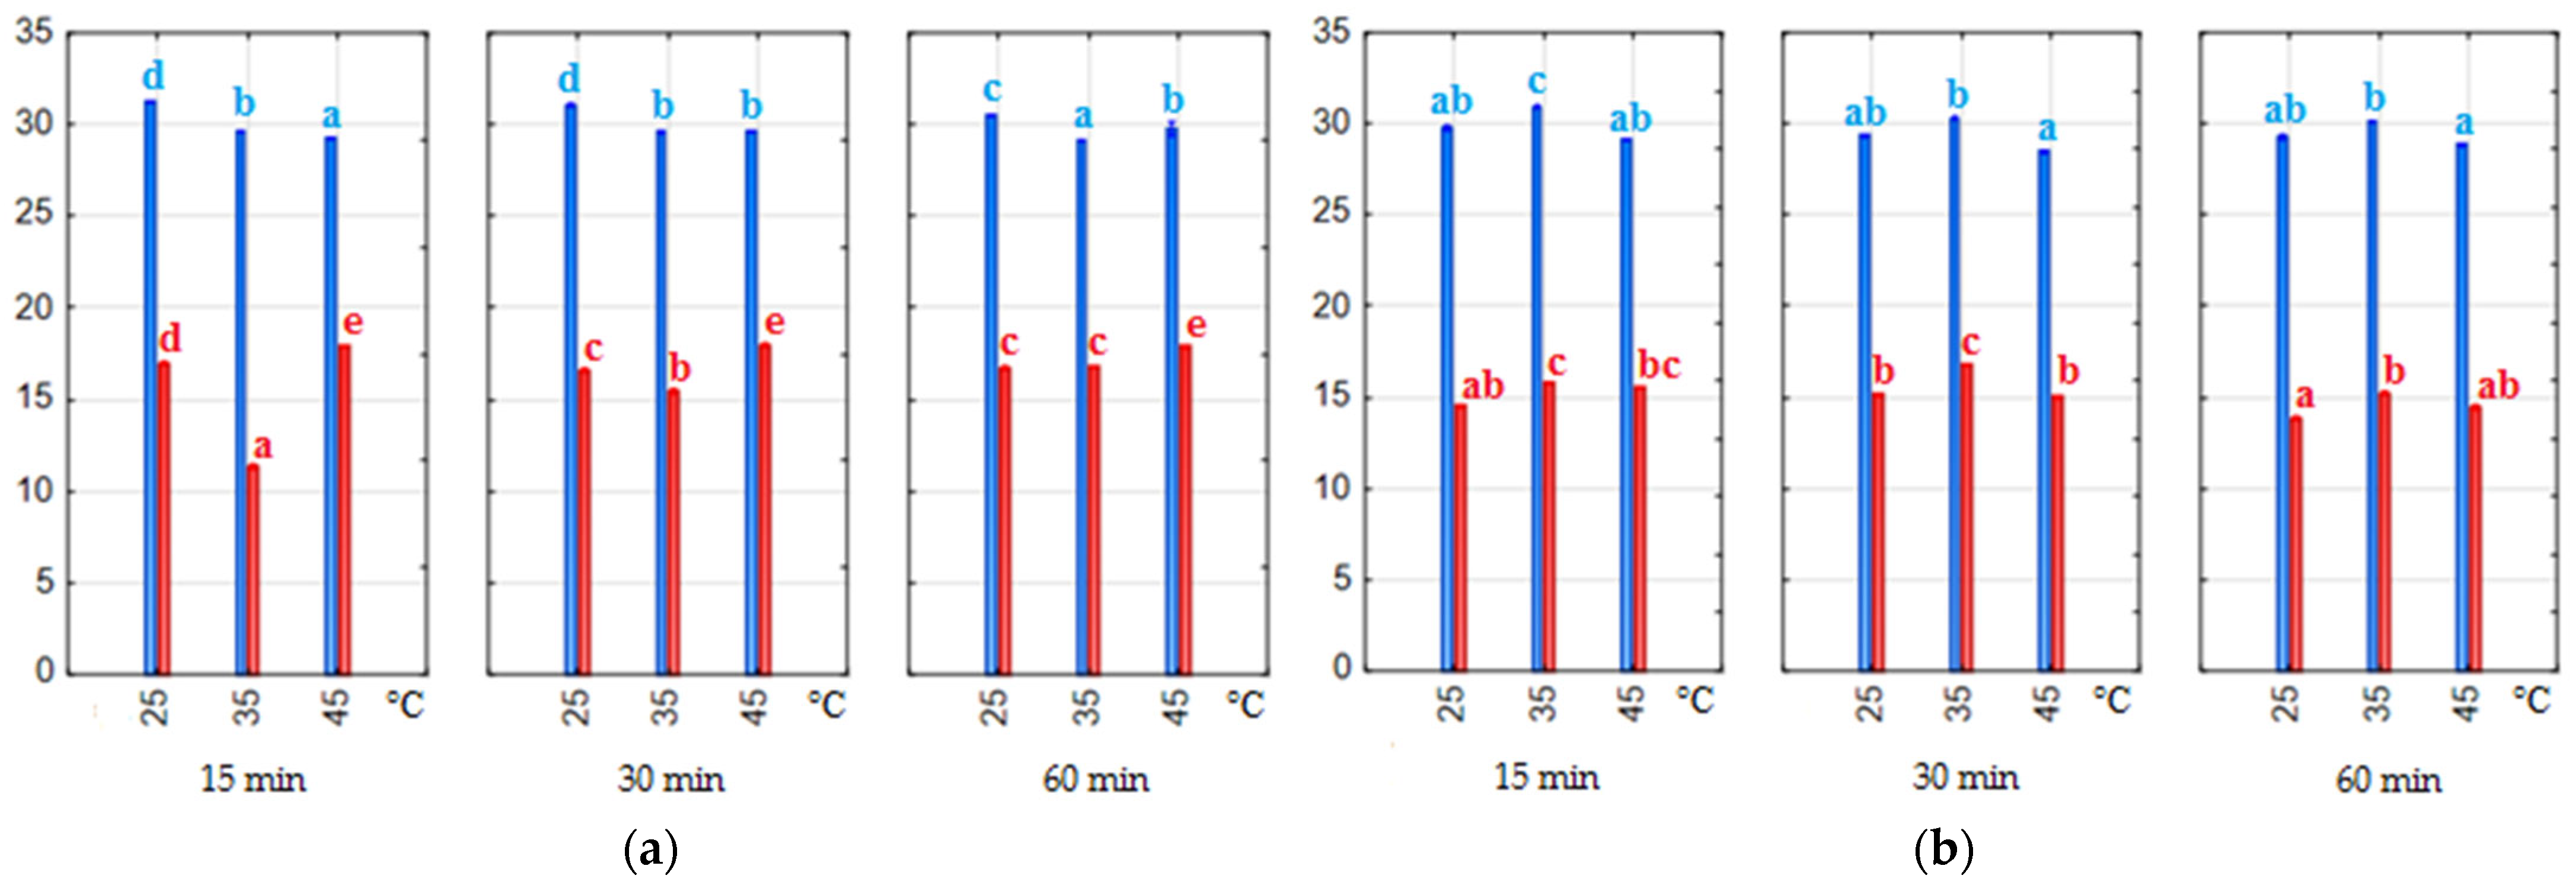
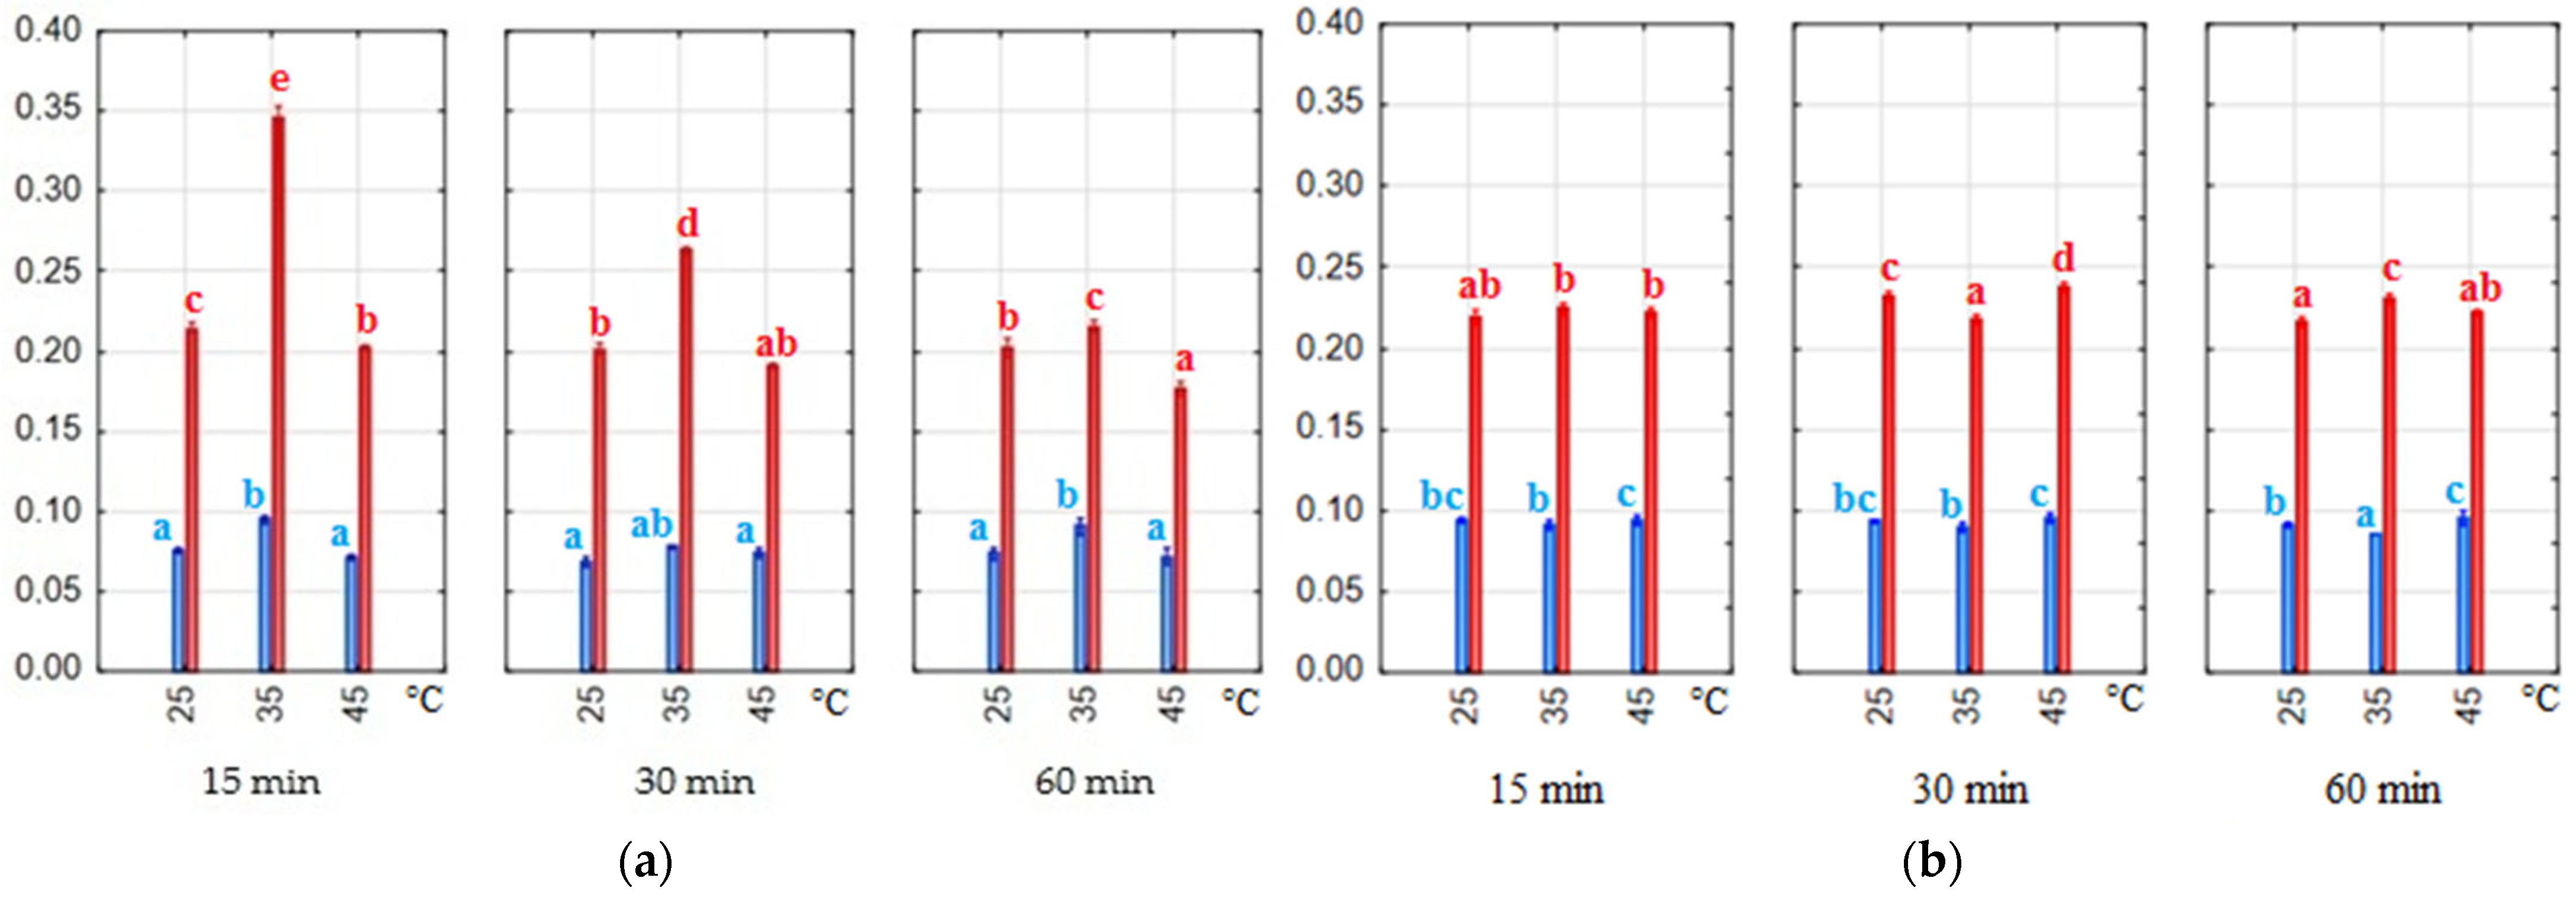
3.2. Extraction Yield of Anthocyanins

Various solvents such as acidified water, alcohols and acetone have been used for the UAE of different bioactive compounds from plant materials [15]. In particular, ethanol, with a different percentage of water, possesses the highest affinity for phenols, and thus, it is usually the first choice for the extraction of phenolic compounds. In addition, water acidification is one of the common methods for efficient UAE of bioactive compounds [33], especially while targeting anthocyanins from berries and their pomace [16,20]. Moreover, aqueous solvents are desirable by the food or pharmaceutical industry because they are environmentally friendly and low in cost to obtain. Our study revealed that the choice of solvent is important for the extraction efficiency of anthocyanins from blackcurrant pomace (Table 2).
Regardless of the extraction parameters selected, the highest yield was always obtained with the water–ethanol solvent acidified with HCl. For this solvent, changing the material/solvent ratio from 1:20 to 1:7 did not adversely affect the extraction yield, indicating that a ratio of 1:20 is too high and, consequently, not advantageous for such extraction. In contrast, the opposite was observed for the water–citric acid solvent. Significantly higher yields were obtained with a ratio of 1:20 instead of 1:7. Probably, the citric acid partially saturated the solvent and reduced its extraction capacity.
According to the literature, solvent pH is an important factor affecting the UAE yield and characteristics of many bioactive compounds [15]. Generally, the optimal pH for the extraction of phenolic compounds is in the range of 1–3 [20,22]. Therefore, to maximize anthocyanin recoveries from pomace in our experiment, we used acidified solvents with a pH of 1.5.
The results of the experiments showed that extending the anthocyanin extraction time to 60 min had no positive effect. The extraction time of 60 min showed the same or lower yield than that observed for 30 min, which was mostly attributable to the degradation of anthocyanins due to mechanical or chemical processes [16]. The optimized sonication time for the extraction of different phenolic compounds from plant by-products has been reported to be in the range of 10–90 min [15].
As for temperature, in our study, its effect depended on the solvent used. For the water–ethanol solvent, the best results were achieved at 35 °C (Figure A1). A temperature of 45 °C negatively affected the extraction efficiency, which was more noticeable as the process time increased. However, for the water–citric acid mixture, the temperature only mattered for the 1:20 ratio, where the best yield was obtained at 45 °C and the worst at 35 °C. For this solvent, with a material-to-solvent ratio of 1:7, temperature and time had no practical effect since the extraction yield was almost the same. According to the literature, an increase in temperature during phenol extraction has a positive impact up to a certain value, after which the yield decreases due to the weakening of the cavitation effect. Al-Dhabi et al. [34] obtained the best extraction efficiency at 45 °C, above which they achieved only worse results. Azman et al. [14] reported 50 °C as the most effective temperature. However, the optimal temperature may vary depending on the type of polyphenols to be extracted, the sample matrix and the pretreatment processes.
Statistical analysis showed a significant interaction between extraction time and temperature for both solvents (Table A1). The results of the two-way ANOVA showed an obvious gradation of anthocyanin content in extracts using a water–ethanol solvent (Table A2). The samples were ranked according to increasing anthocyanin content: for temperature 45 < 35 < 25 °C, with time 60 < 30 < 15 min. Up to seven homogeneous groups were formed, with the last three being single-element groups showing the highest extraction efficiencies for 35 °C. For water–acid extracts, the best combination of extraction parameters is 45 or 25 °C coupled with 15 and 30 min (Table A3). The influence of the factors was not so strong on the extraction efficiency because only four homogeneous multi-element groups were formed.

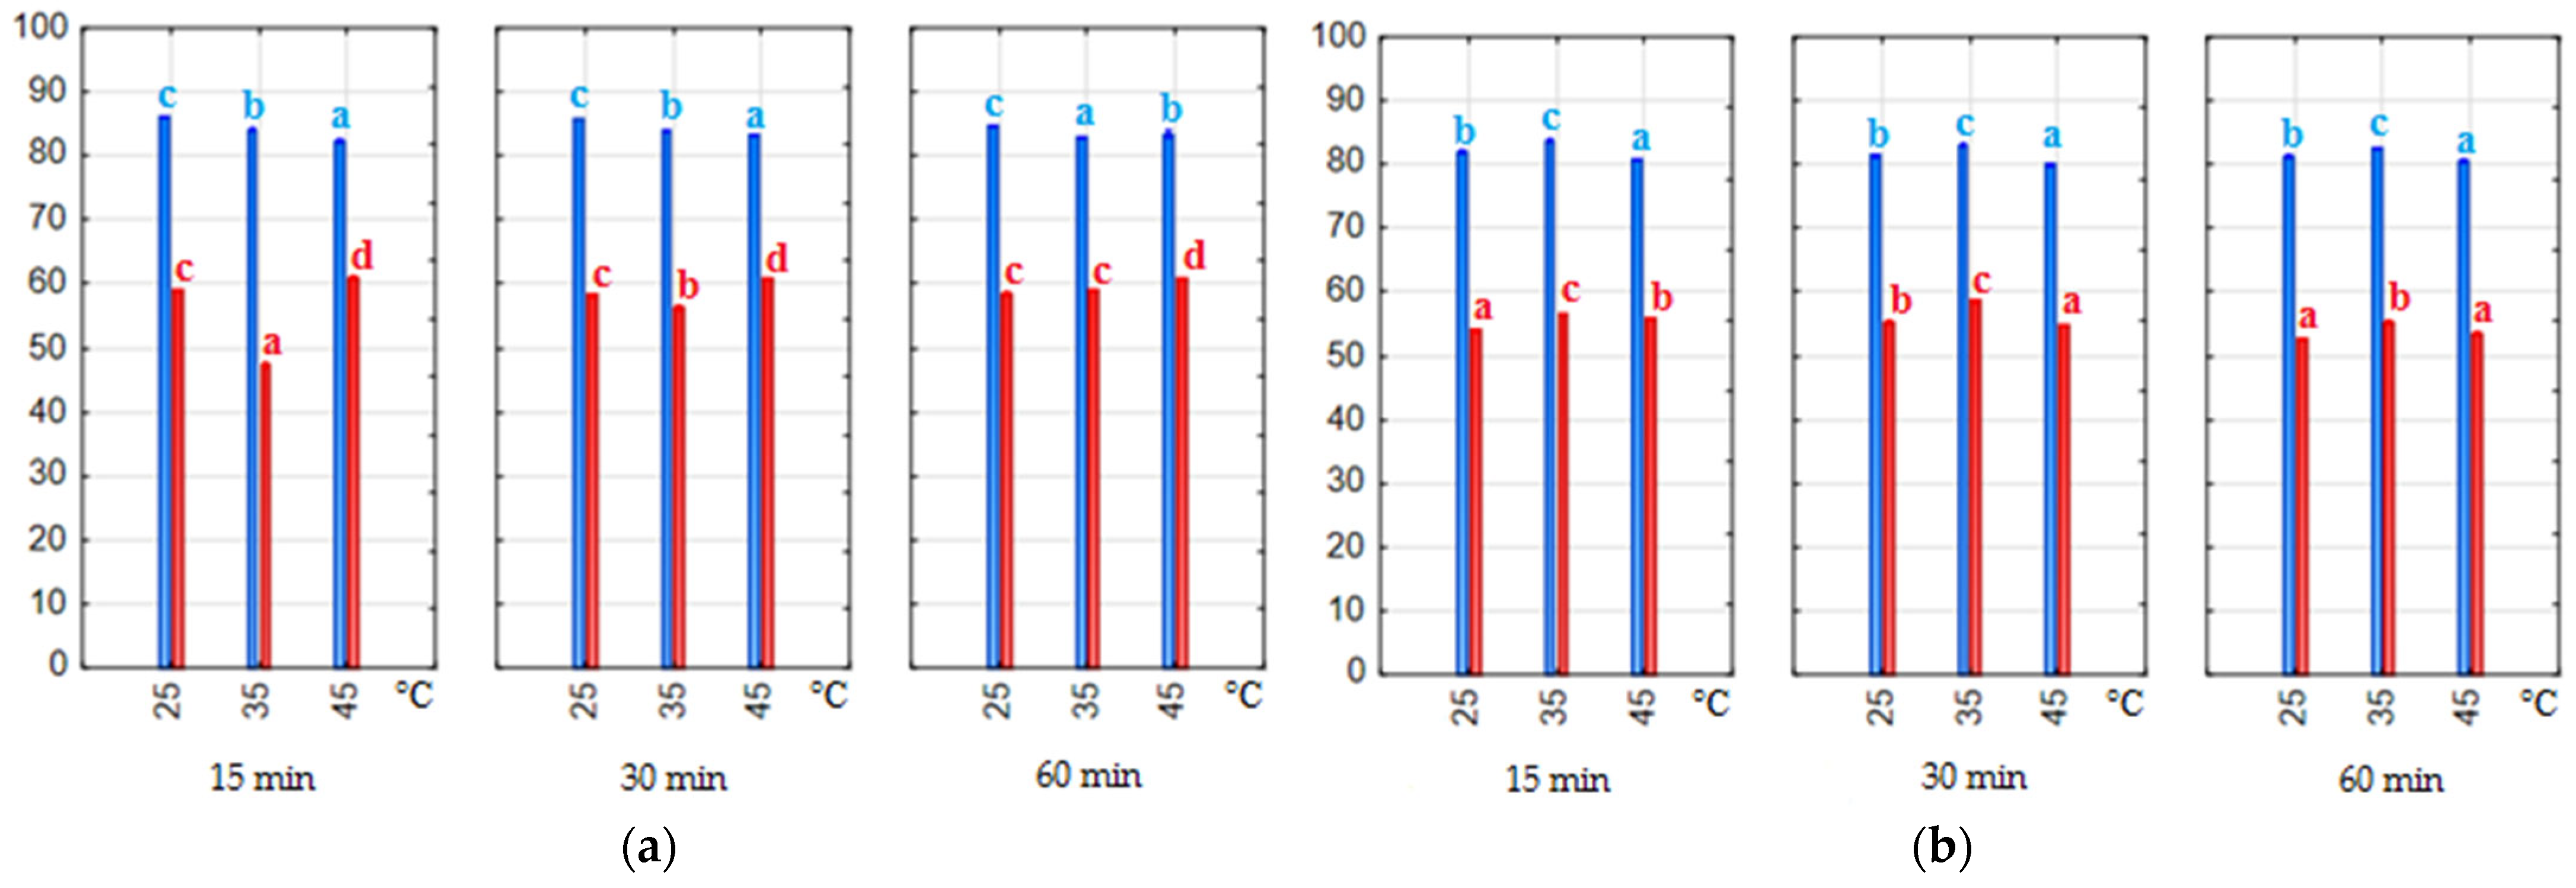
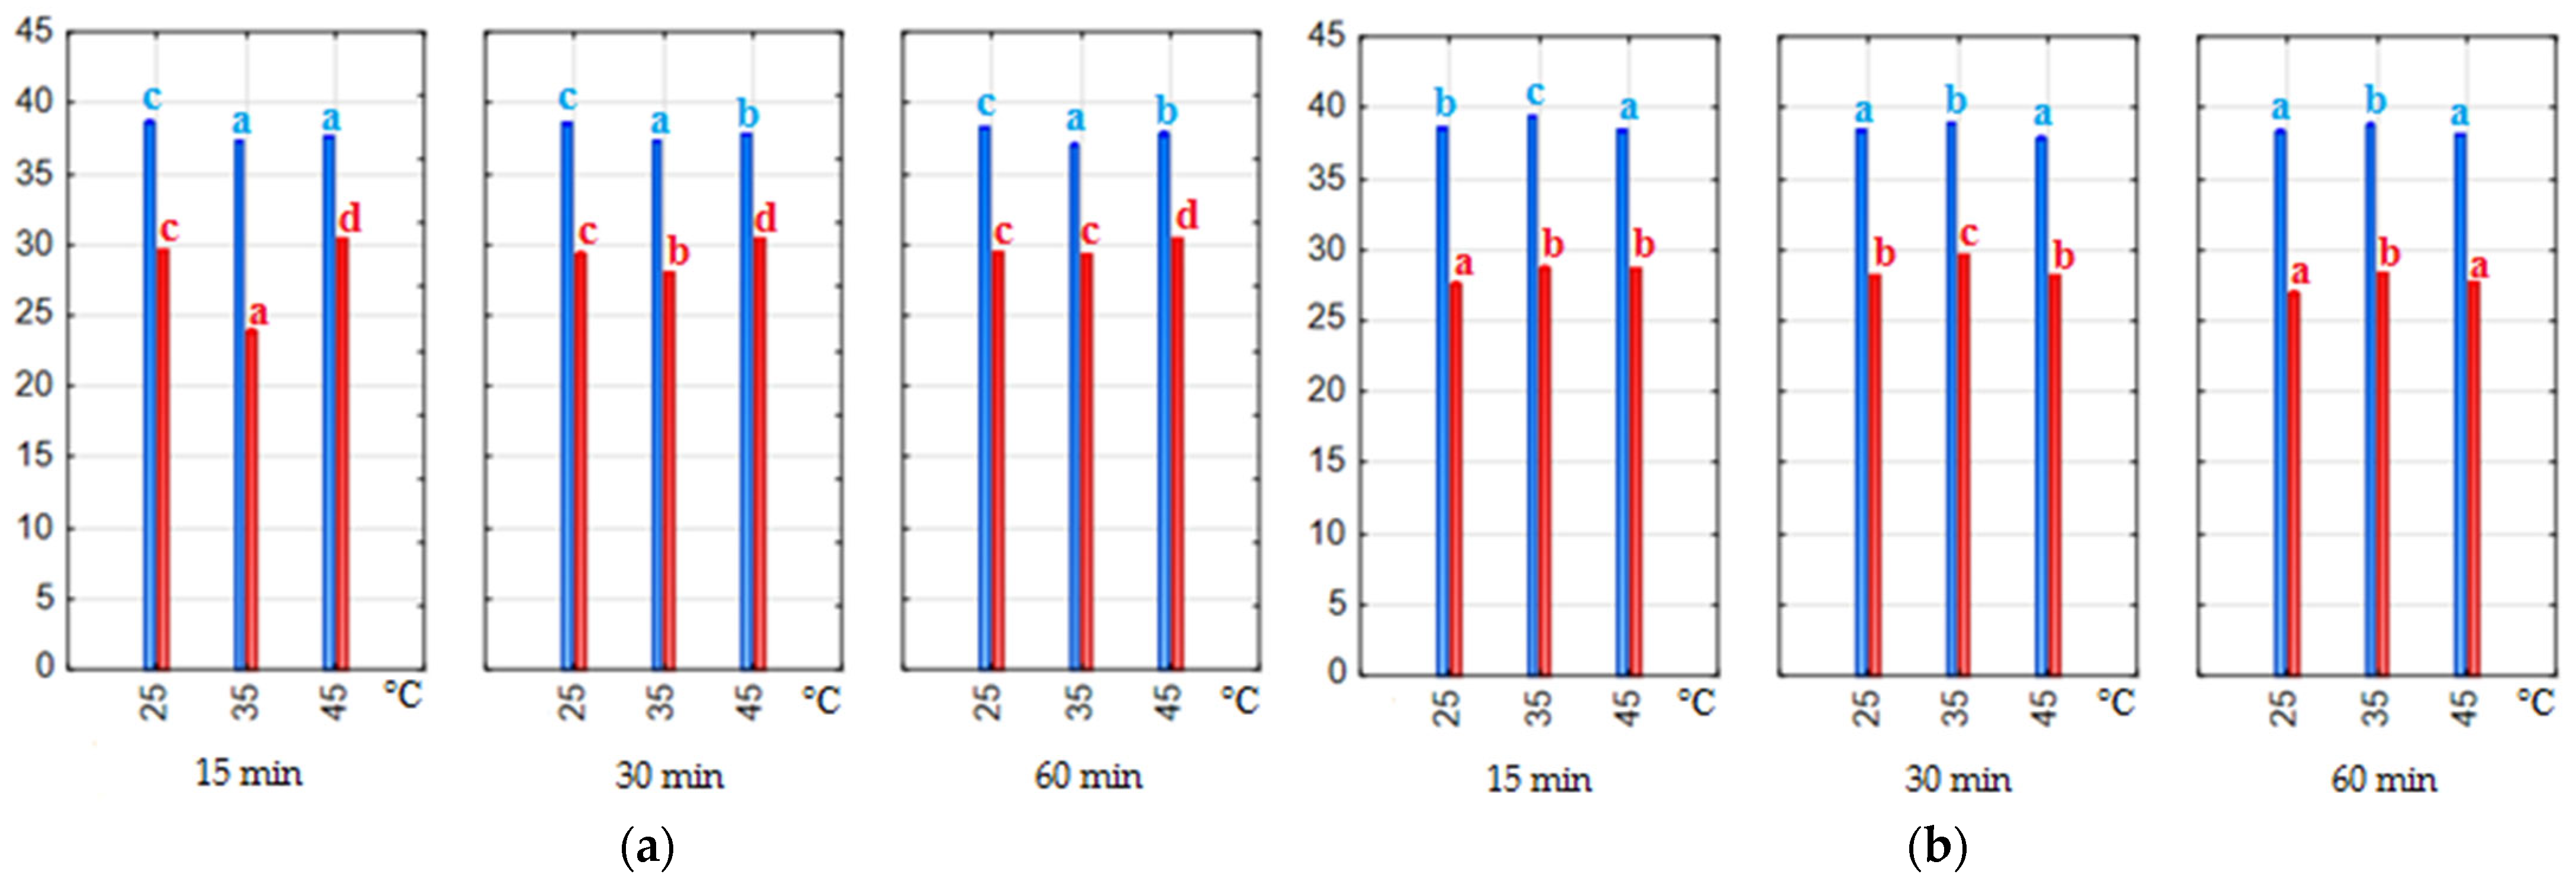
3.3. Color Parameters and Coloring Strength of Anthocyanin Extracts

The value of the lightness (L*) for extracts prepared with the water–ethanol solvent ranged from 29.1 to 31.3 (1:20) and from 11.3 to 18.0 (1:7). On the other hand, the L* value for extracts prepared using the water–citric acid was 28.5–30.9 (1:20) and 13.9–16.9 (1:7). The ratio of pomace to solvent had a significant effect (p < 0.05) on this parameter measured in the anthocyanin extracts obtained (Figure 2). As can be seen in Figure 2a,b, changing the ratio from 1:20 to 1:7 made the extracts about two times darker, regardless of the solvent used. The extraction time had no statistical significance (p > 0.05) on the L* parameter. Three temperature values were tested, and the darkest extracts were obtained at 35 °C and 45 °C. As might be expected, the L* of the extracts was inversely proportional to the anthocyanin. The higher the anthocyanin content, the lower the L* and the darker the color of the extracts. Pearson’s correlation coefficient between the measured values was −0.988 and −0.994 for water–ethanol and water–citric acid extracts, respectively.
The chroma (C*) parameter on the CIE L*a*b* scale determines color saturation, takes values from 0 (the center of the coordinate system), and increases along the radius of the circle. The ratio of pomace to solvent had a significant effect (p < 0.05) on the C* parameter of the extracts (Figure 3a,b). Extracts obtained with a ratio of 1:20 had higher chroma values. The type of solvent used also had an impact. Water–ethanol solvent had higher C* values. The extracts with high C* values were recognized as clearer, brighter or more brilliant, while dull or dark pastel colors had extracts with a low C* value. The extraction time significantly (p < 0.05) influenced the color saturation of the extracts. In the case of the water–ethanol solvent, samples had the most saturated color after 15 min, while the water–citric acid samples reached the highest saturation after 60 min of extraction. The highest values of C* were achieved by extracts obtained at a process temperature of 25 °C and 35 °C. Correlation analysis showed a strong relationship between anthocyanin content and color saturation (−0.991 and −0.995 for water–ethanol and water–citric acid extracts, respectively). The higher the anthocyanin concentration, the duller/more pastel the color of the extracts.
The parameter h° defines the hue of the color. It is defined by degrees of the angle starting from the positive side of the a*-axis and proceeding counterclockwise on a circle, and forming the following ranges: from 0° red, through 90° yellow, 180° green, 270° blue to 360° red. The hue h° of the water–ethanol extracts ranged from 37.1 to 38.7 (1:20) and from 23.9 to 30.4 (1:7). However, the h° value of water–citric acid extracts was 37.9–39.4 (1:20) and 26.9–28.7 (1:7). Therefore, all extracts were in the hue zone of the red color. The structure of anthocyanins strongly depends on the pH of the matrix, and all extracts had a pH in the range of 1.5–2.6, where anthocyanins are present in the form of red flavylium cations. In addition, the value of the parameter h° was affected (p < 0.05) by the ratio of pomace to solvent (Figure 4a,b). Extracts obtained with a ratio of 1:7 had a more intense red hue due to the higher anthocyanin content. Statistical tests showed that if the extraction time and temperature increased, the hue value was also higher (p < 0.05). For this color parameter, Pearson’s correlation test also showed a very strong relationship with the anthocyanin content of the extracts (−0.997 and −0.993 for water–ethanol and water–citric acid extracts, respectively).
Studies by other researchers have shown that UAE parameters and solvent characteristics have a strong influence on the color of pomace extracts. Asman et al. [20] reported that as pH increased, the values of C* and h° also increased. Acidified water extracts at low pH (1.5–2.0) had lower purity and darker color. The extraction process at 30 °C was better than that at 50 °C in terms of the coloring properties of the extracts, as higher values of a* were found to result in higher chroma values [14]. This is in line with the results of our research. In another study, the longer exposure time of pomace to ultrasound during extraction led to higher L* values of the extracts [21]. All samples obtained from UAE had a chroma between 35.9 and 42.7, meaning that the grape pomace extracts had 2–3 times better color saturation than our blackcurrant extracts. However, completely different extraction parameters and materials have been used. It should be noted that the varieties of a given plant influence the profile of anthocyanins in the fruit, which consequently translates into the composition of these substances in the extracts and their coloring properties. This was demonstrated by Gordillo et al. [35] on the example of extracts obtained from different grape cultivars.
E1% coloring strength is one of the main characteristics of colorants used in food. Food manufacturers are interested not only in the color parameters of the extract or concentrate but also in the level of coloring power of the product. E1% determines the use of the right amount of coloring to achieve the desired color properties.
The amount of pomace in the extraction solution significantly (p < 0.05) influenced the coloring strength of the extracts. E1% values were 2–3 times higher for a material-to-solvent ratio of 1:7 than for 1:20 (Figure 5). The type of solvent also significantly (p < 0.05) affected the coloring strength. Extracts obtained with water–citric acid solvent had higher and more uniform absorbance at λ = 520 nm. However, the highest absorbance was measured in two water–ethanol extracts obtained after 15 and 30 min of extraction at 35 °C. These were the extracts with the highest anthocyanin content determined. In general, the highest E1% values were obtained at 35 °C in our experiment, but as the extraction time increased, the values decreased, suggesting that the extraction process should not be extended to 60 min. This phenomenon was most evident in the water–ethanol extracts.
The industry uses natural colorings when they have strong coloring power. Rather, our extracts should be considered strong dyes, especially since the E1% parameter was measured before the targeted concentration and purification processes.

3.4. pH of Anthocyanin Extracts

During the experiments, the pH of the solvents and final extracts was closely monitored to study the effect of extraction parameters on this parameter. The pH value of the water–ethanol extracts ranged from 1.5 to 2.6, while for water–citric acid extracts, it ranged from 1.5 to 1.9 (Table 3). Statistical analysis showed a significant (p < 0.05) effect of material/solvent ratio on the pH value of the extracts, where for the water–ethanol solvent, the increase in pH was most pronounced. This is due to an increase in the concentration of dissolved compounds in the solution and, thus, a decrease in the buffering capacity of the solvent. However, it should be noted that the water–citric acid solvent had a better buffering capacity. Extraction temperature was significant (p < 0.05) only for the material/solvent ratio of 1:7 (the highest pH values were observed at 25 °C and 45 °C). As for extraction time, it was only significant (p < 0.05) in combination with the 1:7 material/solvent ratio, water–ethanol solvent and extraction temperatures of 35 °C and 45 °C. The 30 and 60 min of the UAE process, combined with the increased temperature, allowed more substances to be extracted [36].
An increase in the pH value of water acidified with acetic acid at the end of the extraction of anthocyanins from blackcurrant pomace was also observed by Azman et al. [20]. However, the pH of the extracts increased from 1.5 to 1.92, a value similar to that found by us only for the water–citric acid solvent with a material/solvent ratio of 1:7.
The pH of the pigment solutions, such as anthocyanins obtained in this study, is important for their use in food applications. The pH primarily determines the color of anthocyanins. In a strongly acidic environment, at pH < 3, only the flavylium cation is present, which gives a red color [37]. The intense red color of the pigments is most desired by food manufacturers, so it is necessary to ensure that at the end of pomace extraction, the pH is below 3.

4. Conclusions

Our experiments showed that strongly acidified solvents (pH 1.5) allow high extraction yields using ultrasound-assisted extraction (UAE). The best solvent for the UAE of anthocyanins from freeze-dried blackcurrant pomace was a mixture of water and ethanol (50/50 v/v) acidified with HCl. The most favorable and efficient extraction parameters combined with the water–ethanol solvent were a material/solvent ratio of 1:7, a temperature of 35 °C, and a time of 15 min. Increasing the amount of solvent or raising the process temperature did not lead to an improvement in the extraction efficiency.
A strong relationship (r > 0.991) was also found between anthocyanin content and color saturation or hue in the obtained extracts. Based on the E1% coloring strength results, all the extracts obtained can be considered strong colorants, especially those obtained with the water–citric acid solvent. Decreasing the ratio of the mass of the pomace to the volume of the solvent resulted in a greater increase in pH during UAE. To obtain a strong red color, the pH of the extracts must be kept below 3 during the entire process.
Our study was limited to evaluating the effect of only one value of ultrasound frequency and intensity. Future research should focus on the impact of different ultrasound parameters on anthocyanin extraction yield.

Author Contributions

Conceptualization, B.K. and E.B.; methodology, B.K.; software, B.K.; validation, B.K.; formal analysis, B.K.; investigation, B.K. and E.B.; resources, B.K.; data curation, B.K.; writing—original draft preparation, B.K.; writing—review and editing, E.B.; visualization, B.K.; supervision, B.K.; project administration, B.K.; funding acquisition, B.K. All authors have read and agreed to the published version of the manuscript.

Funding

This research received no external funding.

Institutional Review Board Statement

Not applicable.

Informed Consent Statement

Not applicable.

Data Availability Statement

The data presented in this study are available in this study.

Acknowledgments

Research for this publication was conducted using research equipment purchased as part of the “Food and Nutrition Centre—modernisation of the WULS campus to create a Food and Nutrition Research and Development Centre (CŻiŻ)” co-financed by the European Union from the European Regional Development Fund under the Regional Operational Programme of the Mazowieckie Voivodeship for 2014-2020 (Project No. RPMA.01.01.00-14-8276/17).

Conflicts of Interest

The authors declare no conflicts of interest.

Appendix A

Figure A1. HPLC chromatogram of anthocyanins at a wavelength of 520 nm: 1—delphinidin-3-O-rutinoside, 2—cyanidin-3-O-rutinoside, 3—delphinidin-3-O-glucoside, 4—cyanidin-3-O-glucoside (extract 35 °C, 15 min, water–ethanol with HCl solvent).
Applsci 14 00821 g0a1
Table A1. Results of statistical analysis for the interaction of two factors on the content of total anthocyanins in extracts.
FactorDegrees of FreedomSSMSFp-Value
Water–ethanol with HCl solvent
Temperature23275.01637.5882.8<0.05
Time2791.2395.6213.3<0.05
Temperature with Time4652.1163.087.9<0.05
Water–citric acid solvent
Temperature254.527.324.7<0.05
Time217.28.67.8<0.05
Temperature with Time419.44.84.4<0.05
Table A2. The interaction of extraction time and temperature on the content of total anthocyanins in water–ethanol with HCl extracts.
Temperature (°C)Time
(min)
Homogeneous Groups
1234567
4560 x
4530x x
4515xx
2560xx
2530 x x
2515 x
3560 x
3530 x
3515 x
Table A3. The interaction of extraction time and temperature on the content of total anthocyanins in water–citric acid extracts.
Temperature (°C)Time
(min)
Homogeneous Groups
1234
3515x
3530x
3560xx
2560xxx
4560xxx
2515 xx
2530 xx
4515 xx
4530 x

References

  1. Jurevičiūte, I.; Keršiene, M.; Bašinskiene, L.; Leskauskaite, D.; Jasutiene, I. Characterization of Berry Pomace Powders as Dietary Fiber-Rich. Foods 2022, 11, 716. [Google Scholar] [CrossRef] [PubMed]
  2. Struck, S.; Plaza, M.; Turner, C.; Rohm, H. Berry pomace—A review of processing and chemical analysis of its polyphenols. Int. J. Food Sci. Technol. 2016, 51, 1305–1318. [Google Scholar] [CrossRef]
  3. Giuffrè, A.M.; Capocasale, M.; Zappia, C. Tomato seed oil for edible use: Cold break, hot break, and harvest year effects. J. Food Process. Preserv. 2017, 41, e13309. [Google Scholar] [CrossRef]
  4. Fidriyanto, R.; Singh, B.P.; Manju, K.M.; Widyastuti, Y.; Goel, G. Multivariate analysis of structural and functional properties of fibres from apple pomace using different extraction methods. Food Prod. Process. Nutr. 2023, 5, 6. [Google Scholar] [CrossRef]
  5. Kidoń, M.; Marciszak, E.; Uğur, Ş.; Kuligowski, M.; Radziejewska-Kubzdela, E. Chokeberry Pomace Utilization for Improving Selected Quality Parameters of Green Tea Leaves or Hibiscus Flower Infusions. Appl. Sci. 2023, 13, 8186. [Google Scholar] [CrossRef]
  6. Mäkilä, L.; Laaksonen, O.; Ramos Diaz, J.M.; Vahvaselkä, M.; Myllymäki, O.; Lehtomäki, I.; Laakso, S.; Jahreis, G.; Jouppila, K.; Larmo, P.; et al. Exploiting blackcurrant juice press residue in extruded snacks. LWT 2014, 57, 618–627. [Google Scholar] [CrossRef]
  7. Magyar, M.; da Costa Sousa, L.; Jin, M.; Sarks, C.; Balan, V. Conversion of apple pomace waste to ethanol at industrial relevant conditions. Appl. Microbiol. Biotechnol. 2016, 100, 7349–7358. [Google Scholar] [CrossRef]
  8. Ampese, L.C.; Sganzerla, W.G.; Di Domenico Ziero, H.; Costa, J.M.; Martins, G.; Forster-Carneiro, T. Valorization of apple pomace for biogas production: A leading anaerobic biorefinery approach for a circular bioeconomy. Biomass Convers. Biorefin. 2022. [Google Scholar] [CrossRef]
  9. Ali, S.R.; Anwar, Z.; Irshad, M.; Mukhtar, S.; Warraich, N.T. Bio-synthesis of citric acid from single and co-culture-based fermentation technology using agro-wastes. J. Radiat. Res. Appl. Sci. 2016, 9, 57–62. [Google Scholar] [CrossRef]
  10. Maleki, H.; Barani, H. Extraction and antibacterial activity of Pulicaria gnaphalodes as a natural colorant: Characterization and application on wool fibers. Prog. Color Color. Coat. 2019, 12, 145–154. [Google Scholar]
  11. Cortez, R.E.; Gonzalez de Mejia, E. Blackcurrants (Ribes nigrum): A Review on Chemistry, Processing, and Health Benefits. J. Food Sci. 2019, 84, 2387–2401. [Google Scholar] [CrossRef] [PubMed]
  12. Mattila, P.H.; Hellström, J.; Karhu, S.; Pihlava, J.M.; Veteläinen, M. High variability in flavonoid contents and composition between different North-European currant (Ribes spp.) varieties. Food Chem. 2016, 204, 14–20. [Google Scholar] [CrossRef]
  13. Ejaz, A.; Waliat, S.; Afzaal, M.; Saeed, F.; Ahmad, A.; Din, A.; Ateeq, H.; Asghar, A.; Shah, Y.A.; Rafi, A.; et al. Biological activities, therapeutic potential, and pharmacological aspects of blackcurrants (Ribes nigrum L): A comprehensive review. Food Sci. Nutr. 2023, 11, 5799–5817. [Google Scholar] [CrossRef] [PubMed]
  14. Azman, E.M.; Charalampopoulos, D.; Chatzifragkou, A. Acetic acid buffer as extraction medium for free and bound phenolics from dried blackcurrant (Ribes nigrum L.) skins. J. Food Sci. 2020, 85, 3745–3755. [Google Scholar] [CrossRef]
  15. Kumar, K.; Srivastav, S.; Sharanagat, V.S. Ultrasound assisted extraction (UAE) of bioactive compounds from fruit and vegetable processing by-products: A review. Ultrason. Sonochem. 2021, 70, 105325. [Google Scholar] [CrossRef] [PubMed]
  16. José Aliaño González, M.; Carrera, C.; Barbero, G.F.; Palma, M. A comparison study between ultrasound–assisted and enzyme–assisted extraction of anthocyanins from blackcurrant (Ribes nigrum L.). Food Chem. X 2022, 13, 100192. [Google Scholar] [CrossRef]
  17. Zargoosh, Z.; Ghavam, M.; Bacchetta, G.; Tavili, A. Effects of ecological factors on the antioxidant potential and total phenol content of Scrophularia striata Boiss. Sci. Rep. 2019, 9, 16021. [Google Scholar] [CrossRef]
  18. Moradi, H.; Ghavam, M.; Tavili, A. Study of antioxidant activity and some herbal compounds of Dracocephalum kotschyi Boiss. in different ages of growth. Biotechnol. Rep. 2020, 25, e00408. [Google Scholar] [CrossRef]
  19. Linares, G.; Rojas, M.L. Ultrasound-Assisted Extraction of Natural Pigments From Food Processing By-Products: A Review. Front. Nutr. 2022, 9, 891462. [Google Scholar] [CrossRef]
  20. Azman, E.M.; Nor, N.D.M.; Charalampopoulos, D.; Chatzifragkou, A. Effect of acidified water on phenolic profile and antioxidant activity of dried blackcurrant (Ribes nigrum L.) pomace extracts. LWT 2022, 154, 112733. [Google Scholar] [CrossRef]
  21. Da Rocha, C.B.; Noreña, C.P.Z. Microwave-Assisted Extraction and Ultrasound-Assisted Extraction of Bioactive Compounds from Grape Pomace. Int. J. Food Eng. 2020, 16, 20190191. [Google Scholar] [CrossRef]
  22. Rodrigues, S.; Fernandes, F.A.N.; de Brito, E.S.; Sousa, A.D.; Narain, N. Ultrasound extraction of phenolics and anthocyanins from jabuticaba peel. Ind. Crops Prod. 2015, 69, 400–407. [Google Scholar] [CrossRef]
  23. Domínguez-Rodríguez, G.; Marina, M.L.; Plaza, M. Enzyme-assisted extraction of bioactive non-extractable polyphenols from sweet cherry (Prunus avium L.) pomace. Food Chem. 2021, 339, 128086. [Google Scholar] [CrossRef] [PubMed]
  24. Basegmez, H.I.O.; Povilaitis, D.; Kitrytė, V.; Kraujalienė, V.; Šulniūtė, V.; Alasalvar, C.; Venskutonis, P.R. Biorefining of blackcurrant pomace into high value functional ingredients using supercritical CO2, pressurized liquid and enzyme assisted extractions. J. Supercrit. Fluids 2017, 124, 10–19. [Google Scholar] [CrossRef]
  25. Gagneten, M.; Leiva, G.; Salvatori, D.; Schebor, C.; Olaiz, N. Optimization of Pulsed Electric Field Treatment for the Extraction of Bioactive Compounds from Blackcurrant. Food Bioprocess Technol. 2019, 12, 1102–1109. [Google Scholar] [CrossRef]
  26. Official Methods of Analysis of AOAC International, 22nd ed.; Official Method 920.152 Protein in Fruit Products Kjeldahl Method; AOAC International: Rockville, MD, USA, 2023.
  27. Kruszewski, B.; Zawada, K.; Karpiński, P. Impact of High-Pressure Homogenization Parameters on Physicochemical Characteristics, Bioactive Compounds Content, and Antioxidant Capacity of Blackcurrant Juice. Molecules 2021, 26, 1802. [Google Scholar] [CrossRef]
  28. Goiffon, J.P.; Mouly, P.P.; Gaydou, E.M. Anthocyanic pigment determination in red fruit juices, concentrated juices and syrups using liquid chromatography. Anal. Chim. Acta 1999, 382, 39–50. [Google Scholar] [CrossRef]
  29. Reißner, A.M.; Al-Hamimi, S.; Quiles, A.; Schmidt, C.; Struck, S.; Hernando, I.; Turner, C.; Rohm, H. Composition and physicochemical properties of dried berry pomace. J. Sci. Food Agric. 2019, 99, 1284–1293. [Google Scholar] [CrossRef]
  30. Sójka, M.; Król, B. Composition of industrial seedless black currant pomace. Eur. Food Res. Technol. 2009, 228, 597–605. [Google Scholar] [CrossRef]
  31. Ali Redha, A.; Anusha Siddiqui, S.; Zare, R.; Spadaccini, D.; Guazzotti, S.; Feng, X.; Bahmid, N.A.; Wu, Y.S.; Ozeer, F.Z.; Aluko, R.E. Blackcurrants: A Nutrient-Rich Source for the Development of Functional Foods for Improved Athletic Performance. Food Rev. Int. 2022. [Google Scholar] [CrossRef]
  32. Šimerdová, B.; Bobríková, M.; Lhotská, I.; Kaplan, J.; Křenová, A.; Šatínský, D. Evaluation of anthocyanin profiles in various blackcurrant cultivars over a three-year period using a fast hplc-dad method. Foods 2021, 10, 1745. [Google Scholar] [CrossRef] [PubMed]
  33. Maran, J.P.; Priya, B.; Al-Dhabi, N.A.; Ponmurugan, K.; Moorthy, I.G.; Sivarajasekar, N. Ultrasound assisted citric acid mediated pectin extraction from industrial waste of Musa balbisiana. Ultrason. Sonochem. 2017, 35, 204–209. [Google Scholar] [CrossRef] [PubMed]
  34. Al-Dhabi, N.A.; Ponmurugan, K.; Maran Jeganathan, P. Development and validation of ultrasound-assisted solid-liquid extraction of phenolic compounds from waste spent coffee grounds. Ultrason. Sonochem. 2017, 34, 206–213. [Google Scholar] [CrossRef] [PubMed]
  35. Gordillo, B.; Sigurdson, G.T.; Lao, F.; González-Miret, M.L.; Heredia, F.J.; Giusti, M.M. Assessment of the color modulation and stability of naturally copigmented anthocyanin-grape colorants with different levels of purification. Food Res. Int. 2018, 106, 791–799. [Google Scholar] [CrossRef]
  36. Tsao, R. Chemistry and biochemistry of dietary polyphenols. Nutrients 2010, 2, 1231–1246. [Google Scholar] [CrossRef]
  37. Pina, F.; Oliveira, J.; De Freitas, V. Anthocyanins and derivatives are more than flavylium cations. Tetrahedron 2015, 71, 3107–3114. [Google Scholar] [CrossRef]
Figure 1. An example of the spectrum obtained in the wavelength range of 400–600 nm for extracts obtained from blackcurrant pomace. λmax = 520 nm.
Applsci 14 00821 g001
Figure 2. Lightness (L*) (a,b) of the extracts. Blue bars—material/solvent ratio 1:20, red bars—material/solvent ratio 1:7; (a) extracts obtained with water–ethanol (50/50 v/v) solvent; (b) extracts obtained with water–citric acid solvent. The values with different letters within the same color are significantly different (p < 0.05).
Applsci 14 00821 g002
Figure 3. Chroma (C*) (a,b) of the extracts. Blue bars—material/solvent ratio 1:20, red bars—material/solvent ratio 1:7; (a) extracts obtained with water–ethanol (50/50 v/v) solvent; (b) extracts obtained with water–citric acid solvent. The values with different letters within the same color are significantly different (p < 0.05).
Applsci 14 00821 g003
Figure 4. Hue (h°) (a,b) of the extracts. Blue bars—material/solvent ratio 1:20, red bars—material/solvent ratio 1:7; (a) extracts obtained with water–ethanol (50/50 v/v) solvent; (b) extracts obtained with water–citric acid solvent. The values with different letters within the same color are significantly different (p < 0.05).
Applsci 14 00821 g004
Figure 5. Coloring strength (E1%—values of absorptivity at λ = 520 nm). Blue bars—material/solvent ratio 1:20, red bars—material/solvent ratio 1:7; (a) extracts obtained with water–ethanol (50/50 v/v) solvent; (b) extracts obtained with water–citric acid solvent. The values with different letters within the same color are significantly different (p < 0.05).
Applsci 14 00821 g005
Table 1. Characteristics of the studied blackcurrant pomace.
Moisture content (%)57.3 ± 0.4
Water activity (aw)0.977
Protein content (% in f.w.)5.2 ± 0.3
L*42.26 ± 0.08
C*14.36 ± 0.28
5.49 ± 0.13
Total anthocyanin content (mg/100 g f.w.)853.2 ± 48.7
Content of individual anthocyanins (mg/100 g f.w.):
delphinidin-3-O-glucoside200.2 ± 10.5
delphinidin-3-O-rutinoside387.9 ± 23.3
cyanidin-3-O-glucoside59.4 ± 5.2
cyanidin-3-O-rutinoside205.7 ± 9.7
f.w.—fresh weight.
Table 2. Total anthocyanins content in obtained extracts and extraction yield.
Material/Solvent RatioTime
(min)
Temperature (°C)Water–Ethanol with HCl SolventWater–Citric Acid Solvent
Average Values (mg/100 mL)Extraction Yield (%)Average Values
(mg/100 mL)
Extraction Yield (%)
1:20 *152580.7 ± 3.6 b8079.1 ± 1.4 b79
3074.7 ± 3.5 a7480.3 ± 0.4 b80
6073.9 ± 1.4 a7476.6 ± 1.2 a76
153591.2 ± 2.3 c9172.5 ± 2.3 a72
3091.0 ± 2.4 c9175.0 ± 1.8 a75
6093.0 ± 3.2 c9376.2 ± 3.8 ab76
154575.7 ± 1.0 a7580.6 ± 0.3 b80
3077.5 ± 2.3 ab7781.9 ± 1.5 b82
6071.4 ± 1.2 a7179.0 ± 1.2 b79
1:7 **1525254 ± 7.1 b85198 ± 1.5 b66
30248 ± 3.5 ab83196 ± 4.7 ab66
60244 ± 5.4 ab82190 ± 4.8 a64
1535277 ± 5.4 c93189 ± 5.0 a63
30267 ± 4.6 c89188 ± 6.6 a63
60258 ± 7.9 b86188 ± 2.1 a63
1545258 ± 6.6 b86205 ± 3.4 b68
30230 ± 9.5 a77195 ± 4.2 ab65
60221 ± 3.0 a74190 ± 6.1 a64
* for material/solvent ratio 1:20, the maximum total anthocyanins content indicating 100% extraction yield is 100.9 mg/100 mL; ** for material/solvent ratio 1:7, the maximum total anthocyanins content indicating 100% extraction yield is 298.7 mg/100 mL; The values in the same column (for specific material/solvent ratio) with different letters are significantly different (p < 0.05).
Table 3. pH values of the extracts.
Material/Solvent RatioTime (min)Temperature (°C)Solvent
Water–Ethanol with HClWater–Citric Acid
1:2015251.6 ± 0.1 a1.7 ± 0.1 a
301.6 ± 0.0 a1.7 ± 0.0 a
601.5 ± 0.1 a1.7 ± 0.1 a
15351.5 ± 0.1 a1.7 ± 0.0 a
301.5 ± 0.0 a1.6 ± 0.1 a
601.5 ± 0.1 a1.5 ± 0.1 a
15451.6 ± 0.1 a1.6 ± 0.1 a
301.6 ± 0.1 a1.5 ± 0.1 a
601.6 ± 0.1 a1.6 ± 0.1 a
1:715252.2 ± 0.1 a1.8 ± 0.1 a
302.3 ± 0.1 a1.9 ± 0.1 a
602.3 ± 0.1 a1.9 ± 0.0 a
15352.3 ± 0.1 a1.8 ± 0.1 a
302.6 ± 0.1 b1.8 ± 0.2 a
602.6 ± 0.1 b1.9 ± 0.1 a
15452.2 ± 0.1 a1.8 ± 0.1 a
302.5 ± 0.0 b1.8 ± 0.1 a
602.5 ± 0.1 b1.8 ± 0.1 a
The values in the same column (for specific material/solvent ratio) with different letters are significantly different (p < 0.05).
Disclaimer/Publisher’s Note: The statements, opinions and data contained in all publications are solely those of the individual author(s) and contributor(s) and not of MDPI and/or the editor(s). MDPI and/or the editor(s) disclaim responsibility for any injury to people or property resulting from any ideas, methods, instructions or products referred to in the content.

