Abstract
COVID-19 is an infectious disease that has greatly affected worldwide healthcare systems, due to the high number of cases and deaths. As COVID-19 patients may develop cardiac comorbidities that can be potentially fatal, electrocardiographic monitoring can be crucial. This work aims to identify electrocardiographic and vectorcardiographic patterns that may be related to mortality in COVID-19, with the application of the Advanced Repeated Structuring and Learning Procedure (AdvRS&LP). The procedure was applied to data from the “automatic computation of cardiovascular arrhythmic risk from electrocardiographic data of COVID-19 patients” (COVIDSQUARED) project to obtain neural networks (NNs) that, through 254 electrocardiographic and vectorcardiographic features, could discriminate between COVID-19 survivors and deaths. The NNs were validated by a five-fold cross-validation procedure and assessed in terms of the area under the curve (AUC) of the receiver operating characteristic. The features’ contribution to the classification was evaluated through the Local-Interpretable Model-Agnostic Explanations (LIME) algorithm. The obtained NNs properly discriminated between COVID-19 survivors and deaths (AUC = 84.31 ± 2.58% on hold-out testing datasets); the classification was mainly affected by the electrocardiographic-interval-related features, thus suggesting that changes in the duration of cardiac electrical activity might be related to mortality in COVID-19 cases.
1. Introduction
COVID-19 is an infectious disease caused by the SARS-CoV-2 virus, which has greatly affected healthcare systems on a worldwide level due to its high transmission rate and health consequences [1]. As of 25 October 2023, there had been more than 700 million cases since the beginning of the pandemic [1]. Among these cases, the virus has manifested in different manners, as infected people have experienced mild to severe symptoms related to the respiratory system [2,3]. Severe manifestations of COVID-19 can require hospitalization in intensive care units [2,3] and may also be lethal, as proven by the great number of deaths (773,819,856 from the beginning of the pandemic until the time of writing) [1], especially in elderly groups and/or in subjects with preexisting conditions like, for example, overweight. Even when not requiring hospitalization, COVID-19 infection often contributes to the worsening of an already unstable health status [1].
It has also been observed that COVID-19 may lead to manifestations in biological systems other than the respiratory system. Some of the most common manifestations of COVID-19 outside the respiratory system arise at the cardiac level, for example, arrhythmias, bundle branch blocks, acute coronary syndrome, myocarditis, and heart failure [4,5,6,7,8,9,10,11,12,13]. As cardiac complications are prevalent among COVID-19 patients and have been observed in more than 50% of COVID-19 deaths [5,6], timely identification by cardiac monitoring is essential. A common form of cardiac screening is the standard 10-second 12-lead electrocardiogram (ECG, Figure 1a), which, together with the vectorcardiogram (VCG, Figure 1b), can be used to identify the presence of cardiac abnormalities. Usually, ECG and VCG analyses are automatically performed, and cardiologists combine their interpretation with patients’ anamnesis. However, interpretation is highly dependent on cardiologists’ experience and can be affected by limitations in the data or intra-subject and intra-rater variability [14,15,16].
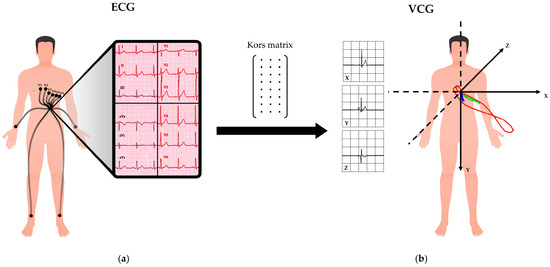
Figure 1.
Representation of ECG and VCG: (a) the 12-lead ECG is acquired through electrodes; (b) the VCG is obtained from the ECG through the Kors matrix transformation.
In the context of the detection and investigation of cardiac risk associated with COVID-19, the use of machine learning and deep learning methods has already been largely investigated [17,18,19,20,21,22]. The methods proposed in [17,18,19,20,21,22] showed good accuracy, ranging from 85% to 100%, in detecting cardiovascular changes that may be related to COVID-19. However, complex deep learning models, such as convolutional neural networks (CNN), are not easily interpretable due to their nature (being black boxes). The non-explainability of the reasoning behind these complex models causes a lack of trust among clinicians and, thus, hampers their usage in clinical practice as diagnostic methods.
Sbrollini et al. [23,24] proposed a new machine learning method, called the Repeated Structuring & Learning Procedure (RS&LP), and tested it to detect heart failure, ischemia, and atrial fibrillation, with promising results. This method allows the construction of supervised neural networks (NNs) that were created by considering features as inputs and proved to be more interpretable than other deep learning models, which consider entire signals as inputs. The recent application of an advanced version of the RS&LP, namely Advanced Repeated Structuring & Learning Procedure (AdvRS&LP), for myocardial ischemia detection has seen further improvements in terms of NN performance [25].
Considering the good results obtained, the current work aims to investigate the use of the novel AdvRS&LP for the identification of electrocardiographic and vectorcardiographic patterns related to mortality with COVID-19. With this aim, the presented paper contributed to revealing the hidden electrocardiographic and vectorcardiographic patterns related to mortality with COVID-19, assessing the reliability of NNs created by AdvRS&LP in electrocardiographic feature interpretation and investigating interpretable solutions to support clinical practice using AI-based methods.
2. Materials and Methods
2.1. Database
Data pertain to the database collected during the “automatic COmputation of cardioVascular arrhythmIc risk from ECG data of COVID-19 patients” (COVIDSQUARED) project [21]. This database is composed of 1123 ECGs (12 leads), acquired from 646 subjects (age range: 19–100 years) hospitalized due to COVID-19 symptoms at the Ospedale San Matteo in Pavia, Italy (from 7 June 2020 to 21 September 2021). For research purposes, COVIDSQUARED can be obtained for free by contacting the authors.
The review board of the Fondazione Policlinico San Matteo approved the publication of anonymized case series of COVID-19 patients using data collected for routine clinical practice and waived the requirement for specific informed consent. The ECGs were recorded with a sampling frequency of 500 Hz, had a duration of 10 s, and were acquired by the standard 12-lead ECG configuration (I, II, III, aVR, aVL, aVF, V1, V2, V3, V4, V5, V6). Survival of COVID-19 was assessed by follow-up, one year after hospitalization, using the Lombardy region death register (SISS). The database comprises multiple acquisitions for the same subject, obtained in different days; for each subject, only the ECG closest to hospitalization was included in this study. Moreover, ECGs that presented null leads were excluded. Subjects were divided into cases and controls: subjects that survived the infection were considered as controls, while subjects that died within one year after the infection were considered as cases. According to these criteria, 492 ECG recordings were classified as controls, and 148 ECG recordings were classified as cases.
2.2. Signal Pre-Processing and Feature Extraction
All computations were performed on MATLAB (Mathworks, version 2022a).
The ECG recordings included in the database were filtered with a digital bidirectional third-order Butterworth high-pass filter (cut-off frequency equal to 0.5 Hz) to reduce baseline wander. On lead I, R-peak positions were identified by the Pan–Tompkin’s algorithm [26] and considered as synchronization points for all heartbeats in all 12 ECG leads. For each ECG lead, synchronization points were used to select beat-related ECG segments spanning the time interval between 0.25 s before and 0.40·RR1/2 s after the synchronization point (where RR corresponds to the median RR interval in s) [24]. These ECG segments were used to compute 12 lead-dependent median ECG beats. Next, median VCG beats of the X, Y, and Z leads were computed by multiplying the median ECG beats of the 8 independent leads I, II, V1–V6, by using the Kors matrix [27,28,29]. From the median VCG components, the median vector magnitude signal was obtained.
The ECG landmarks were then identified in the 12 median ECG beats and in the vector-magnitude signal. These landmarks are the positions of the P-wave peak, QRS onset, R peak position, QRS offset (or J point), T-wave peak, and T-wave offset [24,30]. These landmarks in time plus the synchronization points were finally used to characterize each ECG recording by using the 254 features in Table 1, Table 2 and Table 3: 216 features (18 × 12 [features × leads], ID from f1 to f216 in Table 1) describe the morphological and temporal characteristics regarding 12-lead median ECG beats’ lead-dependent features; 16 features (ID from f217 to f232 in Table 2) are related to the global QT interval, global QRS duration, heart rate (HR), HR variability, and dispersion of the ECG temporal characteristics, that are variability among ECG leads’ lead-independent features; 22 features (ID from f233 to f254 in Table 3) are related to the median vector-magnitude signal. These 254 features are designed to represent the most clinically relevant morphological, spatial, and temporal information of 10-second 12-lead ECG signals.

Table 1.
Lead-dependent ECG features. The 18 features reported here, considered in all 12 leads for a total of 216 features, are related to morphological and temporal information of the ECG.
Table 2.
Lead-independent ECG features. The 14 features reported here are related to HR, HR variability, and ECG morphological dispersion.
Table 3.
VCG features. The 22 features here reported are related to the median vector magnitude.
2.3. Advanced Repeated Structuring and Learning Procedure
Extracted features are considered as inputs to an NN created with the Advanced Repeated Structuring and Learning Procedure (AdvRS&LP) [25], an enhanced version of the RS&LP algorithm by Sbrollini et al. [23,24], a procedure to create architecture specifically designed for the problem of interest. The AdvRS&LP (Figure 2) builds a supervised NN, starting by fixing a defined number of inputs (IN) and classification outputs (OUT). Next, the procedure iteratively allows a gradual structuring, which starts with 1 neuron in a single hidden layer. During each structuring phase (Figure 2, block 1), the current NN is extended in multiple new NNs thanks to the insertion of additional neurons (AD) in one of the existing hidden layers or in a new hidden layer. New AD neurons are initialized (Figure 2, block 2) with random weights and biases, which range between −1 and +1, and sigmoid activation function. The weights and biases of neurons that are already part of the current NN do not vary. Insertion of new AD neurons is considered successful if the performance of the extended NNs is greater than the performance of the current NN after a single learning step. If performance improvement does not occur, the addition of AD neurons is discarded. Successful new structures are then trained (Figure 2, block 3) by optimizing the loss function (mean squared error) using the scaled-conjugate-gradient algorithm [31], considering the early stopping criterion to prevent overfitting [32] and the inverse of class prevalence as input to counterbalance possible class disparities [33].
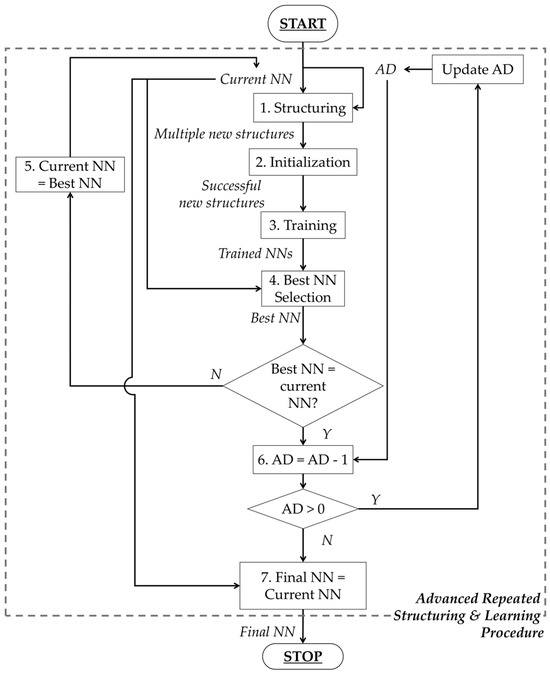
Figure 2.
Flow chart of the Advanced Repeated Structuring and Learning Procedure.
The performance of the new NN is evaluated and compared with the current NN, and the NN with the lowest error is considered the best NN (Figure 2, block 4). If the best NN is different from the current NN, the best NN becomes the new current NN, and the procedure restarts (Figure 2, block 5). By contrast, if the best NN corresponds to the current NN, the number of AD neurons is decreased by 1 (Figure 2, block 6), and the procedure restarts. Finally, the procedure concludes when the number of AD neurons becomes zero (Figure 2, block 7). More details about AdvRS&LP can be found in [25].
For this study, IN was equal to 254 (ECG/VCG features), OUT was equal to 2 (case and control classes), and AD was equal to 30. A 5-fold cross-validation procedure was employed [34]. The dataset was divided into 5 folds, of which 4 folds were used for creating the NN by AdvRS&LP, while the remaining fold was used as a hold-out testing dataset. The data division was performed by maintaining the case–control prevalence in all folds and without mixing patients in the training and hold-out testing datasets.
2.4. Deep Learning Interpretability Module
To investigate the contribution of each ECG/VCG feature to the classification by the NNs, the Local-Interpretable Model-Agnostic Explanations (LIME) algorithm [35,36,37] was applied. The LIME is an explainer algorithm that allows the interpretation of deep learning models’ decisions, taken for each observation in a dataset, by approximating the model with a local, interpretable, and much less complex model. Explanations come in the form of features ranked according to the amount of influence they had on classification. In practice, LIME was applied to locally approximate the NN with a linear model and to obtain feature rankings for each recording included in the database. Next, to obtain a general view of the ECG/VCG features’ contribution to classification, feature relevance (FR) was computed as the weighted average of the percentage of recordings presenting each feature in each ranking position. Consequently, 254 FR values, each associated with the corresponding ECG/VCG feature, were obtained. Features were then sorted according to FR values.
2.5. Statistics
The performance of the NNs created by AdvRS&LP was quantified by considering the architecture, by computing the area under the curve (AUC) of the receiver operating characteristic (ROC) and the accuracy (ACC) in training and validation datasets and the FR. Moreover, to compare deep learning analysis with standard statistical analysis, univariate AUC of the ROC was computed for each of the 254 ECG/VCG features. Features, as previously undertaken with FR, were sorted according to AUC values. Agreement between AUC and FR for each NN and between the FRs of the different NNs was assessed by computing Pearson’s correlation coefficient. Statistical significance was set at 0.05.
3. Results
The AdvRS&LP produced 5 NNs (one for each cross-validation fold), whose architectures and performance are listed in Table 4. Despite the different architectures, all the NNs presented high-level performances, comparable across folds, in the hold-out testing sets (AUC > 80% and ACC > 79%). The best NN, composed of 714 neurons distributed in three layers, was related to the second fold: the highest AUC on the validation dataset (AUC = 86.42% and ACC = 83.17%). The worst performance was obtained in the 4th fold (AUC = 80.89% and ACC = 79.21%).
Table 4.
Architecture and performance of the neural networks created by the Advanced Repeated Structuring and Learning Procedure.
Table 5 shows the first 10 features of the ranking obtained for the univariate AUC and FR computed for each NN created by AdvRS&LP, while Figure 3 depicts the scatter plots of the comparisons between the AUC and FR for each NN and between the FRs of the different NNs. The FRs obtained by all the folds presented a poor correlation with the univariate AUC (ρ < 0.30, p < 0.05), but the agreement between the FRs obtained in the different folds was statistically strong (ρ > 0.97, p < 0.05).
Table 5.
List of the first 10 features on the ranking obtained for univariate AUC and FR computed for each NN created by AdvRS&LP.
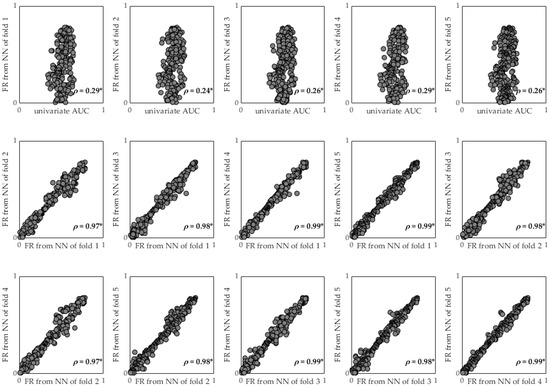
Figure 3.
Comparisons between AUC and FR for each NN and between the FRs of the different NNs. * refers to p-value lower than 0.05.
4. Discussion
This work aims to identify, with the application of the novel AdvRS&LP, electrocardiographic and vectorcardiographic patterns that may be related to mortality in subjects affected by COVID-19.
The definition of “death due to COVID-19” is still under discussion. Indeed, most of the subjects whose mortality is associated with COVID-19 are also affected by other, pre-existing diseases; thus, the infection aggravates an already compromised condition. For this reason, we considered the ECG acquisition closest to the hospitalization date, considering the infection active during the recording, and we defined cases as subjects that died within one year from the infection, assuming the deaths were correlated with COVID-19. Due to the limited size of the database, the selected ECG signals were all employed for the 5-fold cross-validation procedure. Although this procedure is widely accepted in the literature [17,18,20,21], the validation of the method in a testing holdout dataset would demonstrate the applicability of the method in a real-world application. Consequently, the classification results are purely indicative. Future studies will aim to demonstrate the reliability of the method in a real-world clinical scenario.
Despite these limitations, the NNs created through AdvRS&LP showed very promising classification capabilities, with a training AUC and ACC higher than 94% and 97%, respectively, and a validation AUC and ACC higher than 80% and 79%, respectively (Table 4). The AUC performed a little better than the ACC because the dataset was unbalanced (the number of controls was much larger than the number of cases). Considering the good performances, the application of AdvRS&LP for the identification of ECG/VCG patterns associated with mortality in COVID-19 patients seemed fitting.
The architectural structuring of the artificial NNs was accomplished using the novel AdvRS&LP algorithm [25], an enhanced version of RS&LP recently proposed by Sbrollini et al. [23,24]. Thanks to the removal of structural rules (previously included in RS&LP) and to a variable number of neurons to be added in each structuring step of the procedure, AdvRS&LP fosters the creation of NNs that adapt to the task for which they are needed, without compromising classification performance. Indeed, the architectures of the NNs obtained for the different folds are structurally different, since they are created with different data divisions, although they provide similar classification performances in both training (AUC = 97.38 ± 2.25% and ACC = 98.42 ± 1.17%) and hold-out testing (AUC = 84.31 ± 2.58% and ACC = 80.40 ± 1.77%).
Classifiers created by AdvRS&LP can take into account a number of inputs that correspond to the number of features included in the training dataset. In this work, 254 features that covered the clinically relevant morphological, spatial, and temporal information for the ECG/VCG signals were extracted from 10-second 12-lead ECG signals. The use of features, as in this work, rather than raw or processed signal sequences guarantees a certain level of interpretability in NN classification. We decided not to normalize the input features: this design choice will guarantee the interpretability of the features by clinical personnel, which allows comparisons with normality ranges. Moreover, we decided not to apply the preprocessing feature-selection method. During the training of the NN, the adjustment of weights and biases automatically selects the feature of interest, embedding the feature-selection procedure inside the NN construction. The complexity of deep learning models can hinder the uncovering of the decision process behind classification, which is, however, fundamental in a diagnostic context. Notably, no anamnestic or clinical features were considered as inputs for the NNs, with the aim of underlining hidden cardiac patterns associated with mortality with COVID-19.
To permit the interpretability of the NN created by AdvRS&LP, LIME was applied [35,36,37]. The use of LIME allowed the construction of a feature ranking, which highlighted the ECG/VCG features that most significantly affected the classification performed by the NNs and, therefore, the ECG/VCG features whose changes could be mainly associated with mortality in cases involving COVID-19. According to this analysis, HR and electrocardiographic intervals seem to be of relevance for classification, as features involving the mnNN, PT interval, and QT interval appeared in the top 10 on the FR ranking of all the NNs (Table 5), suggesting that changes in the duration of cardiac electrical activity might be related to mortality in COVID-19 cases. This finding is in agreement with the body of clinical research, which already revealed the modification of the QT interval [38], ST-T pattern [39,40,41], and PR interval [42] induced by COVID-19 infection. Notably, modifications to the QT interval are, indeed, often associated with a higher risk of developing arrhythmias or heart failure [2,43], both of which have been observed in COVID-19 patients [4,5,6,7,8,9,10,11,12,13]. The agreement between the FRs extracted from the different NNs (ρ > 0.97, Figure 2) suggests robust feature interpretation by LIME.
The rankings obtained from LIME and the conventional statistical analysis, with the latter usually evaluated by clinicians, showed disagreement (ρ < 0.30). This disagreement was surely due to the different approaches: while conventional ROC analysis is based on a linear separation boundary between samples by considering the role of each single variable regardless of possible interactions, NNs build highly nonlinear separation boundaries by considering all variables simultaneously during model training. The conventional statistical analysis gave relevance to the features related to repolarization and RR-interval variability, as evidenced by the top 10 on the univariate AUC ranking (Table 5). From a physiological perspective, a relationship between the RR interval and the QT interval cannot be denied, as changes in one lead to variations in the other [44]. Thus, future studies will be needed to investigate the correlation between QT and RR features exclusively.
In the context of the detection and investigation of cardiac risk associated with COVID-19, the use of machine learning and deep learning methods has already been investigated [17,18,19,20,21,22] (Table 6). All these studies are based on electrocardiography, but they differ in terms of the type of input: three papers [17,18,19] considered the ECG paper scan of the open access “ECG image dataset of Cardiac and COVID-19 patients” database [45], two studies [20,22] considered ECG signals collected on a private database, and one paper [21] considered ECG signals on the COVIDSQUARE database. Most of the papers [17,18,19,21] investigated the detection of COVID-19 among those with healthy status or other diseases, one study [23] assessed the severity of the COVID-19 infection, and Sridhar et al. [20] aimed to predict COVID-19-related mortality. All the studies applied CNN [17,18,19,20,21,22], which was validated by the k-fold cross-validation method [17,18,20,21], or static train/test data division. Regarding performance, methods that were designed to identify patients affected by COVID-19 presented very high levels of performance (accuracy higher than 85%) [17,18,19,21], and the method that was designed to predict COVID-19-related mortality presented a good performance (AUC equal to 60%) [20]. Finally, only two out of six papers applied post-processing algorithms for ECG interpretation, both of which were based on color maps [19,22]. Thus, in comparison with the literature, the method presented here is a unique approach that considers ECG features as NN inputs and includes an interpretability-post-processing algorithm (LIME) that is able to sort ECG features according to their importance to the classification performance. This design choice ensures the high level of acceptability of the AI-based method in a real clinical scenario. Indeed, the non-explainability typical of CNN causes a lack of trust among clinicians and, thus, hampers their usage in clinical practice as diagnostic methods. Finally, in comparison with the work of Sridhar et al. [20], our NN, created by using AdvRS&LP, provided a higher level of performance in detecting mortality correlated with COVID-19 after it was assessed with the same type of validation procedure, albeit on a different database.
Table 6.
Qualitative comparison with the literature.
5. Conclusions
The application of an NN-based algorithm combined with an interpretability approach highlighted features related to electrocardiographic intervals as those mainly affecting the classification performed by NNs trained on ECG signals from COVID-19 patients. This application highlighted the promising applicability of the neural networks created by Advanced Repeated Structuring and Learning Procedure in the clinical environment, supporting clinical personnel in the interpretation of the electrocardiographic patterns associated with a specific pathology.
Author Contributions
Conceptualization, A.S. and C.L.; methodology, A.S. and C.A.S.; software, C.L.; validation, A.S., C.L., M.M. and M.W.R.; formal analysis, A.S.; investigation, C.L.; resources, L.M., L.B. and R.S.; data curation, R.S.; writing—original draft preparation, A.S. and C.L.; writing—review and editing, A.S., C.L., M.M., M.W.R., C.A.S., L.M., L.B. and R.S.; visualization, A.S. and C.L.; supervision, C.A.S., L.M., L.B. and R.S.; project administration, L.B. and R.S.; funding acquisition, M.M. and L.B. All authors have read and agreed to the published version of the manuscript.
Funding
This research received no external funding.
Institutional Review Board Statement
The review board of the Fondazione Policlinico San Matteo approved the publication of an anonymized case series of COVID-19 patients using data collected for routine clinical practice and waived the requirement for specific informed consent.
Informed Consent Statement
Not applicable.
Data Availability Statement
For research purposes, COVIDSQUARED can be obtained for free by contacting the authors.
Acknowledgments
R.S., L.M. and M.W.R. acknowledge support from the Italian Ministry of University and Research through the project “COVIDSQUARED—automatic COmputation of cardioVascular arrhythmIc risk from ECG data of COVID-19 patients” (FISR2020IP_01990), call “FISR 2020 COVID—Fase I”.
Conflicts of Interest
The authors declare no conflicts of interest.
References
- World Health Organization (WHO). Coronavirus (COVID-19) Dashboard. Available online: https://covid19.who.int/ (accessed on 26 October 2023).
- Habas, K.; Nganwuchu, C.; Shahzad, F.; Gopalan, R.; Haque, M.; Rahman, S.; Majumder, A.A.; Nasim, T. Resolution of coronavirus disease 2019 (COVID-19). Expert Rev. Anti Infect. Ther. 2020, 18, 1201–1211. [Google Scholar] [CrossRef]
- Mohamadian, M.; Chiti, H.; Shoghli, A.; Biglari, S.; Parsamanesh, N.; Esmaeilzadeh, A. COVID-19: Virology, biology and novel laboratory diagnosis. J. Gene Med. 2021, 23, e3303. [Google Scholar] [CrossRef] [PubMed]
- Liu, Y.; Wu, S.; Qin, M.; Jiang, W.; Liu, X. Prevalence of Cardiovascular Comorbidities in Coronavirus Disease 2019, Severe Acute Respiratory Syndrome, and Middle East Respiratory Syndrome: Pooled Analysis of Published Data. J. Am. Heart Assoc. 2020, 9, e016812. [Google Scholar] [CrossRef]
- Müller-Wieland, D.; Marx, N.; Dreher, M.; Fritzen, K.; Schnell, O. COVID-19 and Cardiovascular Comorbidities. Exp. Clin. Endocrinol. Diabetes 2022, 130, 178–189. [Google Scholar] [CrossRef]
- Koeppen, M.; Rosenberger, P.; Magunia, H. COVID-19 Related Cardiovascular Comorbidities and Complications in Critically Ill Patients: A Systematic Review and Meta-analysis. Clin. Med. Insights Circ. Respir. Pulm. Med. 2021, 15, 1–11. [Google Scholar] [CrossRef]
- Parwani, A.S.; Haug, M.; Keller, T.; Guthof, T.; Blaschke, F.; Tscholl, V.; Biewener, S.; Kamieniarz, P.; Zieckler, D.; Kruse, J.; et al. Cardiac arrhythmias in patients with COVID-19: Lessons from 2300 telemetric monitoring days on the intensive care unit. J. Electrocardiol. 2021, 66, 102–107. [Google Scholar] [CrossRef] [PubMed]
- Han, K.Y.; Qiao, Q.; Zhu, Y.Q.; Chen, X.G.; Kang, X.X.; Zhang, G.F.; Cai, X.C.; Du, Y.; Jin, J.; Di, R.M.; et al. Atrial Arrhythmias in Patients with Severe COVID-19. Cardiol. Res. Pract. 2021, 2021, 8874450. [Google Scholar] [CrossRef]
- Sit, O.; Oksen, D.; Atici, A.; Barman, H.A.; Alici, G.; Pala, A.S.; Tekin, E.A.; Meke, A.; Borahan, S.; Gungor, B. Prognostic significance of Tp-e interval and Tp-e/QTc ratio in patients with COVID-19. Eur. Rev. Med. Pharmacol. Sci. 2021, 25, 3272–3278. [Google Scholar] [CrossRef]
- Yildirim, A.; Karaca, I.O.; Yilmaz, F.K.; Gunes, H.M.; Cakal, B. Fragmented QRS on surface electrocardiography as a predictor of cardiac mortality in patients with SARS-CoV-2 infection. J. Electrocardiol. 2021, 66, 108–112. [Google Scholar] [CrossRef]
- Vedovati, M.C.; Giustozzi, M.; Conti, S.; Becattini, C. Shock and Diffuse ST-elevation in a Patient with Coronavirus Disease-2019 Disease. J. Cardiovasc. Echogr. 2020, 30, 223–226. [Google Scholar] [CrossRef]
- Garcia-Zamora, S.; Lee, S.; Haseeb, S.; Bazoukis, G.; Tse, G.; Alvarez-Garcia, J.; Gul, E.E.; Çinier, G.; Alexander, B.; Martins Pinto-Filho, M.; et al. Arrhythmias and electrocardiographic findings in Coronavirus disease 2019: A systematic review and meta-analysis. Pacing Clin. Electrophysiol. 2021, 44, 1062–1074. [Google Scholar] [CrossRef]
- Yang, D.; Li, J.; Gao, P.; Chen, T.; Cheng, Z.; Cheng, K.; Deng, H.; Fang, Q.; Yi, C.; Fan, H.; et al. The prognostic significance of electrocardiography findings in patients with coronavirus disease 2019: A retrospective study. Clin. Cardiol. 2021, 44, 963–970. [Google Scholar] [CrossRef]
- Schijvenaars, B.J.A.; van Herpen, G.; Kors, J.A. Intraindividual variability in electrocardiograms. J. Electrocardiol. 2008, 41, 190–196. [Google Scholar] [CrossRef] [PubMed]
- Kung, B.H.; Hu, P.Y.; Huang, C.C.; Lee, C.C.; Yao, C.Y.; Kuan, C.H. An Efficient ECG Classification System using Resource-Saving Architecture and Random Forest. IEEE J. Biomed. Health Inf. 2020, 25, 1904–1914. [Google Scholar] [CrossRef] [PubMed]
- Wang, J.; Qiao, X.; Liu, C.; Wang, X.; Liu, Y.; Yao, L.; Zhang, H. Automated ECG classification using a non-local convolutional block attention module. Comput. Methods Programs Biomed. 2021, 203, 106006. [Google Scholar] [CrossRef] [PubMed]
- Ozdemir, M.A.; Ozdemir, G.D.; Guren, O. Classification of COVID-19 electrocardiograms by using hexaxial feature mapping and deep learning. BMC Med. Inform. Decis. Mak. 2021, 21, 170. [Google Scholar] [CrossRef]
- Gomes, J.C.; de Santana, M.A.; Masood, A.I.; de Lima, C.L.; Dos Santos, W.P. COVID-19’s influence on cardiac function: A machine learning perspective on ECG analysis. Med. Biol. Eng. Comput. 2023, 61, 1057–1081. [Google Scholar] [CrossRef]
- Nawaz, M.; Nazir, T.; Javed, A.; Malik, K.M.; Saudagar, A.K.J.; Khan, M.B.; Abul Hasanat, M.H.; Al Tameem, A.; Al Khathami, M. Efficient-ECGNet framework for COVID-19 classification and correlation prediction with the cardio disease through electrocardiogram medical imaging. Front. Med. 2022, 9, 1005920. [Google Scholar] [CrossRef]
- Sridhar, A.R.; Chen Amber, Z.H.; Mayfield, J.J.; Fohner, A.E.; Arvanitis, P.; Atkinson, S.; Braunschweig, F.; Chatterjee, N.A.; Zamponi, A.F.; Johnson, G.; et al. Identifying risk of adverse outcomes in COVID-19 patients via artificial intelligence-powered analysis of 12-lead intake electrocardiogram. Cardiovasc. Digit. Health J. 2022, 3, 62–74. [Google Scholar] [CrossRef]
- Muscato, F.M.; Corino, V.D.A.; Rivolta, M.W.; Cerveri, P.; Sanzo, A.; Vicentini, A.; Sassi, R.; Mainardi, L. A CNN for COVID-19 Detection using ECG signals. In Proceedings of the 49th Computing in Cardiology Conference, Tampere, Finland, 4–7 September 2022. [Google Scholar] [CrossRef]
- Baek, Y.S.; Jo, Y.; Lee, S.C.; Choi, W.; Kim, D.H. Artificial intelligence-enhanced electrocardiography for early assessment of coronavirus disease 2019 severity. Sci. Rep. 2023, 13, 15187. [Google Scholar] [CrossRef]
- Sbrollini, A.; De Jongh, M.C.; Ter Haar, C.C.; Treskes, R.W.; Man, S.; Burattini, L.; Swenne, C.A. Serial electrocardiography to detect newly emerging or aggravating cardiac pathology: A deep-learning approach. Biomed. Eng. Online 2019, 18, 15. [Google Scholar] [CrossRef] [PubMed]
- Marinucci, D.; Sbrollini, A.; Marcantoni, I.; Morettini, M.; Swenne, C.A.; Burattini, L. Artificial Neural Network for Atrial Fibrillation Identification in Portable Devices. Sensors 2020, 20, 3570. [Google Scholar] [CrossRef]
- Sbrollini, A.; Ter Haar, C.C.; Leoni, C.; Morettini, M.; Burattini, L.; Swenne, C.A. Advanced repeated structuring and learning procedure to detect acute myocardial ischemia in serial 12-lead ECGs. Physiol. Meas. 2023, 24, 44. [Google Scholar] [CrossRef]
- Pan, J.; Tompkins, W.J. A real-time QRS detection algorithm. IEEE Trans. Biomed. Eng. 1985, 32, 230–236. [Google Scholar] [CrossRef] [PubMed]
- Man, S.; Maan, A.C.; Schalij, M.J.; Swenne, C.A. Vectorcardiographic diagnostic & prognostic information derived from the 12-lead electrocardiogram: Historical review and clinical perspective. J. Electrocardiol. 2015, 48, 463–475. [Google Scholar] [CrossRef]
- Nelwan, S.P.; Kors, J.A.; Meij, S.H. Minimal lead sets for reconstruction of 12-lead electrocardiograms. J. Electrocardiol. 2000, 33, 163–166. [Google Scholar] [CrossRef]
- Kors, J.A.; Van Herpern, G.; Sitting, A.C.; Van Bemmel, J.H. Reconstruction of the Frank vectorcardiogram from standard electrocardiographic leads: Diagnostic comparison of different methods. Eur. Heart J. 1990, 11, 1083–1092. [Google Scholar] [CrossRef]
- Sbrollini, A.; Sedova, K.; Van Dam, P.; Kautzner, J.; Morettini, M.; Burattini, L. Point2ecg: An interactive software application for the identification of electrocardiographic fiducial points. In Proceedings of the International Union for Physical and Engineering Sciences in Medicine, Singapore, 12–17 June 2022. [Google Scholar]
- Møller, M.F. A scaled conjugate gradient algorithm for fast supervised learning. Neural Netw. 1993, 6, 525–533. [Google Scholar] [CrossRef]
- Prechelt, L. Early stopping—But when. In Lecture Notes in Computer Science (Including Subseries Lecture Notes in Artificial Intelligence and Lecture Notes in Bioinformatics); Springer: Berlin/Heidelberg, Germany, 2012; Volume 7700, pp. 53–67. [Google Scholar] [CrossRef]
- King, G.; Zeng, L. Logistic Regression in Rare Events Data. Polit. Anal. 2001, 9, 137–163. [Google Scholar] [CrossRef]
- Hastie, T.; Tibshirani, R.; Friedman, J.H. Cross-Validation. In The Elements of Statistical Learning: Data Mining, Inference, and Prediction; Springer: New York, NY, USA, 2009; pp. 241–249. [Google Scholar]
- Ribeiro, M.T.; Singh, S.; Guestrin, C. “Why Should I Trust You?”: Explaining the Predictions of Any Classifier. arXiv 2016, arXiv:1602.04938. [Google Scholar] [CrossRef]
- Ribeiro, M.T.; Singh, S.; Guestrin, C. Model-Agnostic Interpretability of Machine Learning. arXiv 2016, arXiv:1606.05386. [Google Scholar] [CrossRef]
- Doshi-Velez, F.; Kim, B. Towards A Rigorous Science of Interpretable Machine Learning. arXiv 2017, arXiv:1702.08608. [Google Scholar] [CrossRef]
- Santoro, F.; Monitillo, F.; Raimondo, P.; Lopizzo, A.; Brindicci, G.; Gilio, M.; Musaico, F.; Mazzola, M.; Vestito, D.; Di Benedetto, R.; et al. Qtc interval prolongation and life-threatening arrhythmias during hospitalization in patients with COVID-19. Results from a multi-center prospective registry. Clin. Infect. Dis. 2020, 73, e4031–e4038. [Google Scholar] [CrossRef]
- Wang, Y.; Chen, L.; Wang, J.; He, X.; Huang, F.; Chen, J.; Yang, X. Electrocardiogram analysis of patients with different types of COVID-19. Ann. Noninvasive Electrocardiol. 2020, 25, 12806. [Google Scholar] [CrossRef]
- Angeli, F.; Spanevello, A.; De Ponti, R.; Visca, D.; Marazzato, J.; Palmiotto, G.; Feci, D.; Reboldi, G.; Fabbri, L.M.; Verdecchia, P. Electrocardiographic features of patients with COVID-19 pneumonia. Eur. J. Intern. Med. 2020, 78, 101–106. [Google Scholar] [CrossRef]
- Kassis, N.; Kumar, A.; Gangidi, S.; Milinovich, A.; Kalra, A.; Bhargava, A.; Menon, V.; Wazni, O.M.; Rickard, J.; Khot, U.N. Prognostic value of initial electrocardiography in predicting long-term all-cause mortality in COVID-19. J. Electrocardiol. 2022, 75, 1–9. [Google Scholar] [CrossRef]
- Pavri, B.B.; Kloo, J.; Farzad, D.; Riley, J.M. Behavior of the pr interval with increasing heart rate in patients with COVID-19. Heart Rhythm 2020, 17, 1434–1438. [Google Scholar] [CrossRef]
- Rezuş, C.; Moga, V.D.; Ouatu, A.; Floria, M. QT interval variations and mortality risk: Is. there any relationship? Anatol. J. Cardiol. 2015, 15, 255–258. [Google Scholar] [CrossRef]
- Klabunde, R.E. Cardiovascular Physiology Concepts, 2nd ed.; Lippincott, Williams & Wilkins/Wolters Kluwer: Philadephia, PA, USA, 2011. [Google Scholar]
- Khan, A.H.; Hussain, M.; Malik, M.K. ECG Images dataset of Cardiac and COVID-19 Patients. Data Brief 2021, 34, 106762. [Google Scholar] [CrossRef]
Disclaimer/Publisher’s Note: The statements, opinions and data contained in all publications are solely those of the individual author(s) and contributor(s) and not of MDPI and/or the editor(s). MDPI and/or the editor(s) disclaim responsibility for any injury to people or property resulting from any ideas, methods, instructions or products referred to in the content. |
© 2024 by the authors. Licensee MDPI, Basel, Switzerland. This article is an open access article distributed under the terms and conditions of the Creative Commons Attribution (CC BY) license (https://creativecommons.org/licenses/by/4.0/).