Article

Short-Time Alternating Current Electrical Stimulation and Cell Membrane-Related Components

1
Institute for Cell Biology, Rostock University Medical Center, 18057 Rostock, Germany
2
Department Life, Light and Matter, University of Rostock, 18051 Rostock, Germany
*
Author to whom correspondence should be addressed.
These authors contributed equally to this work.
Appl. Sci. 2024, 14(2), 812; https://doi.org/10.3390/app14020812
Submission received: 20 December 2023 / Revised: 12 January 2024 / Accepted: 16 January 2024 / Published: 17 January 2024
(This article belongs to the Section Applied Biosciences and Bioengineering)

Abstract

:

Featured Application

Physical factors such as light, mechanical forces, physical plasma, but especially the electric field derived from a direct or alternating current, are potent stimuli for cells finally being able to regenerate human tissues. The demand for effective regenerative therapies is increasing due to aging populations. Electrical stimulation is operated, i.e., in bones (medical implants), the brain (movement disorders), muscles (rehabilitation), and connective tissue (skin wounds). Although this has been successfully carried out, the mechanism of action still needs to be fully understood.

Abstract

Electrical stimulation (ES) and its effects on biological systems is an area of research in regenerative medicine. The focus here is on the mechanism of action of ES on cell membrane-related components. A short alternating current (AC) stimulation (10 min) was applied on suspended human MG-63 osteoblasts via a commercially available multi-channel system (IonOptix). The pulsed ES with 1 V or 5 V and frequencies of 20 Hz on cells was performed immediately after cell seeding. The in vitro investigations were conducted by microscopy, flow cytometry, and particle analysis via a Litesizer within 24 h. The short-time ES with the parameter 1 V and 20 Hz was beneficial for the process of cell attachment, which could be related to an enhanced deposition of fibronectin on the glass bottom from the protein-containing medium (10% FBS). The MG-63 cells’ spherical coat hyaluronan remained constant and did not contribute to this AC-triggered adhesion. In this context, the cells’ zeta potential also did not play a role. The membrane potential analyzed via DiBAC4(3) was unchanged. Only the aquaporin channel AQP 8 in the cell membrane was significantly enhanced. Suspended cells in an AC electric field were activated during their settlement, and the fibronectin adsorption on the bottom contributed to this effect but not the membrane-related components.

1. Introduction

As the average age of the German population has risen significantly in recent years, the importance of measures to maintain quality of life continues to increase. The aging process of the musculoskeletal system and the brain plays a key role here, which is why electrically active implants are becoming a focus of research.
Electrical signals are the basis for many processes in the human body. In bone tissue, electrical activity also seems relevant for regeneration processes [1]. The bone constituents collagen and hydroxyapatite could be defined as causative for the emission of electrical signals according to past research [1].
The application of external electrical stimulation (ES) is used to enhance fracture healing and bone formation in delayed unions and non-unions [2,3]. The underlying mechanisms are not yet completely understood. In in vitro experiments, electrically stimulated stem cells showed increased osteogenic differentiation compared to non-stimulated controls [4,5]. The stimulation of osteoblasts led to enhanced survival and proliferation as well as increased mineralization and collagen production [6,7].
Osteoblasts are significantly involved in bone tissue formation, and the osteoblast-like MG-63 cells are widely used internationally as model cells for in vitro experiments in biomaterials research [8,9,10,11]. If MG-63 osteoblasts in suspension were electrically stimulated (ES) with an alternating current (AC) for only 10 min, initial adhesion was increased, and cells were more active. The boost in adhesion was impressively seen in a higher basal Ca2+ level in the cytoplasm, and the prompt cell reaction was due to an additional adenosine triphosphate (ATP) stimulus with a prolonged steady state [12]. In addition, the production of reactive oxygen species (ROS) was also increased 4 h after AC using the IonOptix multi-channel system [12,13]. ROS have long been considered a toxic by-product of metabolism, as they have the potential to damage DNA and inhibit growth when they exceed the capacity of antioxidant enzymes. However, physiological concentrations also involve various regulatory signaling pathways [14], such as activating the mitogen-activated protein kinase (MAPK) signaling pathway [15]. Since the generation of ROS, such as hydrogen peroxide (H2O2), is one of the effects of AC with certain parameters, the impact of H2O2 on physiologic processes combined with other electrical stimulation effects needs to be investigated.
H2O2 is transported into cells mainly by aquaporins (AQPs) 1, 3, 5, 7, 8, and 9 [16]. AQPs are membrane-bound channels that mediate the bidirectional passive transport of water and play an essential role in water and osmolyte homeostasis [17]. However, AQPs are also partially found in intracellular compartments, which can be transported into the membrane in response to various stimuli [16]. Currently, 13 classes have already been detected in multiple cells and tissues [18]. In human tissue microarrays, e.g., AQP 3 was found to be moderately expressed not only in articular chondrocytes but also in subchondral osteoblasts and synovium [17]. In addition to their transport function, AQPs also play a role in cellular signaling pathways, migration, proliferation, and the regulation of cell–cell adhesions [19]. For example, AQP 1 regulates the expression of cell–cell adhesion proteins, such as ß-catenin and γ-catenin [19].
We discovered earlier that a short-time biphasic electrical stimulation improved initial adhesion processes. Still, we did not find an explanation for why cells adhere better. One possible mechanism is an altered hyaluronan synthesis by cells, because earlier findings indicated a crucial role of the pericellular matrix substance hyaluronan (HA) in the initial adhesion processes of osteoblasts and chondrocytes [20,21]. Research to date has not yet been able to fully explain the mechanism of action of ES. Here, we wanted to find out in more detail if compartments in and around the cell membrane, the hyaluronan coat, the aquaporins, the membrane potential, or charges could play a role in electrically stimulated cells and their initial adhesion.

2. Materials and Methods

2.1. Electrical Stimulation via IonOptix System

The AC electrical stimulation (ES) was carried out using the multi-channel electrical stimulator, with a voltage generator and 12-well C-Dish (IonOptix, Milton, MA, USA) [12,22]. The carbon-graphite electrodes reach the bottom of a 12-well plate (Greiner bio-one, Frickenhausen, Germany) to stimulate all cells electrically. To offer identical experimental conditions, coverslips (Menzel™ Microscope Coverslips, Ø 18 mm, Thermo Fisher Scientific, Waltham, MA, USA) were placed on each bottom of the well plate. For the experimental approaches, we used 1 V and 5 V at a frequency of 20 Hz for 10 min, because we found convincingly increased cell adhesion and intracellular Ca2+ levels in earlier studies [12]. The applied electric field strength and current measurements to characterize the system are described elsewhere [12]. The electric field was computed using the finite element method implemented in the open-source package EMStimTools based on the voltage difference between the electrodes [23].

2.2. Cell Culture

The human osteoblast-like MG-63 cells (American Type Culture Collection ATCC®, CRL-1427, Manassas, VA, USA) were already used internationally as a model for bone physiology studies, because they exhibit many characteristics of human primary osteoblasts. These include the expression of integrin subunits, similar cellular structures such as receptors for parathyroid hormone and 1,25-dihydroxy vitamin D3 [24], and a similar adhesion behavior [11]. It is a cell line that allows almost unlimited proliferation. The phenotypic stability of these cells could be demonstrated over passages 5 to 30 [11]. In general, MG-63 cells were cultured under standard conditions (37 °C, 95% humidity, and 5% CO2) in Dulbecco’s Modified Eagle Medium (DMEM; Thermo Fisher Scientific) containing 10% fetal bovine serum (FBS, Merck KGaA, Darmstadt, Germany), which contained pyruvate. At 70–80% confluence, cells were passaged. After seeding the cells in suspension in the 12-well plates, suspended cells were directly AC-stimulated for 10 min. For the controls, the electrodes were placed in the well plate but without AC (control).

2.3. Aquaporin Expression in MG-63 Cells

To study the general localization of the aquaporin (AQP) water ion channels, 50,000 MG-63 cells were seeded in Ibidi µ-dish (IbiTreat 35 mm, Ibidi GmbH, Gräfelfing, Germany) and cultured for at least 24 h. The DMEM was removed, and the cells were washed three times with Dulbecco’s Phosphate-Buffered Saline (PBS; Sigma-Aldrich, Waltham, MA, USA) and then fixed with ice-cold 99% methanol (Sigma-Aldrich) for 10 min at 4 °C. The washing steps were repeated, and the cells were permeabilized with 0.1% Triton X-100 (Sigma-Aldrich) for 10 min at room temperature (RT), washed with PBS, and blocked for 1 h with FBS (2% in PBS) to prevent non-specific binding of the primary antibody. Cells were incubated with the respective AQP primary polyclonal antibodies aquaporin 1 (1:25), 3 (1:25), 8 (1:100), 10 (1:25) (all Invitrogen GmbH, Darmstadt, Germany), aquaporins 5 (1:100), 7 (1:100), and 9 (1:100) (all Bioss Antibodies Inc., Woburn, MA, USA) overnight in a wet chamber at 4 °C. After PBS washing, Alexa Fluor 488-coupled secondary antibody (anti-rabbit IgG, 1:500 in PBS, Sigma-Aldrich) was added for 30 min at RT. Excess secondary antibody was removed by washing twice, and then, three drops of FluoroShieldTM with DAPI (Sigma-Aldrich) were added to the bottom of the Ibidi dishes and covered with a coverslip. The samples were then stored in the refrigerator until analysis with the confocal laser scanning microscope LSM780 (Carl Zeiss, Jena, Germany) with the 63× oil objective (C-apochromat 63×/1.47 oil corr.). In addition, a z-stack of 11 images was acquired over a distance of 14 µm for each sample (software ZEN 2.3 (black edition); Zeiss Vision Care, Oberkochen, Germany).
The analysis of AQP expression 1, 3, 5, 7, 8, 9, and 10 was repeated twice with independently passaged cells.

2.4. AQP Expression and Granularity of MG-63 Cells after Electrical Stimulation

For stimulation with the IonOptix Culture Dish Electrode System, 150,000 MG-63 cells were seeded in DMEM. The stimulation chamber was connected to the IonOptix system and stimulated for 10 min at 1 V/20 Hz or 5 V/20 Hz according to the former adhesion experiments [12]. During stimulation, the 12-well plates were placed in an incubator (37 °C, 95% humidity, 5% CO2). One of these well plates was connected but not stimulated (control). Subsequently, the cell suspension was transferred to FACS tubes (BD Biosciences, Franklin Lakes, NJ, USA), washed with PBS, and centrifuged at 200× g for 5 min. The cells were then fixed with 4% paraformaldehyde (PFA, Sigma-Aldrich) at RT, washed, and permeabilized with 0.1% Triton X-100 (Sigma-Aldrich) for 10 min at RT. After washing again, cells were blocked with 2% FBS (Merck KGaA, in PBS) for 1 h, washed, and then incubated with the respective primary antibodies overnight at 4 °C (see Section 2.3). The negative control received no primary antibody but an equivalent volume of PBS. Cells were rewashed and incubated with the secondary antibodies (see Section 2.3) for 30 min at RT. Cells were stored at 4 °C in PBS until measurement with the FACSCalibur flow cytometer (BD Biosciences) using CellQuest Pro (version 4.0.1; BD Biosciences) for cell acquisition and FlowJo (version 10, BD Biosciences) to analyze the data.
To obtain information about the cell population, we also analyzed the size of the cells (forward scatter; FSC-H) and the internal granularity (side scatter; SSC-H) by the FSC/SSC dot plot [25] using FlowJo.

2.5. Hyaluronan Spherical Coat and Adhesion

MG-63 cells (50,000) were seeded in DMEM (10% FBS) on coverslips (ø12 mm, Menzel, Thermo Fisher Scientific) and incubated for 1 h at 37 °C and 5% CO2. Cells were washed with PBS and fixed with 4% PFA at RT for 10 min. After washing with PBS, cells were incubated with the primary antibody biotinylated hyaluronic acid binding protein (4 µg; Sigma-Aldrich) and incubated for 30 min at RT. Subsequently, cells were washed and incubated with streptavidin FITC (0.5 µg; BD Pharmingen™, BD Biosciences) for 30 min in the dark. Samples were covered with FluoroShieldTM (Sigma-Aldrich) and dried overnight at 4 °C. Images were taken using the LSM780 (Carl Zeiss), 40× water objective.
Adhesion experiments were conducted as described in [12]. Briefly, 40,000 cells were seeded in DMEM and stimulated for 10 min. Subsequently, 300 µL medium was aspired, and the non-adherent cells were counted using the FACSCalibur (BD Biosciences). Additionally, hyaluronidase was used to cleave the hyaluronan coat. MG-63 cells (1 × 10⁶) were suspended in DMEM without FBS. Hyaluronidase (600 U; type IV-S, Sigma-Aldrich) was added and incubated for 30 min at 37 °C. A total of 40,000 treated cells were seeded in DMEM without FBS. Cells were stimulated for 10 min (1 V/20 Hz, 5 V/20 Hz) in a 12-well plate on coverslips (ø 18 mm, Menzel), followed by immediate FACS measurement. Unstimulated cells served as controls. The reference values were obtained at t = 0 min (no adhesion). Adhesion was calculated by normalizing the cell count to the t0 reference sample.

2.6. Cells‘ Surface Charge via Zeta Potential

MG-63 cells (100,000) were seeded in DMEM (10% FBS) and electrically stimulated for 10 min in a 12-well plate (1 V/20 Hz, 5 V/20 Hz). The zeta potential was assessed via electrophoretic light scattering (Litesizer 500, Anton Paar GmbH, Ostfildern, Germany). The 2–3 repeated measurements were performed using the Univette Low volume cuvette (50 µL, conductivity of 20–26 mS/cm). Each measurement consists of 60 runs. A Henry factor of 1.5 (Smoluchowski approximation) was used to calculate the zeta potential. Protein mode was activated in order to avoid sample degradation due to Joule heating.

2.7. Membrane Potential

MG-63 cells were stained in Bis-(1,3-dibutylbarbituric acid)trimethine oxonol (DiBAC4(3); 2.5 µM; Molecular Probes, Thermo Fischer Scientific) for 10 min at RT. Subsequently, 100,000 stained cells were seeded in DMEM (+10% FBS) and stimulated for 10 min at RT. Directly after, fluorescence was measured with flow cytometry (FACSCalibur, ex: 488 nm, em: 519 nm; BD Biosciences). Cells incubated in DMEM and supplemented with potassium chloride (150 mM KCL; Sigma-Aldrich) served as positive control. Unstained cells served as negative control.

2.8. Particle Size in Medium

Physical stimuli influence not only the cells but also the surrounding liquids [26]. Therefore, we wanted to know if electrical stimulation via the IonOptics device also impacts the cell culture medium. The DMEM (10% FBS) was electrically stimulated for 10 min with 1 and 5 V at 20 Hz and without electrical stimulation (control). Measurement of particle size was performed via dynamic light scattering (LitesizerTM 500, Anton Paar GmbH). Samples were measured with 2–3 repeated measurements in disposable cuvettes (Sarstedt, Nuembrecht, Germany), with 8 cycles of 10 s per measurement. The scattered light was detected in the Side scatter. The auto-correlation function was fitted with an exponential fit for the determination of hydrodynamic diameter and the Poly Dispersity Index (= weight divided by the number of average molar mass) and with a non-negative least square algorithm for the determination of the particle size distribution using the Kalliope software (Anton Paar GmbH).

2.9. Quantification of Protein Adsorption

Physical stimuli could influence protein adsorption. When a biomaterial comes into contact with a protein-containing biological fluid (e.g., FBS-containing medium), the proteins adsorb to the exposed surfaces within a few seconds and form a monolayer. We asked whether electrical stimulation could promote protein adsorption. Therefore, we determined the amount of total protein on the coverslip after the 10 min electrical stimulation of the medium. Briefly, DMEM (10% FBS) was added to the well and immediately electrically stimulated for 10 min with 1 V/20 Hz or 5 V/20 Hz. Afterward, DMEM was removed, and after carefully rinsing with PBS, the Bio-Plex® Cell Lysis Kit (Bio-Rad Laboratories GmbH, Munich, Germany) was added for 20 min on ice. The amount of protein was then determined using Qubit (Invitrogen by Thermo Fisher Scientific) with the Qubit™ Protein Assay Kit (Invitrogen).
In another approach, 10,000 MG-63 cells that were suspended in the wells were electrically stimulated for 10 min in DMEM containing 10% FBS. Then, fibronectin was detected around the cells and on the cover glass (placed in the wells). The samples (cells/cover glass) were washed and fixed with 4% PFA. We used rabbit antifibronectin antibody (1:400; Sigma-Aldrich) as primary antibody and goat antirabbit Alexa FluorTM 488 (1:1000; Thermo Fisher Scientific) as secondary antibody. Fibronectin expression was analyzed by LSM780 (63× oil objective), and the mean fluorescence intensity (MFI) was evaluated using the software ZEN 2.3 (blue edition) with the function “Histo”.

2.10. Statistics

All analyses were repeated at least three times with independent cell passages. The data were analyzed using GraphPad Prism software (vers. 7.02, GraphPad Software Inc., La Jolla, CA, USA). All data were first tested for normal distribution by the Shapiro–Wilk test. If the test was positive (p ≥ 0.05), the one- or two-way analysis of variance (ANOVA) with multiple Tukey’s test was performed. In the case of non-normally distributed values (p ≤ 0.05), further processing was performed using Repeated Measure (RM) one-way ANOVA post hoc Fisher’s Least Significant Difference (LSD) test (AQP expression). A confidence interval of 95% was assumed. The data were presented as mean and standard error of the mean (s.e.m.). The symbols * and ** correspond to p ≤ 0.05 and p ≤ 0.01, respectively. The unstimulated control’s mean fluorescence intensity (MFI) was set to 1, and all other values were normalized to it.

3. Results

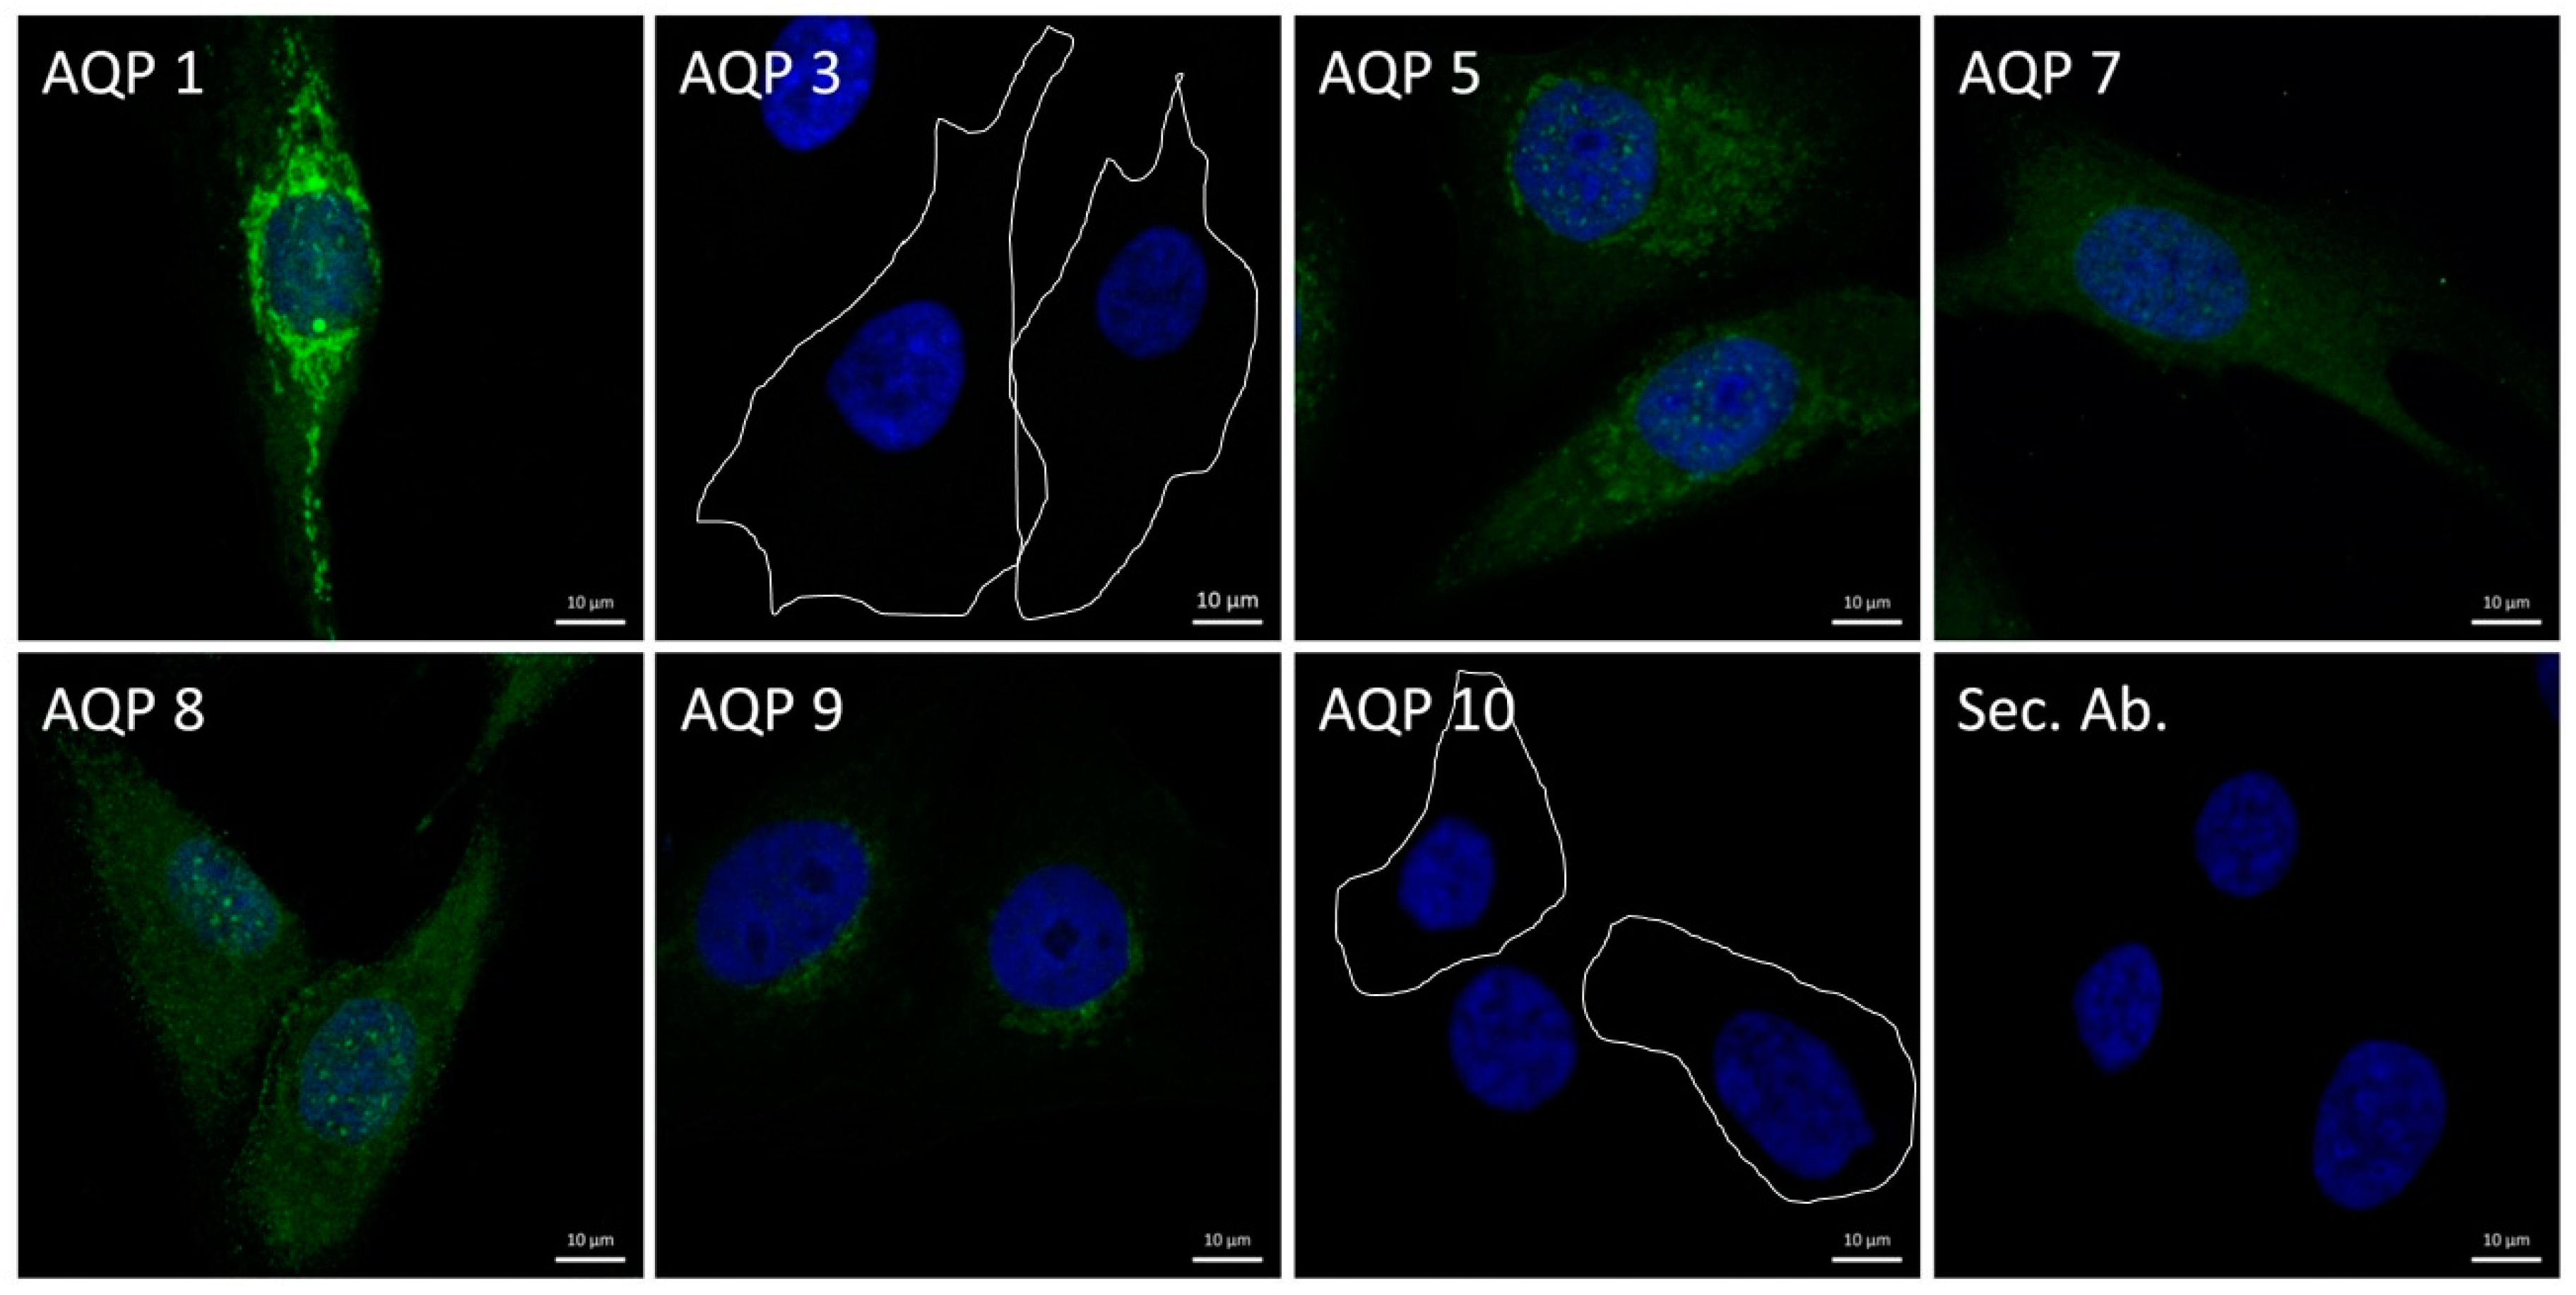
3.1. Expression of Aquaporins

Aquaporins are important channels in the cell membrane and are, i.e., responsible for the water ion flux. In MG-63 cells, the normal expression and localization of AQPs 1, 3, 5, 7, 8, 9, and 10 were investigated via confocal microscopy. The classic AQPs 1, 5, and 8 were clearly expressed (Figure 1), as was the aquaglycerolporin AQP 7. However, it is noticeable that the signal for AQPs 3, 9, and 10 is only weak. AQPs 1 and 5 show a clear fluorescence signal in the region around the nucleus, with punctate signal accumulations. AQPs 7, 8, and 9 appear more evenly distributed in the cell body, with signal attenuation being evident in the region around the nucleus.

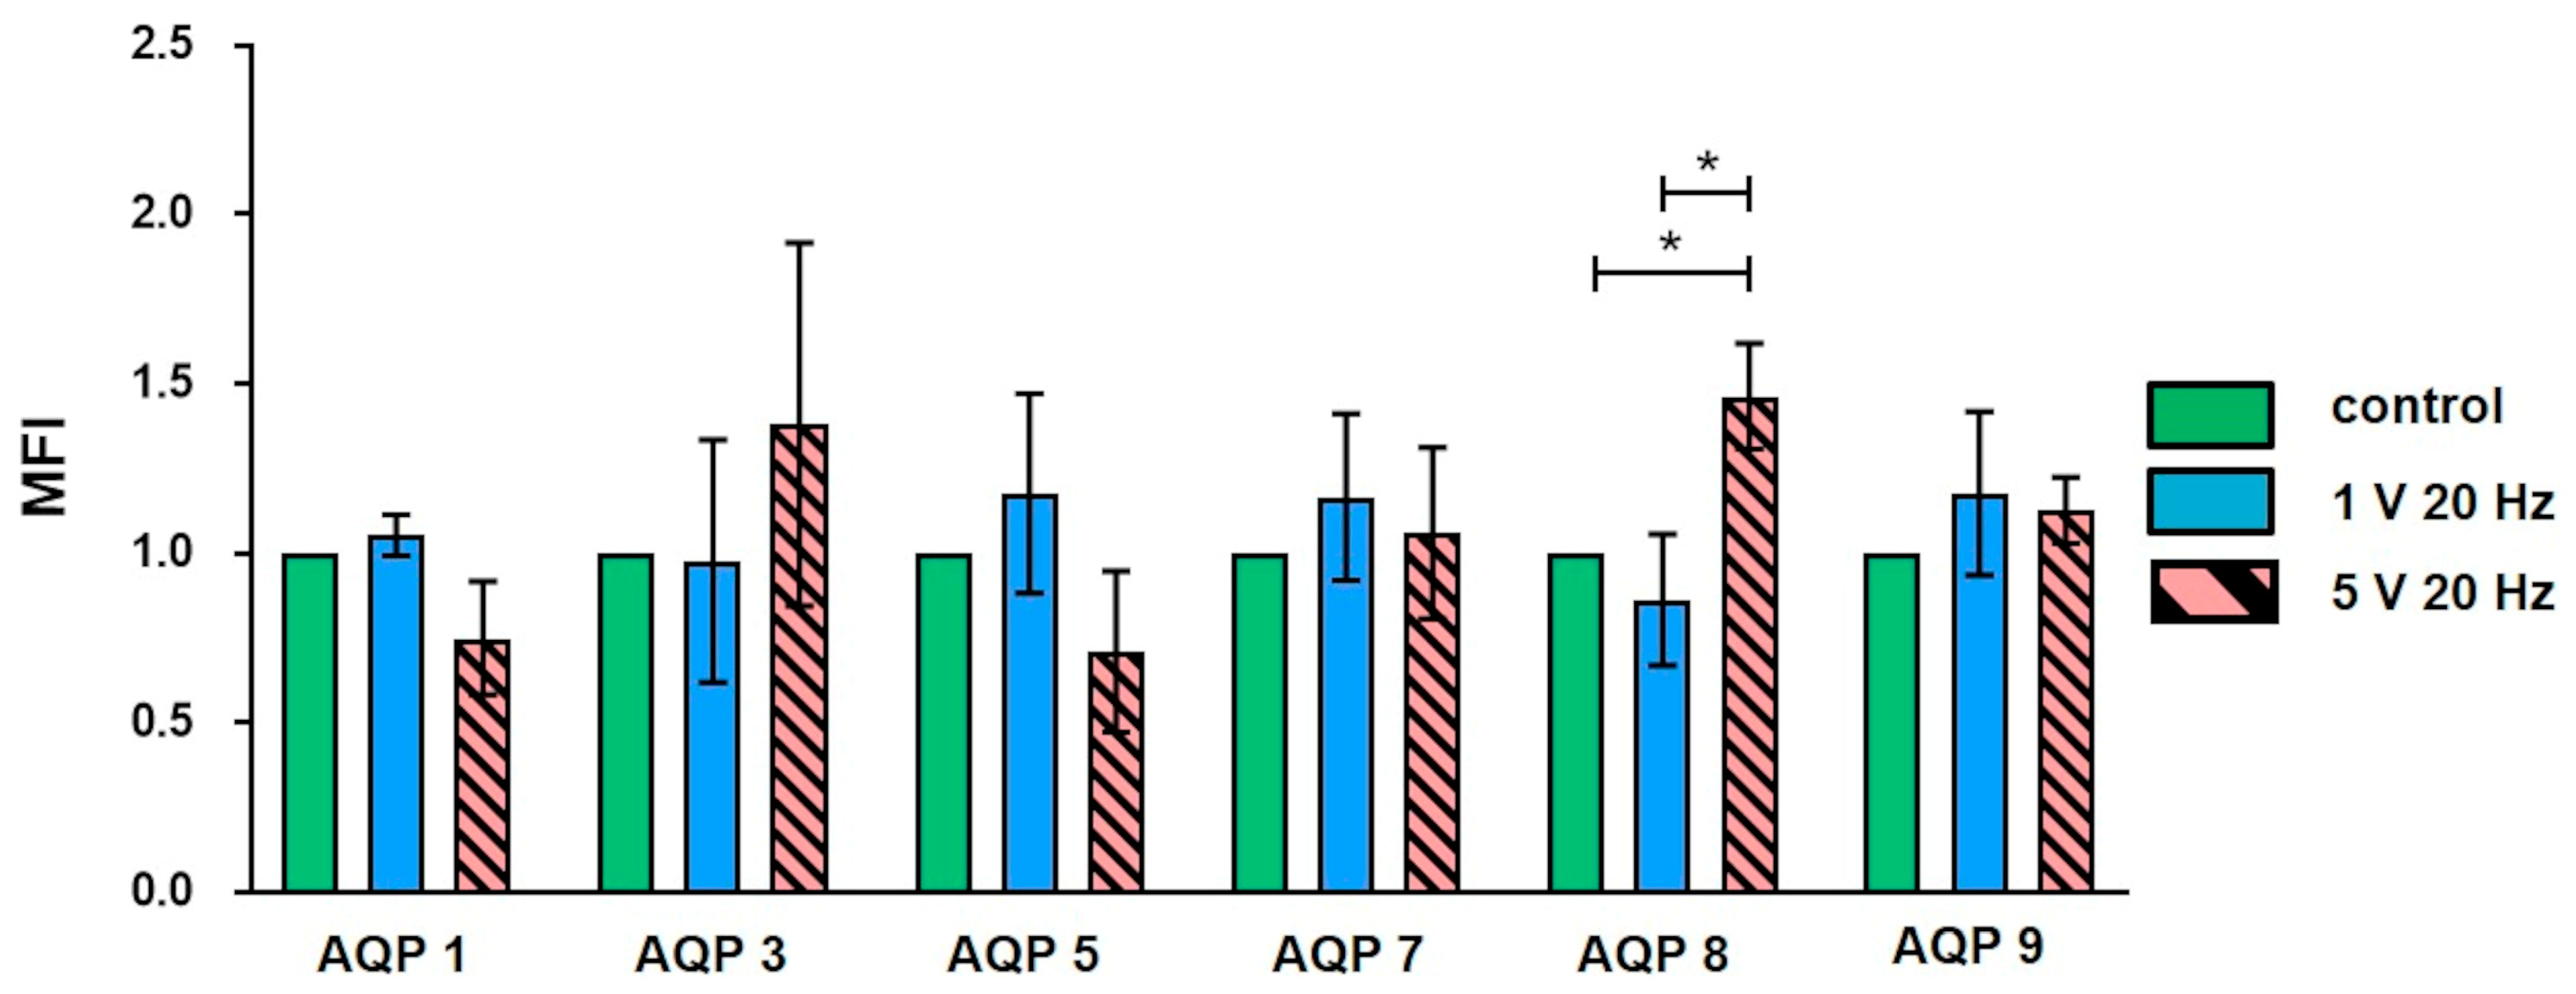
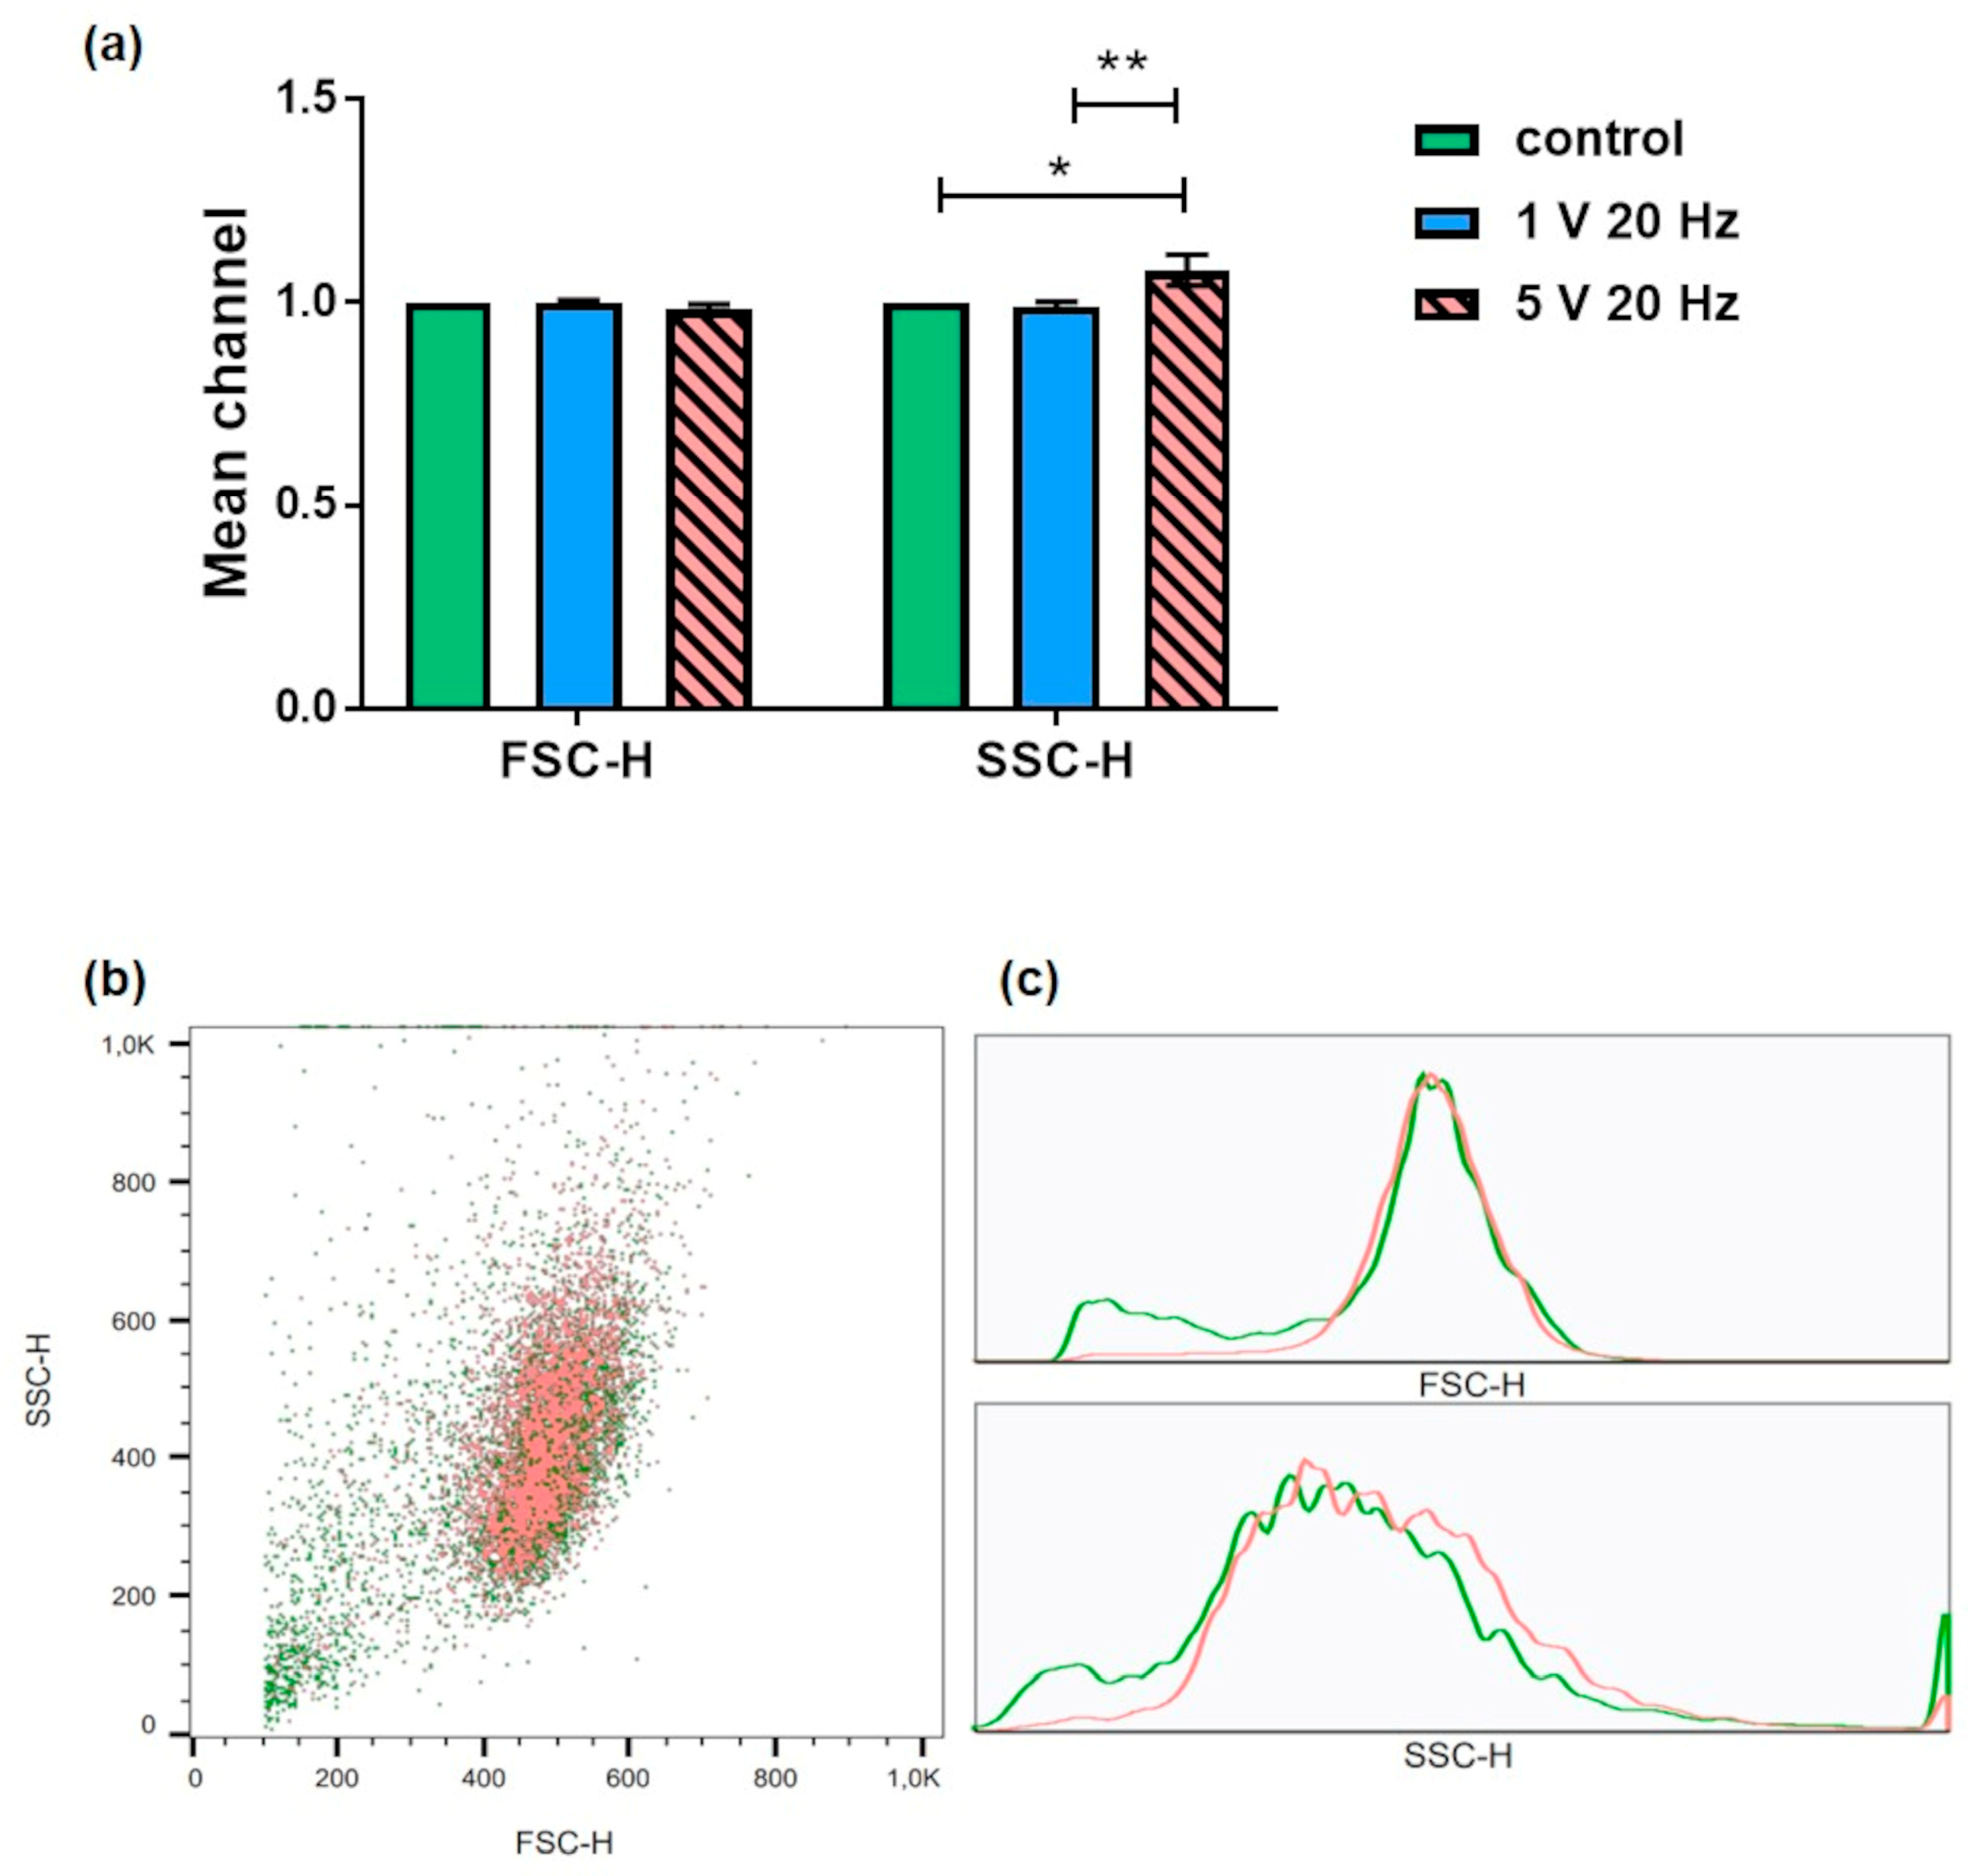
3.2. Flow Cytometry: Aquaporin Expression and Granularity of MG-63 Cells after AC Electrical Stimulation

Due to electrical stimulation, ROS species are generated in the medium around and inside the cells. The AQP channels are permeable for H2O2; therefore, it is worth knowing if AC can influence their expression. The AQPs 1, 3, 5, 7, 8, and 9 were investigated via flow cytometry after 10 min of electrical stimulation with 1 V or 5 V at 20 Hz. AQP 10 was not considered, because it was not expressed and is not involved in the transport of hydrogen peroxide [16]. No consistent trend can be observed concerning a change in the AQP expression (Figure 2). At 5 V/20 Hz, the channel of AQP 8 was significantly increased. At 1 V/20 Hz, the expression of AQPs 1, 5, 7, and 9 slightly increased by trend.
To evaluate whether changes in cell granularity are an outcome of ES with low frequencies (20 Hz), we analyzed the flow cytometric dot plots concerning the side scatter (SSC) of MG-63 cells. The mean channel value of the unstimulated control was set to 1, and all other values were normalized to the control. While the cell size (detected with forward scatter, FSC) shows no change, the cell granularity (SSC) increased significantly after electrical stimulation with 5 V/20 Hz. The relative SCC values for 5 V/20 Hz and 1 V/20 Hz are 1.080 ± 0.101 and 0.991 ± 0.028, respectively (Figure 3).

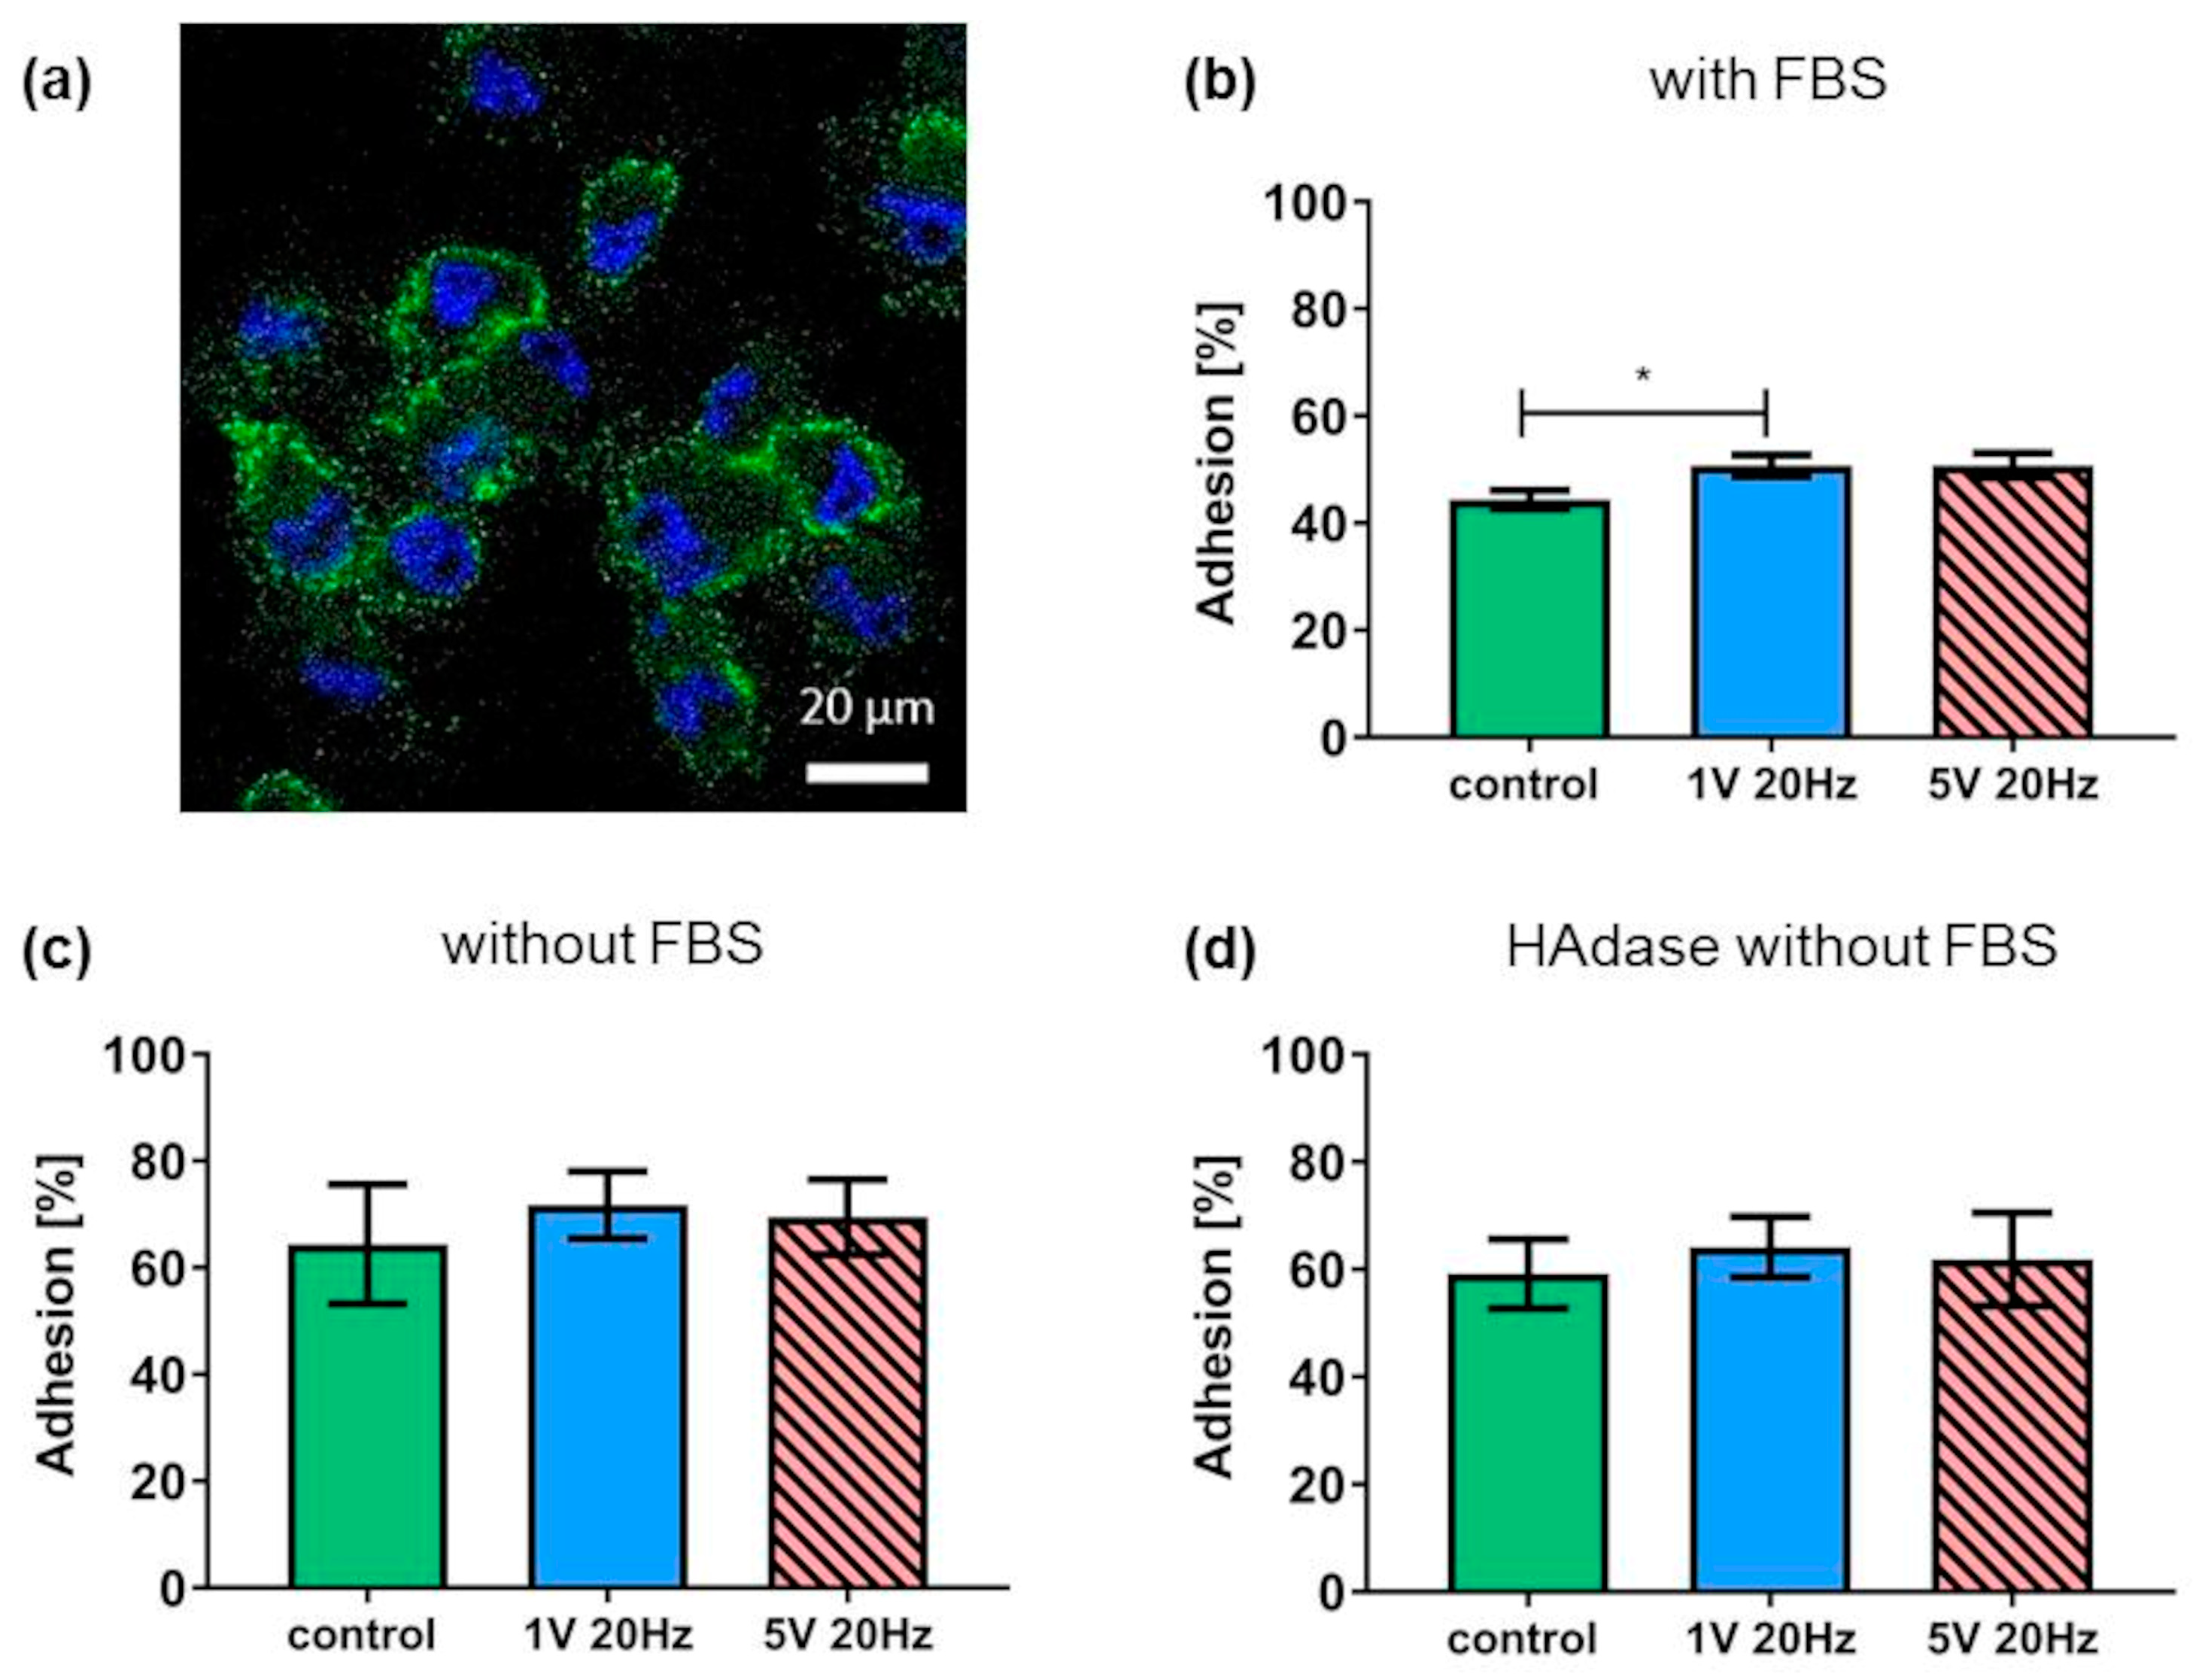
3.3. Hyaluronan Coat and Adhesion

In previous works, we showed an increased initial cell adhesion after ES [12]. We now wanted to examine the possible reasons for this enhanced adhesion. Our human MG-63 cells possess a layer of hyaluronan on their cell surface as a spherical coat (Figure 4a) that can interact with the glass surface and may play a role in AC stimulation-mediated adhesion. In DMEM containing 10% FBS, the adhesion increased significantly when cells were stimulated with 1 V/20 Hz (Figure 4b), by 50.7 ± 4% versus the control (44.4 ± 3.5%). The enzymatic digestion of the hyaluronic coat was performed in a medium without FBS, because the enzyme is not active in the presence of FBS. As an adequate control, the adhesion measurement was also performed without FBS. The stimulation no longer affected the adhesion (Figure 4c). The cleavage of the hyaluronic coat did not change this result (Figure 4d).

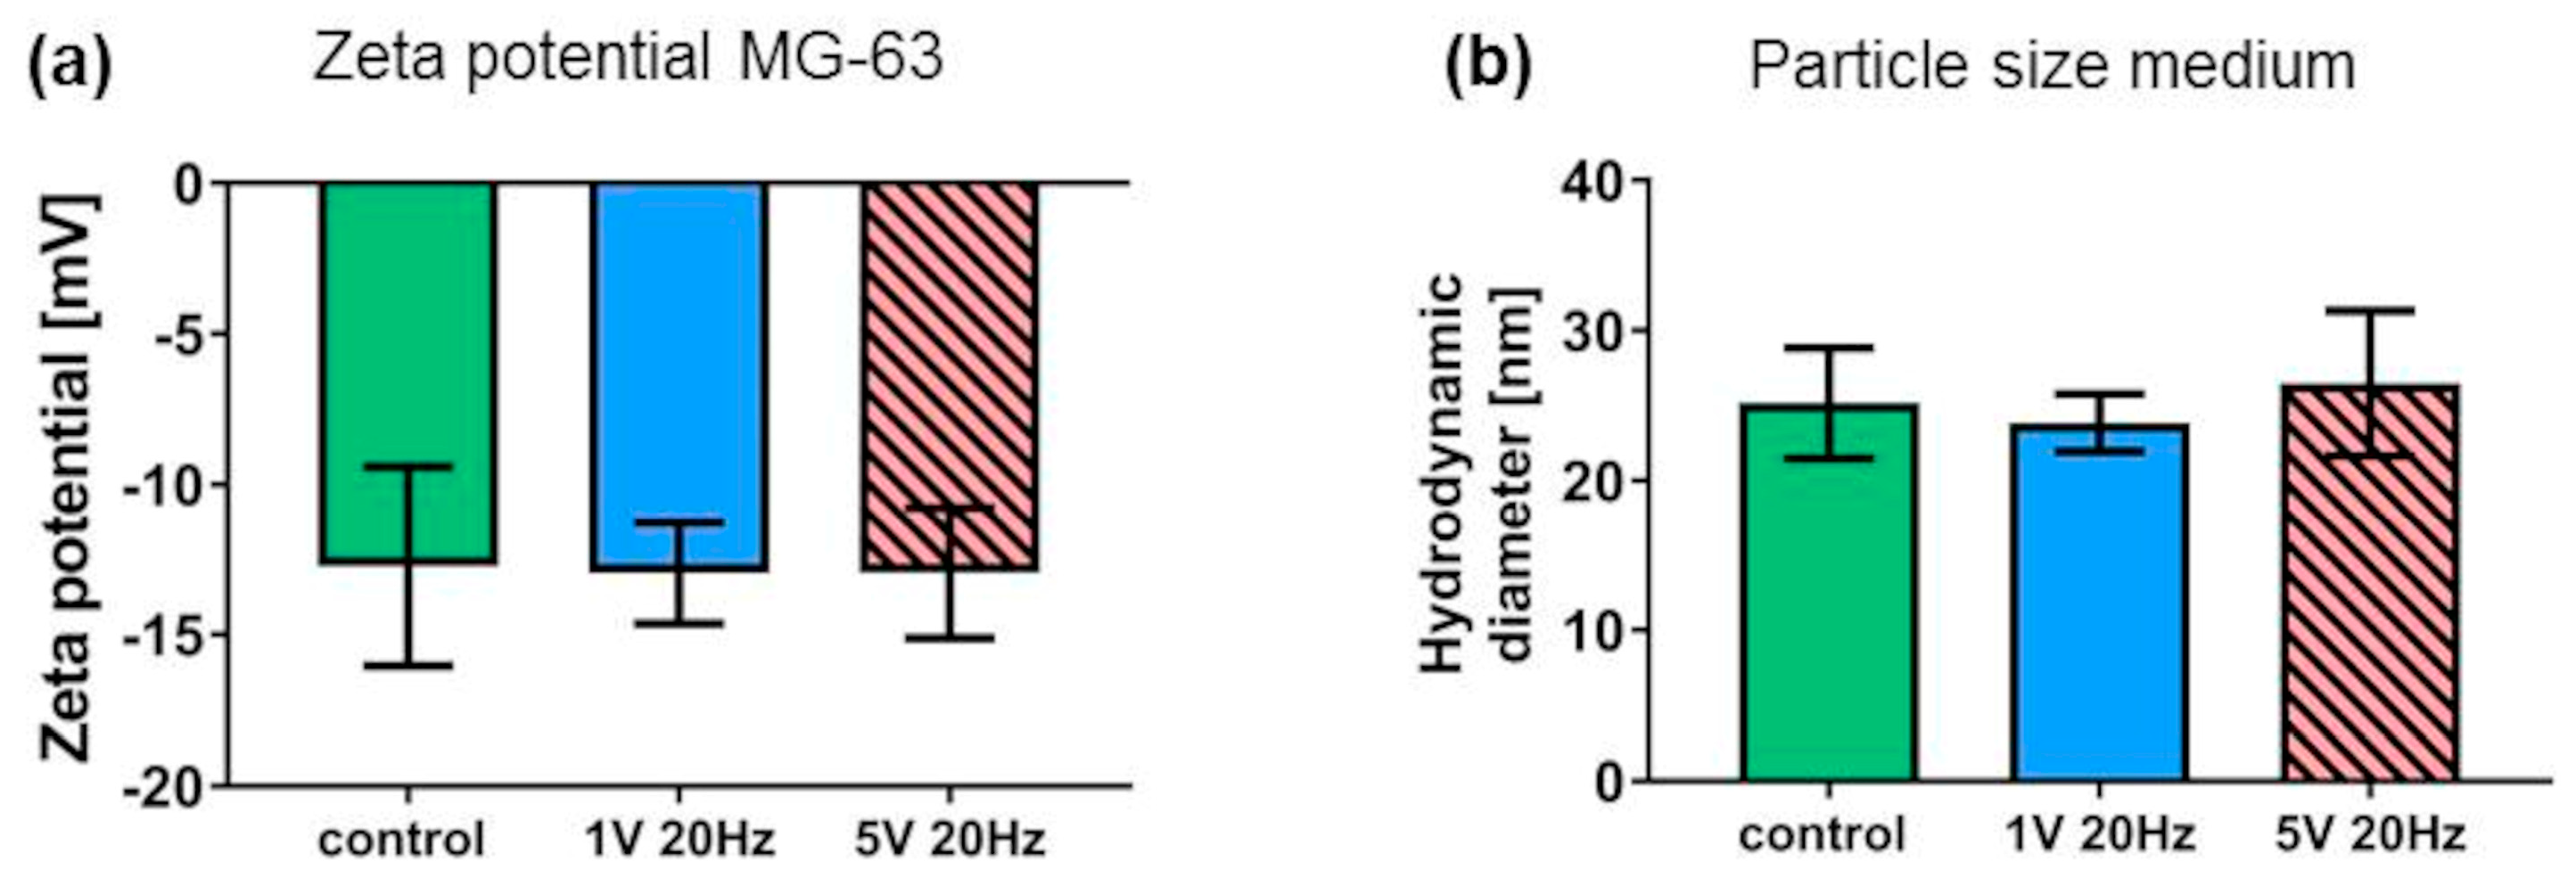
3.4. Litesizer Measurements

Hyaluronan has negatively charged carboxyl groups in the molecule [20]. We investigated whether ES influenced the cells’ surface charge in a medium with FBS (Figure 5a). The mean zeta potential of all samples, independently of the stimulation, was negatively charged with about −13 mV. Therefore, ES did not influence the surface charge.
We also examined whether ES led to an accumulation of particles in the medium containing FBS. There was no change in particle size after ES (Figure 5b).

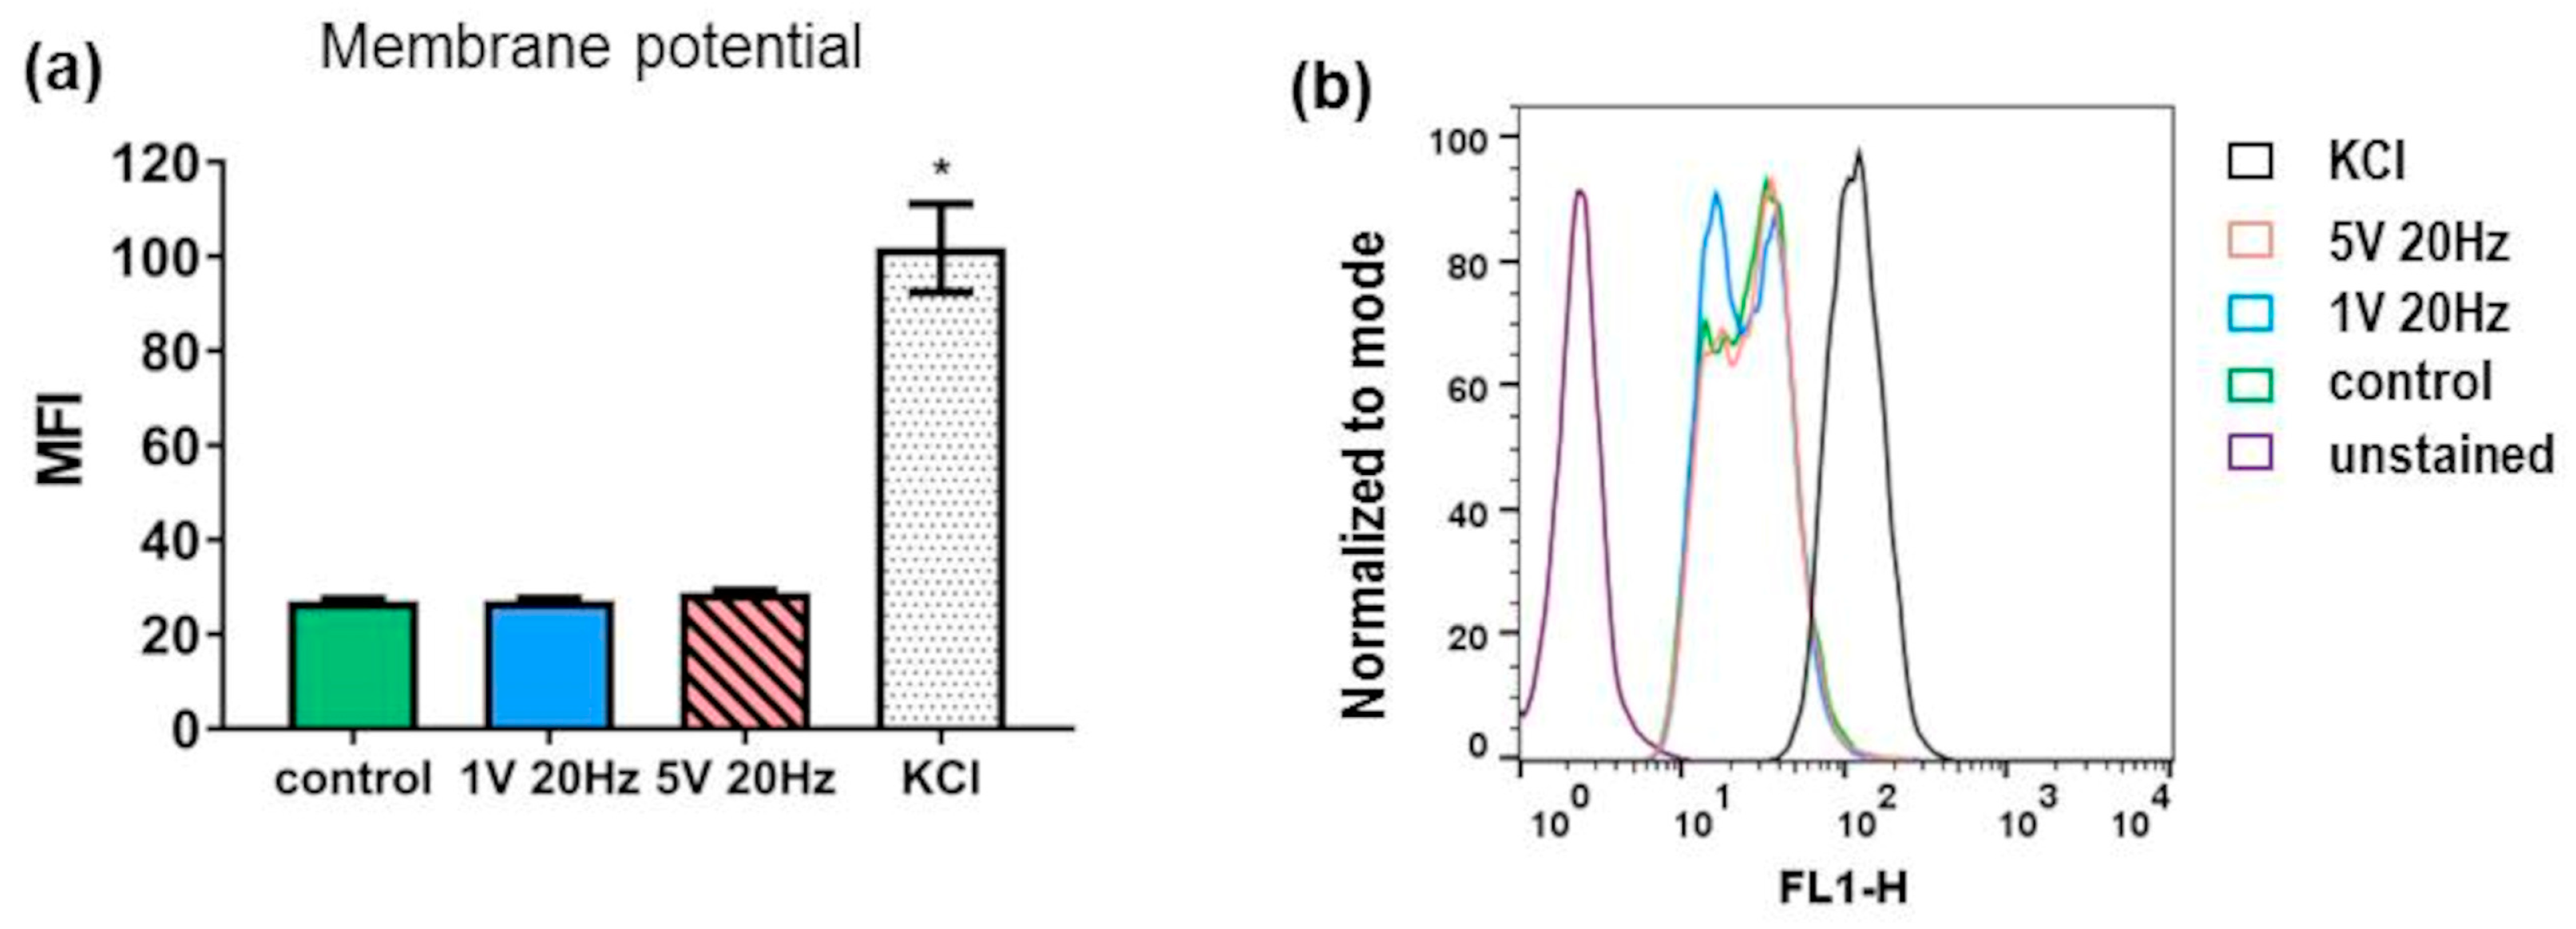
3.5. Membrane Potential

The influence of ES on the membrane potential was assessed using the voltage-sensitive fluorescent dye DiBAC4(3). Depolarized cells exhibit greater fluorescence, as the dye is able to diffuse into the cells. Hyperpolarized cells exhibit decreased fluorescence. The incubation of MG-63 cells in a medium supplemented with 150 µM KCl served as a positive control and showed a significantly increased fluorescence, indicating depolarization (Figure 6). Cells stimulated with 1 V/20 Hz or 5 V/20 Hz showed no change in fluorescence vs. control cells. Therefore, the membrane potential of ES cells remained unchanged.

3.6. Protein Adsorption

The influence of ES on the protein deposition of the media on the cover glass was determined. In a first study, we could prove that there is only a slight trend for an increased adsorption of total protein from the FBS-containing medium under ES (mean + s.e.m.; control: 4.08 ± 0.13 µg/mL, 1 V/20 Hz: 4.32 ± 0.05 µg/mL, 5 V/20 Hz: 4.28 ± 0.1 µg/mL; n.s.). Therefore, we additionally detected the attached extracellular matrix protein fibronectin via fluorescence microscopy on the cover glass after 10 min of ES. The samples stimulated with 1 V/20 Hz showed significantly increased fluorescence signals for fibronectin (Figure 7).

4. Discussion

Electrical impulses play a role in physiological processes in various tissues, such as bones [27]. Therefore, artificial electrical stimulation (ES) is a successful adjunct therapy in regenerative medicine [28,29,30,31,32], especially for bone regeneration [2,33]. However, the mechanisms of ES on cells and the environment still need to be understood. A previous study showed that initial cell adhesion and signaling are improved under ES. We could exclude medium-mediated effects of ES, such as changes in temperature, pH, and O2 content [12]. In the current study, we investigated the response of human MG-63 osteoblasts after 10 min of ES with the IonOptix multi-channel device under 1 and 5 V at a frequency of 20 Hz, respectively. The focus was on ES-mediated effects on cells’ hyaluronan coat, the zeta potential, the membrane potential, aquaporin expression, and on protein adsorption. We excluded an effect on cell viability after 24 h in earlier studies (Figure S1).
We confirmed our adhesion results from previous experiments conducted by Staehlke et al. [12]. The ES of suspended cells with 1 V/20 Hz enhanced their initial 10 min adhesion compared to the control (without ES). When calculated with a paired t-test, 5 V/20 Hz also yielded a significant result. The cell attachment depended on the serum content in the cell medium, because the cell adhesion was not increased without fetal bovine serum (FBS).
The overall adhesion was higher in samples stimulated without FBS, but these values are not significant due to the high variability of cell behavior and resulting high standard deviation. For the tendency of higher cell adhesion, we could explain this with a study by Demais et al. [34]. The group found that the initial adhesion of osteosarcoma cells was decreased on material surfaces that were coated with FBS, and only a few cells adhered after 5 or 30 min of incubation compared to coatings with poly-L-lysine, fibronectin, vitronectin, and collagen type I [34]. Also, hydroxyapatite surfaces coated with FBS induced less adherence and spreading in MG-63 cells than surfaces coated with fibronectin alone [35]. In FBS, both albumin and fibronectin are present. Still, albumin makes up the majority of proteins and, at 20–50 mg/mL, is 1000 times more abundant than fibronectin [36].
The positive effect of secreted fibronectin on cell adhesion and spreading was identified by Grinnell et al. [37]. Fibronectin was strongly adsorbed in our experiments due to 10 min of ES. MG-63 cells present the adhesion receptors for fibronectin, the α5β1 integrin subunit, which finds its prime target of fibronectin on the glass bottom [38,39]. It was found that BSA adsorption was higher during electrical stimulation with 1 V/cm for 1 h on composite hydrogels [40]. This could be correlated with higher cell adhesion and spreading and mBMSC cell genotype and phenotype changes in the direction of differentiated osteoblasts [40]. The research group of Garcia found that the adsorption of complex (e.g., lysozyme) and soft proteins (e.g., BSA or IgG) on conductive substrates can be modulated by the application of an external electric potential at 800 mV [41]. The proteins of the FBS-containing medium formed multiple layers under ES, which could be why more cells adhered as a result of ES.
The negatively charged pericellular matrix substance hyaluronan was described as the first initiator of cell adhesion [21,42]. Although electrically stimulated, osteoblasts did not adhere better if the hyaluronan coat was enzymatically destroyed. The thick hyaluronan coat [43] of osteoblasts could also be the reason for the unchanged surface charge of the osteoblasts. MG-63 osteoblasts exhibited a negatively charged cell surface of −13 mV, independently of ES. Furthermore, the membrane potential, which indicates the electrical potential difference between the intracellular and extracellular space resulting from the transport of ions through channels and transporters [44,45,46], could not be changed due to ES, as the experiments with DiBAC4(3) showed. Otherwise, Sun et al. were able to prove in their study that ES has an influence on the change in the ion gradient [47].
To further analyze membrane-related components under ES the expression of aquaporin channels were observed. We found that AQP 1 is strongly expressed in human MG-63 osteoblastic cells. The AQP 1 expression pattern is similar with cells from the Nucleus Pulposus in the central region of the intervertebral disc, which is rich in proteoglycans [48]. Snuggs et al. showed that AQP 1 and 5 expressions decreased when the intervertebral disc was degenerated, indicating a role of AQPs in hyperosmotic regulation [48]. In our experiments, after electrical stimulation with 1 and 5 V at 20 Hz, most AQPs showed a trend towards increased expression. Since the AQPs 1, 3, 5, 7, 8, and 9 are involved in the transport of hydrogen peroxide (H2O2) [16], the assumption of a connection between the expression changes in the AQPs and the H2O2 exposure is reasonable. Intracellular H2O2 concentrations that are too high exceed the capacity of antioxidant enzymes and can have a damaging effect [49]. On the other hand, after low-to-moderate H2O2 exposure, the expression of most AQPs increases to cope with the concentration balance. This conclusion is based on the fact that AQPs 3 and 5 have been shown to have a proliferation advantage under oxidative stress [50] and that physiological concentrations of hydrogen peroxide play an essential role in cellular signaling cascades. Therefore, physiological intracellular concentrations of H2O2 are necessary for cellular balance [49,50].
The influence of ES on internal cell structures was also demonstrated by flow cytometry and the evaluation of the FSC/SSC dot plot [51]. The forward scatter (FSC) is proportional to the size, and the side scatter (SSC) is proportional to the granularity of the cells [51]. Very few groups focused on ES and cell granularity [52,53,54]. In our short-time AC stimulation experiments, the granularity of MG-63 cells was increased after 10 min with 5 V and 20 Hz. Also, the authors Shteingauz et al. recognized increased cell granularity in diverse cell lines such as from epithelia, pancreas, and glioblastoma after applying tumor-treating fields (TTField) [55]. TTField is an antitumor treatment modality that applies 1–3 V/cm with kilohertz-frequency stimulation (100–300 kHz), which is nearly 10,000 times higher than we used. The cell granularity was not only shown by FACS, as in our experiments, but was also visible in images from ultra-structural scanning transmission electron microscopy (STEM). Autophagosomes and autolysosomes were seen in U-87 MG and A172 cells after TTField-application for 48 h [55].
As a conclusion to our findings, it is worth observing the expression of MG-63 cells’ transmembrane adhesion receptors in defined time frames after the short electrical stimulus, i.e., integrins with β1-, β3-, and α-subtypes as well as CD44 hyaluronan and syndecan receptors, which all are typically expressed in these osteoblastic cells [11].

5. Conclusions

Electrical impulses play a role in physiological processes in various tissues and cells. AC electrical stimulation at 20 Hz and 1 and 5 V was carried out with the multi-channel electrical stimulator IonOptix. AC stimulation enhanced the protein deposition of the matrix protein fibronectin from the culture medium. The 10 min short-time electrical stimulation of suspended human MG-63 osteoblasts promoted their attachment as well as their aquaporin 8 expression. Further membrane-related components like the cell’s hyaluronan coat, the zeta potential, or the membrane potential remained unchanged and did not seem to be responsible for the enhanced cell adhesion. Perspective studies should be focused on the expression of MG-63 cells’ transmembrane adhesion receptors in defined time frames after the short electrical stimulus, i.e., integrins, CD44, and syndecan receptors, which all are typically expressed in these osteoblastic cells. Understanding the substantial influence of electrical stimulation on the level of cells and their environment is crucial for therapeutic applications on human tissues.

Supplementary Materials

The following supporting information can be downloaded at https://www.mdpi.com/article/10.3390/app14020812/s1: Figure S1: Cell viability of MG-63 cells after short-term AC electrical stimulation.

Author Contributions

Conceptualization: S.S., B.N. and M.B.; methodology: M.E.B., M.B. and S.S.; software: M.E.B. and M.B.; validation, M.B., M.E.B. and S.S.; formal analysis: M.E.B., M.B. and S.S.; investigation: M.E.B. and M.B.; resources: B.N. and S.S.; data curation: S.S., M.B. and M.E.B.; writing—original draft preparation: B.N., M.E.B., M.B. and S.S.; writing—review and editing: B.N., S.S. and M.B.; visualization: M.B. and M.E.B.; supervision: B.N. and S.S.; project administration: B.N. and S.S.; funding acquisition: B.N. All authors have read and agreed to the published version of the manuscript.

Funding

This research was funded by the Deutsche Forschungsgemeinschaft (DFG, German Research Foundation), grant number SFB ELAINE, 1270/1,2-299150580.

Institutional Review Board Statement

Not applicable.

Informed Consent Statement

Not applicable.

Data Availability Statement

The data sets generated during and/or analyzed during the current study are available from the corresponding author on reasonable request. The data set is stored on the local Rostock University Medical Center (UMR) server.

Acknowledgments

We are grateful for the support of Julius Zimmermann (Institute of General Electrical Engineering, University of Rostock, Germany, now: University of Pavia, Italy). We acknowledge Christian Fettkenhauer (Anton Paar Germany GmbH) concerning his excellent support for Litesizer measurements. Furthermore, we would also like to thank Thomas Freitag (Bachelor thesis, Institute for Cell Biology, Rostock University Medical Center) for his work on cell vitality under ES.

Conflicts of Interest

The authors declare no conflict of interest.

References

  1. Vasquez-Sancho, F.; Abdollahi, A.; Damjanovic, D.; Catalan, G. Flexoelectricity in Bones. Adv. Mater. 2018, 30, 1705316. [Google Scholar] [CrossRef]
  2. Haglin, J.M.; Jain, S.; Eltorai, A.E.M.; Daniels, A.H. Bone Growth Stimulation: A Critical Analysis Review. JBJS Rev. 2017, 5, e8. [Google Scholar] [CrossRef] [PubMed]
  3. Busse, J.W.; Morton, E.; Lacchetti, C.; Guyatt, G.H.; Bhandari, M. Current management of tibial shaft fractures: A survey of 450 Canadian orthopedic trauma surgeons. Acta Orthop. 2008, 79, 689–694. [Google Scholar] [CrossRef] [PubMed]
  4. Eischen-Loges, M.; Oliveira, K.M.C.; Bhavsar, M.B.; Barker, J.H.; Leppik, L. Pretreating mesenchymal stem cells with electrical stimulation causes sustained long-lasting pro-osteogenic effects. PeerJ 2018, 6, e4959. [Google Scholar] [CrossRef] [PubMed]
  5. Mobini, S.; Leppik, L.; Thottakkattumana Parameswaran, V.; Barker, J.H. In vitro effect of direct current electrical stimulation on rat mesenchymal stem cells. PeerJ 2017, 5, e2821. [Google Scholar] [CrossRef] [PubMed]
  6. Pettersen, E.; Shah, F.A.; Ortiz-Catalan, M. Enhancing osteoblast survival through pulsed electrical stimulation and implications for osseointegration. Sci. Rep. 2021, 11, 22416. [Google Scholar] [CrossRef] [PubMed]
  7. Sahm, F.; Freiin Grote, V.; Zimmermann, J.; Haack, F.; Uhrmacher, A.M.; van Rienen, U.; Bader, R.; Detsch, R.; Jonitz-Heincke, A. Long-term stimulation with alternating electric fields modulates the differentiation and mineralization of human pre-osteoblasts. Front. Physiol. 2022, 13, 965181. [Google Scholar] [CrossRef]
  8. Dean, D.D.; Schwartz, Z.; Bonewald, L.; Muniz, O.E.; Morales, S.; Gomez, R.; Brooks, B.P.; Qiao, M.; Howell, D.S.; Boyan, B.D. Matrix vesicles produced by osteoblast-like cells in culture become significantly enriched in proteoglycan-degrading metalloproteinases after addition of beta-glycerophosphate and ascorbic acid. Calcif. Tissue Int. 1994, 54, 399–408. [Google Scholar] [CrossRef] [PubMed]
  9. Cifuentes, M.; García, M.A.; Arrabal, P.M.; Martínez, F.; Yañez, M.J.; Jara, N.; Weil, B.; Domínguez, D.; Medina, R.A.; Nualart, F. Insulin regulates GLUT1-mediated glucose transport in MG-63 human osteosarcoma cells. J. Cell. Physiol. 2011, 226, 1425–1432. [Google Scholar] [CrossRef]
  10. Gruening, M.; Neuber, S.; Nestler, P.; Lehnfeld, J.; Dubs, M.; Fricke, K.; Schnabelrauch, M.; Helm, C.A.; Müller, R.; Staehlke, S.; et al. Enhancement of Intracellular Calcium Ion Mobilization by Moderately but Not Highly Positive Material Surface Charges. Front. Bioeng. Biotechnol. 2020, 8, 1016. [Google Scholar] [CrossRef]
  11. Staehlke, S.; Rebl, H.; Nebe, B. Phenotypic stability of the human MG-63 osteoblastic cell line at different passages. Cell Biol. Int. 2019, 43, 22–32. [Google Scholar] [CrossRef]
  12. Staehlke, S.; Bielfeldt, M.; Zimmermann, J.; Gruening, M.; Barke, I.; Freitag, T.; Sylvia, S.; Van Rienen, U.; Nebe, B. Pulsed Electrical Stimulation Affects Osteoblast Adhesion and Calcium Ion Signaling. Cells 2022, 11, 2650. [Google Scholar] [CrossRef] [PubMed]
  13. Ercan, B.; Webster, T.J. The effect of biphasic electrical stimulation on osteoblast function at anodized nanotubular titanium surfaces. Biomaterials 2010, 31, 3684–3693. [Google Scholar] [CrossRef] [PubMed]
  14. Thannickal, V.J.; Fanburg, B.L. Reactive oxygen species in cell signaling. Am. J. Physiol. Lung Cell. Mol. Physiol. 2000, 279, L1005–L1028. [Google Scholar] [CrossRef] [PubMed]
  15. Leppik, L.; Oliveira, K.M.C.; Bhavsar, M.B.; Barker, J.H. Electrical stimulation in bone tissue engineering treatments. Eur. J. Trauma Emerg. Surg. 2020, 46, 231–244. [Google Scholar] [CrossRef] [PubMed]
  16. Zannetti, A.; Benga, G.; Brunetti, A.; Napolitano, F.; Avallone, L.; Pelagalli, A. Role of Aquaporins in the Physiological Functions of Mesenchymal Stem Cells. Cells 2020, 9, 2678. [Google Scholar] [CrossRef]
  17. Mobasheri, A.; Wray, S.; Marples, D. Distribution of AQP2 and AQP3 water channels in human tissue microarrays. J. Mol. Histol. 2005, 36, 1–14. [Google Scholar] [CrossRef]
  18. Snuggs, J.W.; Day, R.E.; Bach, F.C.; Conner, M.T.; Bunning, R.A.D.; Tryfonidou, M.A.; Le Maitre, C.L. Aquaporin expression in the human and canine intervertebral disc during maturation and degeneration. JOR Spine 2019, 2, e1049. [Google Scholar] [CrossRef]
  19. Edamana, S.; Login, F.H.; Yamada, S.; Kwon, T.-H.; Nejsum, L.N. Aquaporin water channels as regulators of cell-cell adhesion proteins. In: American journal of physiology. Cell Physiol. 2021, 320, C771–C777. [Google Scholar] [CrossRef]
  20. Finke, B.; Luethen, F.; Schroeder, K.; Mueller, P.; Bergemann, C.; Frant, M.; Ohl, A.; Nebe, J.B. The effect of positively charged plasma polymerization on initial osteoblastic focal adhesion on titanium surfaces. Biomaterials 2007, 28, 4521–4534. [Google Scholar] [CrossRef]
  21. Cohen, M.; Kam, Z.; Addadi, L.; Geiger, B. Dynamic study of the transition from hyaluronan- to integrin-mediated adhesion in chondrocytes. EMBO J. 2006, 25, 302–311. [Google Scholar] [CrossRef] [PubMed]
  22. Ercan, B.; Webster, T.J. Greater osteoblast proliferation on anodized nanotubular titanium upon electrical stimulation. Int. J. Nanomed. 2008, 3, 477–485. [Google Scholar] [CrossRef]
  23. Budde, K.; Zimmermann, J.; Neuhaus, E.; Schroder, M.; Uhrmacher, A.M.; van Rienen, U. Requirements for Documenting Electrical Cell Stimulation Experiments for Replicability and Numerical Modeling. In Proceedings of the Annual International Conference of the IEEE Engineering in Medicine and Biology Society (EMBC), Berlin, Germany, 23–27 July 2019; Volume 41, pp. 1082–1088. [Google Scholar] [CrossRef]
  24. Saldaña, L.; Bensiamar, F.; Boré, A.; Vilaboa, N. In search of representative models of human bone-forming cells for cytocompatibility studies. Acta Biomater. 2011, 7, 4210–4221. [Google Scholar] [CrossRef]
  25. Leif, R.C. Practical flow cytometry, by Howard M. Shapiro. Alan R. Liss, New York, 1985, 295 pages. Cytometry 1986, 7, 111–112. [Google Scholar] [CrossRef]
  26. Hoentsch, M.; Bussiahn, R.; Rebl, H.; Bergemann, C.; Eggert, M.; Frank, M.; von Woedtke, T.; Nebe, B. Persistent Effectivity of Gas Plasma-Treated, Long Time-Stored Liquid on Epithelial Cell Adhesion Capacity and Membrane Morphology. PLoS ONE 2014, 9, e104559. [Google Scholar] [CrossRef] [PubMed]
  27. Fukada, E.; Yasuda, I. On the Piezoelectric Effect of Bone. J. Phys. Soc. Jpn. 1957, 12, 1158–1162. [Google Scholar] [CrossRef]
  28. Mobini, S.; Leppik, L.; Barker, J.H. Direct current electrical stimulation chamber for treating cells in vitro. Biotechniques 2016, 60, 95–98. [Google Scholar] [CrossRef] [PubMed]
  29. Jin, G.; Yang, G.-H.; Kim, G. Tissue engineering bioreactor systems for applying physical and electrical stimulations to cells. J. Biomed. Mater. Res. Part B Appl. Biomater. 2014, 103, 935–948. [Google Scholar] [CrossRef]
  30. Griffin, M.; Bayat, A. Electrical Stimulation in Bone Healing: Critical Analysis by Evaluating Levels of Evidence. Eplasty 2011, 11, e34. [Google Scholar]
  31. Nicksic, P.J.; Donnelly, D.T.; Hesse, M.; Bedi, S.; Verma, N.; Seitz, A.J.; Shoffstall, A.J.; Ludwig, K.A.; Dingle, A.M.; Poore, S.O. Electronic Bone Growth Stimulators for Augmentation of Osteogenesis in In Vitro and In Vivo Models: A Narrative Review of Electrical Stimulation Mechanisms and Device Specifications. Front. Bioeng. Biotechnol. 2022, 10, 793945. [Google Scholar] [CrossRef]
  32. Pettersen, E.; Anderson, J.; Ortiz-Catalan, M. Electrical stimulation to promote osseointegration of bone anchoring implants: A topical review. J. NeuroEng. Rehabil. 2022, 19, 31. [Google Scholar] [CrossRef] [PubMed]
  33. Chen, C.; Bai, X.; Ding, Y.; Lee, I.-S. Electrical stimulation as a novel tool for regulating cell behavior in tissue engineering. Biomater. Res. 2019, 23, 25. [Google Scholar] [CrossRef]
  34. Demais, V.; Audrain, C.; Mabilleau, G.; Chappard, D.; Baslé, M.F. Diversity of bone matrix adhesion proteins modulates osteoblast attachment and organization of actin cytoskeleton. Morphologie 2014, 98, 53–64. [Google Scholar] [CrossRef] [PubMed]
  35. Vohra, S.; Hennessy, K.M.; Sawyer, A.A.; Zhuo, Y.; Bellis, S.L. Comparison of mesenchymal stem cell and osteosarcoma cell adhesion to hydroxyapatite. J. Mater. Sci. Mater. Med. 2008, 19, 3567–3574. [Google Scholar] [CrossRef] [PubMed]
  36. Freshney, R.I. Culture of Animal Cells. A Manual of Basic Technique and Specialized Applications, 6th ed.; Wiley-Blackwell: Hoboken, NJ, USA, 2010. [Google Scholar] [CrossRef]
  37. Grinnell, F.; Feld, M.K. Initial adhesion of human fibroblasts in serum-free medium: Possible role of secreted fibronectin. Cell 1979, 17, 117–129. [Google Scholar] [CrossRef] [PubMed]
  38. Lüthen, F.; Lange, R.; Becker, P.; Rychly, J.; Beck, U.; Nebe, J.G. The influence of surface roughness of titanium on b1- and b3-integrin adhesion and the organization of fibronectin in human osteoblastic cells. Biomaterials 2005, 26, 2423–2440. [Google Scholar] [CrossRef] [PubMed]
  39. Hynes, R.O. The dynamic dialogue between cells and matrices: Implications of fibronectin’s elasticity. Proc. Natl. Acad. Sci. USA 1999, 96, 2588–2590. [Google Scholar] [CrossRef]
  40. Xian, M.; Fang, L.; Liu, Y.; Wei, Q.; Hao, L.; Yu, Z.; He, X.; Wu, G. Electrical field induce mBMSCs differentiation to osteoblast via protein adsorption enhancement. Colloids Surf. B Biointerfaces 2022, 209 Pt 2, 112158. [Google Scholar] [CrossRef]
  41. Benavidez, T.E.; Torrente, D.; Marucho, M.; Garcia, C.D. Adsorption of Soft and Hard Proteins onto OTCEs under the influence of an External Electric Field. Langmuir 2015, 31, 2455–2462. [Google Scholar] [CrossRef]
  42. Zimmermann, E.; Geiger, B.; Addadi, L. Initial stages of cell-matrix adhesion can be mediated and modulated by cell-surface hyaluronan. Biophys. J. 2002, 82, 1848–1857. [Google Scholar] [CrossRef]
  43. Nebe, B.; Finke, B.; Lüthen, F.; Bergemann, C.; Schröder, K.; Rychly, J.; Liefeith, K.; Ohl, A. Improved initial osteoblast functions on amino-functionalized titanium surfaces. Biomol. Eng. 2007, 24, 447–454. [Google Scholar] [CrossRef] [PubMed]
  44. O’Hearn, S.F.; Ackerman, B.J.; Mower, M.M. Paced monophasic and biphasic waveforms alter transmembrane potentials and metabolism of human fibroblasts. Biochem. Biophys. Rep. 2016, 8, 249–253. [Google Scholar] [CrossRef] [PubMed]
  45. Khitrin, A.J.; Khitrin, K.A.; Model, M.A. A model for membrane potential and intracellular ion distribution. Chem. Phys. Lipids 2014, 184, 76–81. [Google Scholar] [CrossRef]
  46. Love, M.R.; Palee, S.; Chattipakorn, S.C.; Chattipakorn, N. Effects of electrical stimulation on cell proliferation and apoptosis. J. Cell. Physiol. 2018, 233, 1860–1876. [Google Scholar] [CrossRef] [PubMed]
  47. Sun, S.; Liu, Y.; Lipsky, S.; Cho, M. Physical manipulation of calcium oscillations facilitates osteodifferentiation of human mesenchymal stem cells. FASEB J. 2007, 21, 1472–1480. [Google Scholar] [CrossRef]
  48. Snuggs, J.W.; Tessier, S.; Bunning, R.A.B.; Shapiro, I.M.; Risbud, M.V.; Le Maitre, C.L. TonEBP regulates the hyperosmotic expression of aquaporin 1 and 5 in the intervertebral disc. Sci. Rep. 2021, 11, 3164. [Google Scholar] [CrossRef] [PubMed]
  49. Chidawanyika, T.; Supattapone, S. Hydrogen Peroxide-induced Cell Death in Mammalian Cells. J. Cell. Signal. 2021, 2, 206–211. [Google Scholar] [CrossRef] [PubMed]
  50. Rodrigues, C.; Pimpão, C.; Mósca, A.F.; Coxixo, A.S.; Lopes, D.; Da Silva, I.V.; Pedersen, P.A.; Antunes, F.; Soveral, G. Human aquaporin-5 facilitates hydrogen peroxide permeation affecting adaption to oxidative stress and cancer cell migration. Cancers 2019, 11, 29–34. [Google Scholar] [CrossRef]
  51. Adan, A.; Alizada, G.; Kiraz, Y.; Baran, Y.; Nalbant, A. Flow cytometry: Basic principles and applications. Crit. Rev. Biotechnol. 2017, 37, 163–176. [Google Scholar] [CrossRef] [PubMed]
  52. Gera, N.; Yang, A.; Holtzman, T.S.; Lee, S.X.; Wong, E.T.; Swanson, K.D. Tumor treating fields perturb the localization of septins and cause aberrant mitotic exit. PLoS ONE 2015, 10, e0125269. [Google Scholar] [CrossRef]
  53. Giladi, M.; Schneiderman, R.S.; Porat, Y.; Munster, M.; Itzhaki, A.; Mordechovich, D.; Cahal, S.; Kirson, E.D.; Weinberg, U.; Palti, Y. Mitotic disruption and reduced clonogenicity of pancreatic cancer cells in vitro and in vivo by tumor treating fields. Pancreatology 2014, 14, 54–63. [Google Scholar] [CrossRef] [PubMed]
  54. Giladi, M.; Schneiderman, R.S.; Voloshin, T.; Porat, Y.; Munster, M.; Blat, R.; Sherbo, S.; Bomzon, Z.; Urman, N.; Itzhaki, A.; et al. Mitotic Spindle Disruption by Alternating Electric Fields Leads to Improper Chromosome Segregation and Mitotic Catastrophe in Cancer Cells. Sci. Rep. 2015, 5, 18046. [Google Scholar] [CrossRef] [PubMed]
  55. Shteingauz, A.; Porat, Y.; Voloshin, T.; Schneiderman, R.S.; Munster, M.; Zeevi, E.; Kaynan, N.; Karnit, G.; Giladi, M.; Kirson, E.D.; et al. AMPK-dependent autophagy upregulation serves as a survival mechanism in response to Tumor Treating Fields (TTFields). Cell Death Dis. 2018, 9, 1074. [Google Scholar] [CrossRef] [PubMed]
Figure 1. Expression and localization of classic aquaporins (AQPs 1, 5, 8) and aquaglycerolporins (AQPs 3, 7, 9, 10) in human osteoblast-like MG-63 cells. AQPs 1, 5, 7, and 8 (green) are clearly visible. AQPs 3 and 10 were nearly not expressed, and therefore, cells were framed. (LSM780, Carl Zeiss, AQPs in green, nucleus in blue, scale bars 10 µm).
Applsci 14 00812 g001
Figure 2. Expression of AQPs in MG-63 cells after short-time AC electrical stimulation of 10 min. The respective unstimulated control was normalized to 1. (FACSCalibur; n = 3 independent experiments, mean ± s.e.m., RM one-way ANOVA post hoc Fisher´s LSD; * p ≤ 0.05).
Applsci 14 00812 g002
Figure 3. Flow cytometric analysis of cell size and granularity after 10 min AC electrical stimulation of suspended MG-63 cells. (a) Forward scatter (FSC) and side scatter (SSC) values. The respective unstimulated control was normalized to 1 (FACSCalibur; n = 3 independent experiments à 7 measurements, circa 7000 cells; mean ± s.e.m., two-way ANOVA multiple comparison test, Tukey’s test; * p ≤ 0.05, ** p ≤ 0.01). (b) Representative dot plot for FSC and SSC at 5 V/20 Hz (orange) and control (green). (c) Corresponding FSC and SSC histograms. Note the increase in cells’ granularity.
Applsci 14 00812 g003
Figure 4. The hyaluronan coat of MG-63 cells and their adhesion after electrical stimulation. (a) Fluorescence microscopy of cells’ hyaluronan coat (green) expressed in general (LSM780, Carl Zeiss, 40× water objective, nucleus in blue, scale bar 20 µm). (b) Adhesion of cells after 10 min ES in medium with FBS. (c) Adhesion of cells in medium without FBS. (d) Adhesion of cells treated with hyaluronidase (HAdase) in medium without FBS (all: mean ± s.e.m., n = 3–6 repeated measures, one-way ANOVA with Tukey’s multiple comparison test; * p ≤ 0.05).
Applsci 14 00812 g004
Figure 5. Litesizer measurements of MG-63 cells after 10 min electrical stimulation in the IonOptix chamber. (a) Zeta potential of MG-63s. Note that cells are negatively charged due to their spherical hyaluronan coat. ES did not change the cells’ surface charge. (b) Particle size of cell culture medium DMEM containing FBS. Note that no aggregates appear in the medium after ES (mean ± s.e.m., n = 3–4, one-way ANOVA with Tukey’s multiple comparison test, n.s.).
Applsci 14 00812 g005
Figure 6. Membrane potential of MG-63 cells after 10 min electrical stimulation in the IonOptix chamber. (a) Membrane potential via DiBAC4(3) fluorescence. Note that cells could change their membrane potential, resulting in depolarization induced by KCl but not under ES. (mean ± s.e.m., n = 3–4, one-way ANOVA with Tukey’s multiple comparison test; * p ≤ 0.05). (b) Representative histograms of DiBAC4(3)-stained cells. For positive control, cells were incubated in a 150 µM KCl-containing medium.
Applsci 14 00812 g006
Figure 7. Attached extracellular matrix protein fibronectin after 10 min ES of medium containing 10% FBS. A significantly higher amount of fibronectin was visible on the cover glass with 1 V/20 Hz. (a) Quantification of fibronectin from LSM images. The respective unstimulated control was normalized to 1. (b) Fluorescence images (LSM780, 63×, software ZEN 2.3 (blue edition) Histo, Carl Zeiss; mean ± s.e.m., n = 8, ANOVA with Tukey’s multiple comparison test, * p ≤ 0.05).
Applsci 14 00812 g007
Disclaimer/Publisher’s Note: The statements, opinions and data contained in all publications are solely those of the individual author(s) and contributor(s) and not of MDPI and/or the editor(s). MDPI and/or the editor(s) disclaim responsibility for any injury to people or property resulting from any ideas, methods, instructions or products referred to in the content.

