Abstract
Dyes are organic compounds capable of transmitting their color to materials, which is why they are widely used, for example, in textile fibers, leather, paper, plastic, and the food industry. In the dying process, measuring the dye’s content is extremely important to evaluate the process efficiency and minimize the dye’s discharge in wastewater, but most of the time, dyes are present in multi-component mixtures; hence, quantification by spectrophotometric methods presents a great challenge because the signal obtained in the measurement overlaps the components in the mixture. In order to overcome this issue, the use of the high-performance liquid chromatography (HPLC) method is recommended; however, it has the disadvantage of being an expensive technique, complex, and requiring excessive sample preparation. In recent years, some direct spectrophotometric methods based on multivariate regression algorithms for the quantification of dyes in bicomponent mixtures have been reported. This study presents a new framework that uses a combined ANN and principal component analysis (PCA) model for the determination of the concentration of three dyes in aqueous mixtures: Tartrazine (TZ), Amaranth Red (AR), and Blue 1 CFC (B1) dyes. The PCA–ANN model was trained and validated with ternary mixture samples of TZ, AR, and B1, and with known different compositions, spectra absorbance samples were measured in a UV-Vis spectrophotometer at wavelengths between 350–700 nm with intervals of 1 nm. The PCA–ANN model showed a mean absolute prediction error and correlation coefficient (r2) of less than 1% and greater than 0.99, respectively. The results demonstrate that the PCA–ANN model is a quick and highly accurate alternative in the simultaneous determination of dyes in ternary aqueous mixtures.
1. Introduction
Dyes are colored substances, usually organic compounds (natural or synthetic), with affinity to the substrate to which they are applied. Nowadays, more than one hundred thousand kinds of commercial dyes are utilized, with an annual production of over nine million tones [1]. Dyes have a wide range of applications: paints, plastics, textiles, leather, food, and cosmetics [1,2,3], and a large amount of these dyes are wasted during manufacturing and dying procedures, which generates a large volume of dye-containing wastewater [4,5]. Therefore, the measurement of dye concentrations is a key factor in the control of dyeing processes.
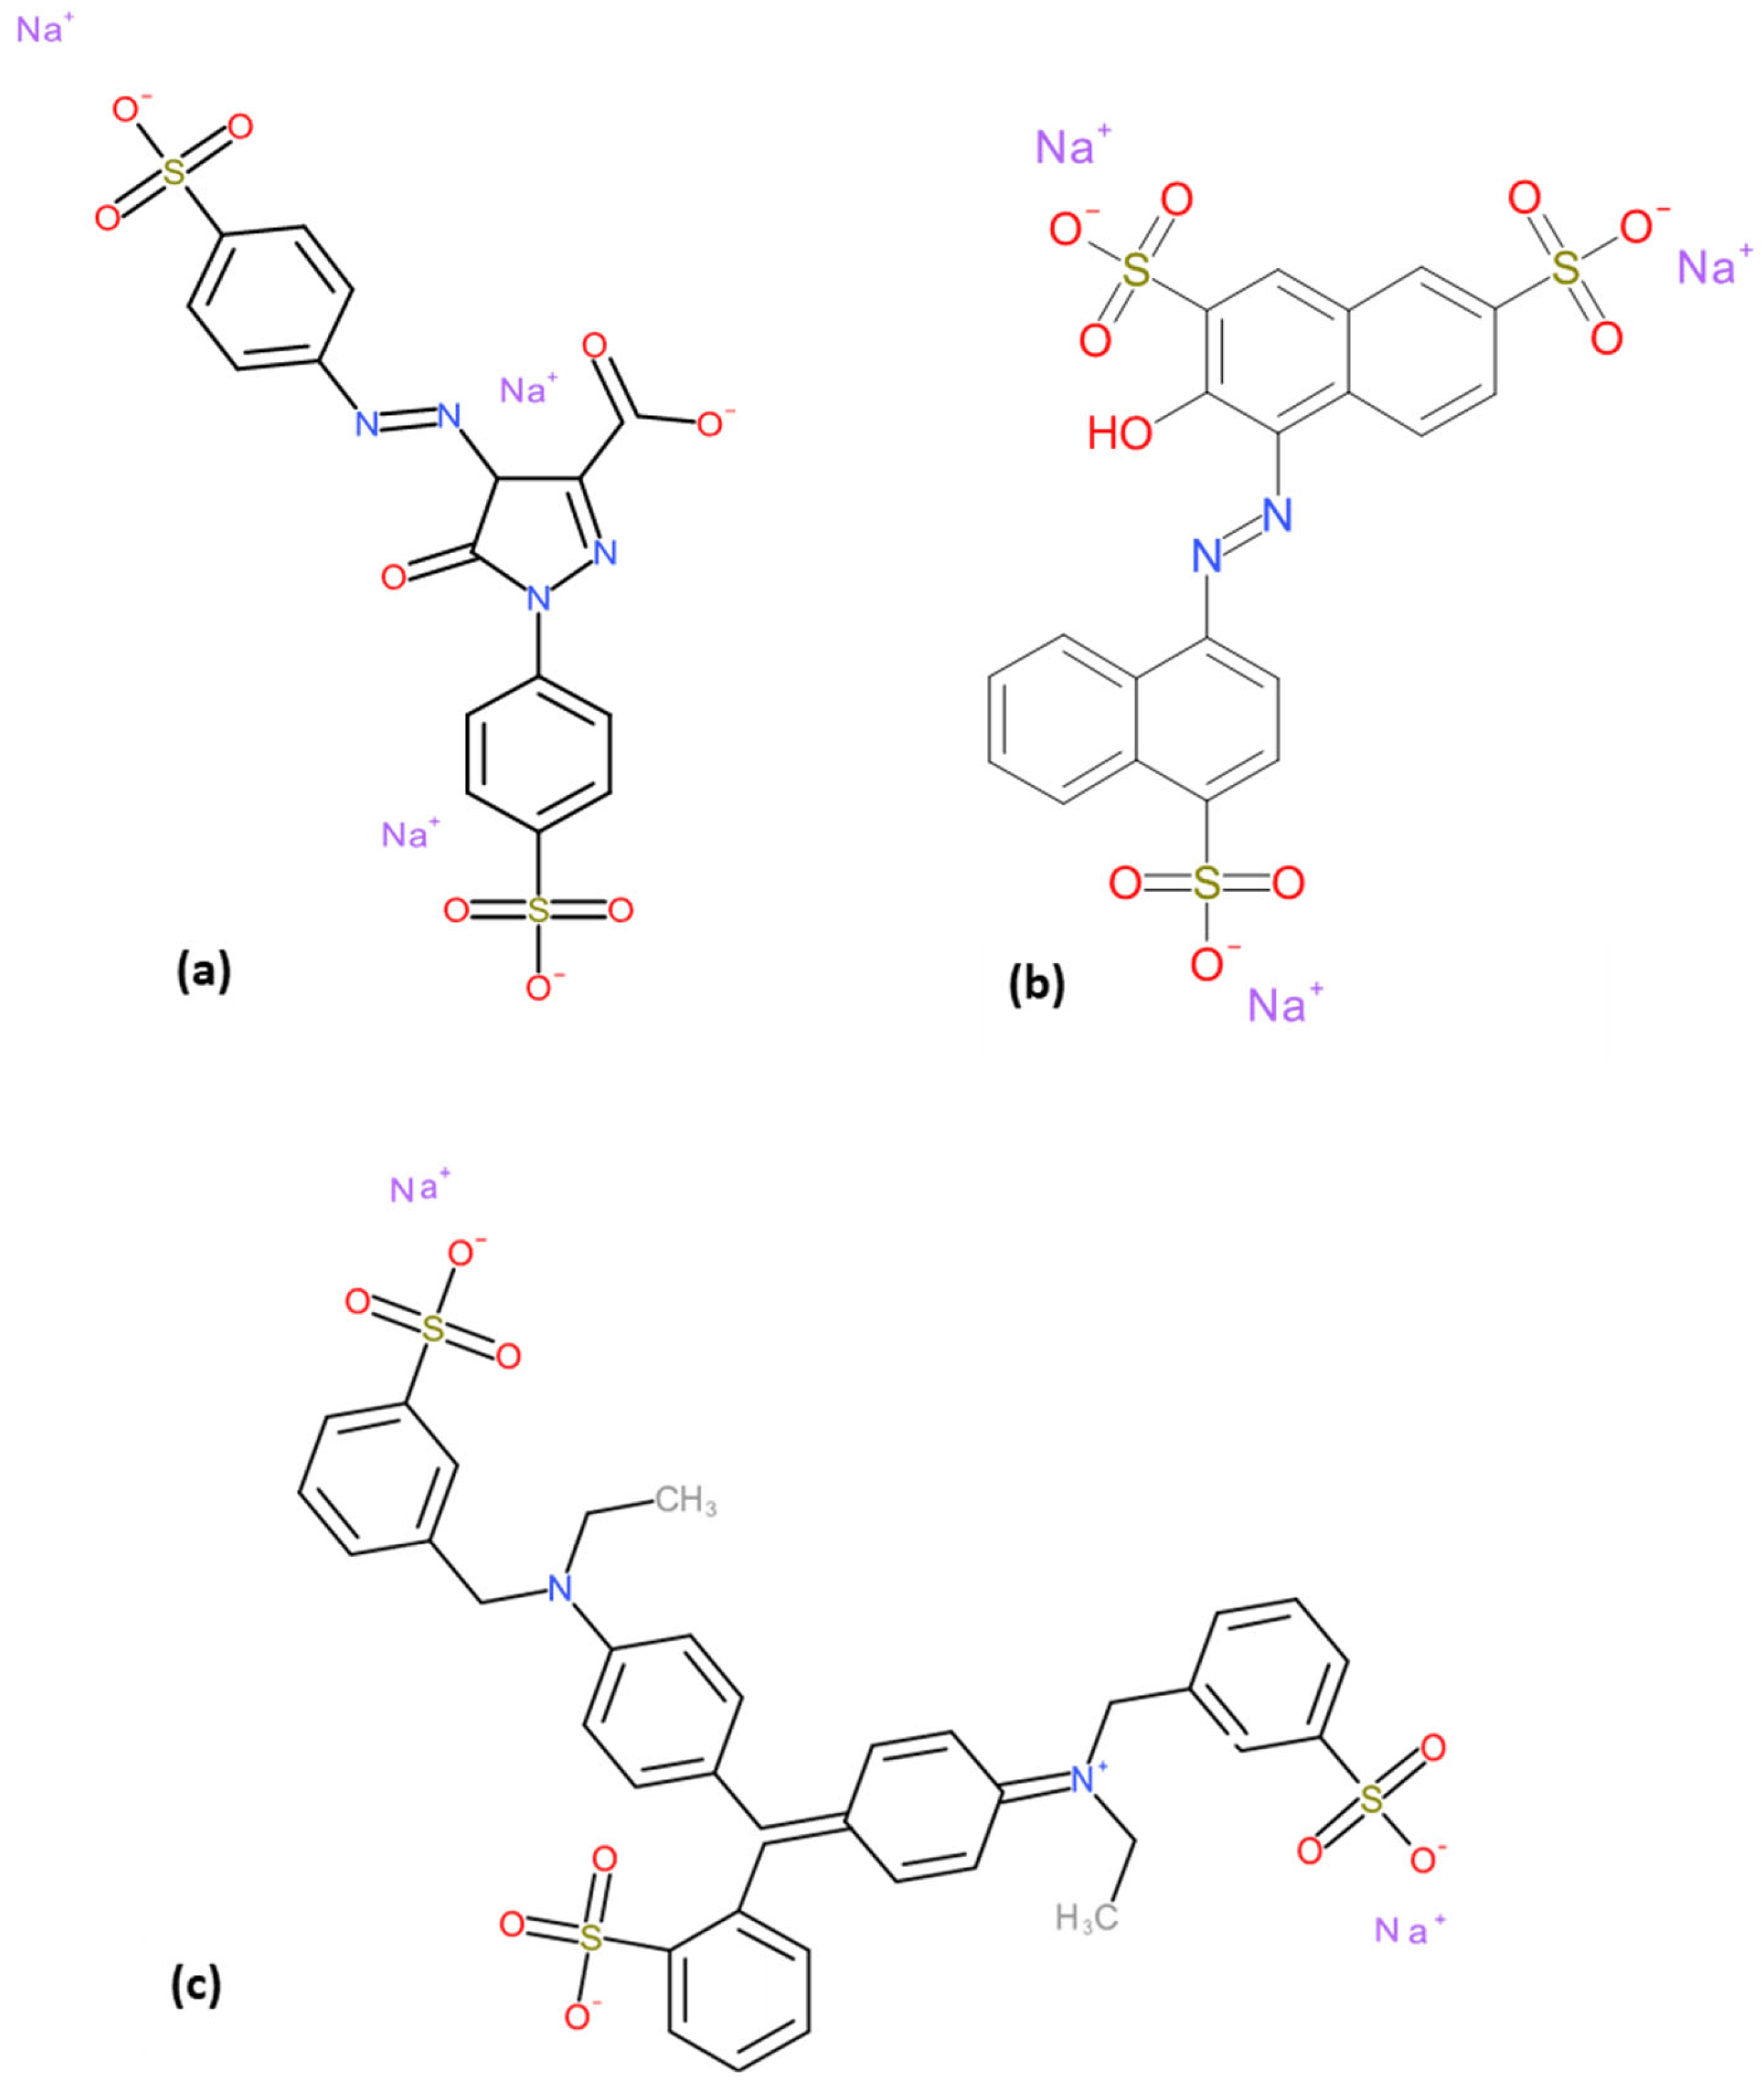
Tartrazine (TZ), with a molecular formula of , is an orange water-soluble dye with applications in food, cosmetic, textile, and pharmaceutical industries [6]. Amaranth red (AR), , is a synthetic colorant that can be found in common food products such as beverages, dry mix products, candy, and bakery products [3,7]. Brilliant Blue FCF (B1), , is used as a food dye in ice cream, candies, drinks, and other products [8]. These dye contents are strictly controlled since they can prompt allergies and other diseases in sensitive people [9,10,11]. The chemical structures of TA, AR, and B1 are illustrated in Figure 1.
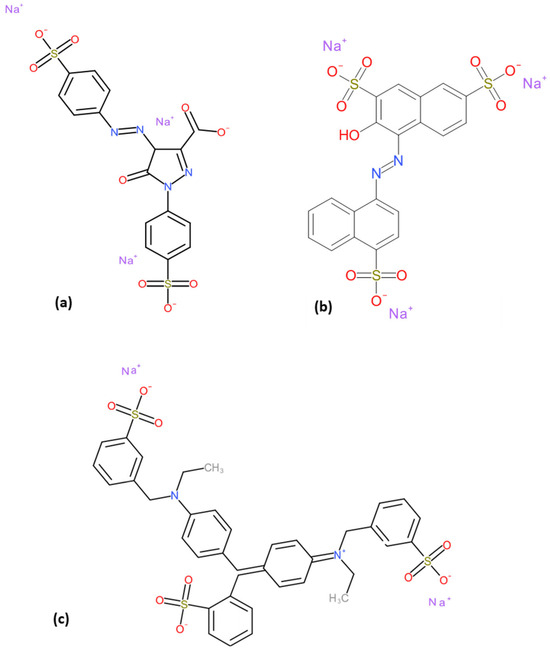
Figure 1.
Chemical structure of (a) TZ, (b) AR and (c) B1.
Dye mixture concentration levels in water or wastewater can be determined by high-performance liquid chromatography (HPLC) [12,13,14], gas chromatography/mass spectrometry [15], and liquid mass spectrometry/chromatography [16]. However, chromatographic determination of dyes in mixtures is a laborious and time-consuming procedure [16]. The UV-Vis spectrophotometric technique can also be used for this purpose because dyes are highly absorbent species in the visible region, and the technique has a low operating cost and is a relatively simple procedure [13,17,18]. One of the common challenges for the spectrophotometric technique in multi-component dye mixtures is the fact that, usually, mixtures present the superposition or overlapping of the absorption spectra, which prevents them from being determined by direct measurement by UV-Vis spectrophotometry [17].
In recent years, novel algorithms calibrated using UV-Vis spectrophotometry data for the simultaneous estimation of chemical constituents in binary and ternary aqueous mixtures have been developed. For example, A. J. Jadhav and co-workers [18] focused on a genetic algorithm (GA) along with partial least-squares (PLS) regression for Nitrobenzene, aniline, and phenol concentrations for the determination of individual components in ternary synthetic mixtures. A. Mostafa et al. [19] reported the usage of a multivariate curve resolution (MCR-ALS) alternating with PLS regression for the determination of Beta-Antagonists in complex matrices, and K.F. Alsamarrai and S.T. Ameen [20] used derivative spectrophotometry for the simultaneous determination of Paracetamol, Caffeine, and Ibuprofen in their ternary mixture. In these investigations, the authors were able to analyze the mixtures with high overlapping absorption spectra without the need for the prior separation of the species.
On the other hand, very recently, the use of machine learning models like artificial neural networks (ANN) have been implemented to solve problems in very diverse areas, like engineering and science [21], because ANNs are considered tools that can help us to analyze variable relationships in complex systems from large datasets [22]. However, the performance of conventional ANNs depends strongly on the size of the input data and large variables in the data, which may contain redundant information, which would increase the complexity of the computation.
In this respect, to improve the ANN performance of implemented models, some researchers, such as those in [23,24,25,26], have combined ANN models with a principal component analysis (PCA) to create new features based on the original variables in order to reduce the dimensions, resulting in a favorable prediction performance of the ANN in their respective applications.
The concentration measurement of TZ, AR, and B1 mixture dyes in aqueous solutions cannot be carried out directly by UV-VIS spectrophotometry due to the overlapping of their absorption spectra. Although, in recent years, various direct spectrophotometric determinations of dyes in aqueous mixture methods have been reported, the use of an ANN and PCA coupled model has not been used for this purpose. This study presents a new framework in which the use of a combined ANN and principal component analysis (PCA) model serves as an alternative for the concentration determination of three dyes in aqueous mixtures: Tartrazine (TZ), Amaranth Red (AR), and Blue 1 CFC (B1) dyes.
2. Materials and Methods
2.1. Data Collection
Three dyes with a wide variety of applications in different industries were selected: Tartrazine (C.I. number 19150), Amaranth Red (C.I. number 16185), and Brilliant Blue CFC (C.I.42090) obtained from Aceites y esencias Company. The dye standard and sample solutions were prepared in deionized water (D.W).
Standard mother stock solutions (100 mg/L) for each dye were prepared by dissolving appropriate amounts of each compound in deionized water. A total of 64 ternary diluted solutions were prepared by the dilution of the standard mother stock solution; dye concentrations varied from 0 to 20 mg/L for TZ and AR dyes and 0 to 10 mg/L for B1 dye. Table 1 shows the concentration values of the 64 ternary dye mixture samples prepared in laboratory.

Table 1.
Concentration data (mg/L) of the set of samples.
The absorption UV-Vis spectra of the 64 samples were carried out in duplicate, and measurements were scanned over wavelength range from 350 to 700 nm, with a spectral bandwidth parameter setting in Δλ = 1 nm for all experiments.
All spectra and absorbance measurements were recorded with Perkin-Elmer UV-Vis spectrophotometer model Lambda 35 and a 1.0 cm matched quartz cell.
2.2. PCA Model
PCA is a classical statistical method that aims to transform the attributes of a dataset into a new set of uncorrelated attributes called principal components (PCs). One of the main uses of PCA is to reduce the dimensionality of a dataset in such a way that it retains as much of the variability of the original dataset as possible [27]. Dataset with a number of variables and a number of observations can be expressed as a matrix with row-vectors each with length , as shown in Equation (1) [28].
The matrix is required to linearly transform into matrix by means of a matrix with raw vectors and column vectors of matrix , as can be seen in Equation (2).
The projection of the original dataset on the columns of is achieved through the dot product showed in Equation (2). The rows of matrix are a new basis that signifies the principal component directions.
In our case, the results obtained from absorption spectra of samples represent the matrix , which means that from each 64 ternary dye solution sample UV-Vis spectrophotometric measurement, we obtain a vector with 350 characteristics; the aim of PCA method is to reduce the number of characteristics data to their essential features, which are principal components (PCs). UV-Vis spectra of the 64 samples were handled with the library of Numpy package of the programming language Python.
PCA method was carried out with the use of the sklearn.decomposition module included in the package of the language programming Python.
2.3. ANN Model
Artificial neural networks have recently become powerful tools for machine learning that mimic the human brain’s biological neural networks, which make them a powerful method for solving a large variety of complex problems. A typical ANN architecture is completely well-defined by three layers (an input layer, one or more hidden layers, and an output layer), where each layer has a specific number of neurons that are linked to each other [29].
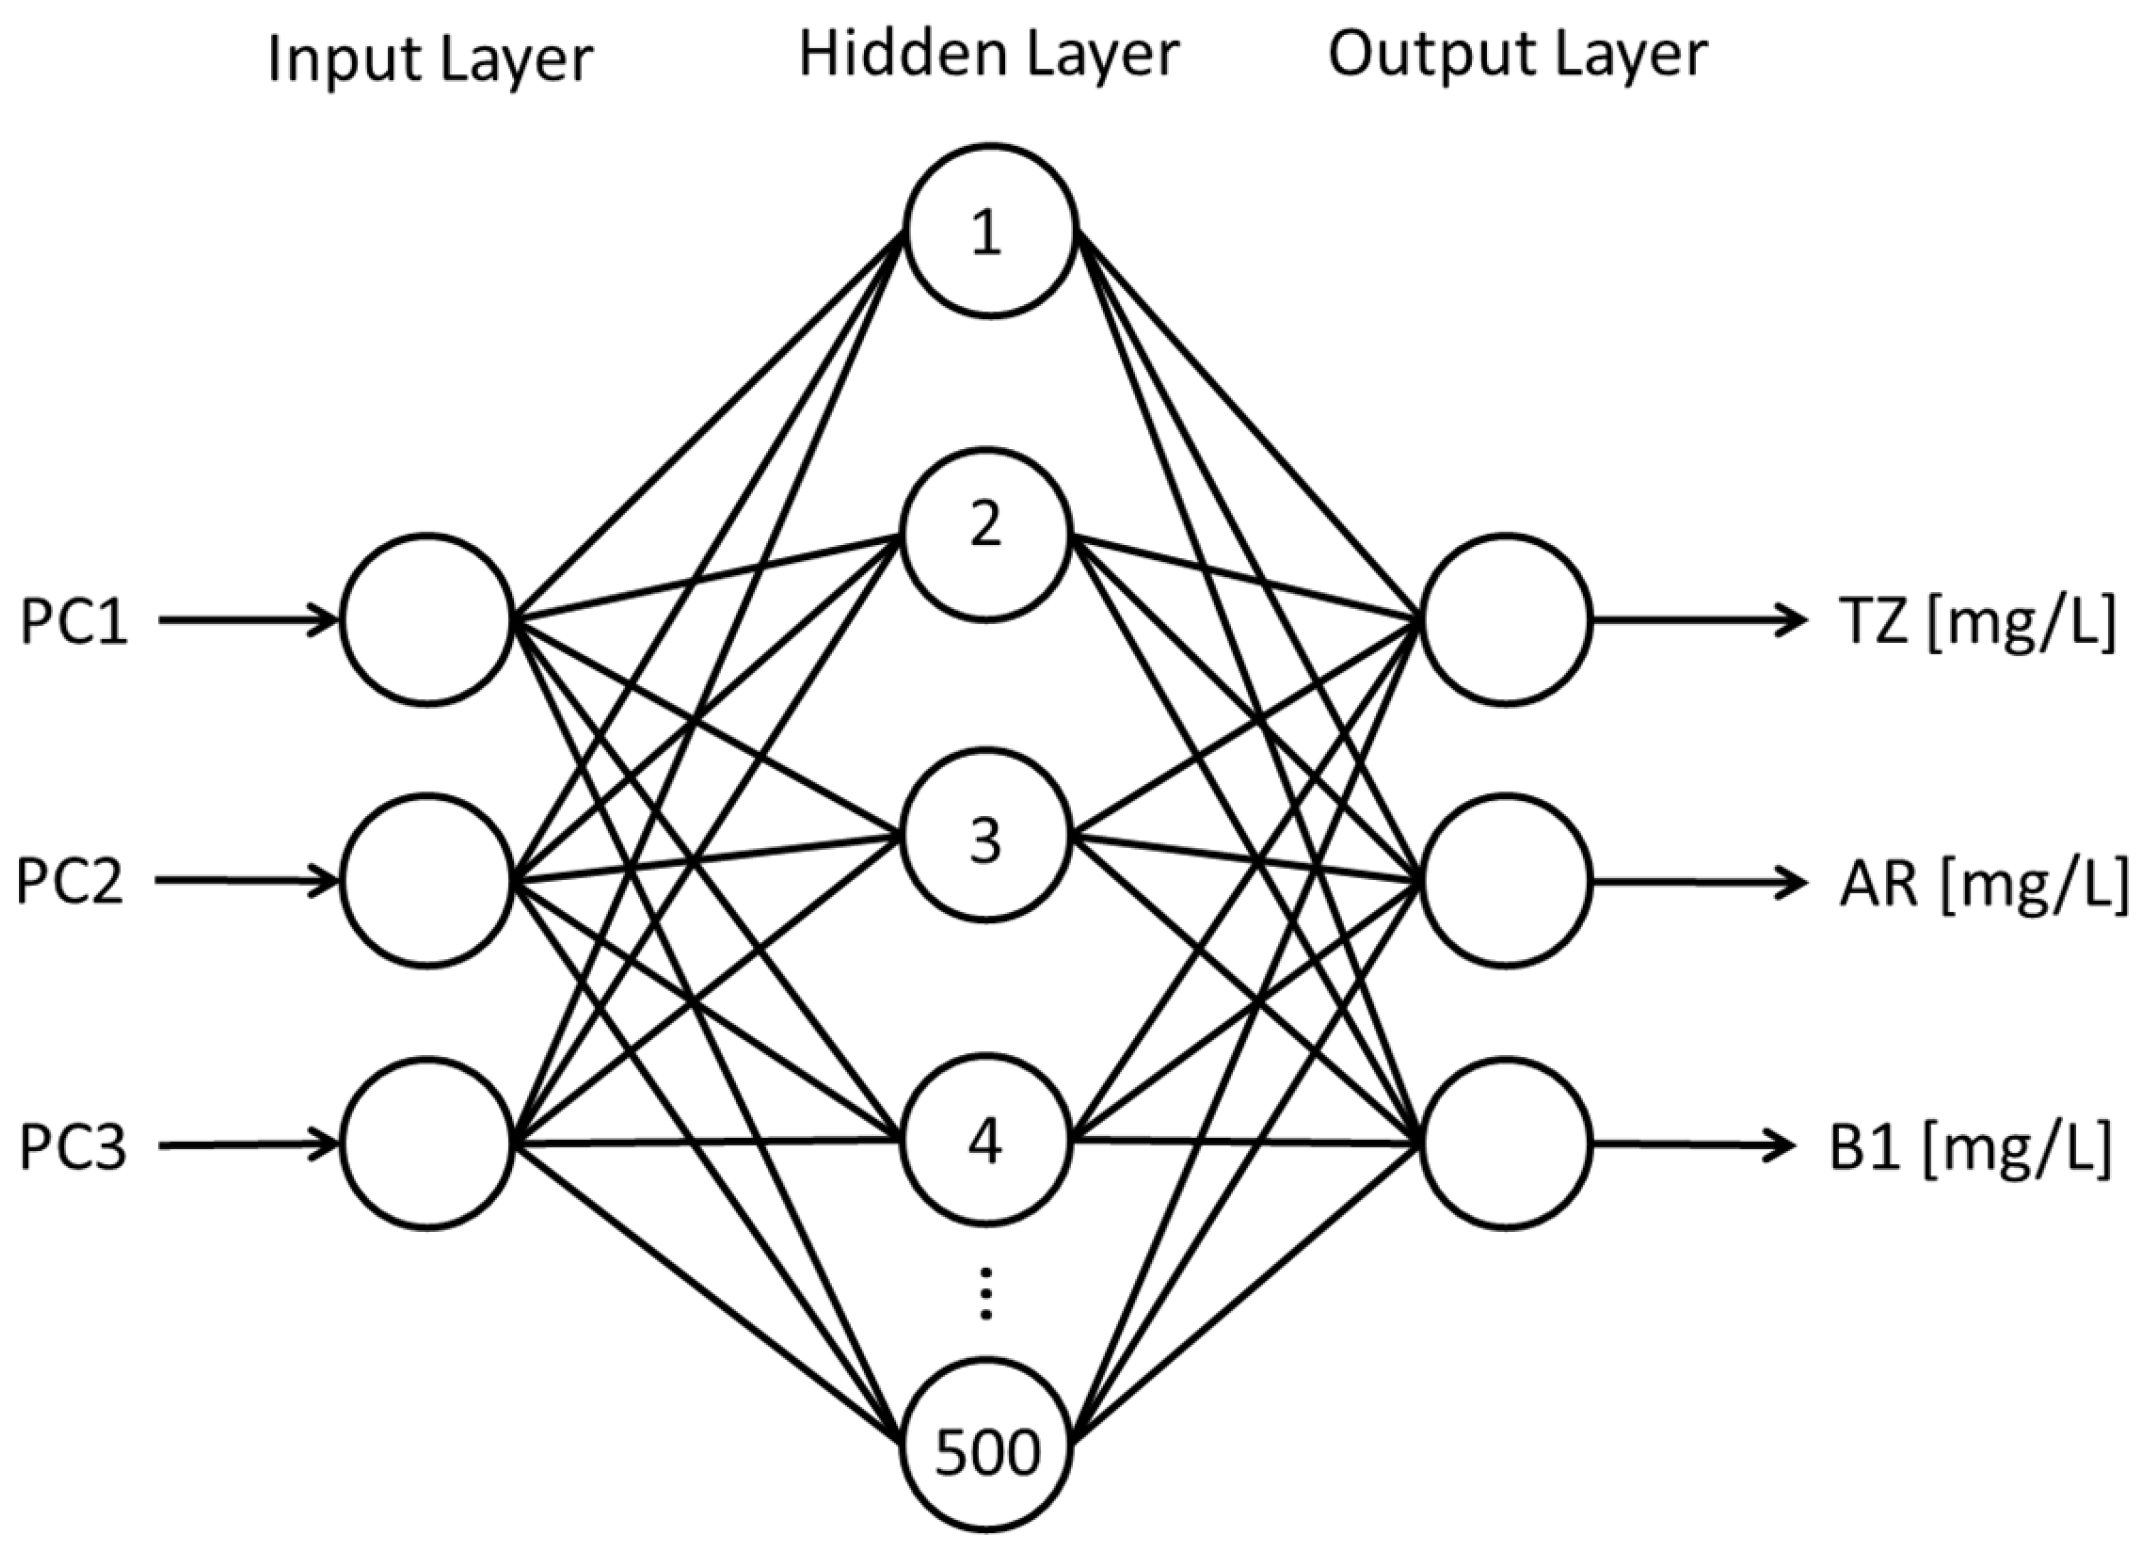
In this work, the ANN architecture consisted of the PCs obtained from PCA model as input variables; the number of neurons in the hidden layer was optimized from 1 to 1000 by iterative tuning, configuration, and three output layers (concentrations of each dye in the mixture in mg/L). Figure 2 shows the optimal ANN architecture.

Figure 2.
Architecture of the ANN in this study.
We divided the dataset into training samples (75%) and testing samples (25%). To improve the ANN stability and prediction performance, the PC’s input data were standardized with Equation (3) so that the mean of observed values is 0 and the standard deviation is 1.
With mean:
And standard deviation:
where n is the number of data points, denote the input data, and are the mean and standard deviation of input data, respectively.
The accuracy of the ANN model was measured by the coefficient of determination (r2) and the mean absolute prediction error (MAPE) of both training and testing datasets, as shown in Equations (6) and (7), respectively.
where n is the number of data points, denotes the estimated obtained from the ANN model, and are the observed and mean of the data, respectively. A summary of the parameters used in the ANN model is presented in Table 2.
Table 2.
Summary of learning parameters of the ANN model.
ANN method was carried out with the use of the sklearn.neural_network module and MLPRegressor function of the language programming Python.
3. Results and Discussions
3.1. Spectrophotometry Data Acquisition
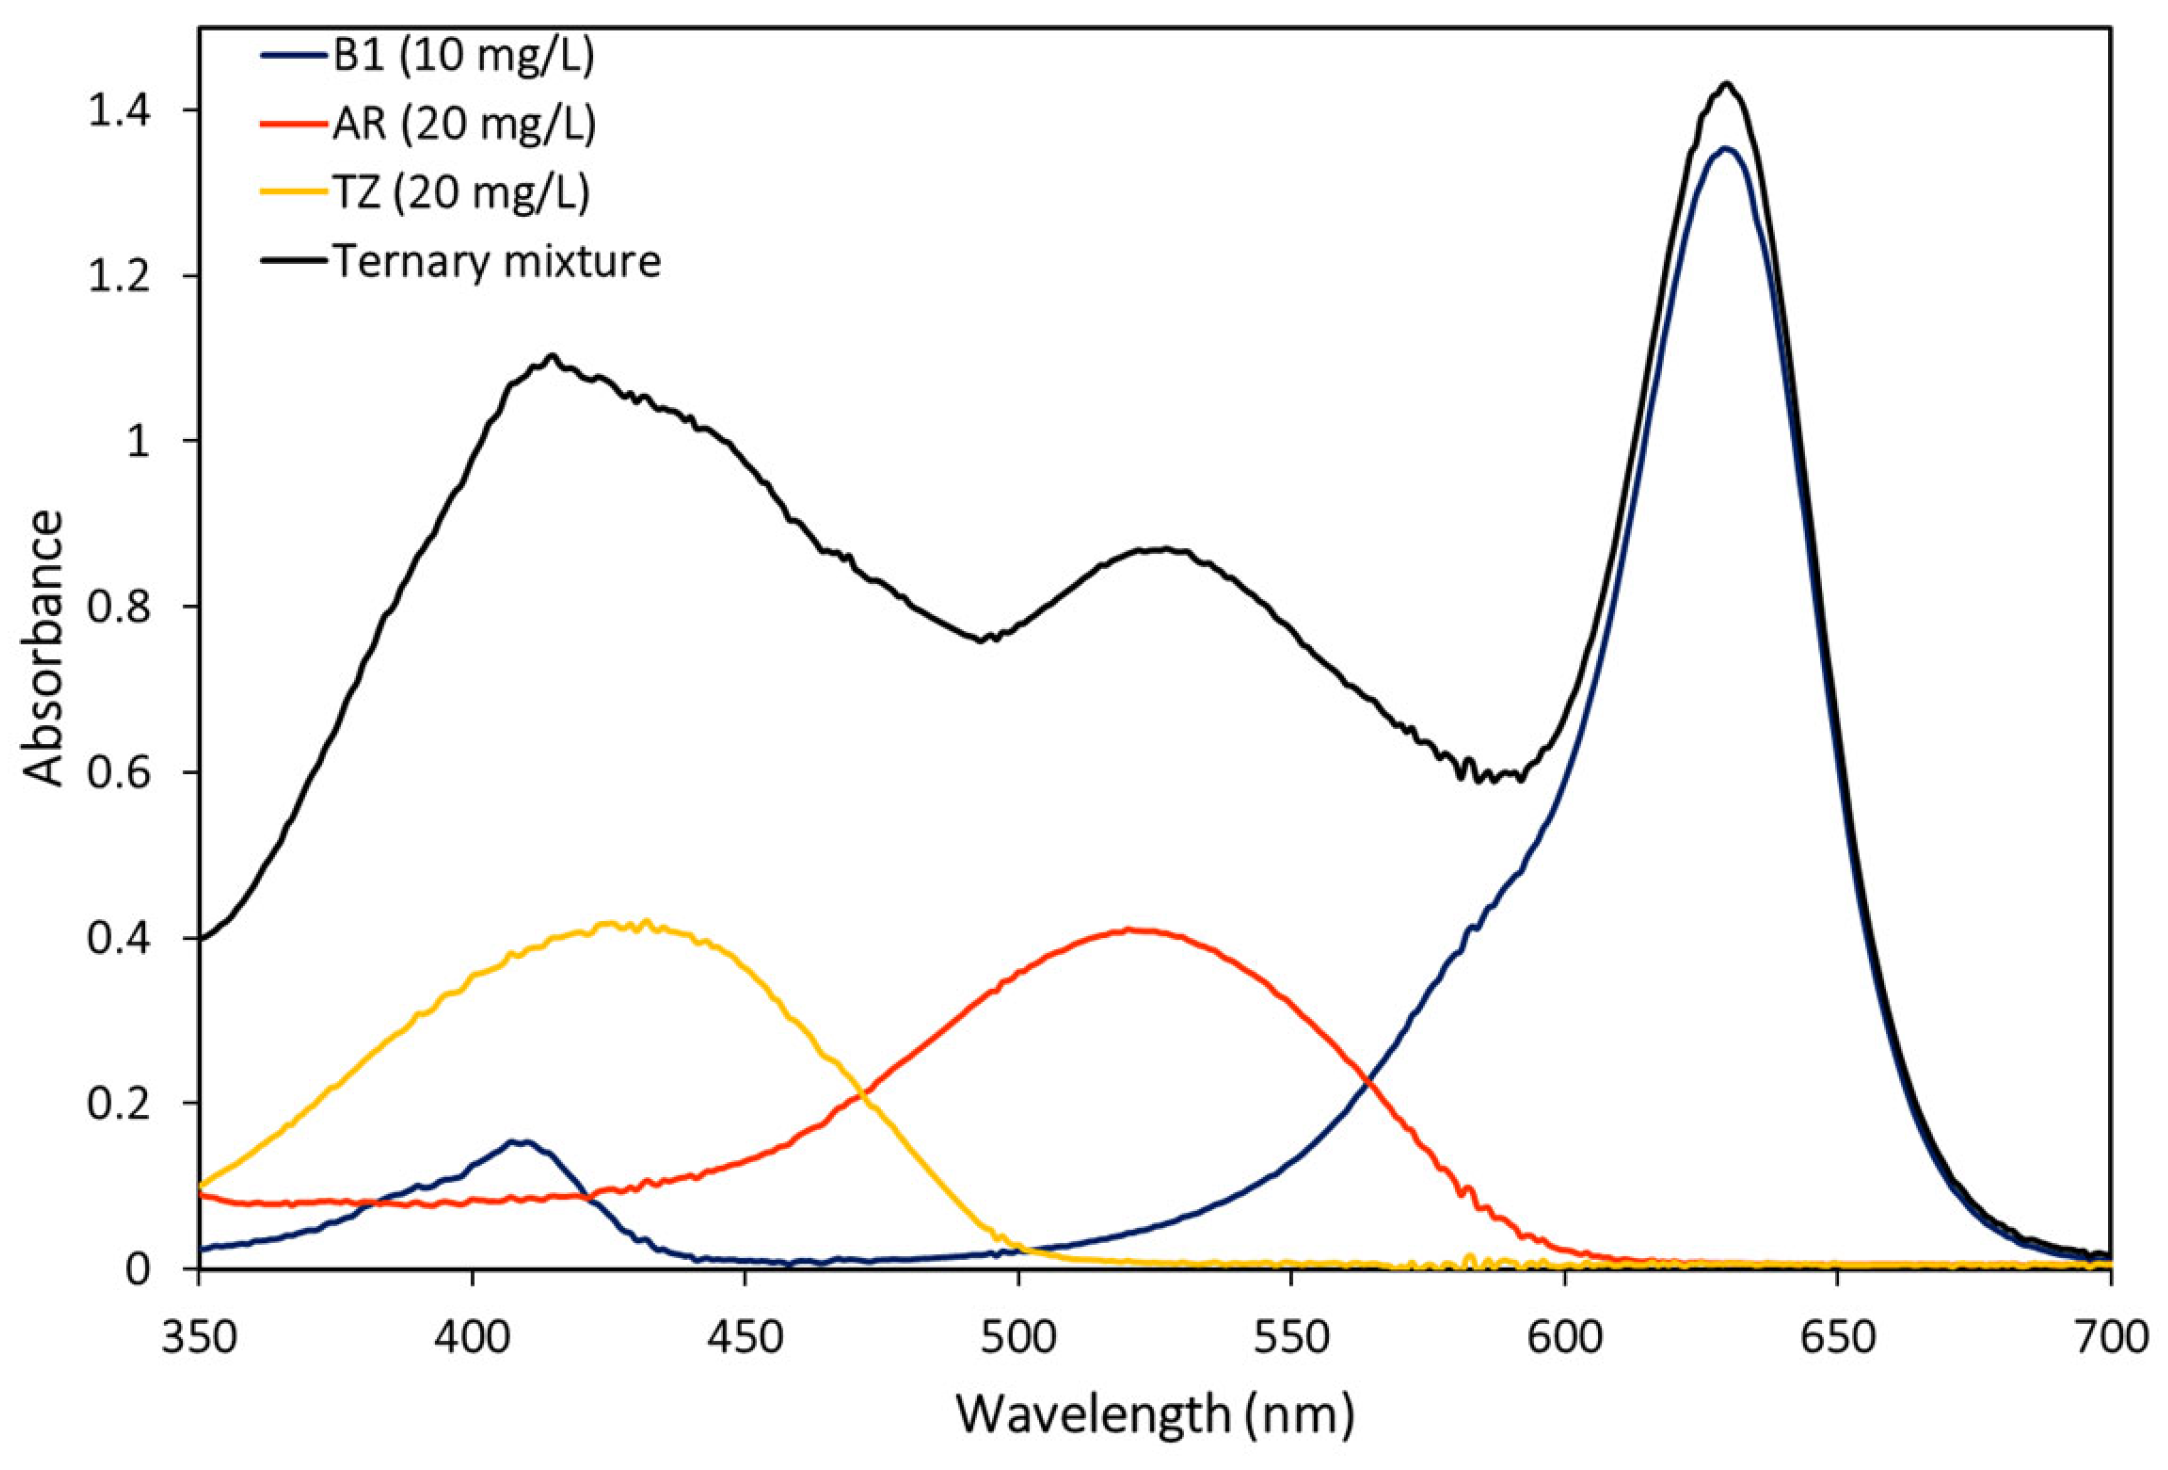
Figure 3 presents the outcomes of absorption spectra from the UV-Vis spectroscopy analysis of pure B1, AR, and TZ dyes and the ternary mixture samples in the wavelength range from 350 to 700 nm.
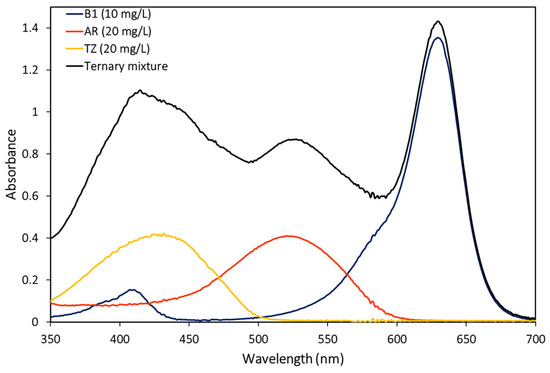
Figure 3.
UV-Vis spectra of pure and ternary dye solutions.
It can be observed from Figure 3 that the absorption spectra bands of all three pure dye samples are not very widely separated and overlap each other, which causes small shoulders or peaks from the total spectrum (ternary mixture), and this makes it impossible to determine the concentration of the individual components of the mixture by a simple direct spectrophotometric method.
The absorption spectra of all sixty-four prepared solutions with different concentrations of B1, AR, and TZ dyes are presented in Figure 4; different color to each single spectra are presented for better visualization, so that the differences in shape can be seen, which are due to the variation of the concentration values of the three dyes in each mixture.
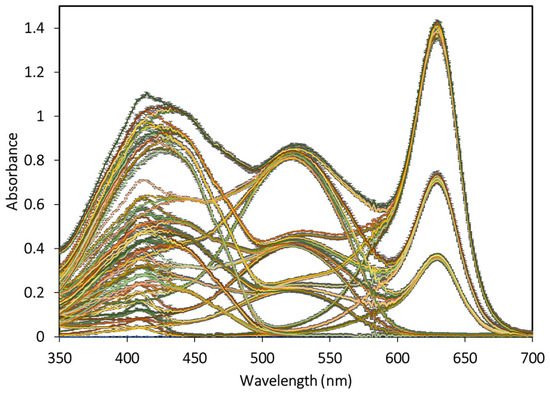
Figure 4.
UV-Vis spectra of 64 samples of dye solutions with different concentration.
3.2. Principal Component Analysis (PCA)
Spectral data from the 64 samples of the dye solutions can be represented as a matrix X with row-vectors and length, where number of variables (UV-Vis spectroscopy analysis wavelength range), and number of observations (samples), resulting in a size of X matrix (64 × 350).
The mathematical method underlying the principal component analysis was used in the spectral data from the 64 samples of dye solutions to reduce the dimensionality of the dataset. PCA was performed in Python using the scikit-learn library; the cumulative total variance of the top three principal components equaled up to 99.4%; in other words, three new noncorrelated variables (principal components) retained a maximal total variance explained by the 350 variables from the original data.
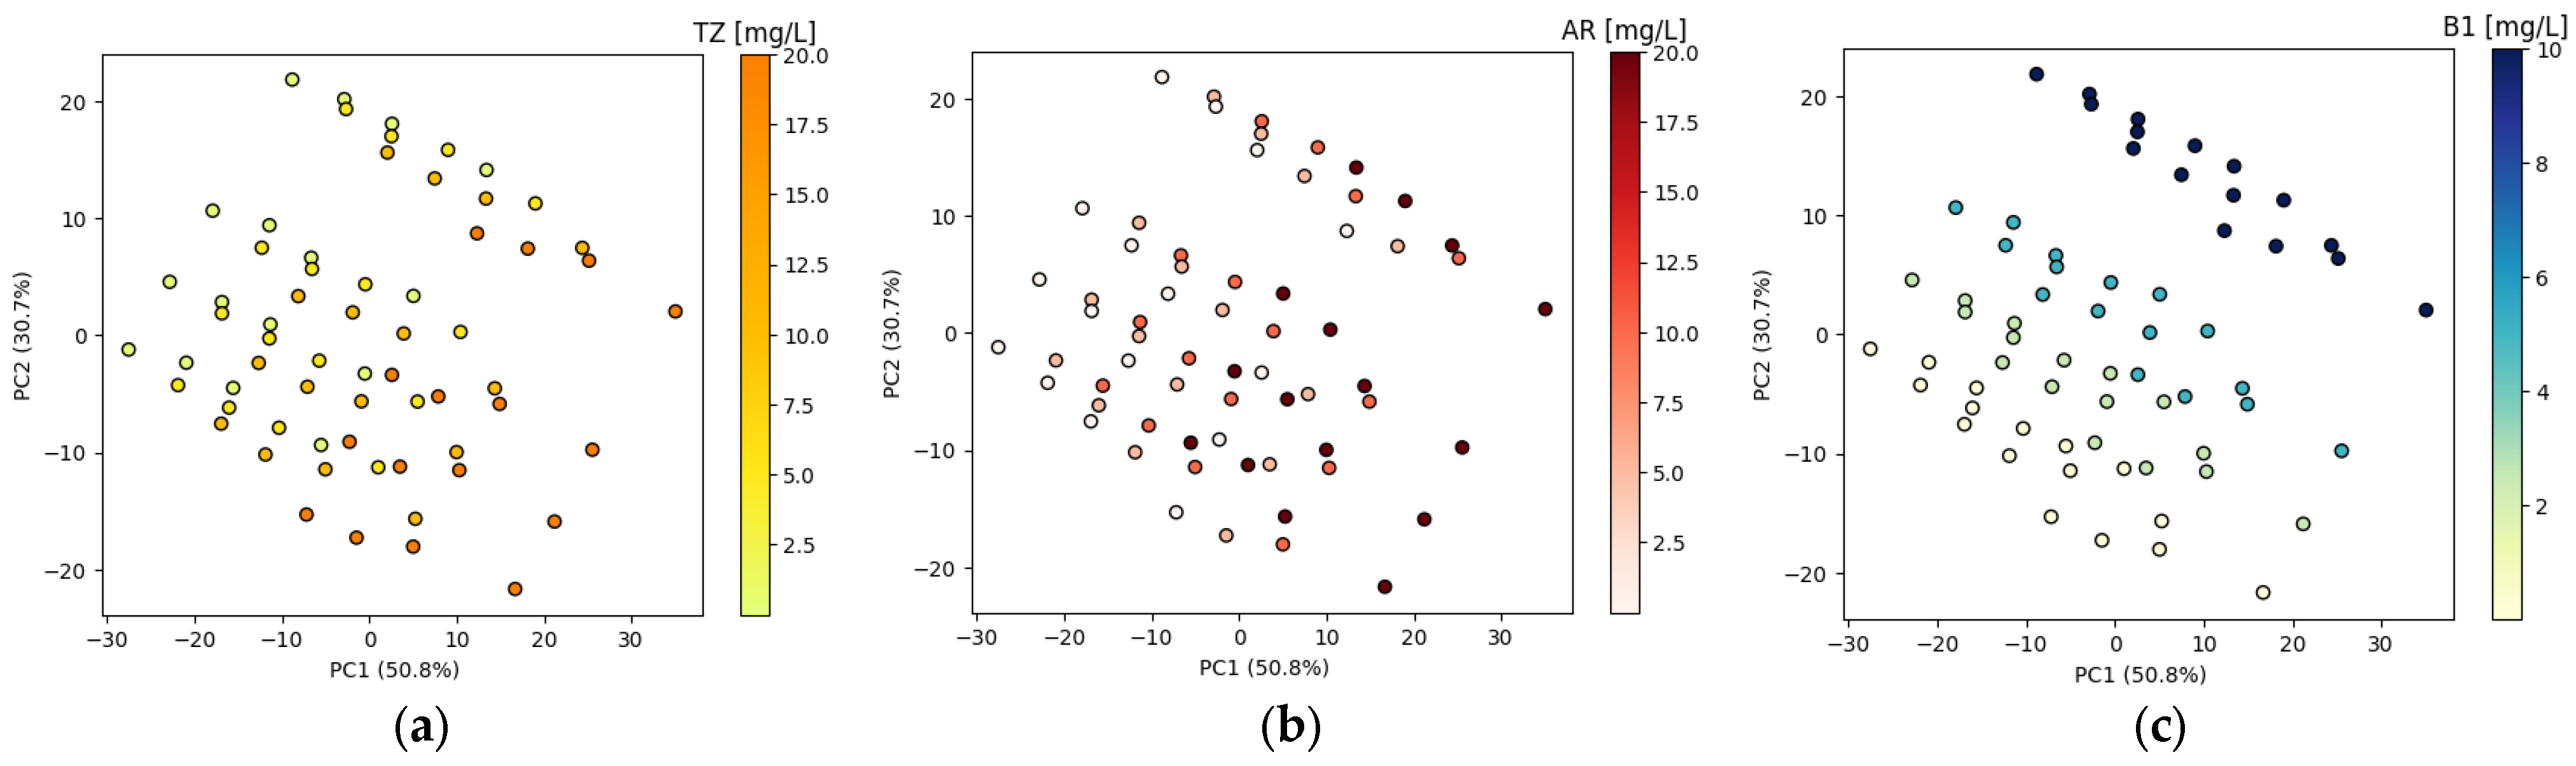
In order to visualize the results of the PCA, the score plots of PC1 versus PC2 and PC1 versus PC3 were plotted, as can be seen in Figure 5 and Figure 6, respectively; the points are labeled based on dye concentrations of the sample ID, as can be seen from Table 1.

Figure 5.
Principal component analysis (PCA) score plot using the first and second principal components, PCA points are labeled based on (a) TZ, (b) AR and (c) B1 dyes concentrations.

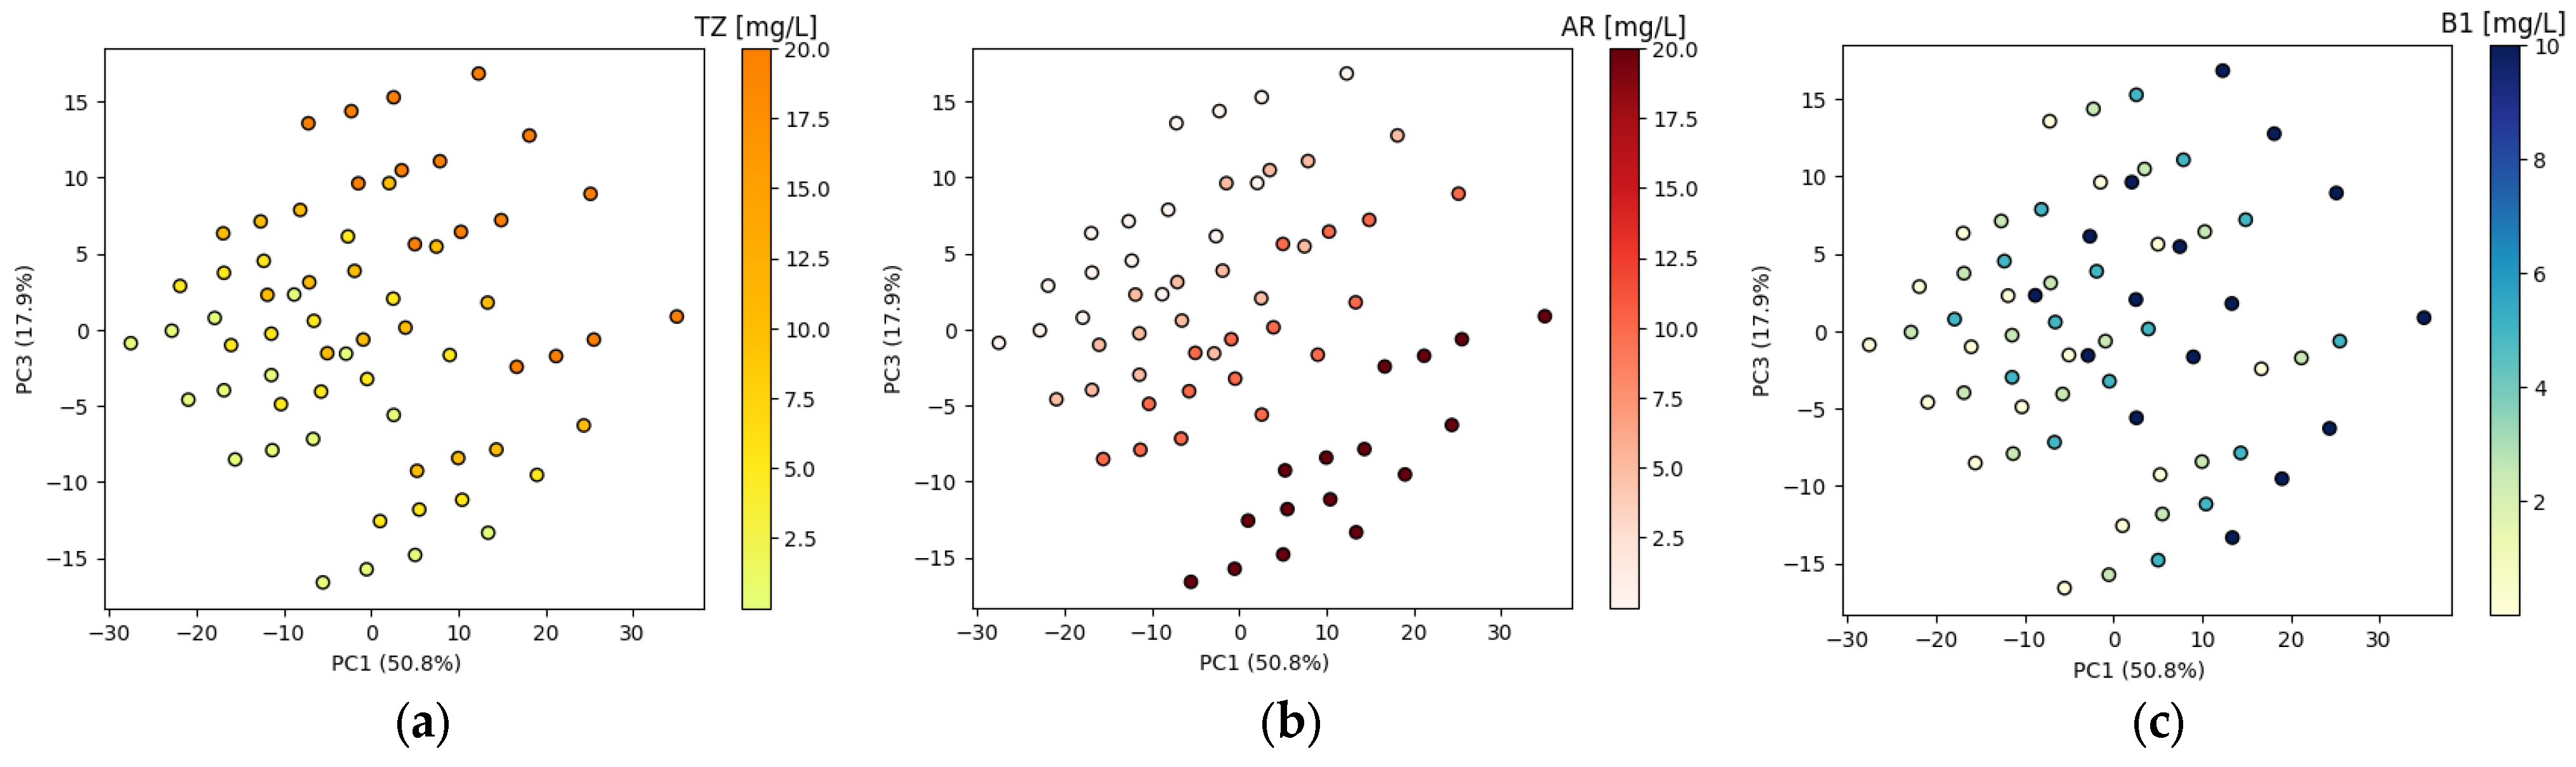
Figure 6.
Principal component analysis (PCA) score plot using the first and third principal components; PCA points are labeled based on (a) TZ, (b) AR and (c) B1 dyes concentrations.
From the score plots shown in Figure 5, we noticed that the first and second principal components had a strong relationship with the B1 dye concentration, given that the data separated into three appreciable clusters (Figure 5c). Figure 6 shows three clusters for TZ and AR concentration classes along the PC2 dimension (Figure 6a,b, respectively).
3.3. Artificial Neural Networks
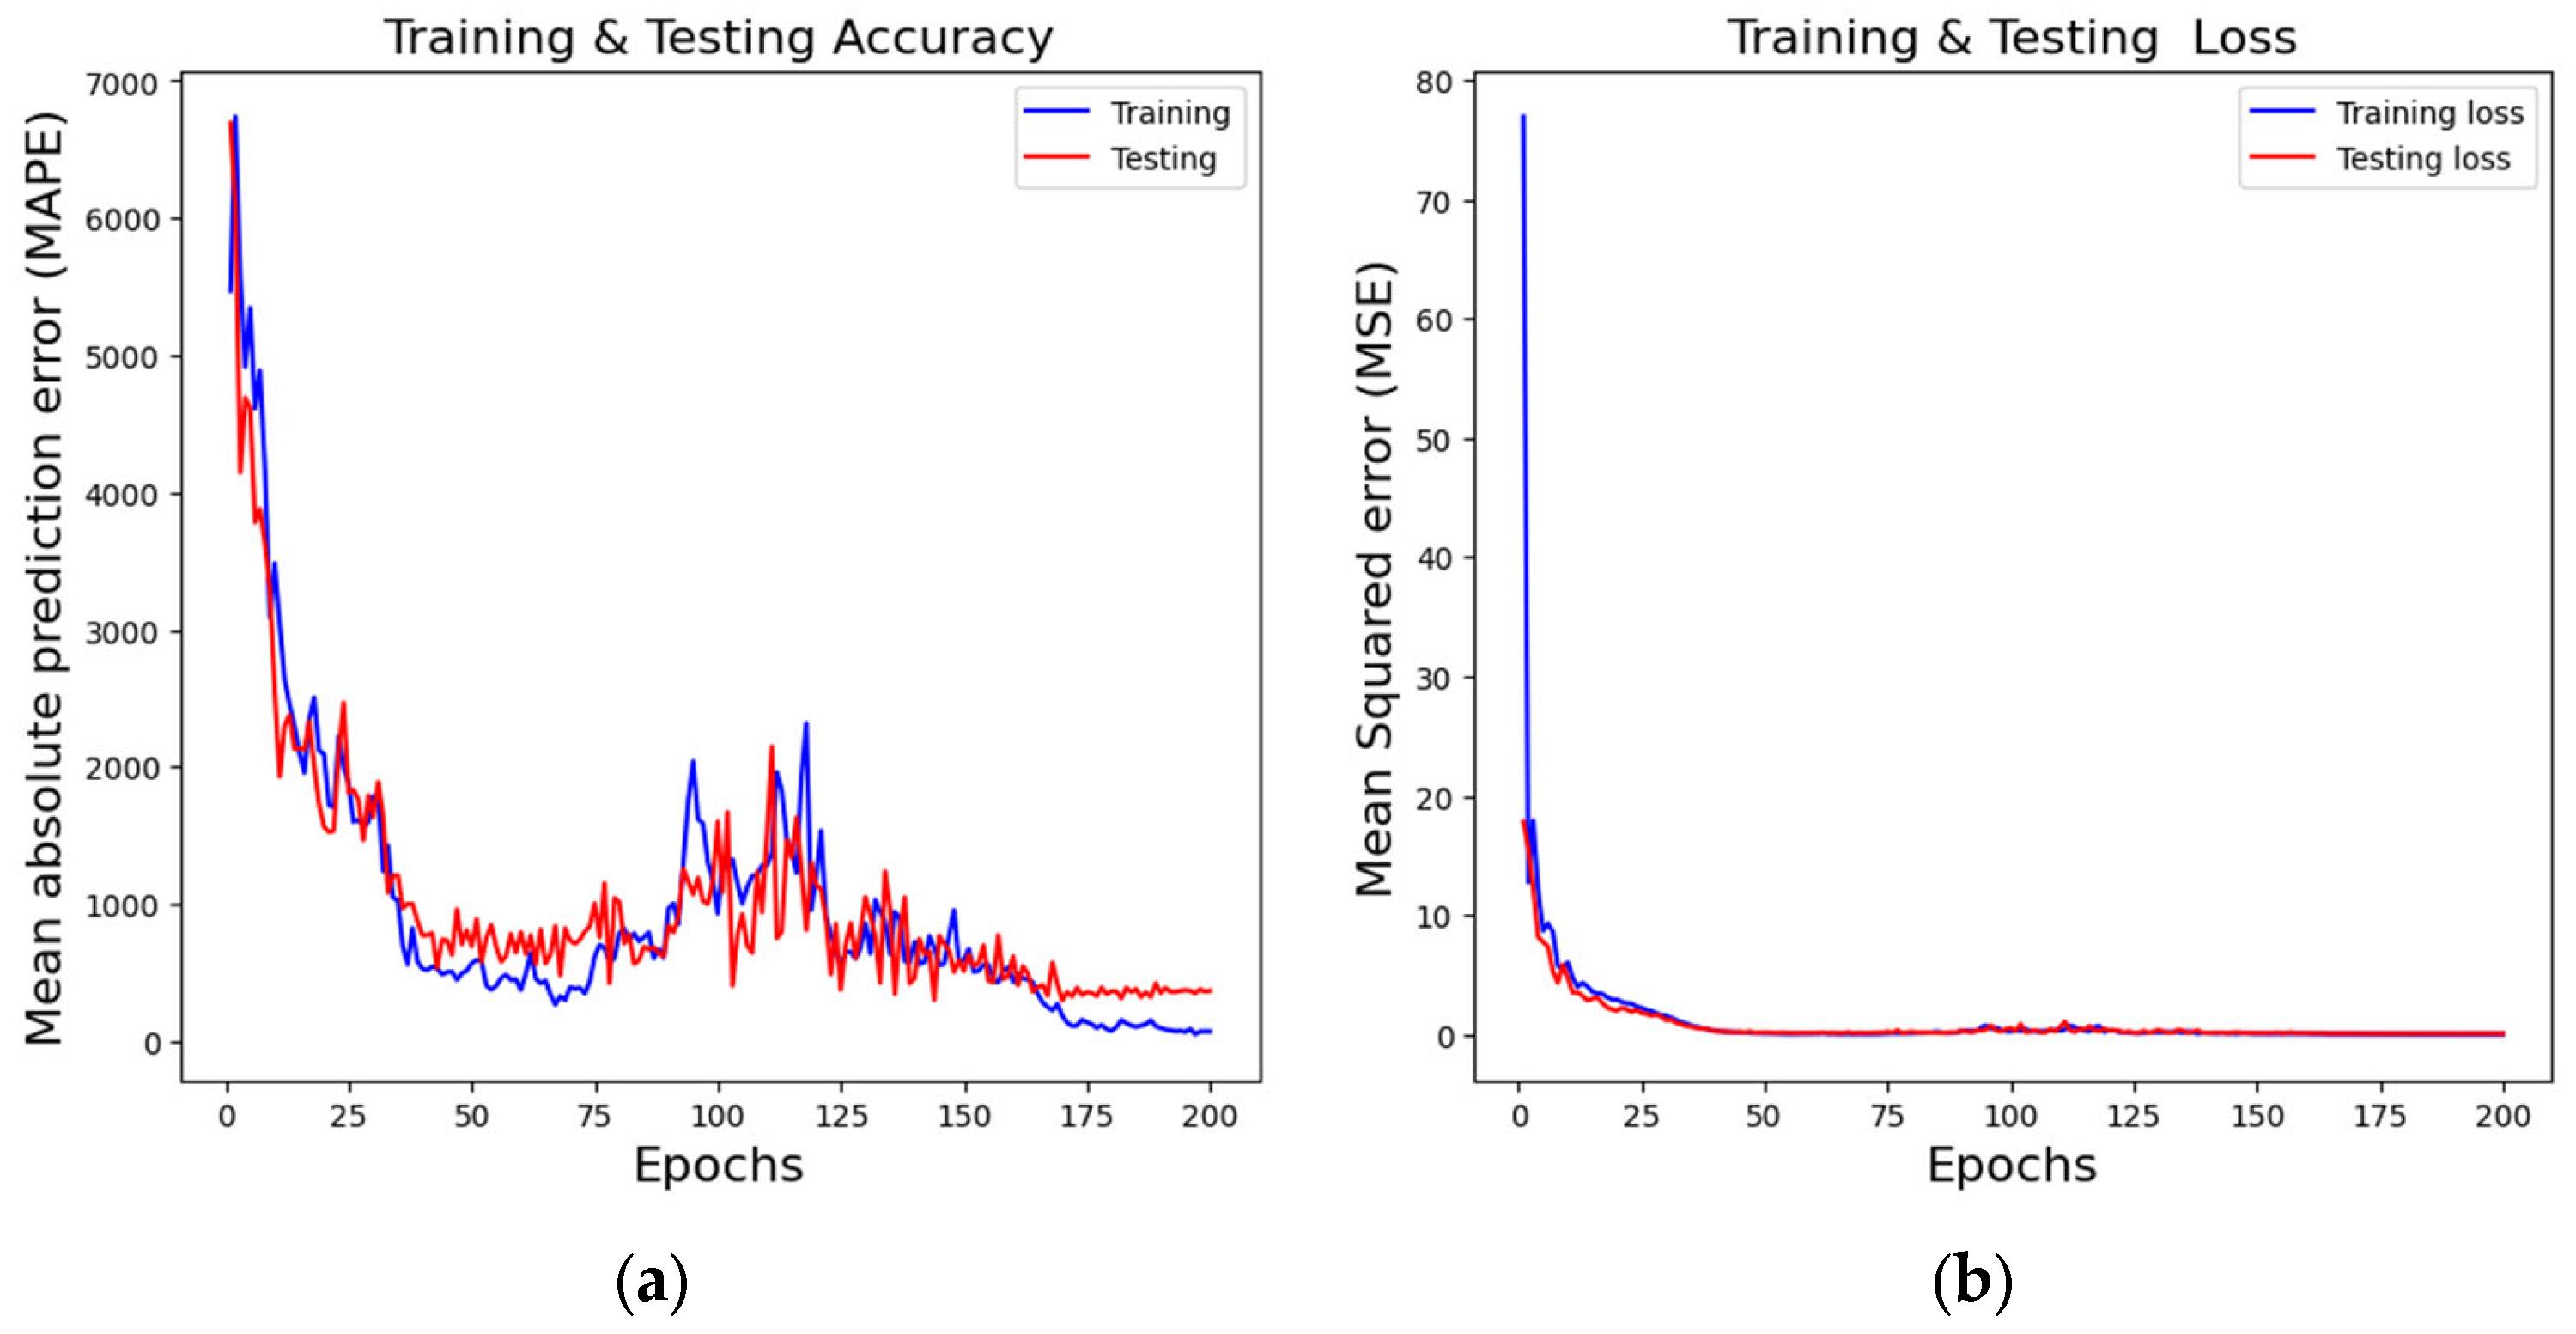
The ANN was performed based on the previous three principal components as an input dataset. The optimum numbers of epochs and neurons in the hidden layer were defined by using an iteratively tuned configuration for predicting B1, AR, and TZ dye concentrations in the mixtures. As shown in Figure 7, the model could train the neurons well after about 175 epochs since, from this value, the minimum MSE and MAPE were found for the training and testing data.
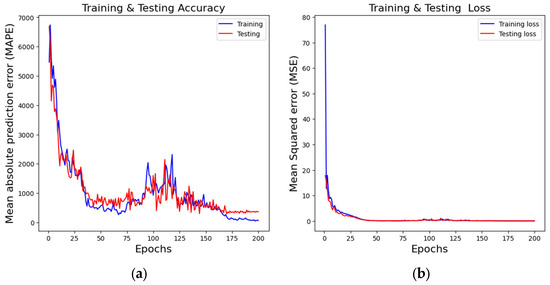
Figure 7.
Loss vs. Epoch Graphs. (a) MAPE vs. Epoch, (b) MSE vs. Epoch.
Once the number of epochs for training had been decided, the next step was to find the number of neurons in the hidden layer. To do this, we used a cross-validation method, which consisted of starting to evaluate the model with a small number of neurons and gradually increasing the number until we found the minimum MSE of the training and testing sets.
As shown in Figure 8, the optimal number of neurons in the hidden layer was found to be 500.
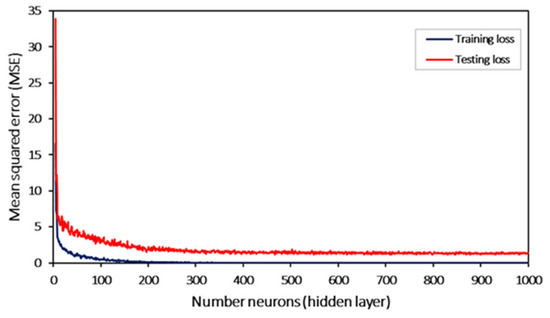
Figure 8.
MSE vs. number of neurons in the hidden layer.
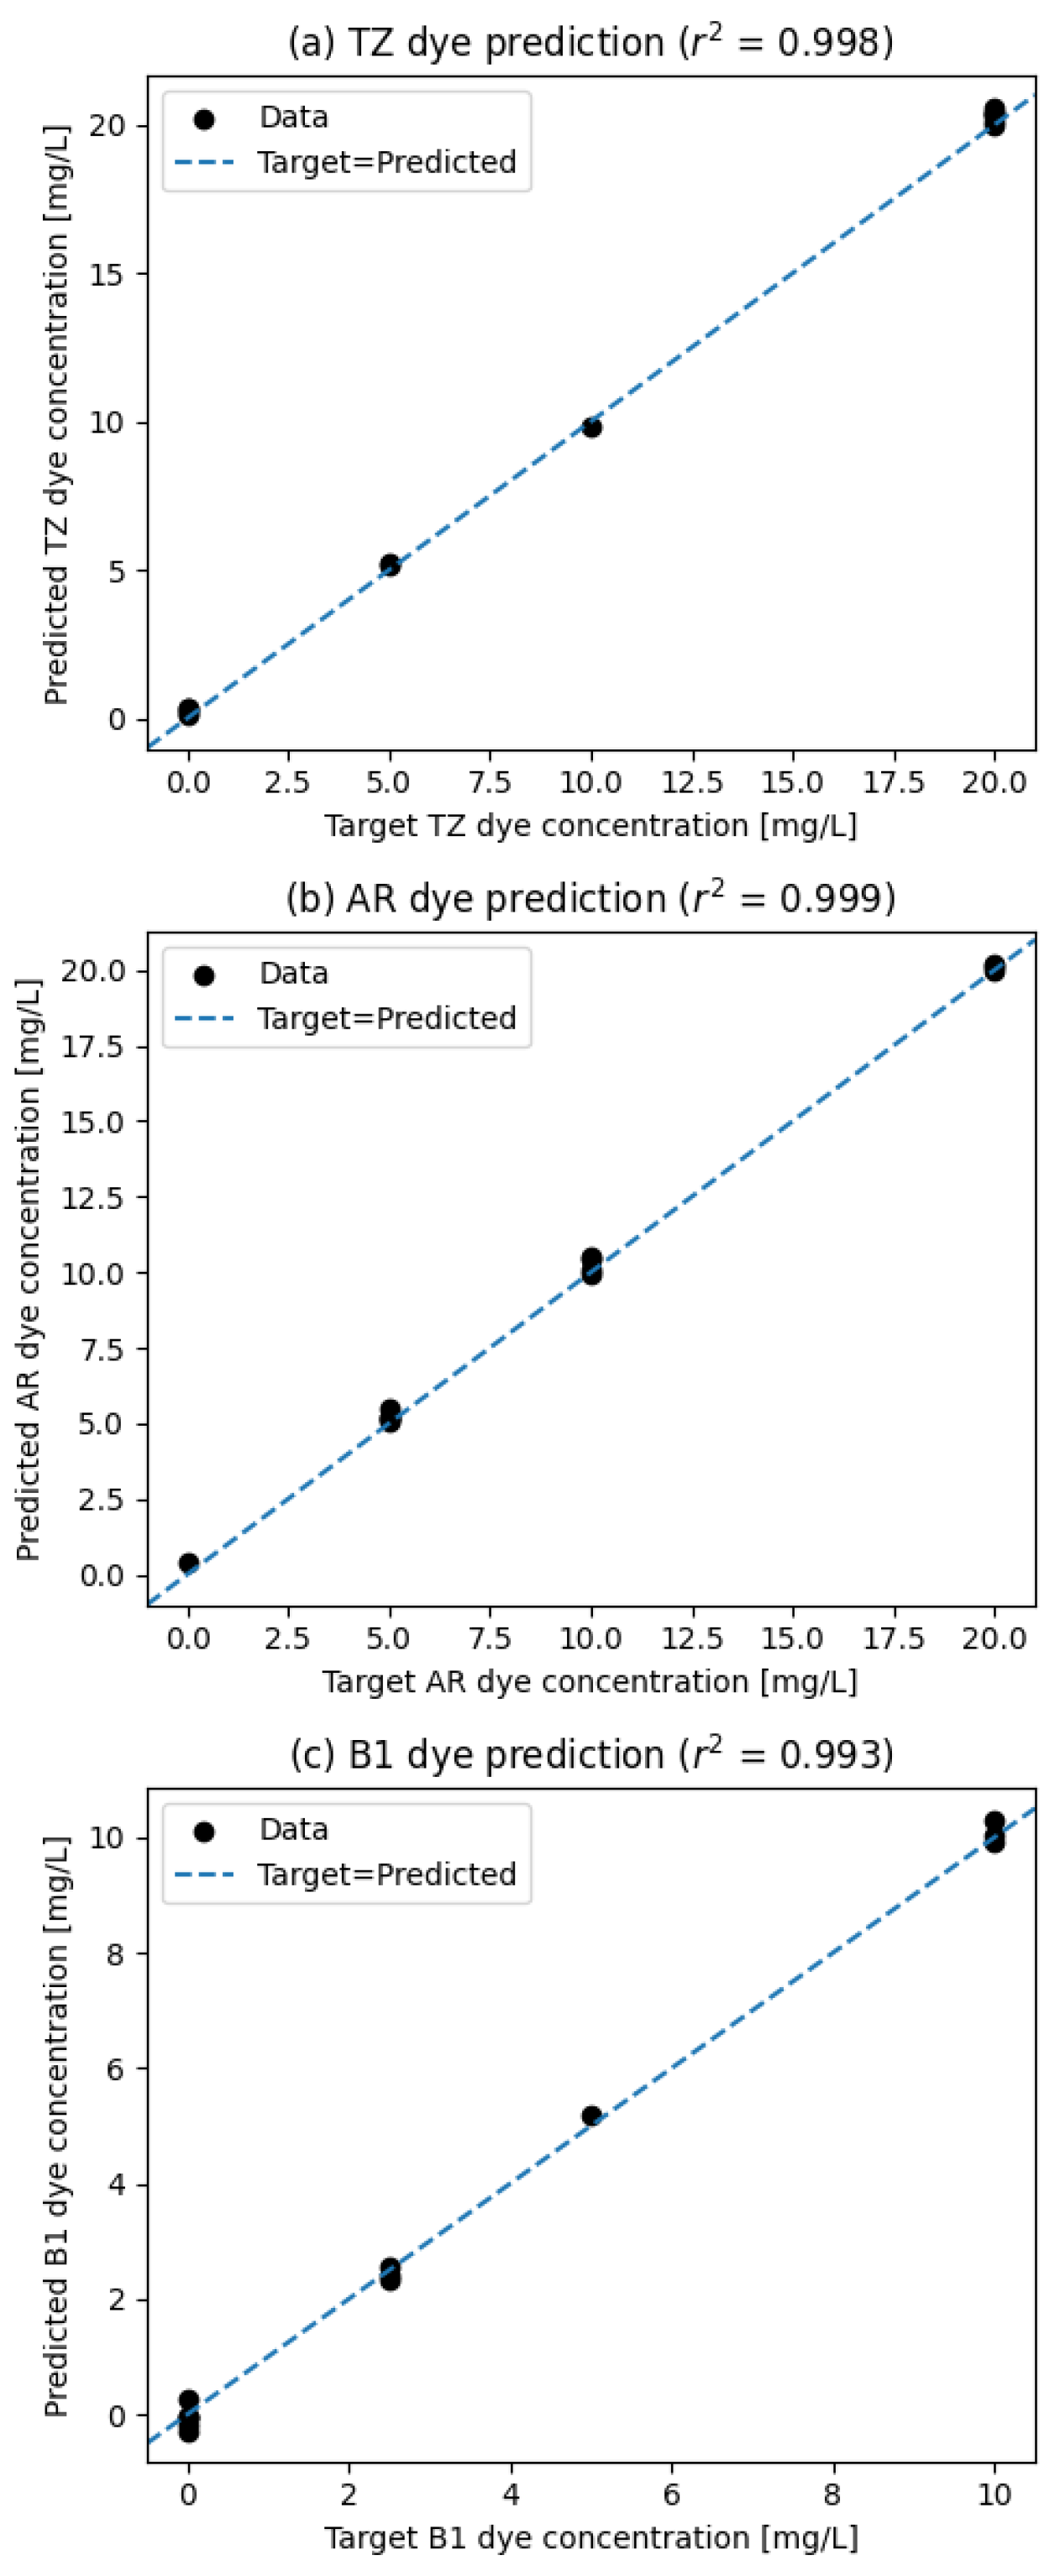
The optimum number of epochs and neurons in the hidden layer were used to fit the database with the same architecture. Regression coefficients (r2) for predicting TZ, AR, and B1 dye concentrations in the mixtures achieved by the model are shown in Figure 9a–c.
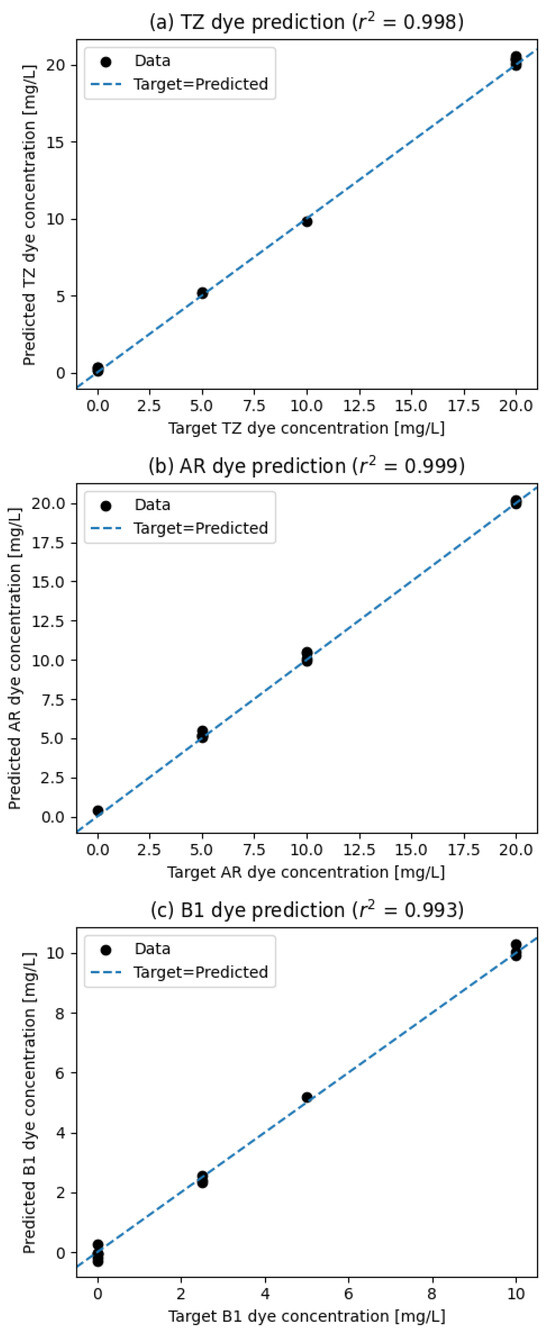
Figure 9.
The scatter plot of target versus predicted dye concentration in mixtures and Regression coefficient (r2) (a) TZ, (b) AR and (c) B1 by the PCA–ANN model in test samples.
The closer the r2 values of the PCA–ANN model were to one, the higher the fitting effect of the model was. It can be observed from Figure 9 that the r2 values of the three dyes are greater than 0.99. This means the PCA–ANN model is highly accurate in the prediction of dye concentrations in ternary mixtures.
4. Conclusions
In this work, a new framework was applied, which used a combined ANN and PCA model as an alternative for the simultaneous concentration determination of the three dyes in aqueous mixtures. As the main contribution, the combination of PCA and ANN models allowed us to overcome the high dimensionality, low sample size of the input data, and high UV-Vis spectra overlapping, leading to obtaining satisfactory results for quantifying the three dyes in aqueous mixtures.
With the use of the PCA model, it was discovered that more than ninety-nine percent (99%) of the total variation was explained by three principal components instead of 350 original variables. The optimal ANN model had 175 training epochs, one hidden layer with 500 neurons, a performance prediction with r2 values greater than 0.99, and MAPE values of less than 1% for the three dyes. This study proved that the combination of the PCA–ANN model predicts the concentration of B1, AR, and TZ dyes in aqueous mixtures as a rapid and accurate alternative.
Author Contributions
J.C.E.-M., E.R.-L. and M.d.l.L.J.-N. designed the study. J.C.E.-M. collected the data. E.R.-L. and M.d.l.L.J.-N. analyzed the data, J.C.E.-M., E.R.-L. and M.d.l.L.J.-N. contributed equally to write the manuscript. All authors have read and agreed to the published version of the manuscript.
Funding
This research was supported by Consejo Nacional de Humanidades, Ciencias y Tecnologías (CONAHCYT, México), grant number 794324.
Institutional Review Board Statement
Not applicable.
Informed Consent Statement
Not applicable.
Data Availability Statement
Data are contained within the article.
Conflicts of Interest
The authors declare no conflicts of interest.
References
- Lalnunhlimi, S.; Krishnaswamy, V. Decolorization of azo dyes (Direct Blue 151 and Direct Red 31) by moderately alkaliphilic bacterial consortium. Brazilian J. Microbiol. 2016, 47, 39–46. [Google Scholar] [CrossRef] [PubMed]
- Leulescu, M.; Rotaru, A.; Pălărie, I.; Moanţă, A.; Cioateră, N.; Popescu, M.; Morîntale, E.; Viorica, B.M.; Rotaru, P. Tartrazine: Physical, thermal and biophysical properties of the most widely employed synthetic yellow food-colouring azo dye. J. Therm. Anal. Calorim. 2018, 134, 209–231. [Google Scholar] [CrossRef]
- Abdellaouia, K.; Pavlovica, I.; Bouhentb, M.; Benhamouc, A.; Barriga, C. A comparative study of the amaranth azo dye adsorption/desorption from aqueous solutions by layered double hydroxides. Appl. Clay Sci. 2017, 143, 142–150. [Google Scholar] [CrossRef]
- Motahare; Ghadamali, B.; Mansour, A.C.; Nasser, G. Removal of Brilliant Green and Crystal violet from Mono- and Bi-component Aqueous Solutions Using NaOH-modified Walnut Shell. Anal. Bioanal. Chem. Res. 2018, 5, 95–114. [Google Scholar] [CrossRef]
- Mirbolookia, H.; Amirnezhadb, R.; Pendashtehc, A.R. Treatment of high saline textile wastewater by activated sludge microorganisms. J. Appl. Res. Technol. 2017, 15, 167–172. [Google Scholar] [CrossRef]
- Al-Shabib, N.A.; Khan, J.M.; Malik, A.; Rehman, M.T.; AlAjmi, M.F.; Husain, F.M.; Husain, A.; Sen, P. Investigating the effect of food additive dye “tartrazine” on BLG fibrillation under in-vitro condition. A Biophys. Mol. Docking Study. J. King Saud Univ. -Sci. 2020, 32, 2034–2040. [Google Scholar] [CrossRef]
- Campos-Pereira, F.D.; Veiga-Menoncello, A.C.P.; Marin-Morales, M.A. DNA Damage Induced by Diet, de Toxic Effects of Chemicals in Food, Chemical and Consumer Product Safety; Research Signpost: São Paulo, Brazil, 2014; pp. 43–59. [Google Scholar] [CrossRef]
- Tiron, M.M.; Lucaciu, I.E.; Nita-Lazar, M.; Gheorghe, S. Considerations on the Toxicity of Brilliant Blue FCF Aqueous Solutions before and after Ozonation. Rev. Chim. 2020, 71, 356–365. [Google Scholar] [CrossRef]
- Botelho, G.; Dantas, K.C.F.; Sena, M.M. Determination of allura red dye in hard candies by using digital images obtained with a mobile phone and N-PLS. Chemom. Intell. Lab. Syst. 2017, 167, 44–49. [Google Scholar] [CrossRef]
- Basu; Suresh, K.G. Binding and Inhibitory Effect of the Dyes Amaranth and Tartrazine on Amyloid Fibrillation in Lysozyme. J. Phys. Chem. B 2017, 126, 1222–1239. [Google Scholar] [CrossRef]
- Zeynep, F.; Oymak, T.; Emrah, D. Determination of synthetic colorants in cosmetic products by reversed-phase high-performance liquid chromatography coupled with diode-array detector. J. Res. Pharm. 2019, 23, 1048–1059. [Google Scholar] [CrossRef]
- Hasan, M.A.; Hashim, S.T.; Abid, S.E.; Bajlan, J.S. Determination of the Concentration of Food Azo Dyes by High Performance Liquid Chromatography (HPLC). Curr. Res. Microbiol. Biotechnol. 2016, 6, 1460–1465. [Google Scholar]
- Nowak, P.M. Simultaneous quantification of food colorants and preservatives in sports drinks by the high performance liquid chromatography and capillary electrophoresis methods evaluated using the red-green-blue model. J. Chromatogr. A 2020, 1620, 460976. [Google Scholar] [CrossRef] [PubMed]
- Yamjala, K.; Nainar, M.S.; Ramisetti, N.R. Methods for the analysis of azo dyes employed in food industry—A review. Food Chem. 2016, 192, 813–824. [Google Scholar] [CrossRef]
- Otero, P.; Saha, S.K.; Hussein, A.; Barron, J.; Murray, P. Simultaneous Determination of 23 Azo Dyes in Paprika by Gas Chromatography-Mass Spectrometry. Food Anal. Methods 2017, 10, 876–884. [Google Scholar] [CrossRef]
- Rejczak, T.; Tuzimski, T. Application of High-Performance Liquid Chromatography with Diode Array Detector for Simultaneous Determination of 11 Synthetic Dyes in Selected Beverages and Foodstuffs. Food Anal. Methods 2017, 10, 3572–3588. [Google Scholar] [CrossRef]
- Nateri; Ekrami, E. Quantitative analysis of bicomponent dye solutions by derivative spectrophotometry. Pigment Resin Technol. 2009, 38, 43–48. [Google Scholar] [CrossRef]
- Jadhav, J.; Srivastava, V.C. Simultaneous spectrophotometric estimation of nitrobenzene, aniline, and phenol in a ternary mixture using genetic algorithm. J. Indian Chem. Soc. 2023, 100, 100814. [Google Scholar] [CrossRef]
- Mostafa; Shaaban, A.H. Chemometric Assisted UV-Spectrophotometric Methods Using Multivariate Curve Resolution Alternating Least Squares and Partial Least Squares Regression for Determination of Beta-Antagonists in Formulated Products: Evaluation of the Ecological Impact. Molecules 2023, 28, 328. [Google Scholar] [CrossRef]
- Alsamarrai, K.F.; Ameen, S.T. Simultaneous Ratio Derivative Spectrophotometric Determination of Paracetamol, Caffeine and Ibuprofen in Their Ternary Form. Baghdad Sci. J. 2022, 19, 1276. [Google Scholar] [CrossRef]
- Rodrigues, J.M.F.; Cardoso, P.J.S.; Chinnici, M. Artificial Intelligence Applications and Innovations: Day-to-Day Life Impact. Appl. Sci. 2023, 23, 12742. [Google Scholar] [CrossRef]
- Pasini, A. Artificial neural networks for small dataset analysis. J. Thorac. Dis. 2015, 7, 953–960. [Google Scholar] [CrossRef]
- Moreira, M.O.; Kaizer, B.M.; Ohishi, T.; Bonatto, B.D.; Souza, A.C.Z.D.; Balestrassi, P.P. Multivariate Strategy Using Artificial Neural Networks for Seasonal Photovoltaic Generation Forecasting. Energies 2023, 16, 369. [Google Scholar] [CrossRef]
- Świetlicka; Kuniszyk-Jóźkowiak, W.; Świetlicki, M. Artificial Neural Networks Combined with the Principal Component Analysis for Non-Fluent Speech Recognition. Sensors 2022, 22, 321. [Google Scholar] [CrossRef] [PubMed]
- Aguilar-Lira, G.Y.; Hernandez, P.; Álvarez-Romero, G.A.; Gutiérrez, J.M. Simultaneous Quantification of Four Principal NSAIDs through Voltammetry and Artificial Neural Networks Using a Modified Carbon Paste Electrode in Pharmaceutical Samples. Chem. Proc. 2021, 5, 3. [Google Scholar] [CrossRef]
- Huang, Y.; Deng, Y. A Hybrid Model Utilizing Principal Component Analysis and Artificial Neural Networks for Driving Drowsiness Detection. Appl. Sci. 2022, 12, 6007. [Google Scholar] [CrossRef]
- Howley, T.; Madden, M.; O’Connell, M.-L.; Ryder, A. The Effect of Principal Component Analysis on Machine Learning Accuracy with High Dimensional Spectral Data. In Proceedings of the AI-2005, 25th International Conference on Innovative Techniques and Applications of Artificial Intelligence, Cambridge, UK, 12–14 December 2005; pp. 209–222. [Google Scholar] [CrossRef]
- Salem, N.; Hussein, S. Data dimensional reduction and principal components analysis. Procedia Comput. Sci. 2019, 163, 292–299. [Google Scholar] [CrossRef]
- Mehdi; Brahmi-Ingrachen, D.; Belkacemi, H.; Muhr, L. Development of a Mathematical Model Based on an Artificial Neural Network (ANN) to Predict Nickel Uptake Data by a Natural Zeolite. Phys. Sci. Forum 2023, 6, 4. [Google Scholar] [CrossRef]


Disclaimer/Publisher’s Note: The statements, opinions and data contained in all publications are solely those of the individual author(s) and contributor(s) and not of MDPI and/or the editor(s). MDPI and/or the editor(s) disclaim responsibility for any injury to people or property resulting from any ideas, methods, instructions or products referred to in the content. |
© 2024 by the authors. Licensee MDPI, Basel, Switzerland. This article is an open access article distributed under the terms and conditions of the Creative Commons Attribution (CC BY) license (https://creativecommons.org/licenses/by/4.0/).