
Temperature and Reaction Time’s Effects on N80 Steel Corrosion Behavior in Supercritical CO2 and Formation Water Environments

Abstract
1. Introduction
2. Experiments
2.1. Materials, Solution and Preprocessing
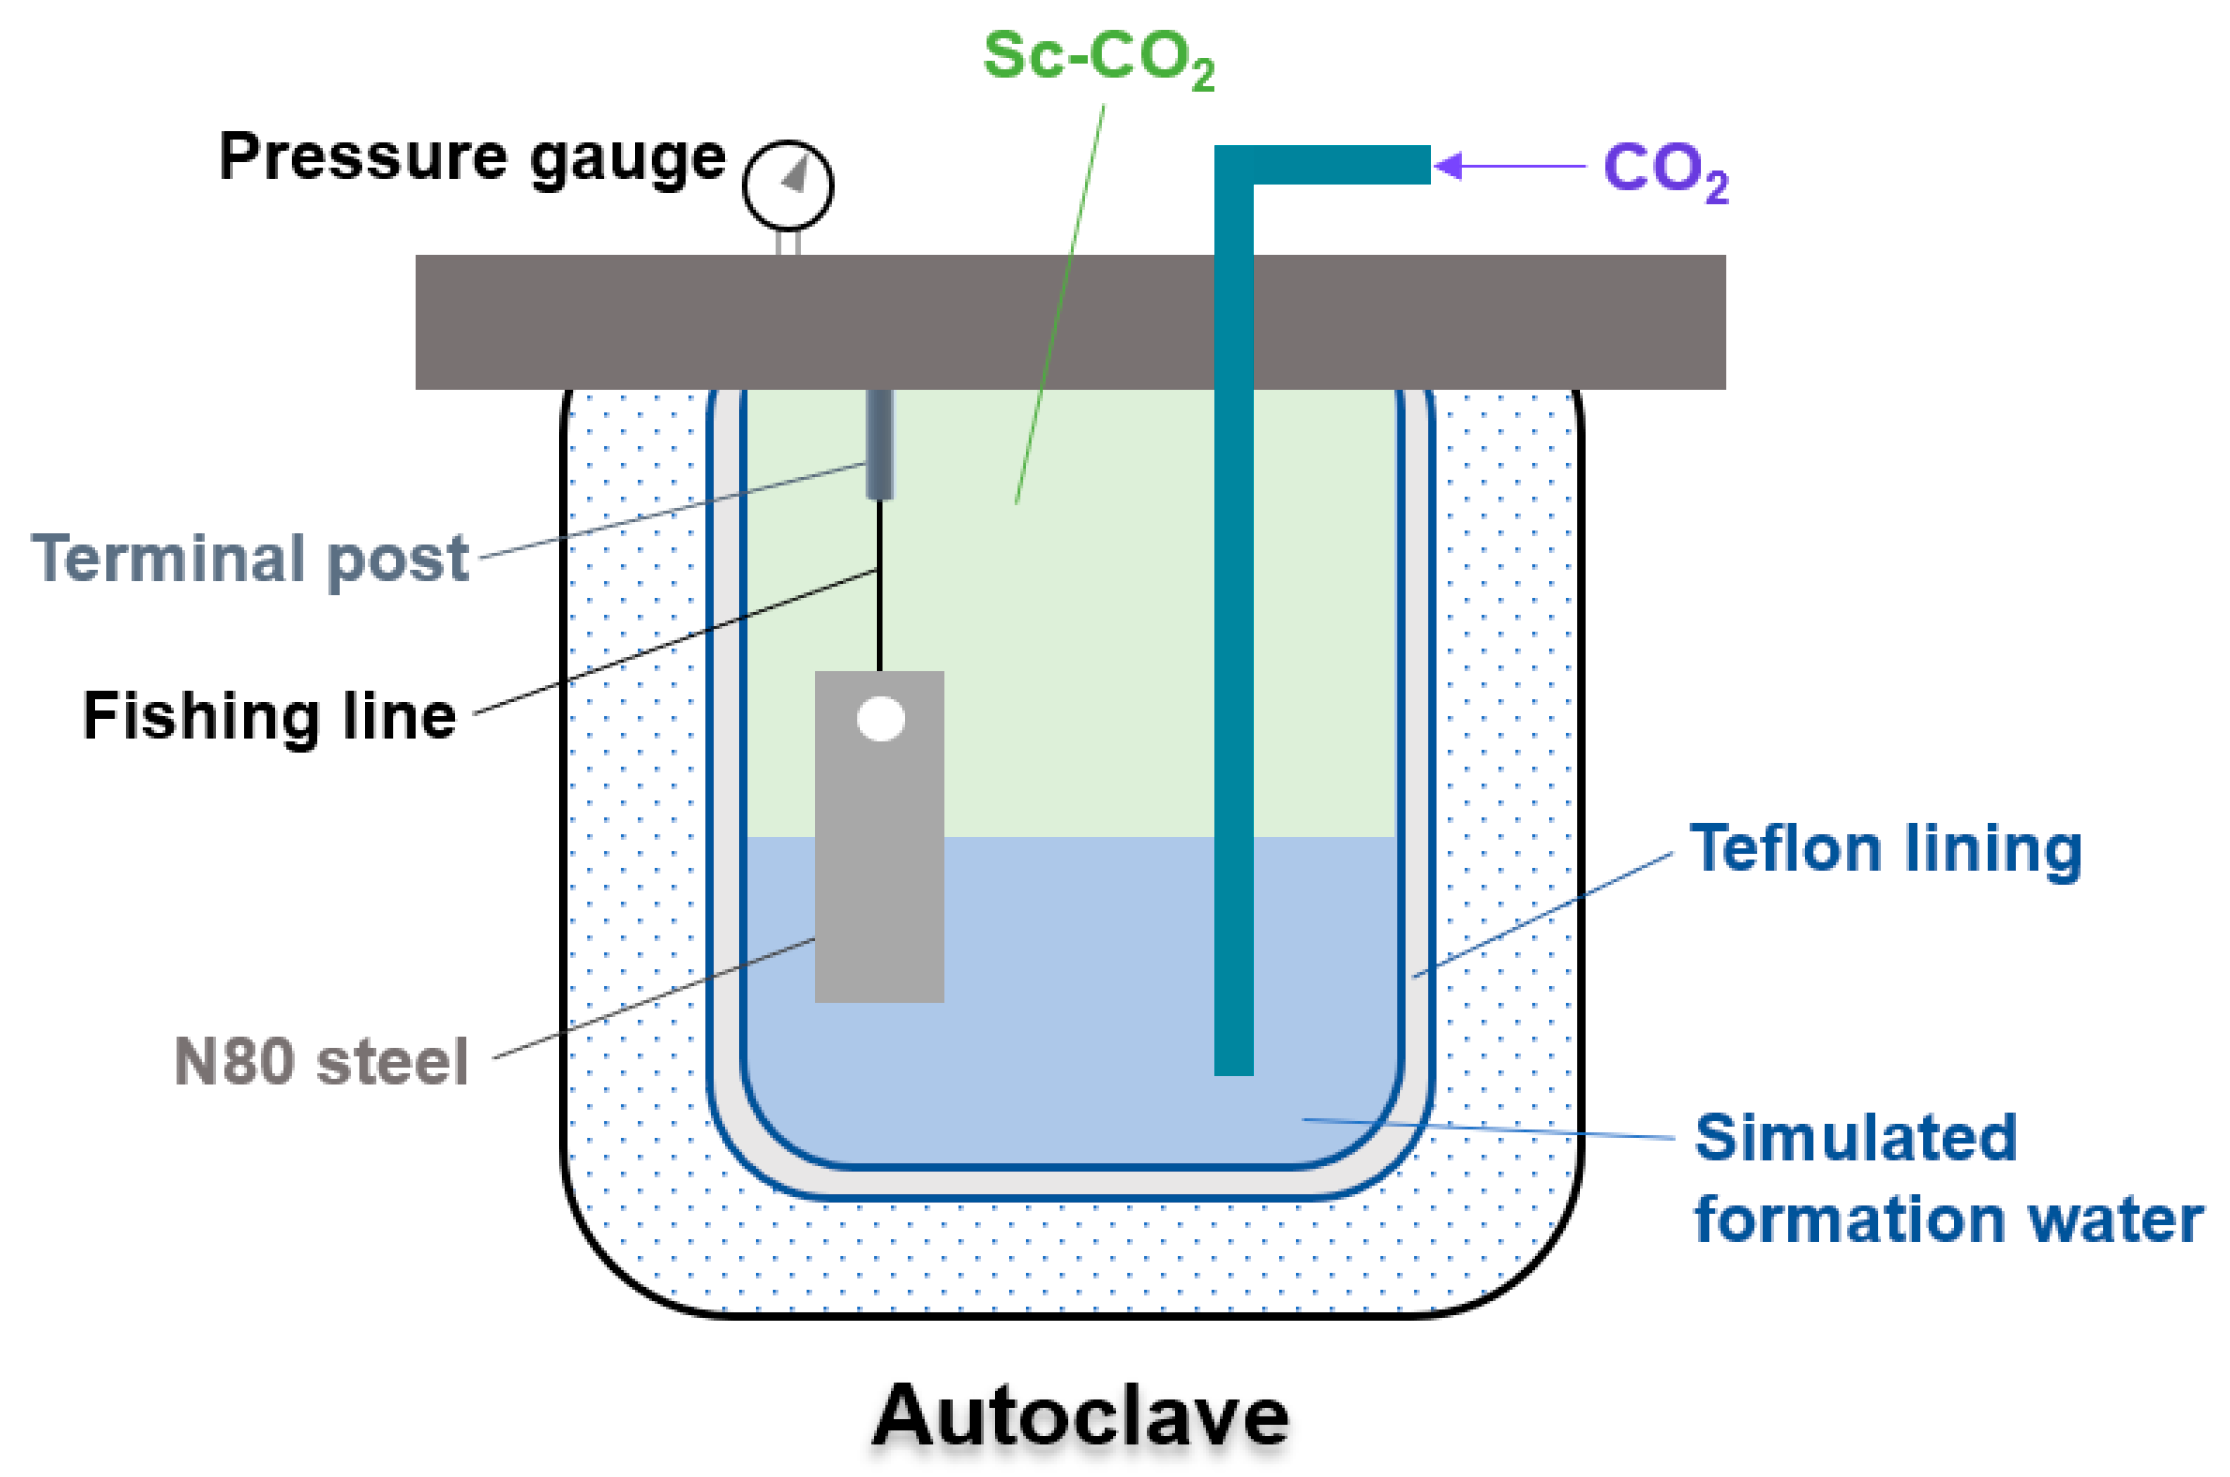
2.2. Immersion Experiments
2.3. Electrochemical Tests
2.4. Surface Analysis
3. Results and Discussion
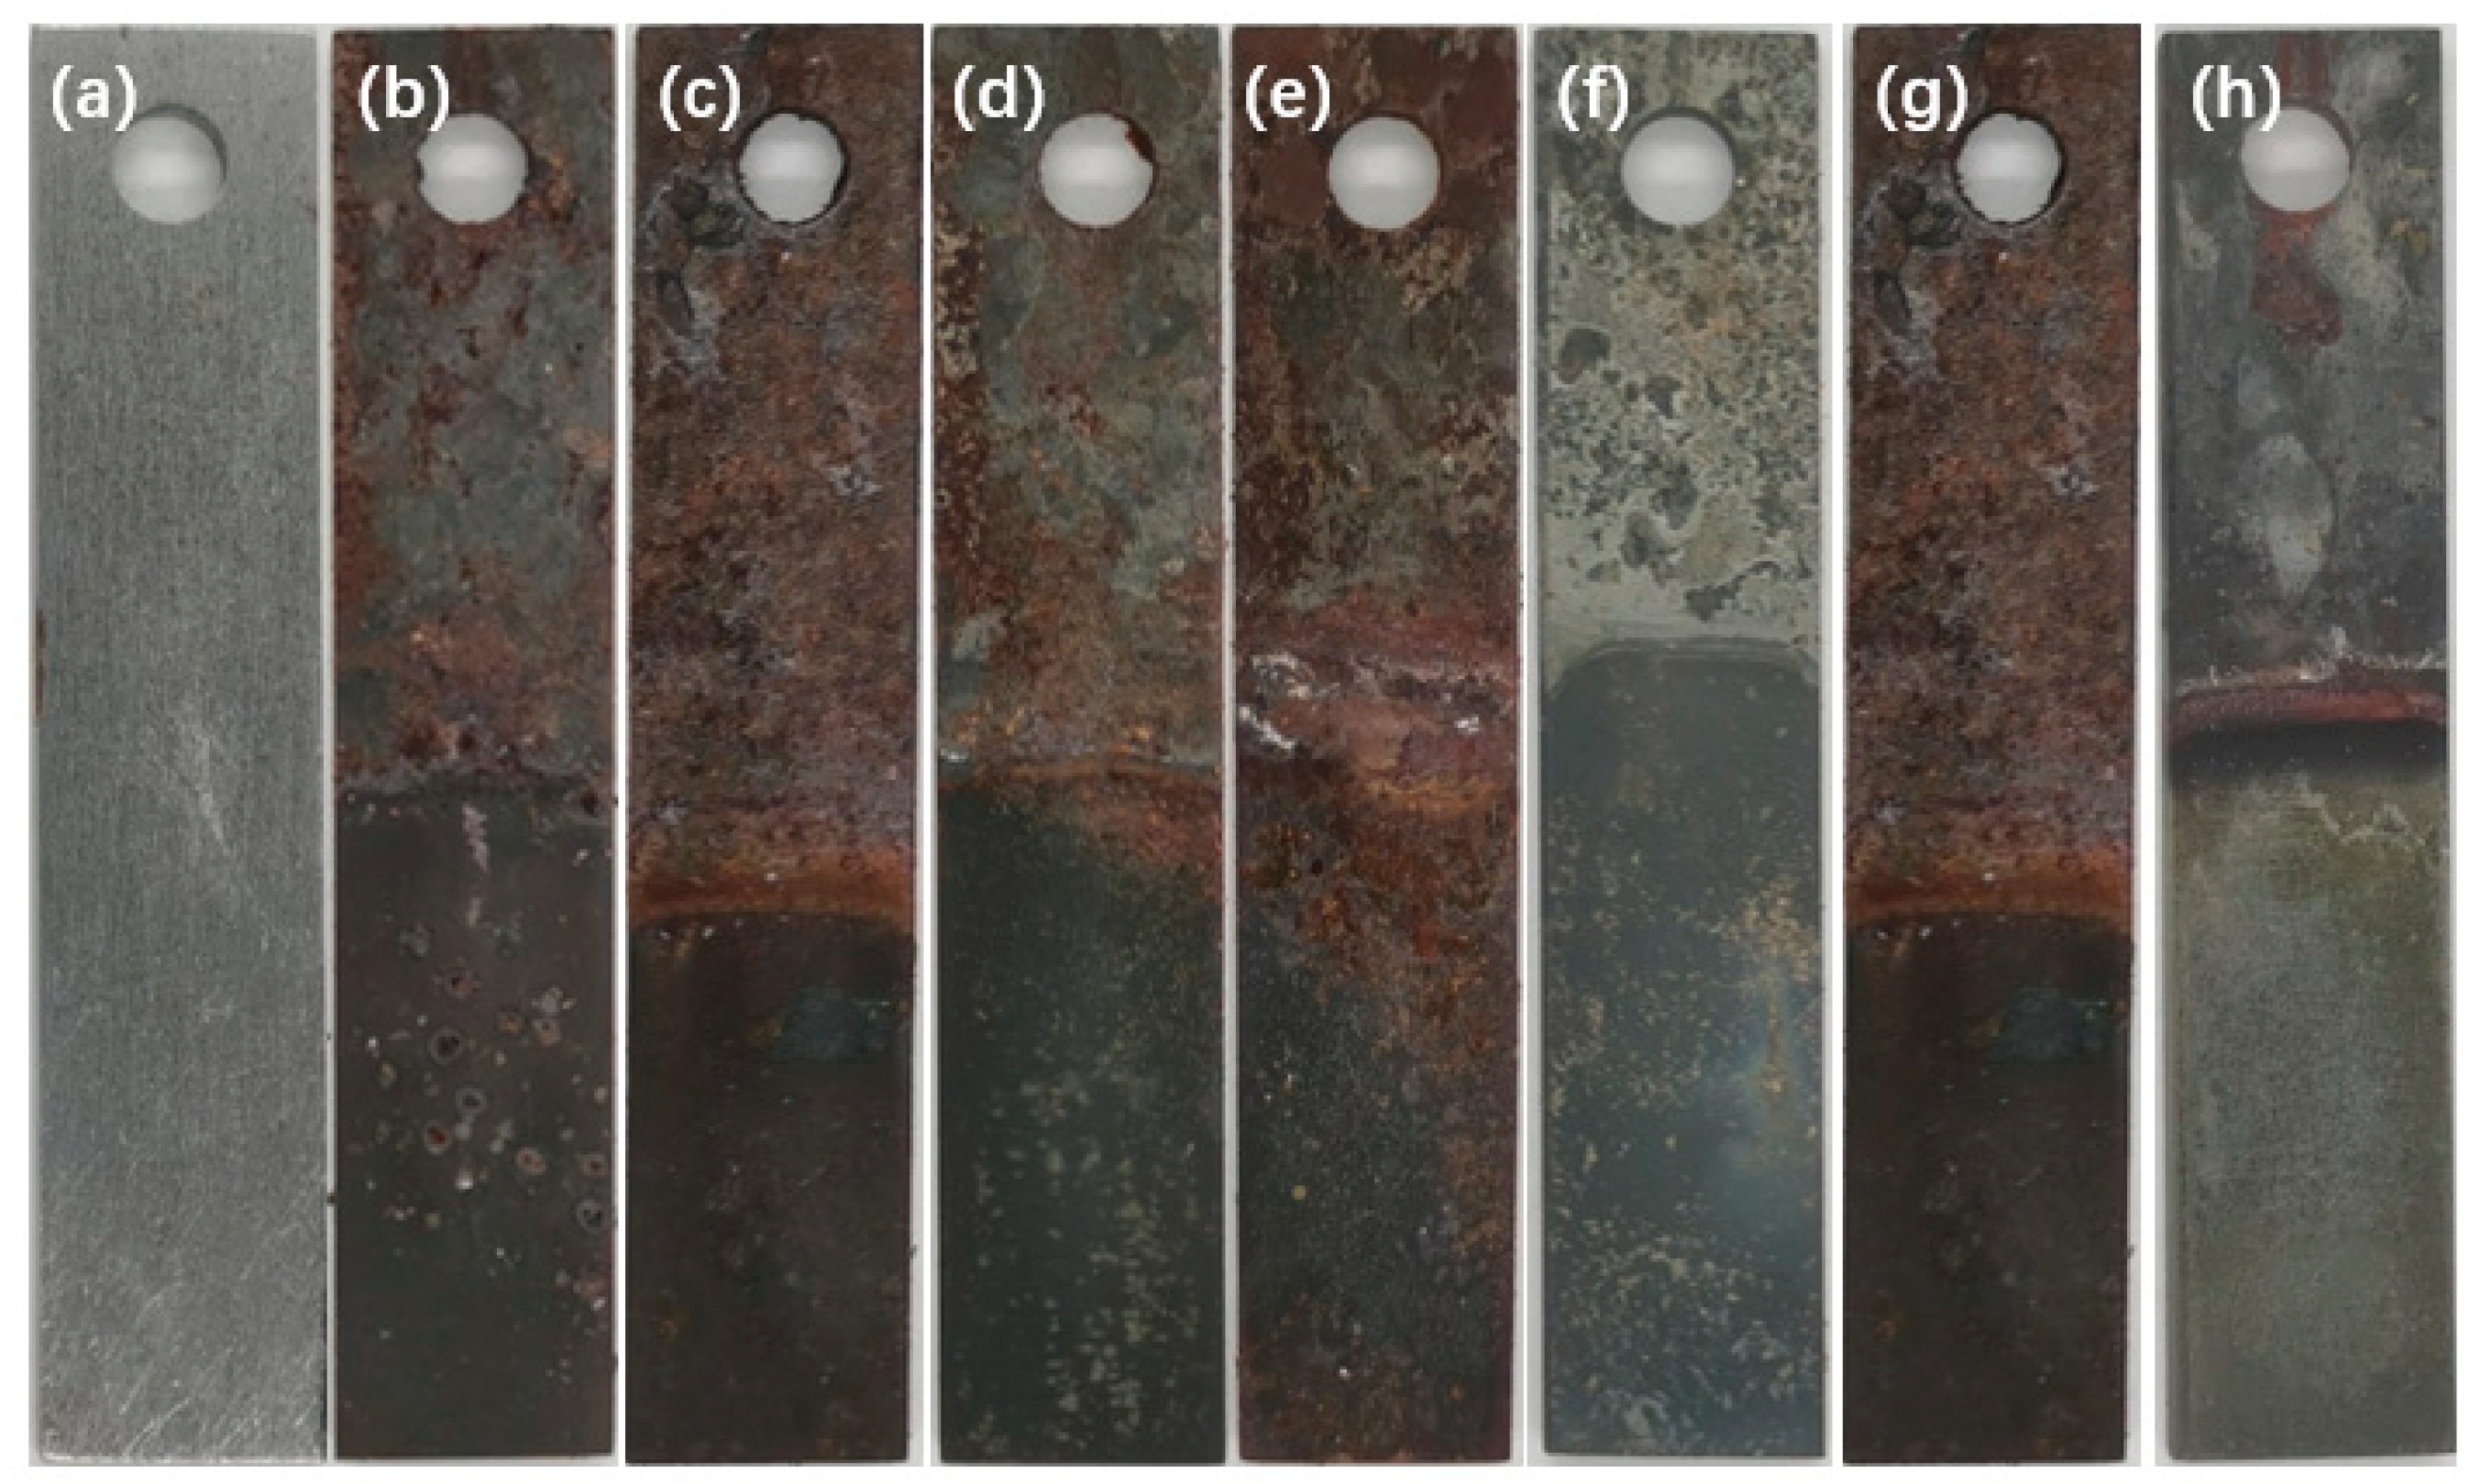
3.1. Corrosion Morphology
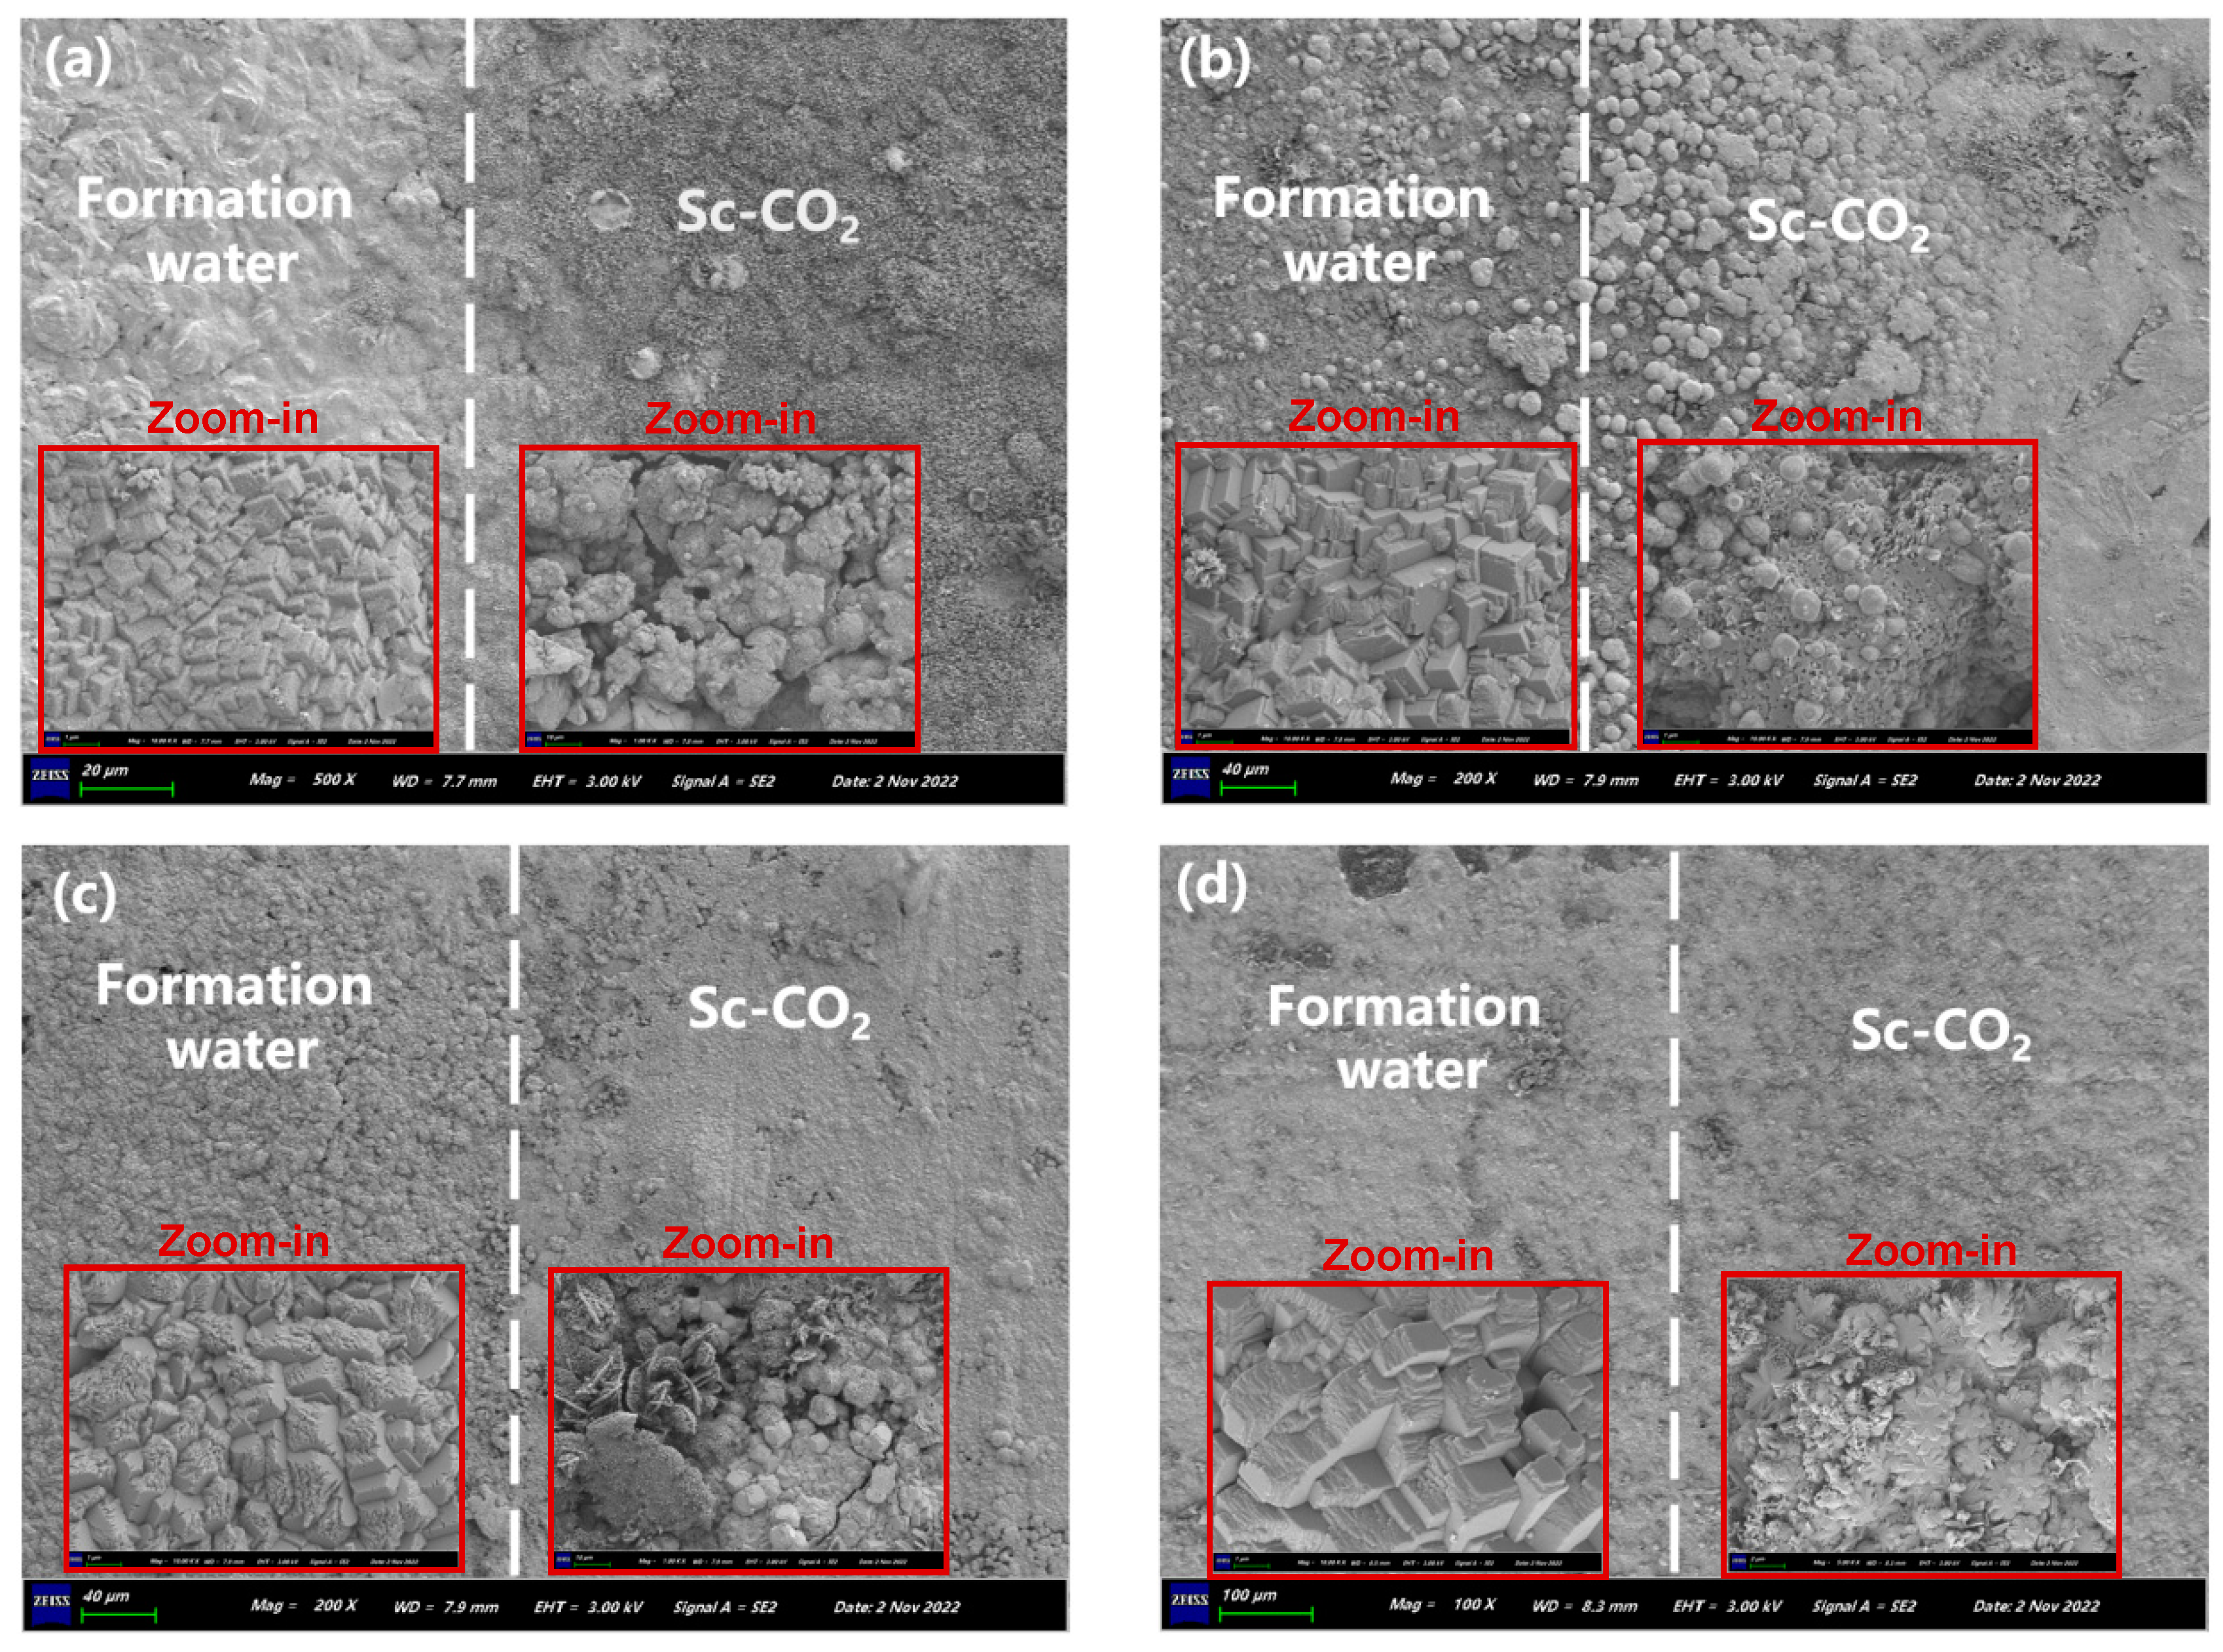
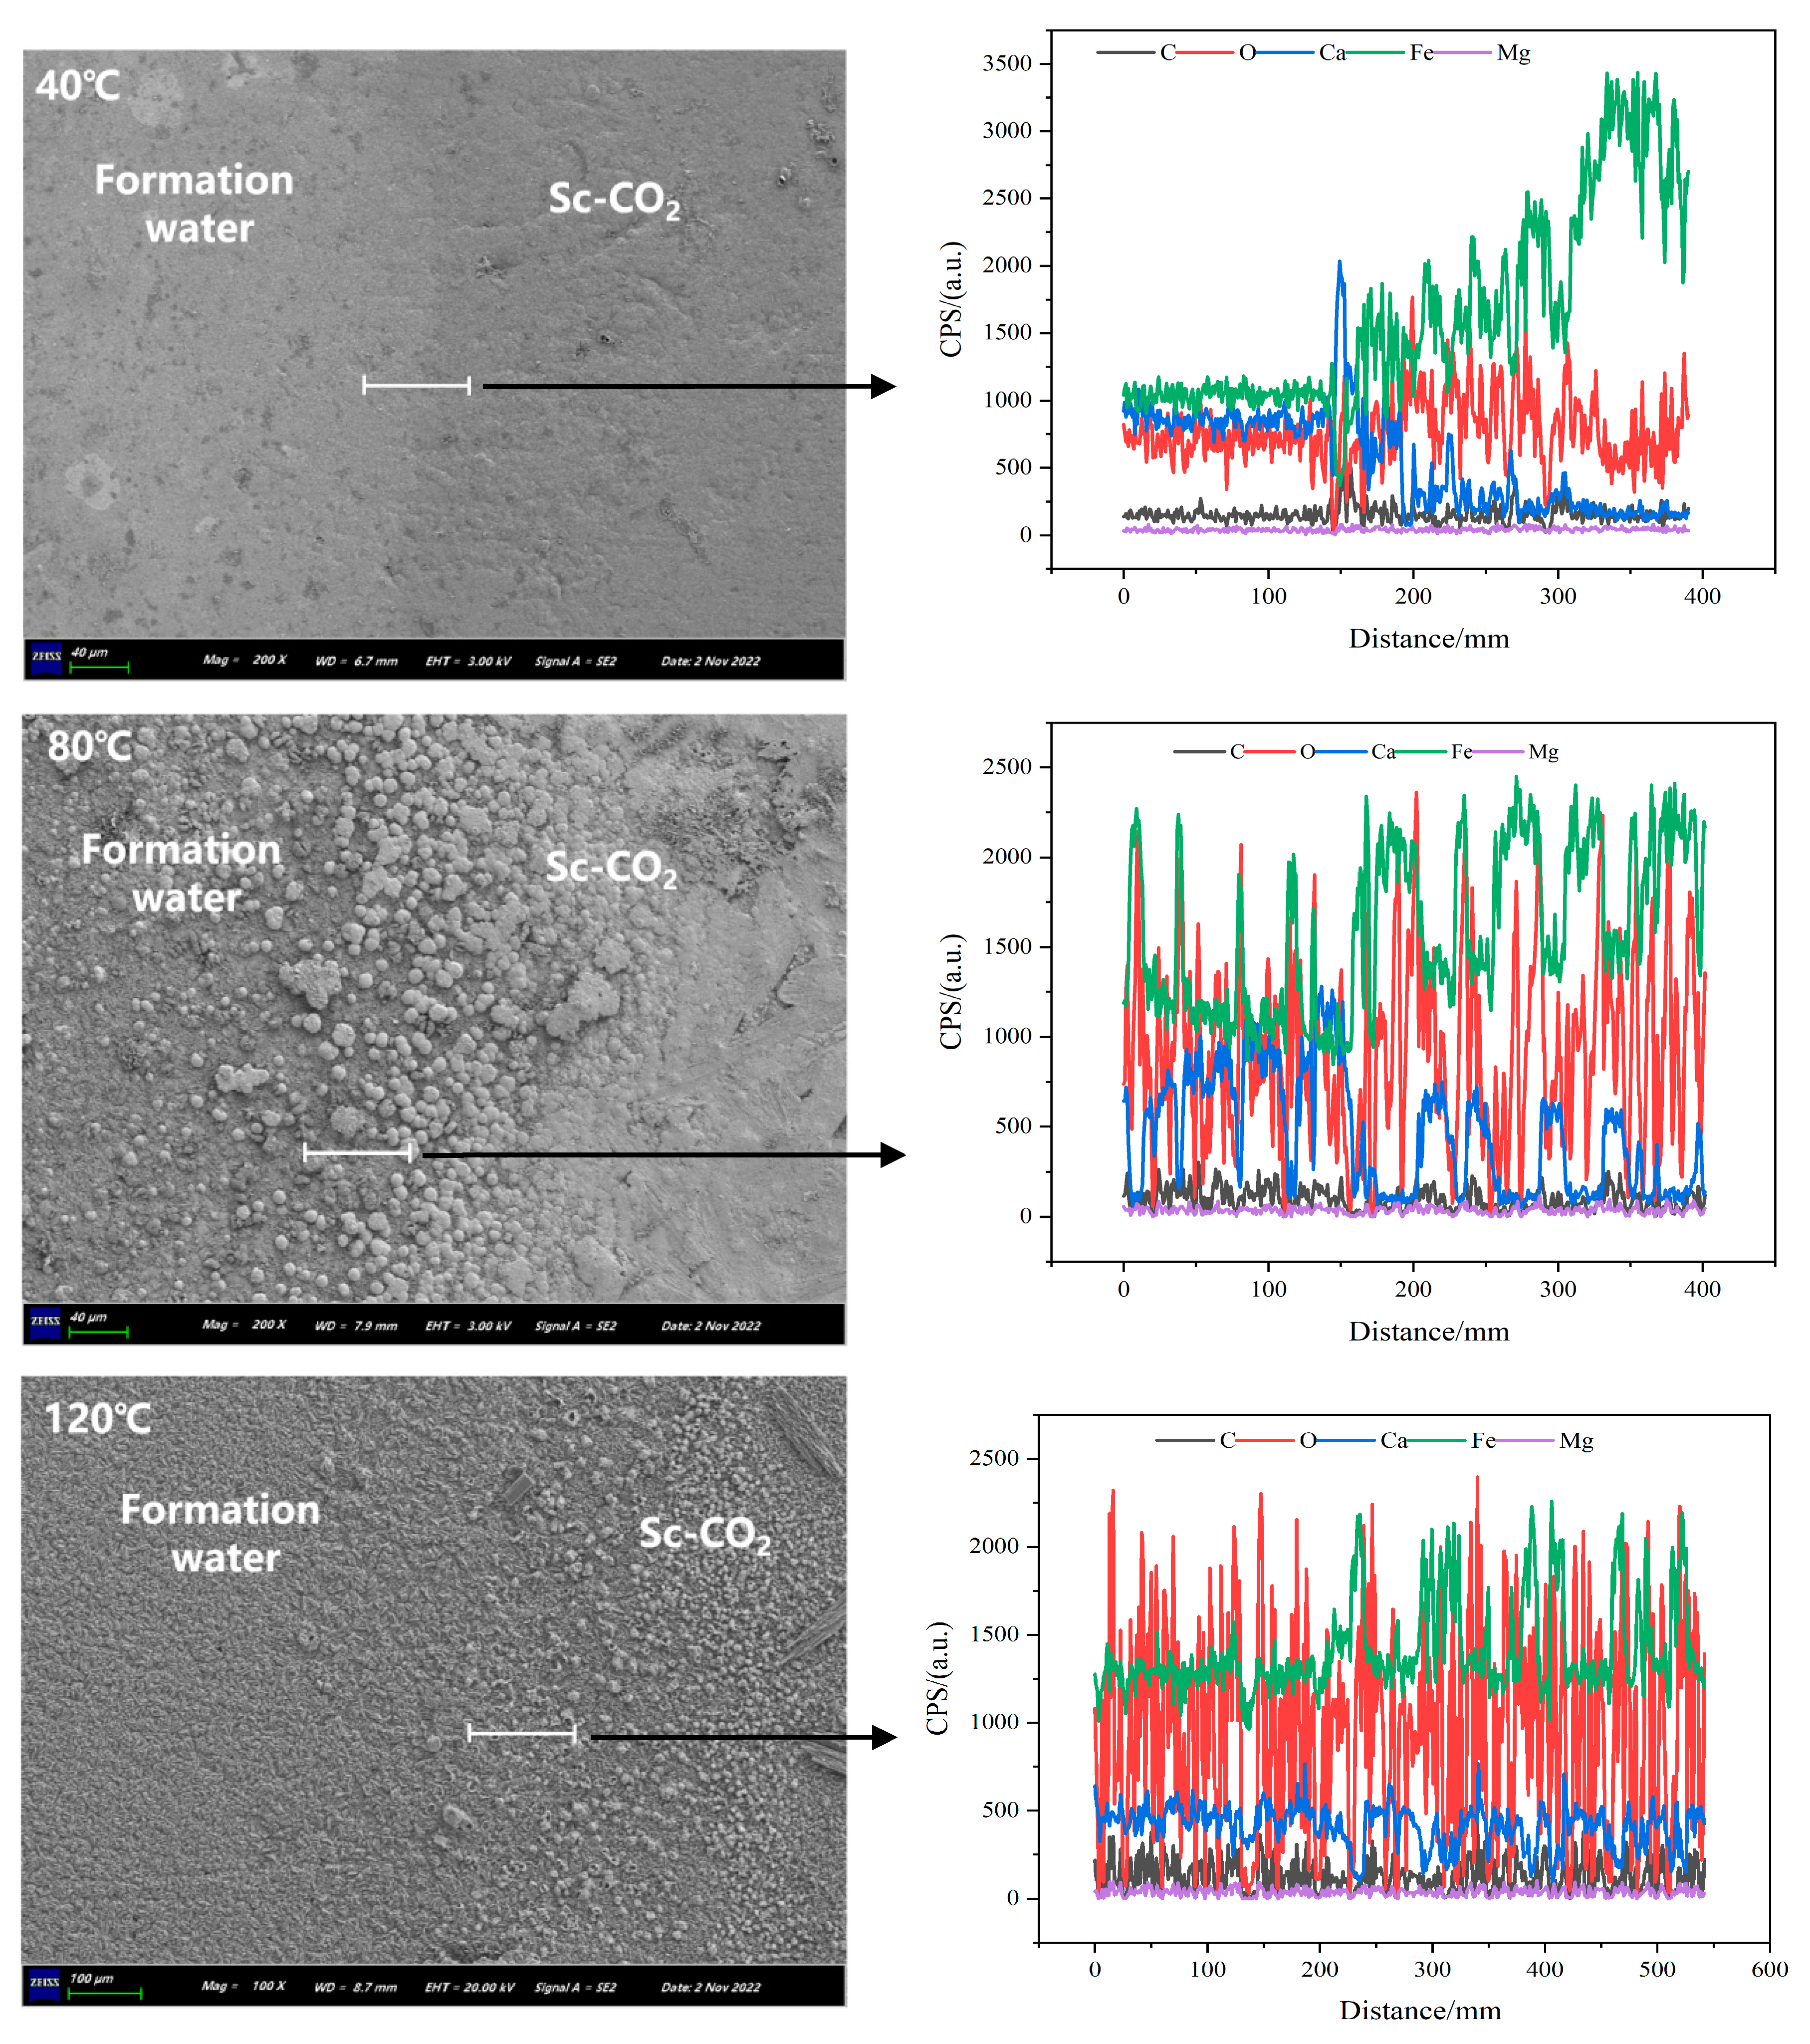
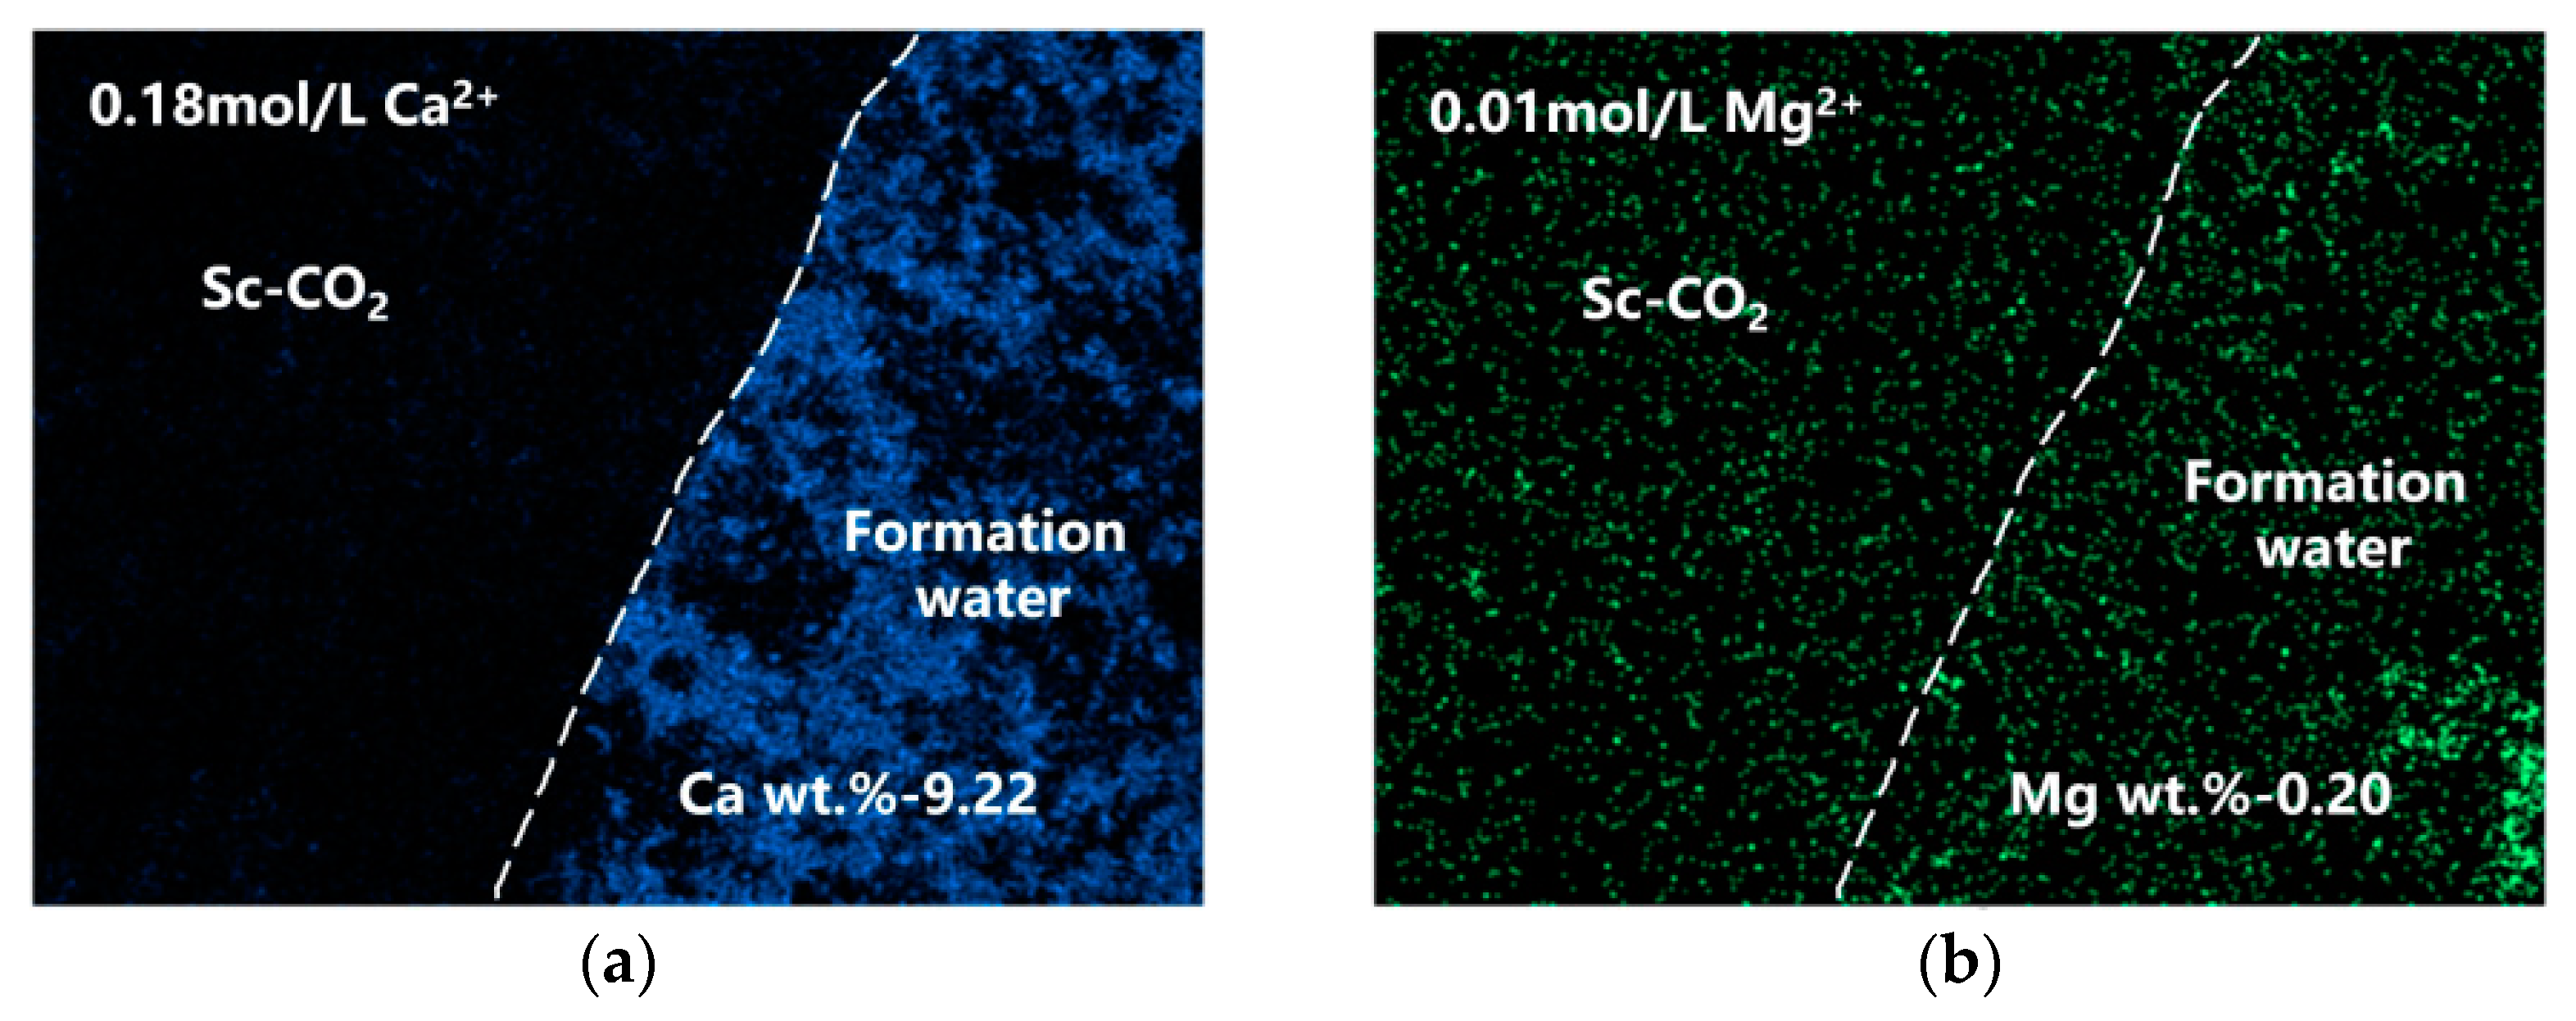
3.2. SEM and EDS Observation
3.3. Electrochemical Analysis
3.3.1. Open Circuit Potential
3.3.2. Polarization Curves
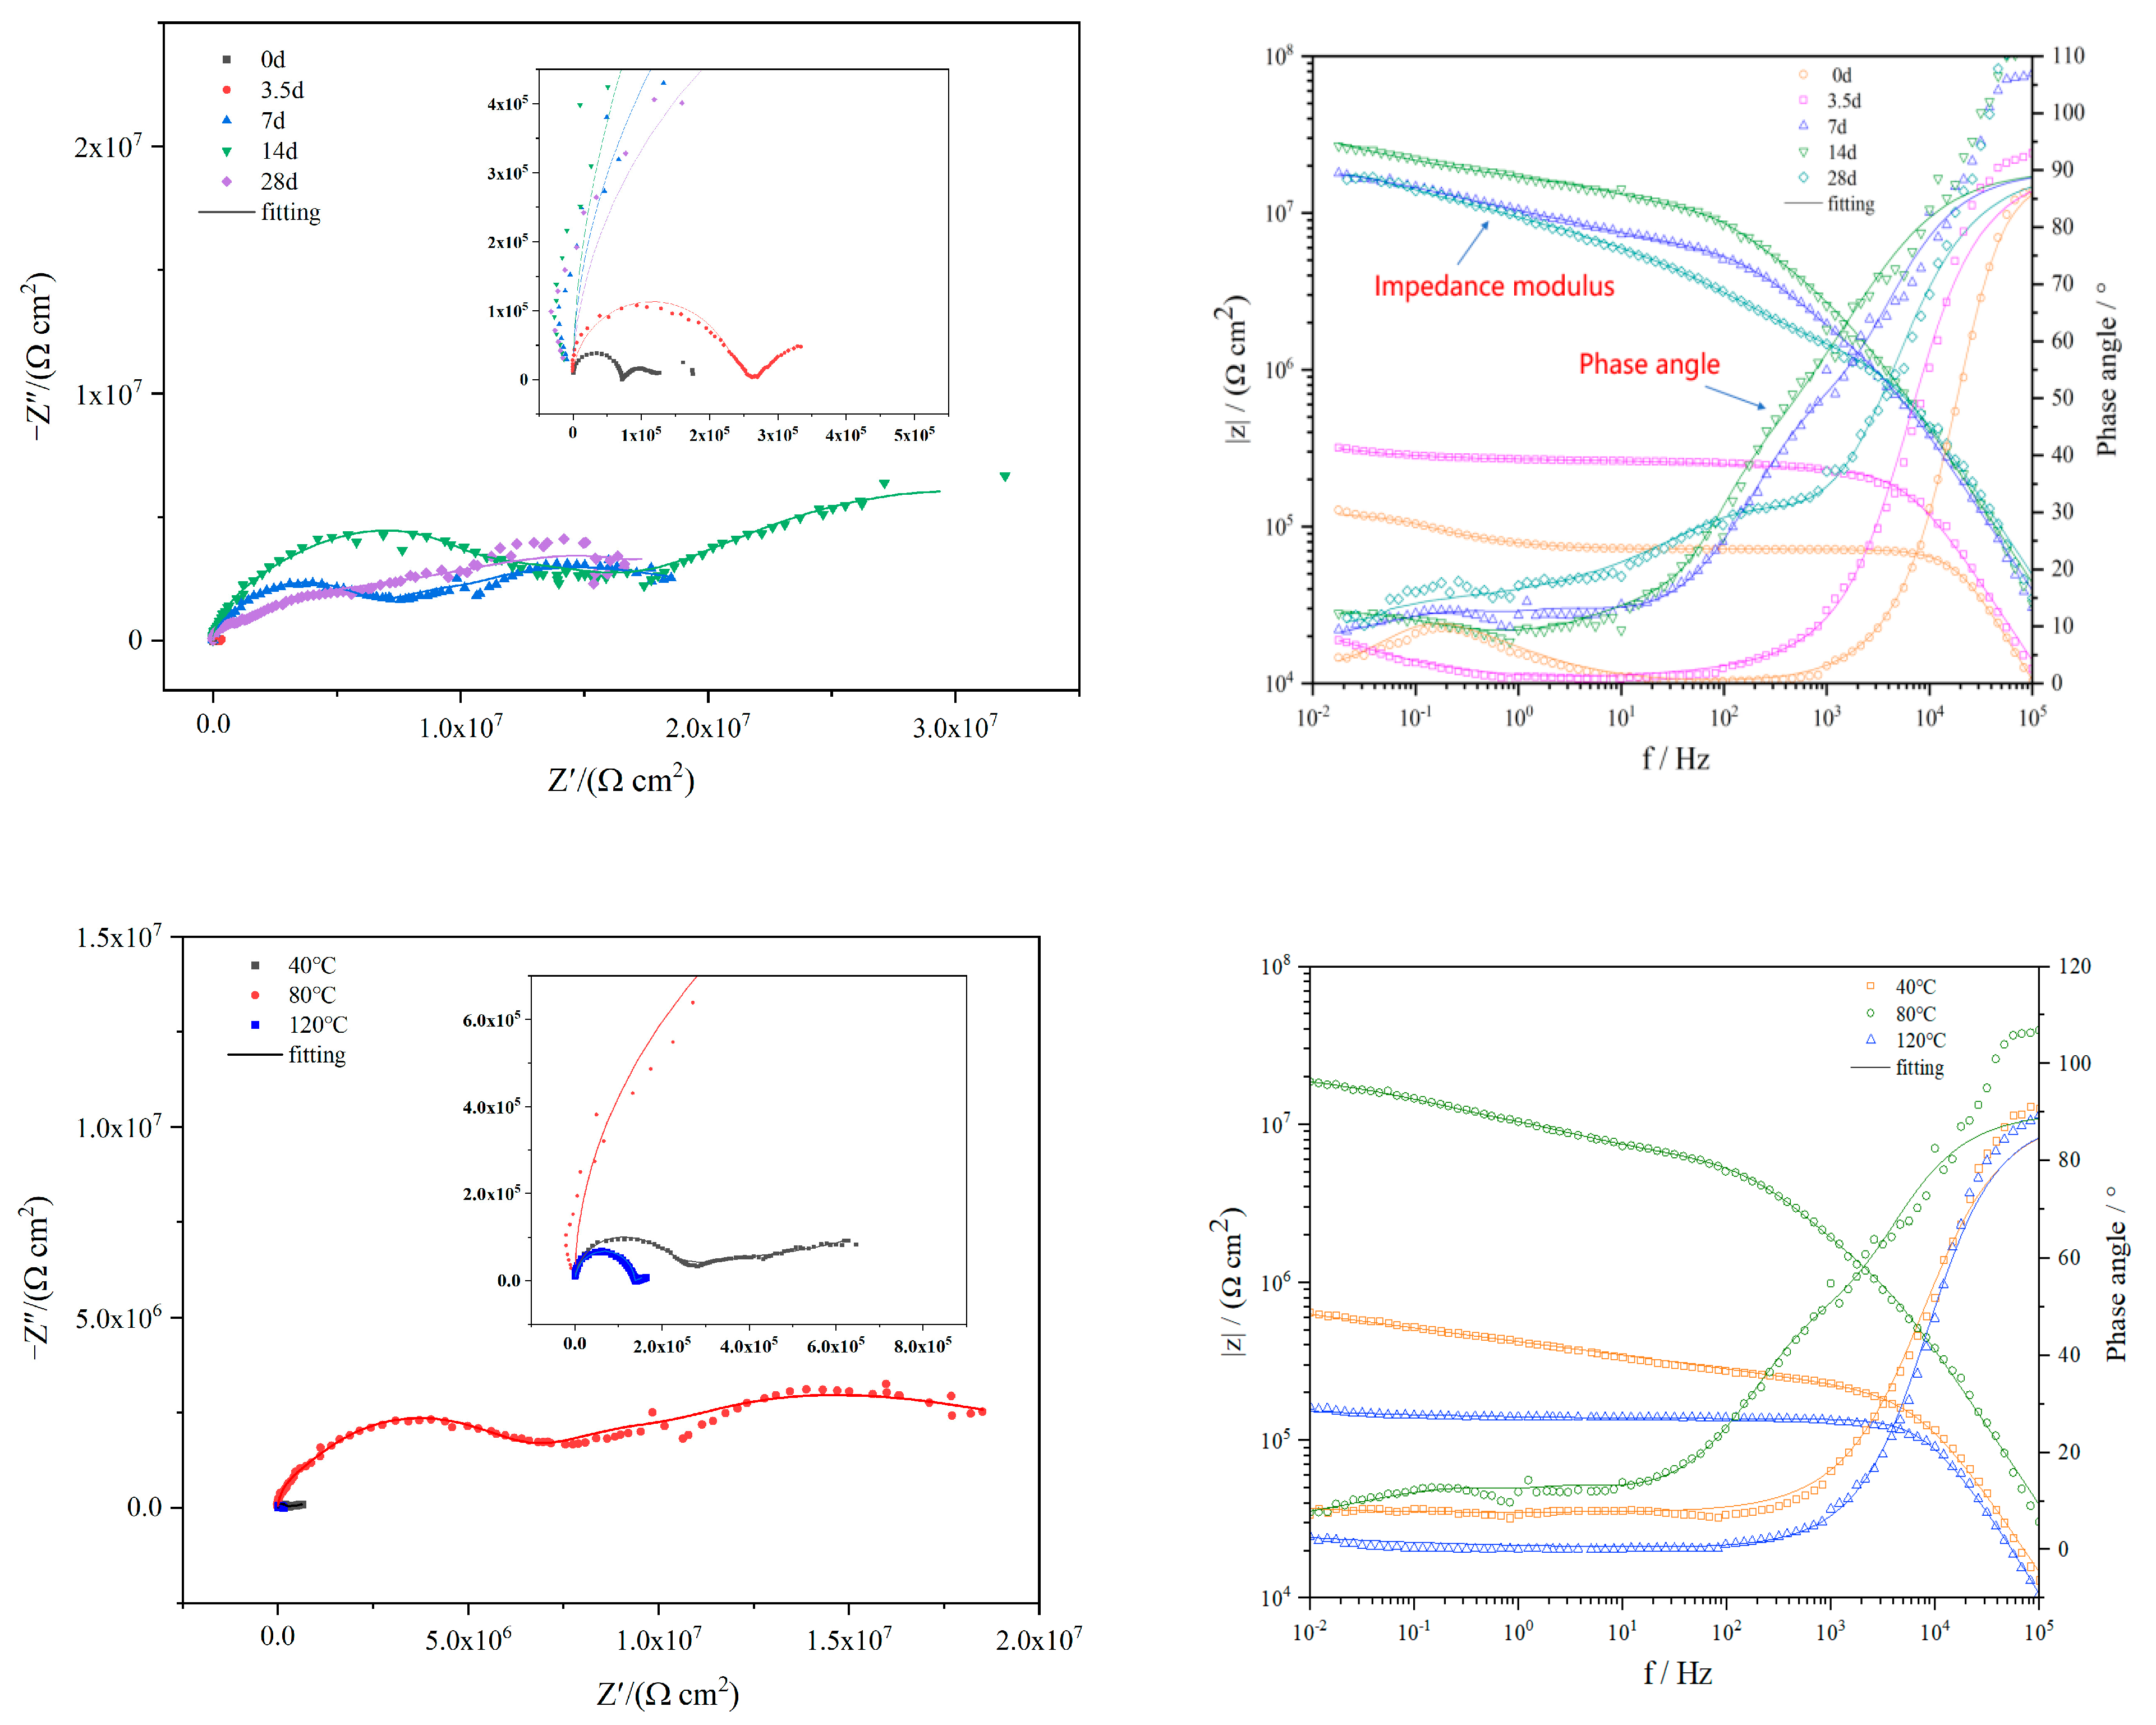
3.3.3. Electrochemical Impedance Spectroscopy
4. Conclusions
Author Contributions
Funding
Institutional Review Board Statement
Informed Consent Statement
Data Availability Statement
Conflicts of Interest
References
- IPCC. Climate Change 2021: The Physical Science Basis. Contribution of Working Group I to the Sixth Assessment Report of the Intergovernmental Panel on Climate Change; Cambridge University Press: Cambridge, UK; New York, NY, USA, 2021; p. 2391. [Google Scholar]
- Rani, S.; Padmanabhan, E.; Prusty, B.K. Review of gas adsorption in shales for enhanced methane recovery and CO2 storage. J. Petrol. Sci. Eng. 2019, 175, 634–643. [Google Scholar] [CrossRef]
- Czernichowski-Lauriol, I.; Berenblyum, R.; Bigi, S.; Car, M.; Gastine, M.; Persoglia, S.; Poulsen, N.; Schmidt-Hattenberger, C.; Stead, R.; Vincent, C.; et al. CO2 GeoNet actions in Europe for advancing CCUS through global cooperation. Energy Procedia 2018, 154, 73–79. [Google Scholar] [CrossRef]
- Bhave, A.; Taylor, R.H.S.; Fennell, P.; Livingston, W.; Shah, N.; Dowell, N.M.; Dennis, J.; Kraft, M.; Pourkashanian, M.; Insa, M.; et al. Screening and techno-economic assessment of biomass-based power generation with CCS technologies to meet 2050 CO2 targets. Appl. Energ. 2017, 190, 481–489. [Google Scholar] [CrossRef]
- Reiner, D.M. Learning through a portfolio of carbon capture and storage demonstration projects. Nat. Energy 2016, 1, 15011. [Google Scholar] [CrossRef]
- Zeng, Y.; Pang, X.; Shi, C.; Arafin, M.; Zavadil, R.; Collier, J. Influence of impurities on corrosion performance of pipeline steels in supercritical carbon dioxide. In Proceedings of the Corrosion 2015, Dallas, Texas, USA, 15–19 March 2015. [Google Scholar]
- Zhang, Y.; Gao, K.; Schmitt, G. Effect of water on steel corrosion under supercritical CO2 conditions. Mater. Perform. 2011, 50, 62–68. [Google Scholar]
- Cui, L.; Kang, W.; You, H.; Cheng, J.; Li, Z. Experimental study on corrosion of J55 casing steel and N80 tubing steel in high pressure and high temperature solution containing CO2 and NaCl. J. Bio-Tribo-Corros. 2020, 7, 13. [Google Scholar] [CrossRef]
- Wang, Y. Effect of temperature on CO2/H2S corrosion of oil tube steels. Adv. Mat. Res. 2014, 908, 111–114. [Google Scholar]
- Jingen, D.; Wei, Y.; Xiaorong, L.; Xiaoqin, D. Influence of H2S content on CO2 corrosion behaviors of N80 tubing steel. Pet. Sci. Technol. 2011, 29, 1387–1396. [Google Scholar] [CrossRef]
- Huang, X.B.; Yin, Z.F.; Li, H.L.; Bai, Z.Q.; Zhao, W.Z. Corrosion of N80 tubing steel in brine at 1.2 MPa CO2 containing trace amounts of H2S. Corros. Eng. Sci. Technol. 2013, 47, 78–83. [Google Scholar] [CrossRef]
- Cole, I.S.; Paterson, D.A.; Corrigan, P.; Sim, S.; Birbilis, N. State of the aqueous phase in liquid and supercritical CO2 as relevant to CCS pipelines. Int. J. Greenh. Gas Con. 2012, 7, 82–88. [Google Scholar] [CrossRef]
- Basilico, E.; Marcelin, S.; Mingant, R.; Kittel, J.; Fregonese, M.; Ropital, F. The effect of chemical species on the electrochemical reactions and corrosion product layer of carbon steel in CO2 aqueous environment: A review. Corros. Mater. 2021, 72, 1152–1167. [Google Scholar] [CrossRef]
- Pentland, N.; Bockris, J.M.; Sheldon, E. Hydrogen evolution reaction on copper, gold, molybdenum, palladium, rhodium, and iron: Mechanism and measurement technique under high purity conditions. J. Electrochem. Soc. 1957, 104, 182. [Google Scholar] [CrossRef]
- Bockris, J.M.; Potter, E. The mechanism of the cathodic hydrogen evolution reaction. J. Electrochem. Soc. 1952, 99, 169. [Google Scholar] [CrossRef]
- Devanathan, M.; Stachurski, Z. The mechanism of hydrogen evolution on iron in acid solutions by determination of permeation rates. J. Electrochem. Soc. 1964, 111, 619. [Google Scholar] [CrossRef]
- Zhang, G.A.; Cheng, Y.F. Electrochemical characterization and computational fluid dynamics simulation of flow-accelerated corrosion of X65 steel in a CO2-saturated oilfield formation water. Corros. Sci. 2010, 52, 2716–2724. [Google Scholar] [CrossRef]
- Duan, Z.; Sun, R. An improved model calculating CO2 solubility in pure water and aqueous NaCl solutions from 273 to 533 K and from 0 to 2000 bar. Chem. Geol. 2003, 193, 257–271. [Google Scholar] [CrossRef]
- Zhang, Y.; Pang, X.; Qu, S.; Li, X.; Gao, K. Discussion of the CO2 corrosion mechanism between low partial pressure and supercritical condition. Corros. Sci. 2012, 59, 186–197. [Google Scholar] [CrossRef]
- Wei, L.; Pang, X.; Liu, C.; Gao, K. Formation mechanism and protective property of corrosion product scale on X70 steel under supercritical CO2 environment. Corros. Sci. 2015, 100, 404–420. [Google Scholar] [CrossRef]
- Farelas, F.; Choi, Y.S.; Nešić, S.; Magalhães, A.A.O.; de Azevedo Andrade, C. Corrosion behavior of deep water oil production tubing material under supercritical CO2 environment: Part 2—Effect of crude oil and flow. Nace Corros. 2014, 70, 137–145. [Google Scholar] [CrossRef]
- Choi, Y.S.; Farelas, F.; Nešić, S.; Magalhães, A.A.O.; de Azevedo Andrade, C. Corrosion behavior of deep water oil production tubing material under supercritical CO2 environment: Part 1—Effect of pressure and temperature. Corrosion 2014, 70, 38–47. [Google Scholar] [CrossRef] [PubMed]
- Wei, L.; Pang, X.L.; Gao, K.W. Corrosion mechanism discussion of X65 steel in NaCl solution saturated with supercritical CO2. Acta Met. Sin 2015, 51, 701–712. [Google Scholar]
- Zhang, Y.; Gao, K.; Schmitt, G.; Hausler, R.H. Modeling steel corrosion under supercritical CO2 conditions. Corros. Mater. 2013, 64, 478–485. [Google Scholar] [CrossRef]
- Jiang, X.; Qu, D.R.; Song, X.L.; Liu, X.H.; Zhang, Y.L. Critical water content for corrosion of X65 mild steel in gaseous, liquid and supercritical CO2 stream. Int. J. Greenh. Gas Control 2019, 85, 11–22. [Google Scholar] [CrossRef]
- De Visser, E.; Hendriks, C.; Barrio, M.; Mølnvik, M.J.; De Koeijer, G.; Liljemark, S.; Le Gallo, Y. Dynamis CO2 quality recommendations. Int. J. Greenh. Gas Control 2008, 2, 478–484. [Google Scholar] [CrossRef]
- McGrail, B.P.; Schaef, H.T.; Glezakou, V.A.; Dang, L.X.; Owen, A.T. Water reactivity in the liquid and supercritical CO2 phase: Has half the story been neglected? Energy Procedia 2009, 1, 3415–3419. [Google Scholar] [CrossRef]
- Tavares, L.M.; da Costa, E.M.; de Oliveira Andrade, J.J.; Hubler, R.; Huet, B. Effect of calcium carbonate on low carbon steel corrosion behavior in saline CO2 high pressure environments. Appl. Surf. Sci. 2015, 359, 143–152. [Google Scholar] [CrossRef]
- Duan, H.; Du, K.; Yan, C.; Wang, F. Electrochemical corrosion behavior of composite coatings of sealed MAO film on magnesium alloy AZ91D. Electrochim. Acta 2006, 51, 2898–2908. [Google Scholar] [CrossRef]
- Cui, L.Y.; Zeng, R.C.; Guan, S.K.; Qi, W.C.; Zhang, F.; Li, S.Q.; Han, E.H. Degradation mechanism of micro-arc oxidation coatings on biodegradable Mg-Ca alloys: The influence of porosity. J. Alloys Compd. 2017, 695, 2464–2476. [Google Scholar] [CrossRef]
- Zhang, G.; Wu, L.; Tang, A.; Ma, Y.; Song, G.L.; Zheng, D.; Jiang, B.; Atrens, A.; Pan, F. Active corrosion protection by a smart coating based on a MgAl-layered double hydroxide on a cerium-modified plasma electrolytic oxidation coating on Mg alloy AZ31. Corros. Sci. 2018, 139, 370–382. [Google Scholar] [CrossRef]
- Bordbar-Khiabani, A.; Yarmand, B.; Mozafari, M. Enhanced corrosion resistance and in-vitro biodegradation of plasma electrolytic oxidation coatings prepared on AZ91 Mg alloy using ZnO nanoparticles-incorporated electrolyte. Surf. Coat. Technol. 2019, 360, 153–171. [Google Scholar] [CrossRef]


| C | Si | P | S | Mo | Cr | Ni | Mn | Fe |
|---|---|---|---|---|---|---|---|---|
| 0.24 | 0.22 | 0.013 | 0.04 | 0.021 | 0.036 | 0.028 | 1.19 | balance |
| Condition | Temperature (°C) | Phase | Immersion Time (d) | Ca2+ (mol/L) | Mg2+ (mol/L) |
|---|---|---|---|---|---|
| 1 | 40 | Formation water and Sc-CO2 two-phase | 7 | 0.18 | 0.01 |
| 2 | 80 | 3.5, 7, 14, 28 | |||
| 3 | 120 | 7 |
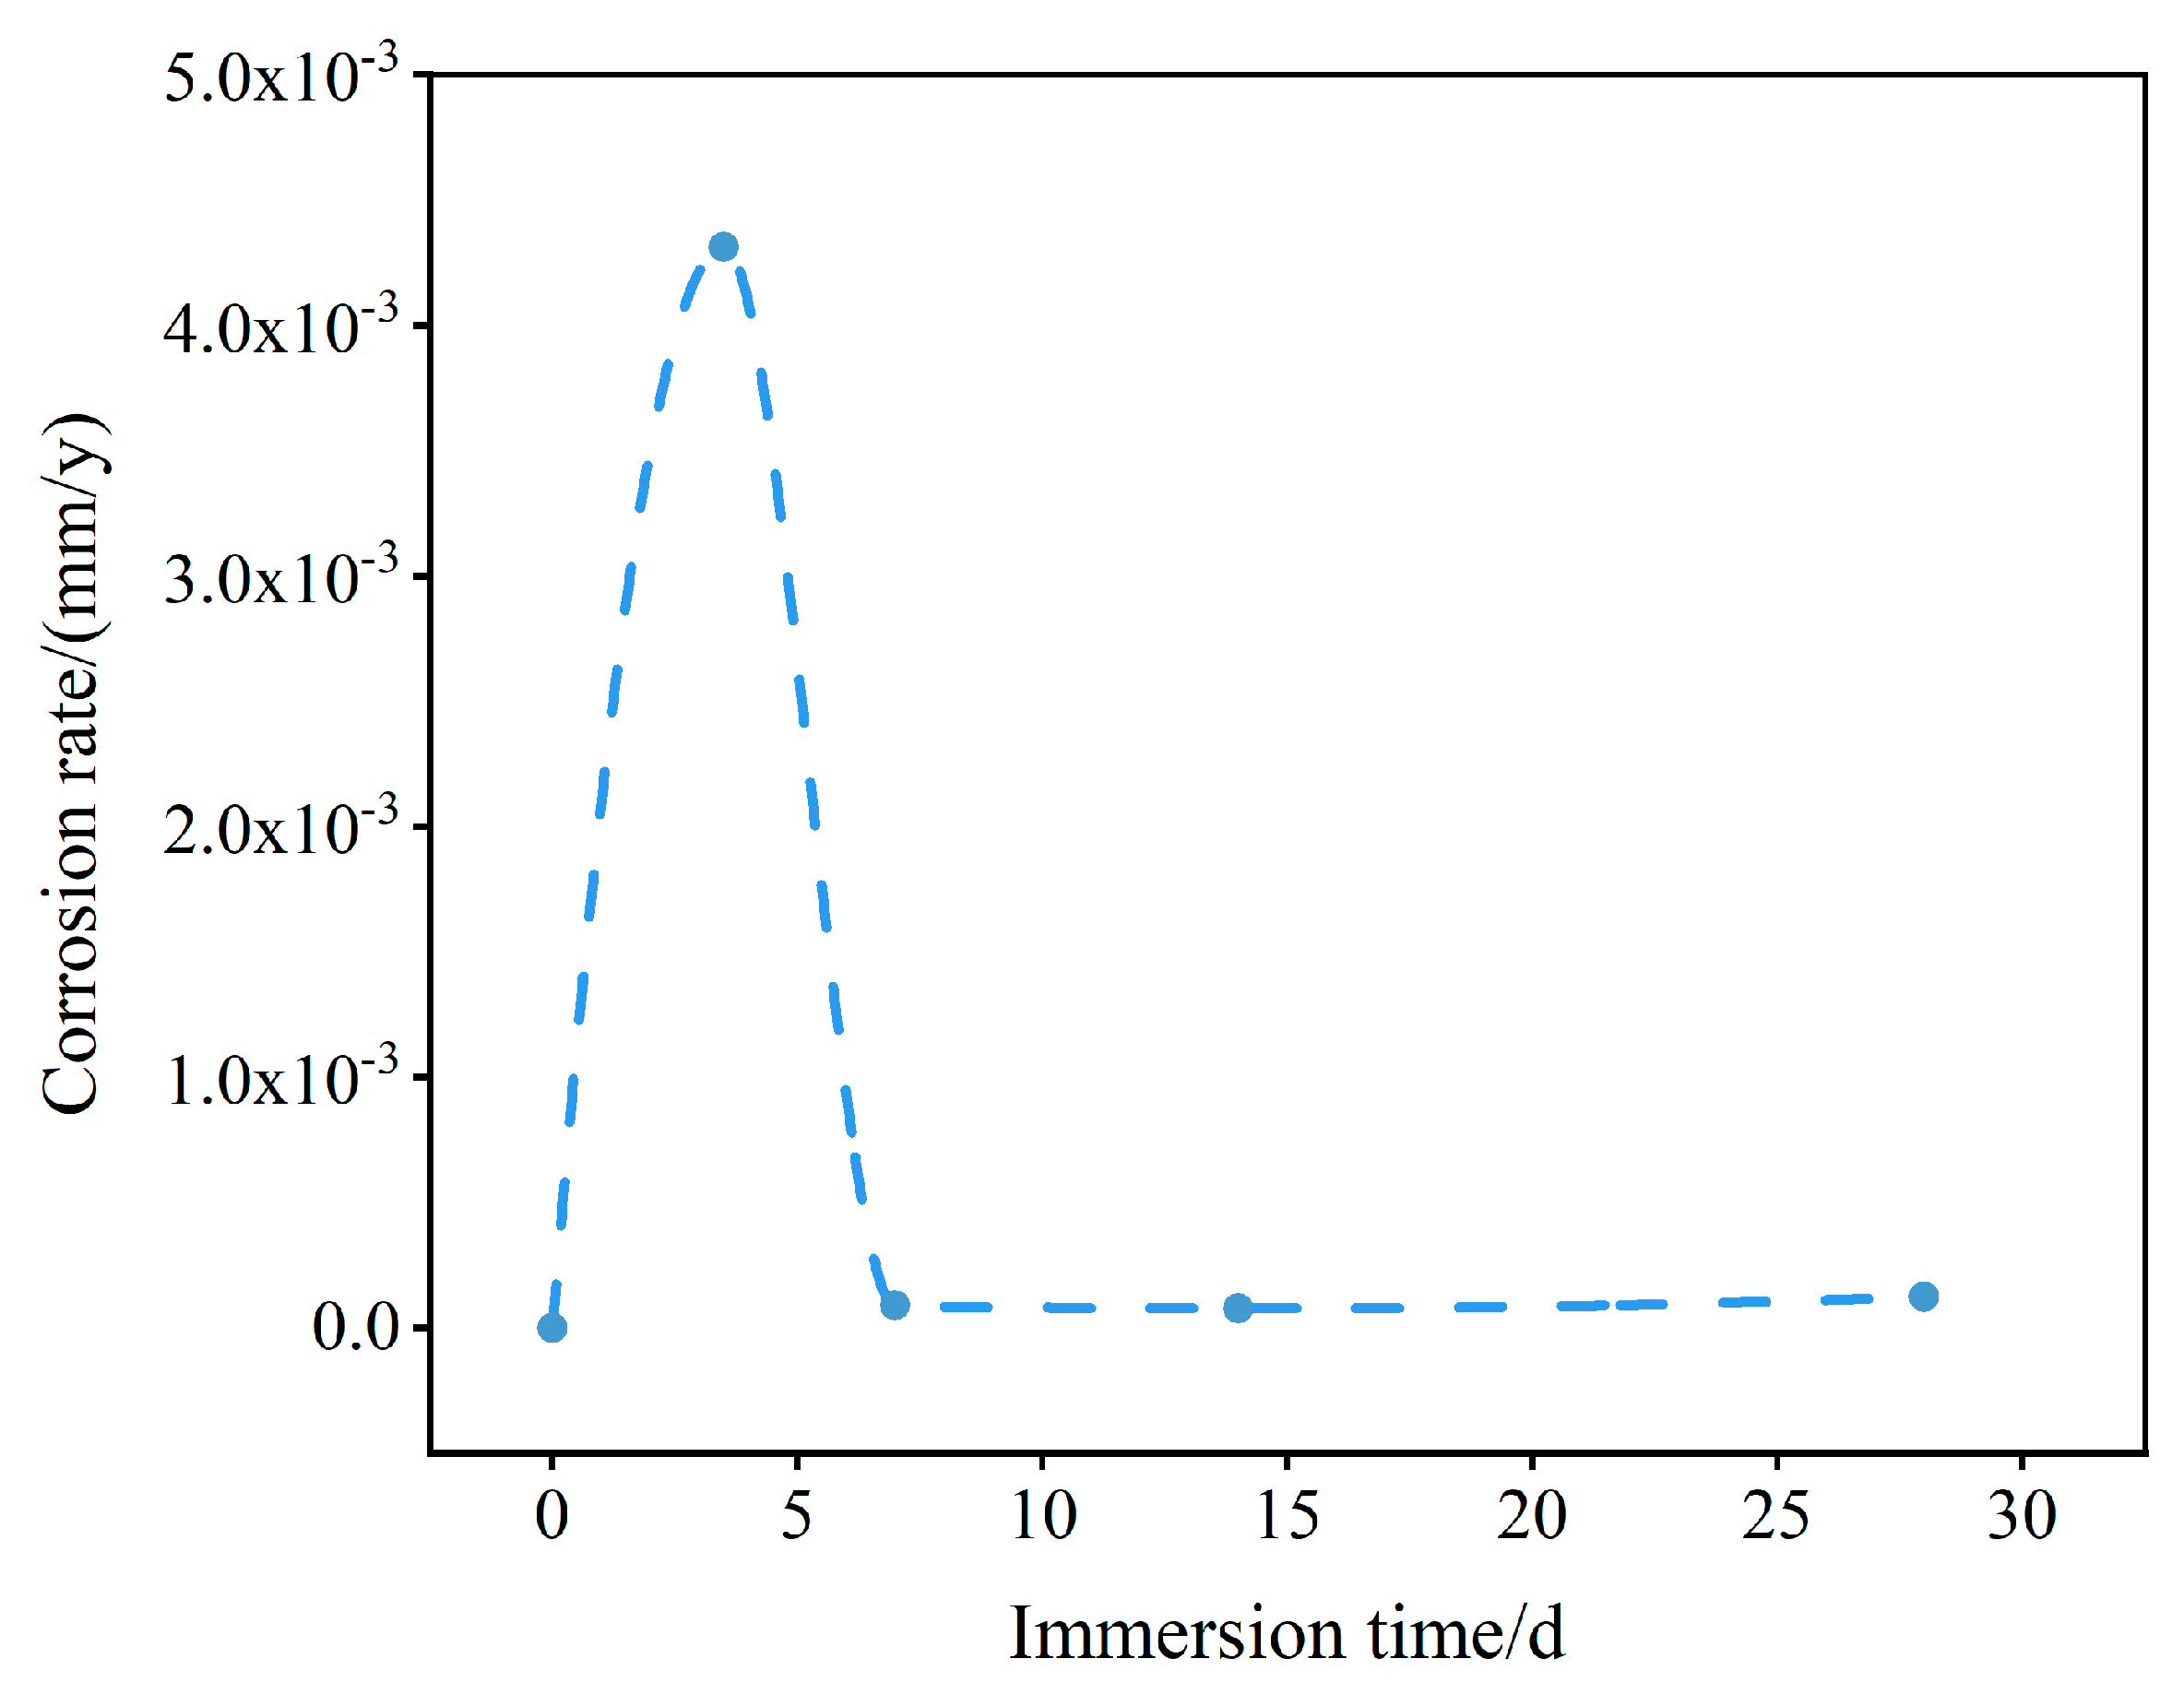
| Time (d) | 3.5 | 7 | 14 | 28 |
|---|---|---|---|---|
| Corrosion rate (mm/y) | 4.31 × 10⁻³ | 8.78 × 10⁻⁵ | 7.54 × 10⁻⁵ | 1.23 × 10⁻⁴ |
| Temperature (°C) | 40 | 80 | 120 |
|---|---|---|---|
| Corrosion rate (mm/y) | 2.10 × 10⁻³ | 8.78 × 10⁻⁵ | 9.94 × 10⁻³ |
| Conditions | Ecorr, SCE/V | Icorr/A·cm2 | Rp/Ω·cm2 |
|---|---|---|---|
| 3.5 d | −0.541 | 3.70 × 10⁻⁷ | 9.15 × 10⁵ |
| 7 d | −0.377 | 7.53 × 10⁻⁹ | 5.47 × 10⁷ |
| 14 d | −0.522 | 6.47 × 10⁻⁹ | 6.44 × 10⁷ |
| 28 d | −0.427 | 1.05 × 10⁻⁸ | 3.83 × 10⁷ |
| 40 °C | −0.326 | 1.80 × 10⁻⁷ | 1.95 × 10⁶ |
| 80 °C | −0.377 | 7.53 × 10⁻⁹ | 5.47 × 10⁷ |
| 120 °C | −0.416 | 8.54 × 10⁻⁷ | 3.99 × 10⁵ |
Disclaimer/Publisher’s Note: The statements, opinions and data contained in all publications are solely those of the individual author(s) and contributor(s) and not of MDPI and/or the editor(s). MDPI and/or the editor(s) disclaim responsibility for any injury to people or property resulting from any ideas, methods, instructions or products referred to in the content. |
© 2024 by the authors. Licensee MDPI, Basel, Switzerland. This article is an open access article distributed under the terms and conditions of the Creative Commons Attribution (CC BY) license (https://creativecommons.org/licenses/by/4.0/).
Share and Cite
Wang, H.; Zhang, L.; Gan, M.; Su, X.; Wang, Y.; Xue, Q.; Mei, K.; Fu, X. Temperature and Reaction Time’s Effects on N80 Steel Corrosion Behavior in Supercritical CO2 and Formation Water Environments. Appl. Sci. 2024, 14, 728. https://doi.org/10.3390/app14020728
Wang H, Zhang L, Gan M, Su X, Wang Y, Xue Q, Mei K, Fu X. Temperature and Reaction Time’s Effects on N80 Steel Corrosion Behavior in Supercritical CO2 and Formation Water Environments. Applied Sciences. 2024; 14(2):728. https://doi.org/10.3390/app14020728
Chicago/Turabian StyleWang, Hanwen, Liwei Zhang, Manguang Gan, Xuebin Su, Yan Wang, Quan Xue, Kaiyuan Mei, and Xiaojuan Fu. 2024. "Temperature and Reaction Time’s Effects on N80 Steel Corrosion Behavior in Supercritical CO2 and Formation Water Environments" Applied Sciences 14, no. 2: 728. https://doi.org/10.3390/app14020728
APA StyleWang, H., Zhang, L., Gan, M., Su, X., Wang, Y., Xue, Q., Mei, K., & Fu, X. (2024). Temperature and Reaction Time’s Effects on N80 Steel Corrosion Behavior in Supercritical CO2 and Formation Water Environments. Applied Sciences, 14(2), 728. https://doi.org/10.3390/app14020728