Article

Fall Recognition Based on Time-Level Decision Fusion Classification

1
Department of Railroad Electrical and Electronics Engineering, Korea National University of Transportation, Uiwang-si 16101, Republic of Korea
2
Department of Artificial Intelligence, Gyeonggi University of Science and Technology, Siheung-si 15073, Republic of Korea
*
Author to whom correspondence should be addressed.
Appl. Sci. 2024, 14(2), 709; https://doi.org/10.3390/app14020709
Submission received: 17 October 2023 / Revised: 25 December 2023 / Accepted: 10 January 2024 / Published: 14 January 2024

Abstract

:
We propose a vision-based fall detection algorithm using advanced deep learning models and fusion methods for smart safety management systems. By detecting falls through visual cues, it is possible to leverage existing surveillance cameras, thus minimizing the need for extensive additional equipment. Consequently, we developed a cost-effective fall detection system. The proposed system consists of four modules: object detection, pose estimation, action recognition, and result fusion. Constructing the fall detection system involved the utilization of state-of-the-art (SOTA) models. In the fusion module, we experimented with various approaches, including voting, maximum, averaging, and probabilistic fusion. Notably, we observed a significant performance improvement with the use of probabilistic fusion. We employed the HAR-UP dataset to demonstrate this enhancement, achieving an average 0.84% increase in accuracy compared to the baseline, which did not incorporate fusion methods. By applying our proposed time-level ensemble and skeleton-based fall detection approach, coupled with the use of enhanced object detection and pose estimation modules, we substantially improved the robustness and accuracy of the system, particularly for fall detection in challenging scenarios.

1. Introduction

As perceptions of safety in society change and legal regulations for safety become stronger, the demand for safety management is increasing. However, there is currently a shortage of personnel for safety management, and efficiency is not at its optimum level. An efficient safety management system is essential for addressing these challenges. A recent and increasing trend in research focuses on the incorporation of artificial intelligence technologies into safety management systems [1,2,3,4]. By utilizing artificial intelligence, it is possible to detect and respond to accidents involving onsite workers and facility users in real time, thereby minimizing additional damage. In South Korea, accidents caused by falls are the most common type of industrial disasters [5]. Therefore, in this study, we propose an algorithm for real-time fall detection using state-of-the-art deep learning models for a smart safety management system.
In parallel with our research, a range of investigations are underway to detect falls using diverse sensor technologies [6,7,8,9,10,11,12,13,14,15,16,17,18,19,20,21,22,23,24,25,26,27]. These include wearable devices, accelerometers, radars, and video sensors. Furthermore, researchers are actively exploring the possibility of fall detection in multimodal scenarios by utilizing a combination of different sensors [23,24,25,26,27]. However, when employing a wearable sensor [6,7,8,9], an individual must wear the sensor for fall monitoring, which is inconvenient, and concerns about battery life arise. Moreover, additional equipment is required to use accelerometers or radar sensors [10,11,12,13], and, especially in the radar case, the falls of objects may be mistaken as human falls. Utilizing multimodal approaches to detect falls can enhance performance; however, a potential drawback is processing time degradation owing to the additional tasks required for aligning data from multiple sensors.
Currently, numerous cameras are installed in various locations. Hence, adopting video sensors for fall detection allows seamless integration with already established camera systems, eliminating the requirement for additional hardware and ensuring cost-effectiveness. Moreover, this approach eliminates the need for users to fulfill specific conditions, resulting in reduced user resistance. Therefore, we aim to detect falls using video sensors.
Recently, with the emergence of deep learning, significant advancements have been made in computer vision technology, leading to an increasing number of attempts to solve various issues using computer vision techniques. In particular, the utilization of video data has made it possible to detect falls, and several studies have shown promising outcomes [14,15,16,17,18,19,20,21,22]. In line with this trend, we propose an algorithm for fall detection using deep learning-based computer vision technology.
The proposed fall detection system comprises four modules: object detection, pose estimation, action recognition, and result fusion. The first module, the object detection module, determines the presence of a person and, if detected, provides an output regarding the person’s location in the video. In the second module, the pose estimation module obtains the output from the first module and processes the image section containing the person (rather than the entire image). This process generates skeleton data for pose estimation. The third module, the action recognition module, recognizes the pattern of changes in the joint points of the individual in the video to output the fall detection results. In the fourth module, the result fusion module, the results from the third module are fused using various methods to enhance the robustness and performance, ultimately producing the final result. The main contributions of this study are as follows:
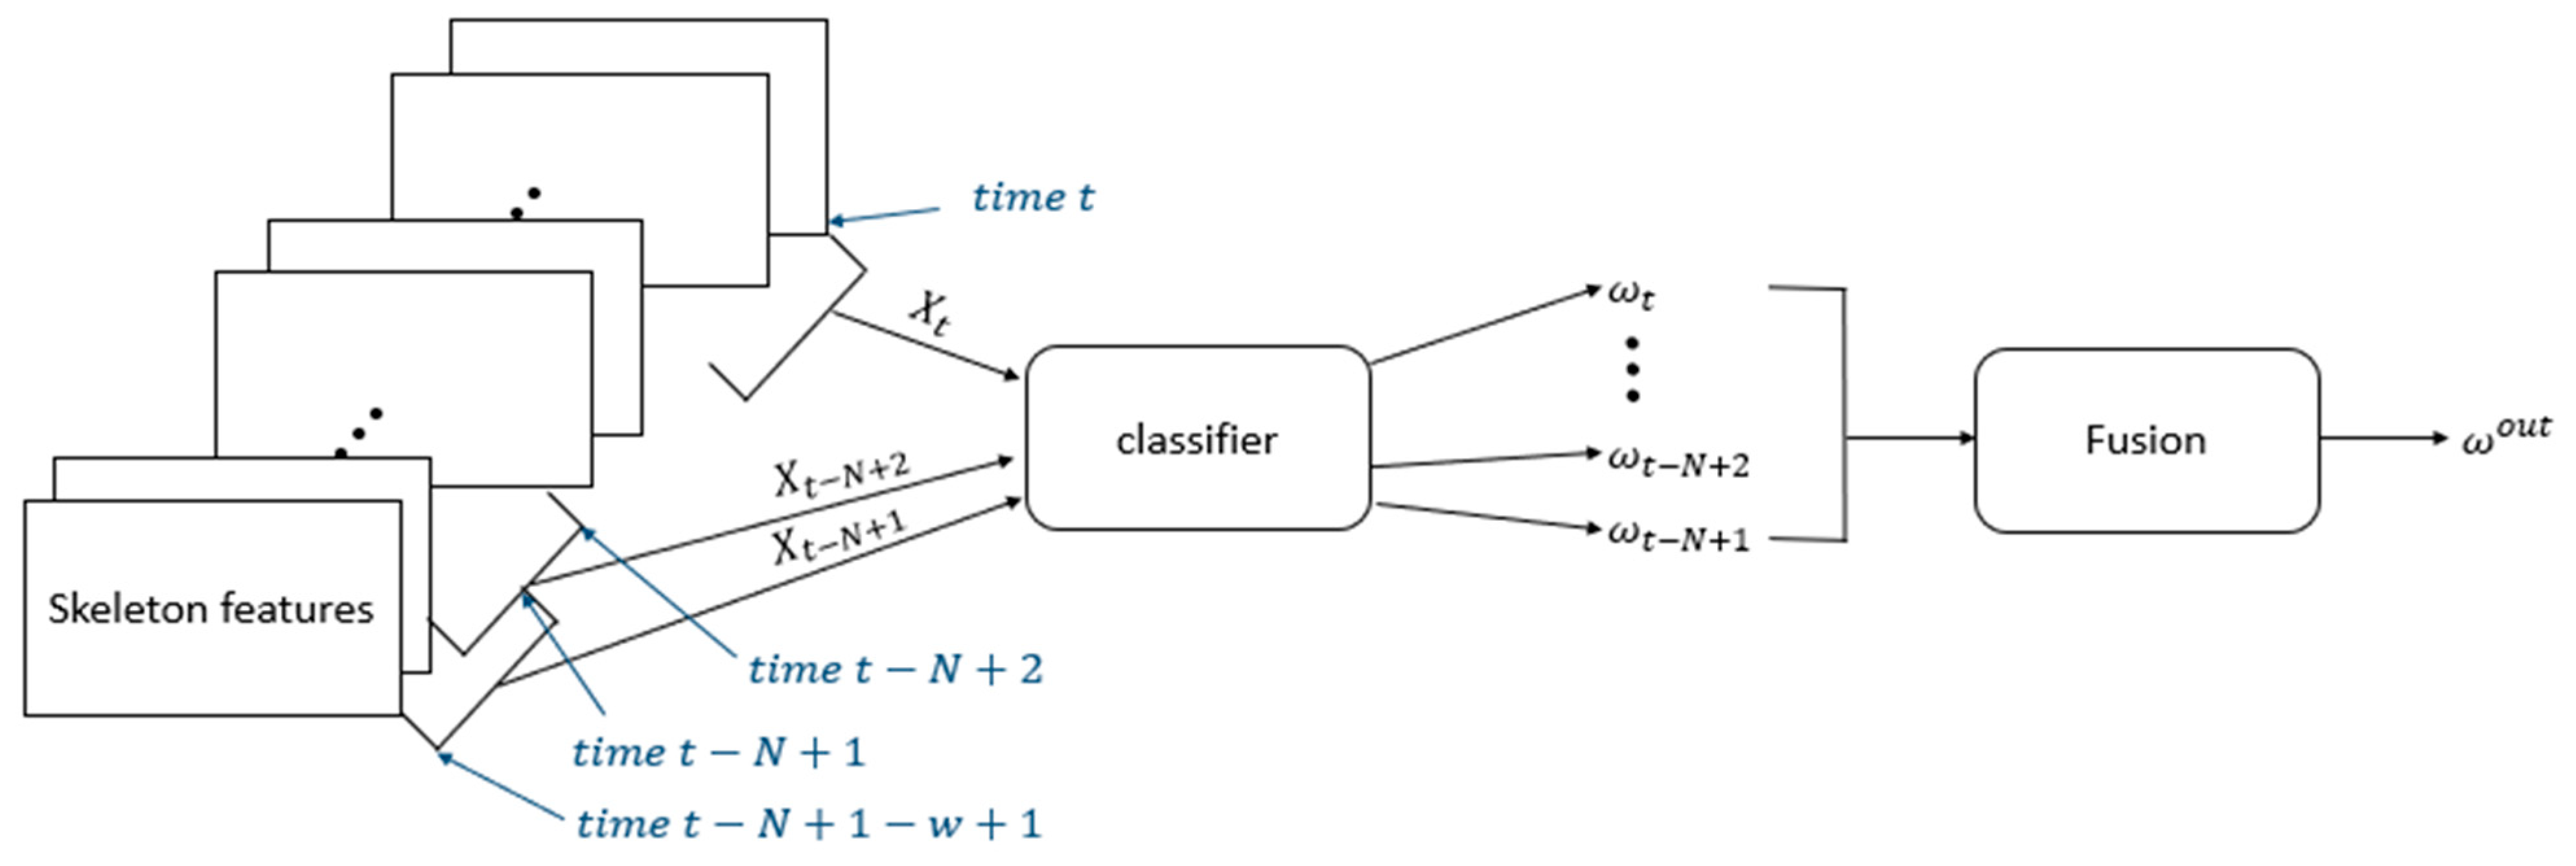
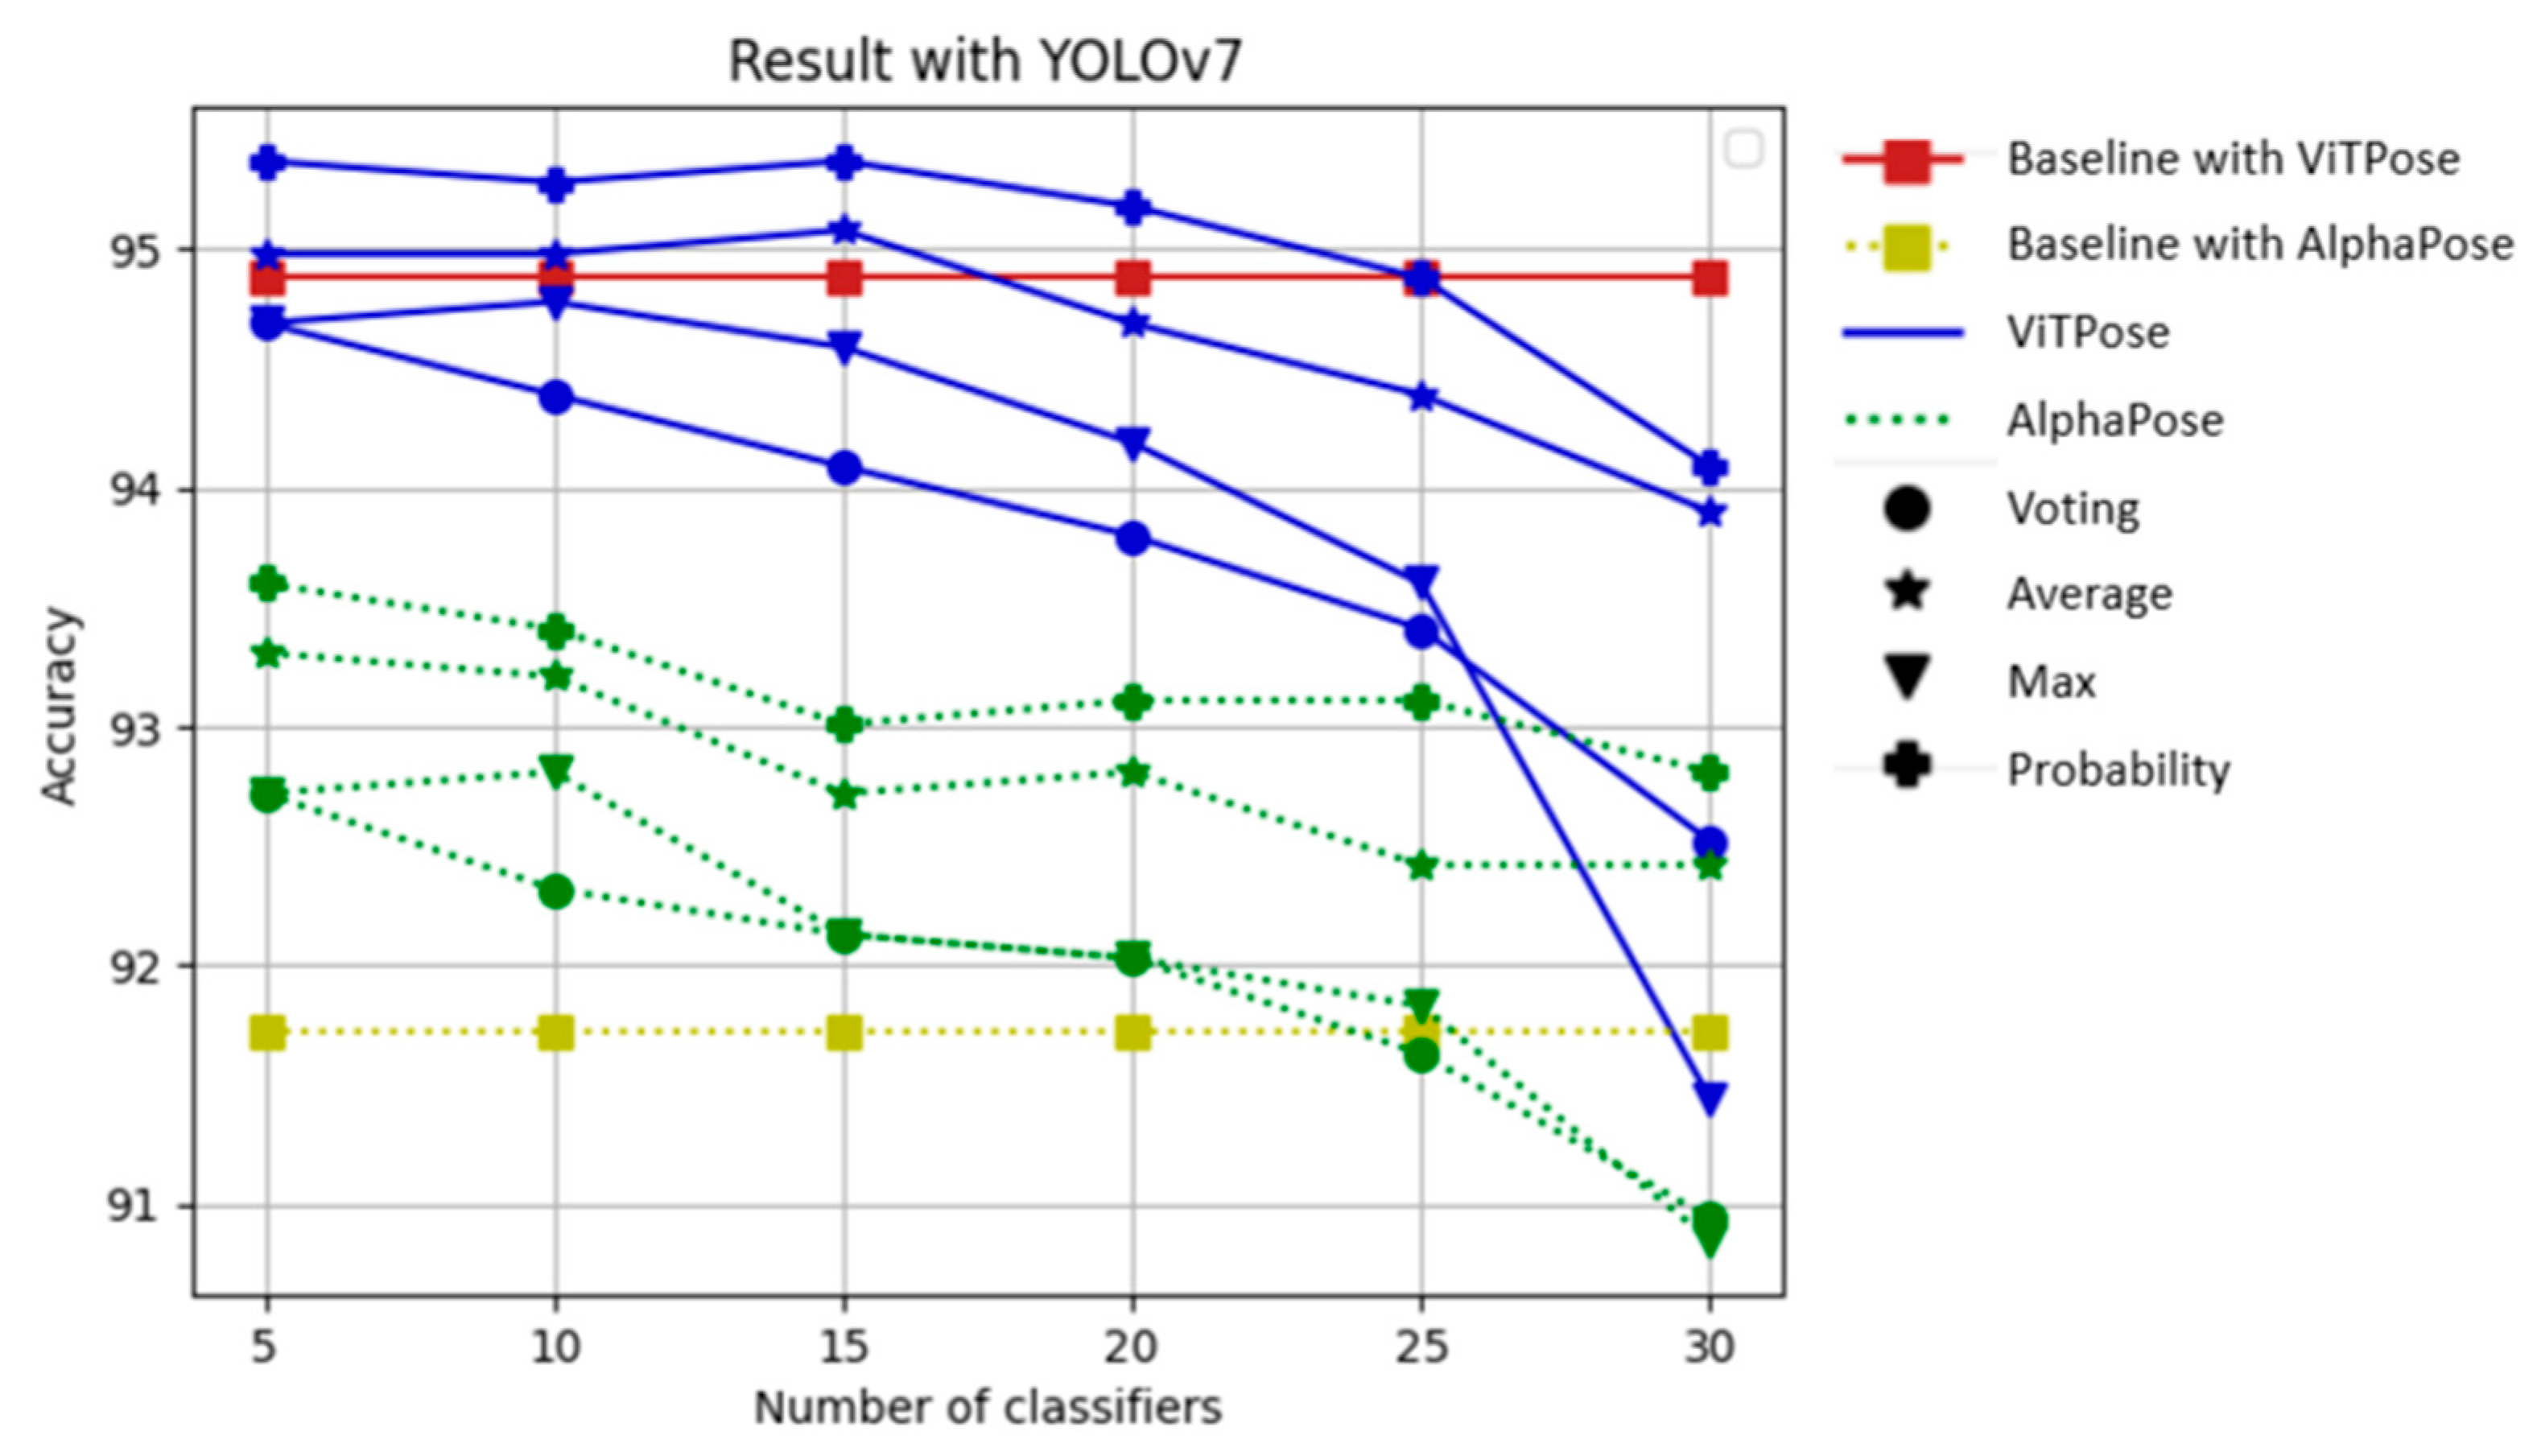
  • Using a time-level ensemble, we aggregate the continuous outcomes of the modules. Thus, the system has enhanced robustness and overcomes challenges under difficult conditions. Various fusion methods, including voting-, averaging-, maximum-, and probability-based approaches, are employed.
  • Our fall detection system is based on skeleton data, which means that the accuracy of person detection and pose estimation significantly influences the fall detection performance. Through comprehensive performance comparisons with several detection models and pose estimation models, we propose suitable person detection and joint point estimation algorithms for fall detection. In the experiment, YOLOv3 [28] and YOLOv7 [29] were employed to detect individuals. Moreover, AlphaPose [30], a convolutional neural network (CNN)-based approach, and ViTPose [31], which is based on a vision transformer (ViT) [32], were utilized to estimate joint points.
This paper is organized as follows: In Section 2 and Section 3, we provide a comprehensive overview of relevant studies that have attempted to detect falls and the details of the entire system process and of each module used to determine falls, respectively. The dataset, experimental setup, and experimental results are presented in Section 4. Finally, conclusions are drawn in Section 5.

2. Related Work

Fall can result in physical and mental injuries, and numerous studies have proposed fall detection methods. Automatic fall detection prevents situations in which injuries caused by falls result in an inability to request aid. Moreover, a reduction in recovery time can be anticipated through prompt first aid. In previous research, various sensors, including accelerometers, radars, and vision sensors, have been employed for fall detection, and the concept of multimodal detection systems has also been introduced.

2.1. Accelerometer-Based Methods

Some studies aim to detect falls by attaching wearable accelerometers to the body and utilizing the values obtained from these sensors [6,7,8,9]. Ref. [6] compared numerous previous studies that used accelerometers for fall detection. In [7], a triaxial accelerometer was worn on the head to analyze acceleration patterns, and if the threshold was exceeded, it was classified as a fall. In [8,9], features were extracted from the values obtained from a triaxial accelerometer, and machine learning-based classifiers were employed to detect falls. In [8], an accelerometer was attached to the chest, and its values were used as inputs for a classifier to classify falls and activities of daily living (ADL). The authors compared the outcomes by employing various machine learning-based classifiers. In [9], a pendant-style triaxial accelerometer that can be worn around the neck was proposed. The authors used long short-term memory (LSTM) to detect falls. Using an accelerometer for fall detection can capitalize on the sensitivity of the sensor itself, resulting in a high recall performance, which classifies actual falls as falls. However, when using an accelerometer attached to a limited body area, it may be challenging to reflect the overall body movement accurately, leading to a higher likelihood of misidentifying activities similar to falls as falls. Additionally, the requirement for wearing an accelerometer necessitates user participation and consent, thereby introducing potential constraints on user convenience.

2.2. Radar-Based Methods

Research is also underway to detect falls by installing radars in the surrounding environment and analyzing the obtained signals [10,11,12,13]. Studies on fall detection using radar sensors were presented in [10]. A custom-made radar sensor and support vector machine (SVM) were employed in [11] to detect falls. In [12,13], a frequency-modulated continuous-wave (FMCW) radar was installed on the ceiling to capture signals for fall detection. In [12], signal preprocessing was applied, followed by the utilization of an SVM as a classifier to detect falls. In contrast, [13] employed a random forest algorithm as a classifier. Radar-based fall detection offers the advantage of detecting falls even in low-light conditions without performance degradation. However, it faces drawbacks related to the installation cost of radar sensors and the potential misclassification of non-human falls, such as objects dropping, as falls.

2.3. Vision-Based Methods

Advancements in deep learning have resulted in significant progress in computer vision technology. Consequently, there has been a notable increase in research aimed at utilizing RGB and RGB-D cameras to recognize human actions and detect falls [14,15,16,17,18,19,20,21,22]. These studies utilized the capabilities of deep learning algorithms to process visual data, facilitating the recognition of human behavior and detection of falls with enhanced accuracy and efficiency. In [14], human behavior was recognized by utilizing estimated human poses from an RGB-D sensor. In [15], fall detection was performed by extracting human silhouettes from RGB-D images through background removal. In [16], fall detection was performed by obtaining 3D skeleton values from RGB-D images. With the advancement of pose estimation algorithms for 2D images, the authors of [17,18,19,20,21] employed RGB images for fall detection. They estimated human poses from RGB images and used these estimations to detect falls. In [17], a recurrent neural network (RNN) utilizing a pose vector as the input was employed for fall detection. In [18], fall detection was conducted using random forest, SVM, and multilayer perceptron (MLP), and their respective performances were compared. The authors of [19,20] employed a spatial temporal graph convolutional network (ST-GCN) for fall detection. Especially in [20], a pre-trained ST-GCN on action recognition data, not fall data, was utilized to extract features for action. Subsequently, the extracted features were used as input to the encoder–decoder model, and if the restored features from the decoder did not exceed a specified threshold, they were recognized as a fall. Furthermore, refs. [21,22] detected falls using feature-level fusion and a 3D-CNN. Vision-based fall detection can utilize the global posture of a person in an image to detect falls. Long-distance fall detection using a vision sensor is advantageous for user convenience, and the integration with existing surveillance cameras allows for cost reduction by minimizing the need for additional equipment.

2.4. Multimodal-Based Methods

Other studies have utilized data from various sensors such as cameras, accelerometers, radars, vital signs, gyroscopes, and magnetometers to detect falls or recognize actions [23,24,25,26,27]. In these studies, falls were detected in a multimodal context by extracting features from signals acquired from two or more sensors and then aggregating these features to be used as input for the classifiers. Multimodal-based approaches can achieve high accuracy by integrating data from various sensors. However, processing time may be compromised as values from different sensors need to be aligned and handled, and the system design can become more complex. The advantages and disadvantages of detecting falls using various sensors, as well as the strengths and weaknesses of various vision-based fall detection algorithms under investigation in this paper, are summarized in Table 1 and Table 2, respectively.

3. Fall Detection System

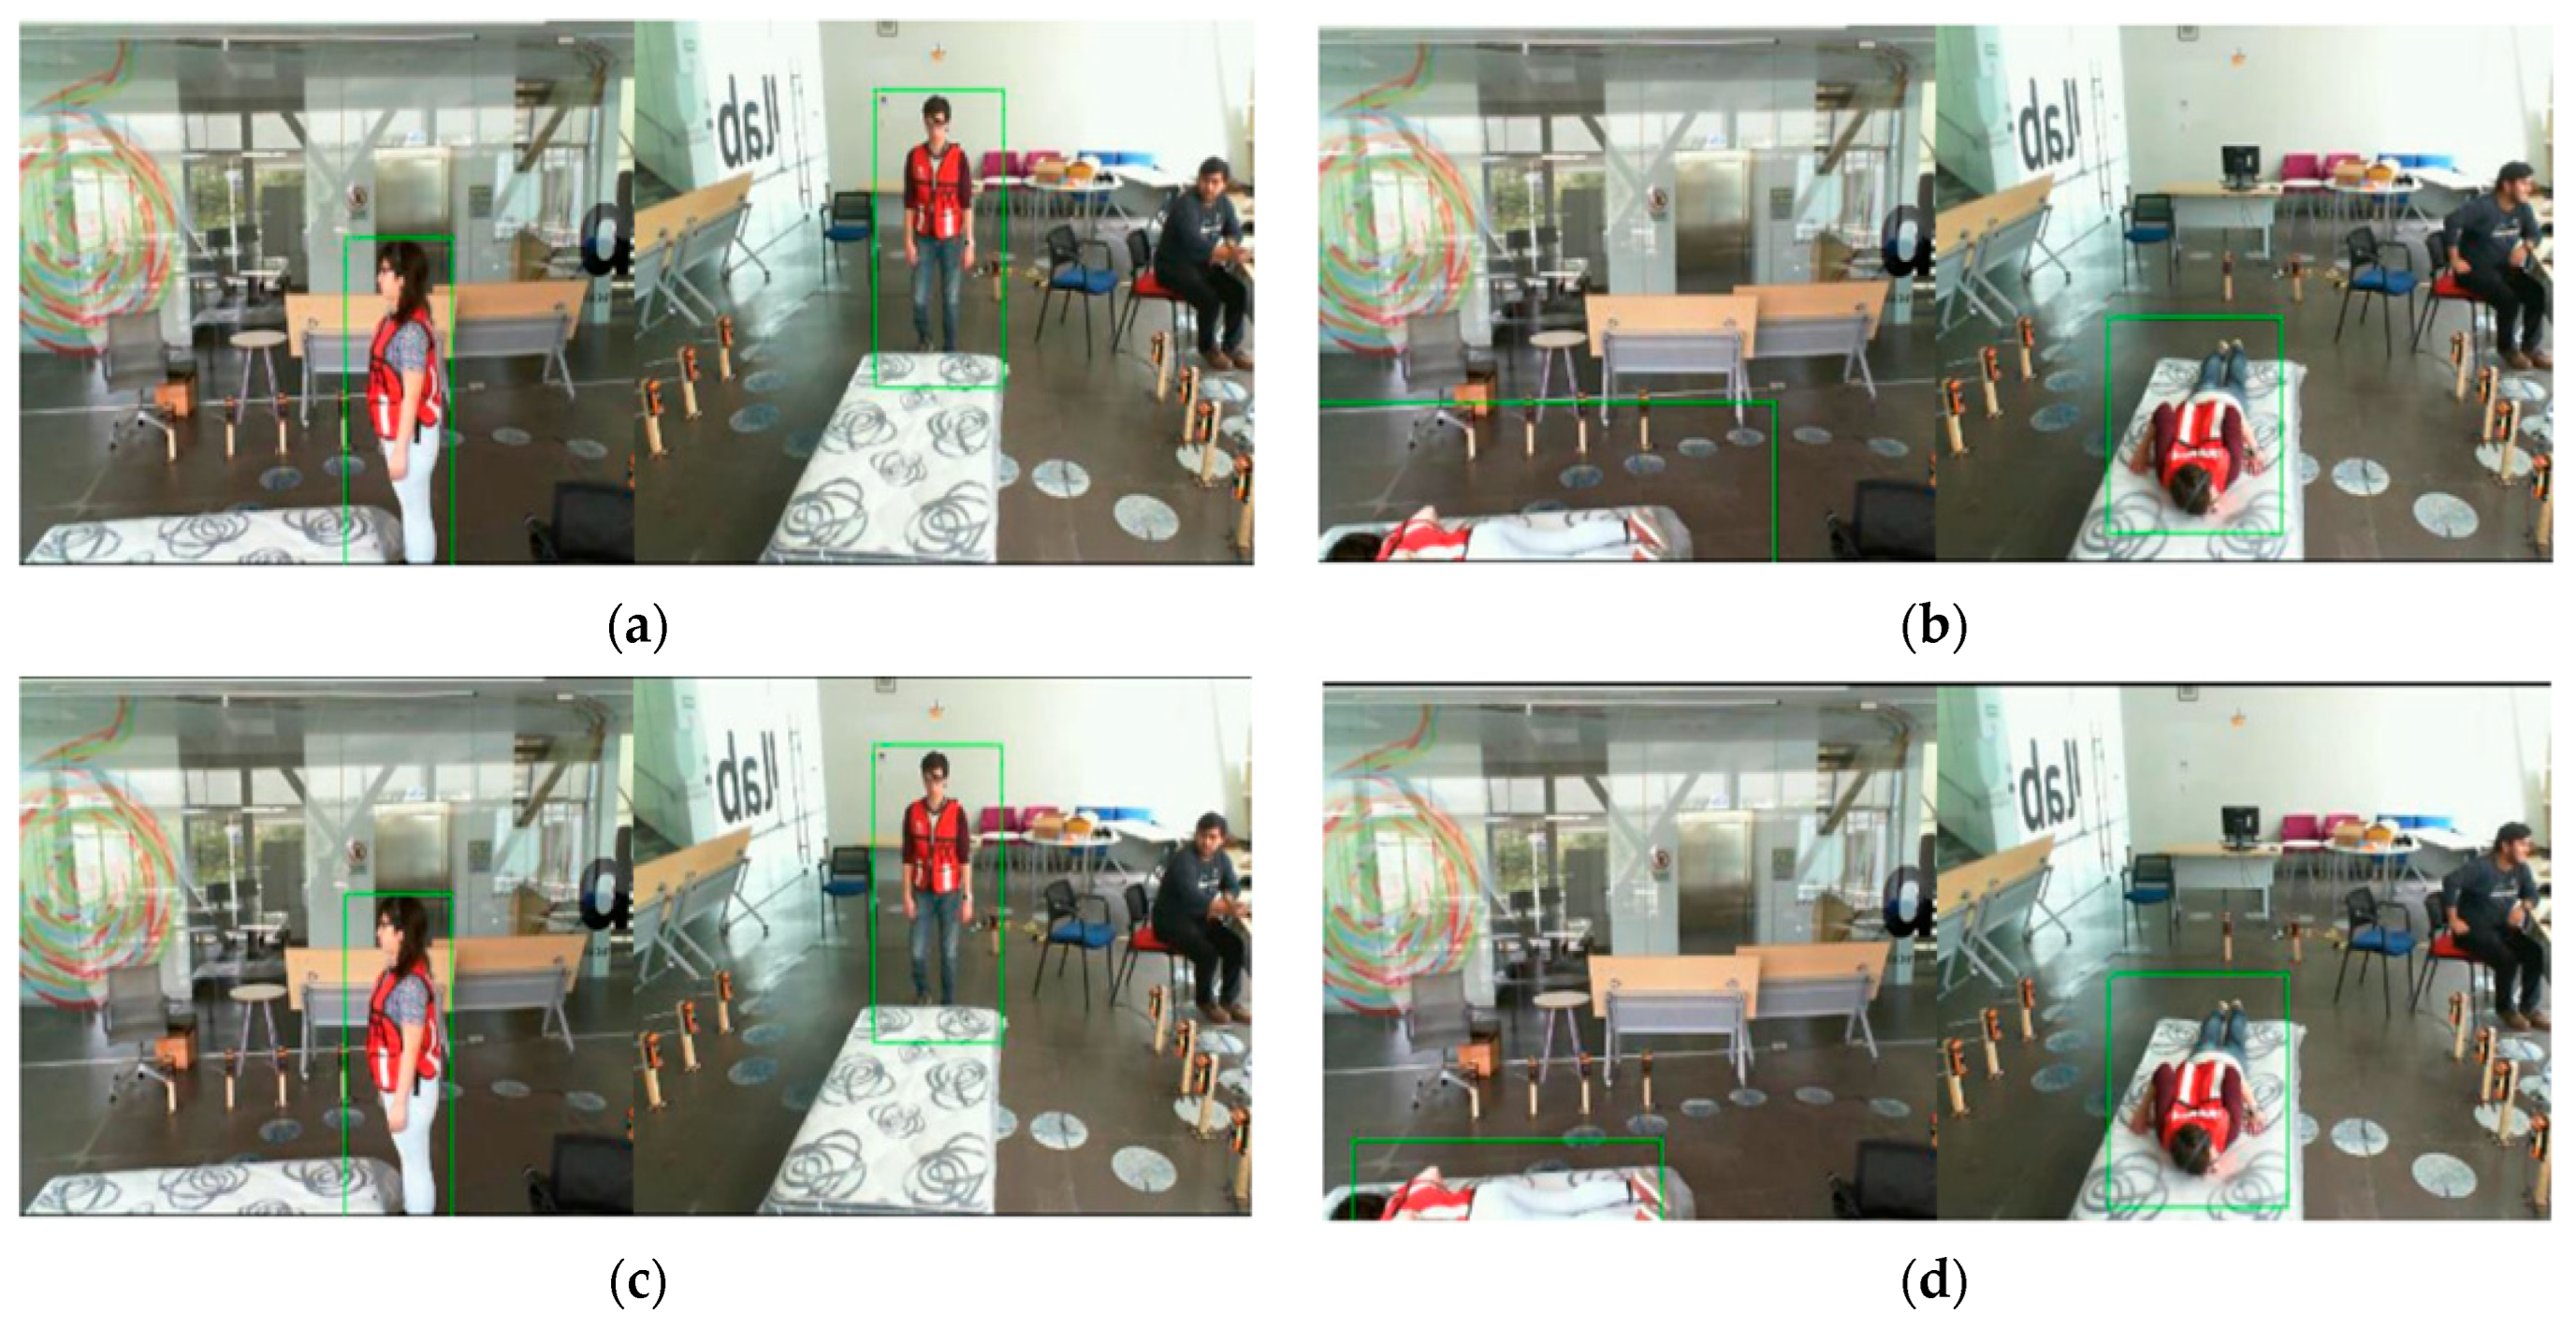
3.1. Person Detection

The complete process of the proposed system is depicted in Figure 1. The initial step in the proposed fall detection method is person detection. The inference speed of each module is important for real-time fall detection. Therefore, in this study, the YOLO model [28,29,33], a highly regarded real-time detector, was employed for person detection. This allows for the rapid transfer of person detection results to the pose-estimation module. YOLO [33] was designed to overcome the slow inference speed of two-stage detectors. It performs bounding-box regression and classification of the feature maps obtained by passing the CNN without requiring separate region proposals. This approach addresses the low detection speed observed in previous models. In this system, YOLO, which is known for its fast detection speed, was used to construct a real-time fall detection system. A pre-trained YOLOv3 was first employed to detect persons. However, the pre-trained YOLOv3 struggled to effectively detect fallen persons. Consequently, YOLOv7, an enhanced version, was used to conduct additional experiments. YOLOv3 [28] employs a residual connection-based backbone for feature extraction. It regresses the bounding box onto feature maps of various resolutions. YOLOv7 [29] employs a concatenation-based backbone that reuses features learned from previous layers, thus increasing the parameter efficiency. YOLOv7 also embraces the neural architecture search (NAS) to achieve an efficient model through scaling. YOLOv7 exhibits a better Pareto front than YOLOv3. The results of person detection using YOLOv3 and YOLOv7 are shown in Figure 2. Only the region containing the participants was defined as a region of interest, and person detection was performed in this area, as shown in Figure 2.

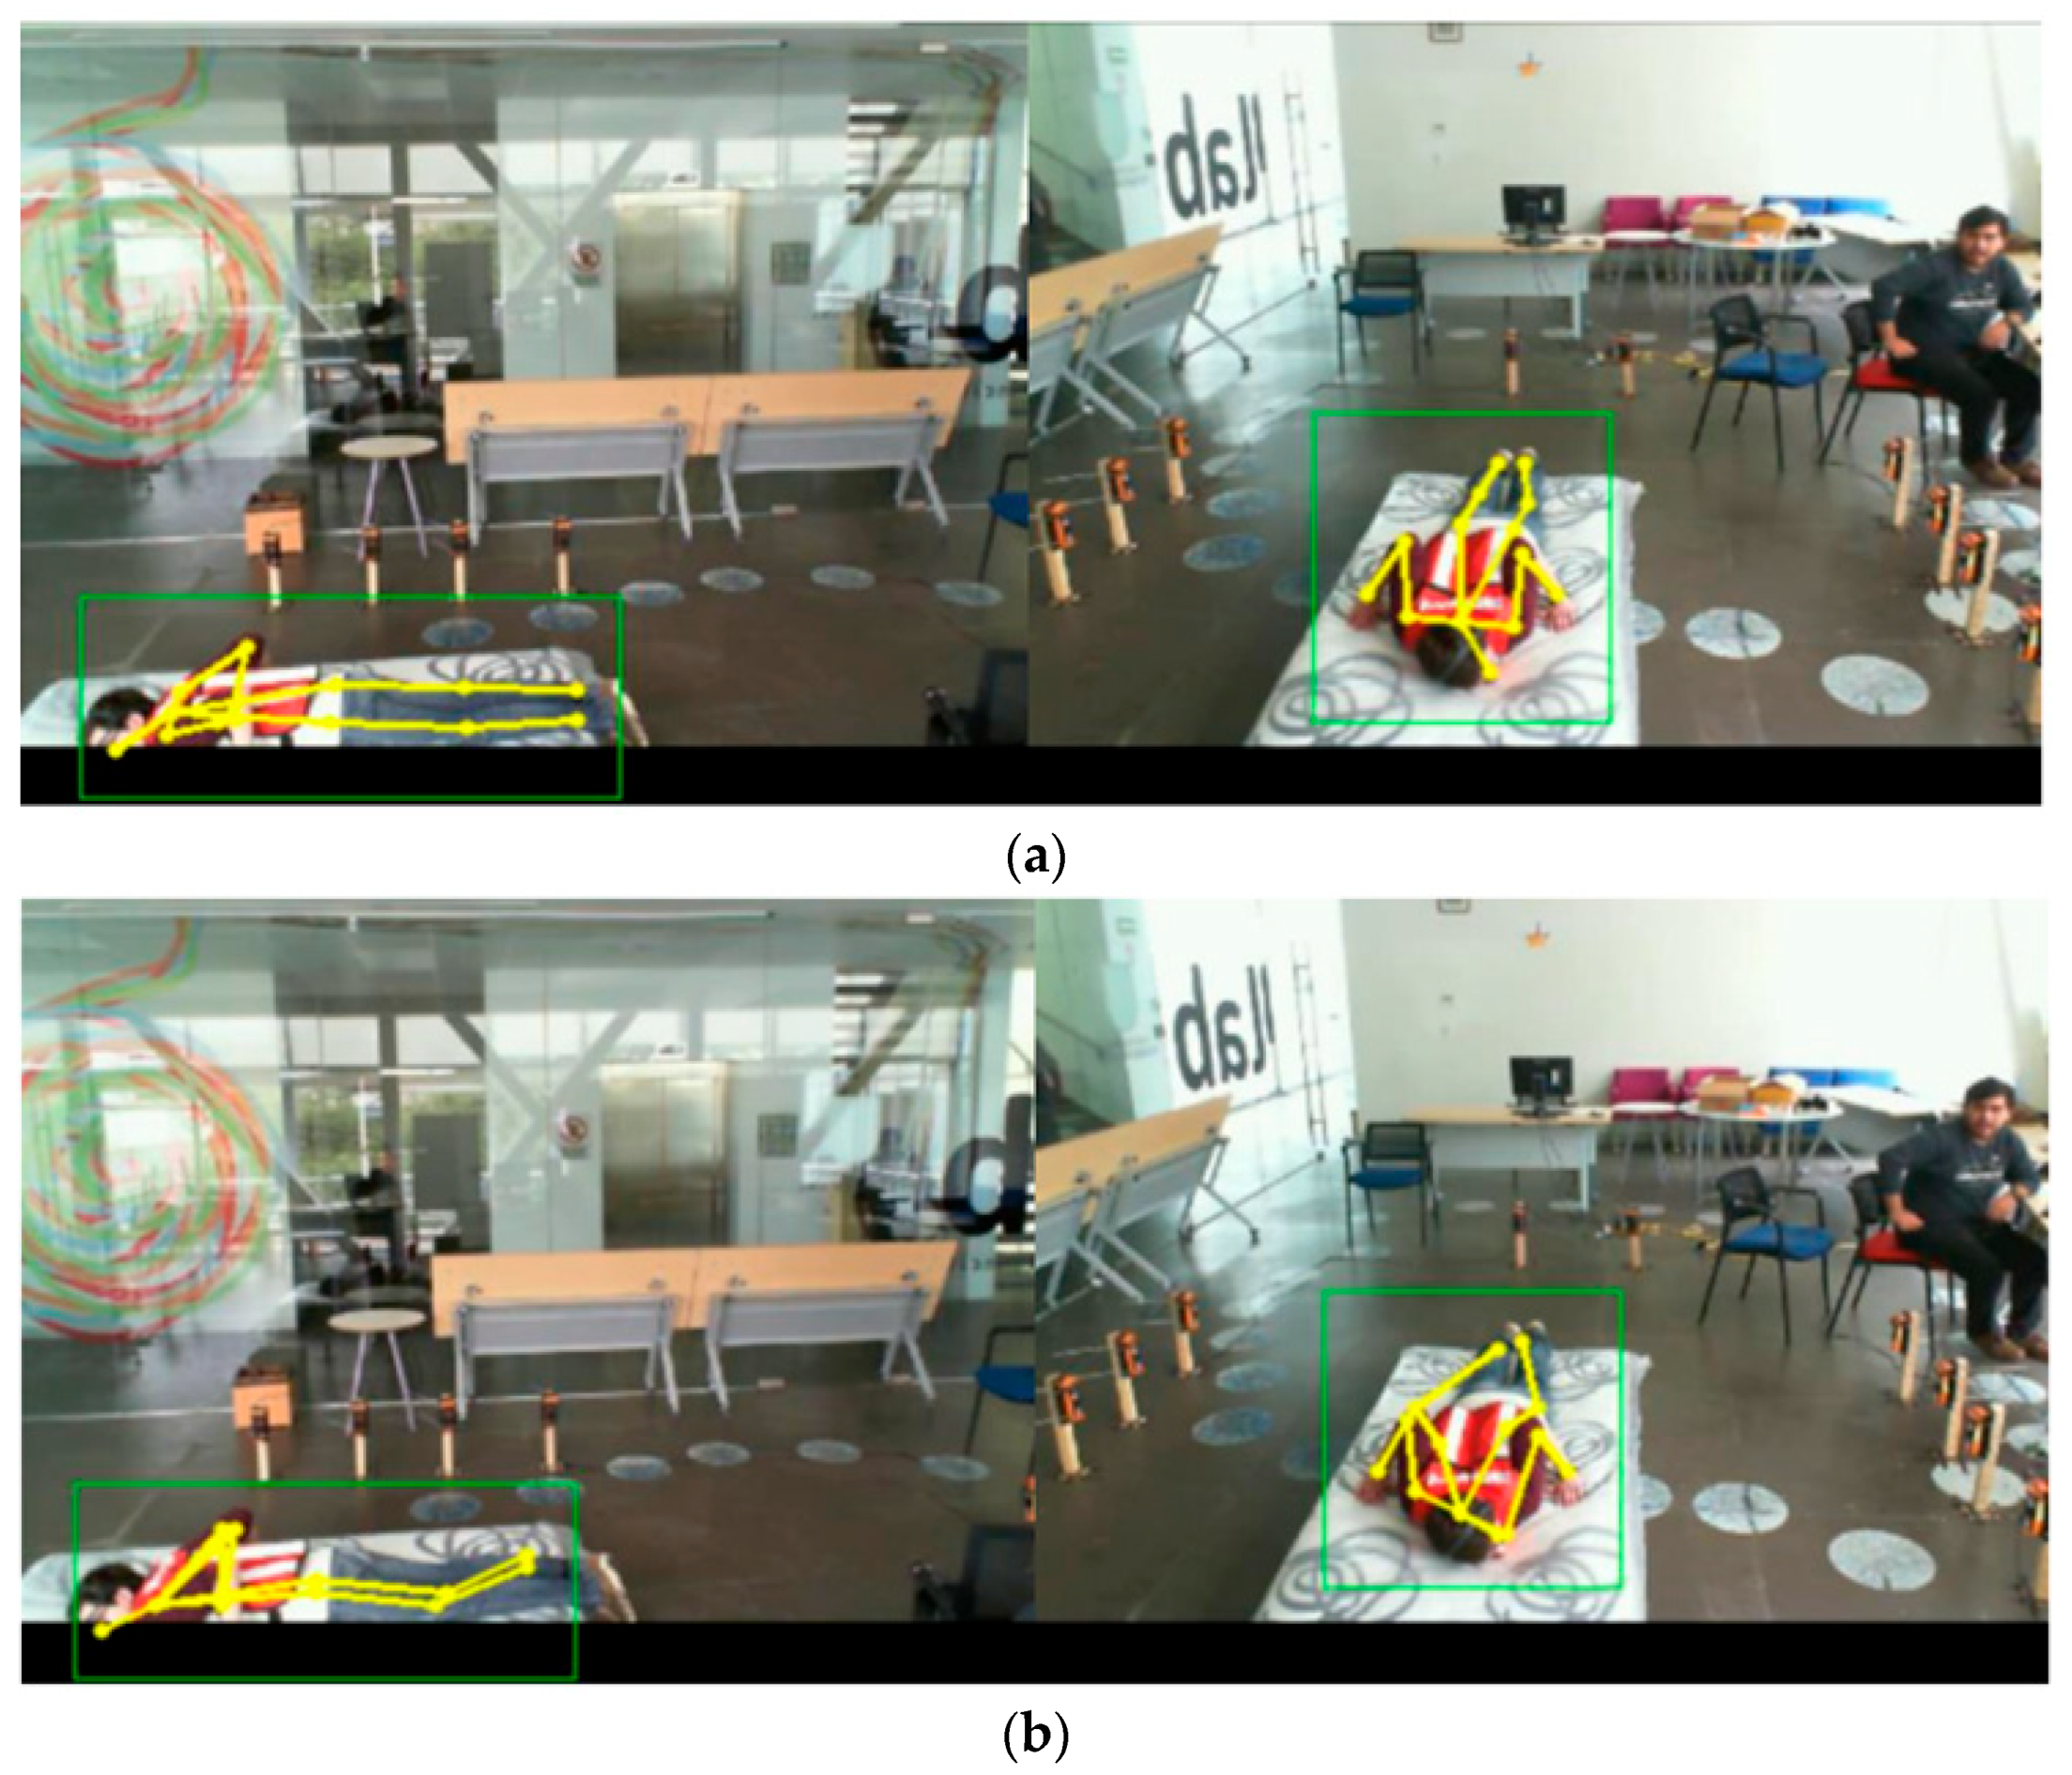
3.2. Skeleton-Based Feature Extraction

Detecting falls using a skeleton-based approach has the advantage of preventing the learning of irrelevant information such as the background, thus leading to exceptional generalization performance. Furthermore, skeleton-based methods offer the advantage of enabling individualized fall detection for multiple individuals within a single video. In this study, the pre-trained AlphaPose [30] and ViTPose [31] were used to obtain skeleton data, and their respective results were compared. AlphaPose uses a CNN-based architecture to generate skeleton data as its output, whereas ViTPose employs the encoder structure of ViT [32] as its backbone. CNNs are among the most effective approaches for extracting features from images. However, very recently, research has demonstrated better performance in image feature extraction using the transformer [34] architecture than that achieved with models based on CNNs. This trend has prompted the development of ViTPose, which leverages the ViT structure as a complementary solution to the CNN-based AlphaPose to enhance pose estimation. These models produce 17 key points as their outputs. We utilized 13 key points, excluding the eyes and ears from both sides as these have a relatively minor impact on fall detection results. We compared the experimental outcomes of AlphaPose and ViTPose using the selected key points. Figure 3 shows an example of the skeleton output obtained using AlphaPose v0.2.0 and ViTPose.

3.3. Classification

In the proposed system, the classifier uses the key points obtained from the pose estimation module as inputs to classify the actions of the detected persons in the image as either falling or as normal behavior. Using these key points as inputs instead of all RGB pixels in the video prevents overfitting, thereby improving generalization performance. Falls occur because of a series of movements in which balance is lost and the body makes contact with the ground. To recognize such temporal changes in movements, it is crucial for the classifier to understand not only individual images but also how changes unfold in a video. In each video frame, the classifier should learn the configuration of the person’s body and understand how the body arrangement changes across consecutive frames. Therefore, we employed ST-GCN [35] as the classifier. This choice was motivated by its ability to grasp the formation of the body in each video frame and capture how the body’s structure evolves over successive frames. In ST-GCN, the skeleton coordinates are organized into graph-formatted data for input. This model recognizes the spatial patterns between the key points in the skeleton graph data obtained from each frame, and detects the temporal patterns between skeleton graph data acquired from multiple frames. By utilizing both spatial and temporal information, ST-GCN can detect falls effectively. The operating process of the ST-GCN is shown in Figure 4.
In one layer of the ST-GCN, the spatial kernel size, which represents the distance considering the connections between adjacent joints, is set to 1. This means that only the most adjacent nodes are included in the spatial operation range. The spatial receptive field of one ST-GCN operation is considered to involve three nodes. As shown in Figure 4, three nodes get involved in one ST-GCN operation. For instance, for the elbow node, the spatial receptive field of the ST-GCN operation includes the wrist, elbow, and shoulder nodes. Next, the parameter for the temporal kernel size, which determines how many frames participate in the temporal operation, is set to 9. In other words, the corresponding frame and the surrounding four frames are included in the temporal receptive field. It is not the length of the skeleton sequence but rather the size of the temporal kernel that is 9. Therefore, conducting ST-GCN operations layer by layer enables the recognition of patterns in spatial–temporal information. By utilizing the ST-GCN, we can overcome the limitations of traditional classifiers in handling unseen data and enhance generalization performance.

3.4. Time-Level Decision Fusion

Assembling multiple models to enhance generalization performance is a common practice [36,37,38,39]. Combining the outcomes of separately trained models to improve the overall performance is a typical ensemble approach. However, falls involve temporal changes in posture. Therefore, if the skeleton data at time intervals t , t + 1 , , t + n indicate a fall, it is likely that the skeleton data at time intervals t 1 , t , , t + n 1 and t + 1 , t + 2 , , t + n + 1 also correspond to a fall. Therefore, in this study, the results from different time points of the classifier were assembled. Fluctuations in the skeleton sequence can occur due to incorrect bounding boxes in the person detection stage, leading to a degradation in pose estimation performance or performance issues within the pose estimation stage itself. Fusion can help alleviate the impact of skeleton sequence fluctuations on the classification performance of the ST-GCN. Additionally, situations where falls are challenging to detect, such as actions similar to falling, can be overcome by fusing the results from multiple perspectives of the ST-GCN. To aggregate the classifiers at the time level, we denote the keypoint values obtained at time t as Y t . The input features X t for a classifier are defined as follows:
X t = Y t w + 1   Y t w + 2     Y t
where w denotes the key points’ list size. The output result ω t of the classifier is defined as
ω t = f ( X t )
where f ( · ) represents the classifier function. ω t is represented as a vector indicating the confidence scores for each class and can be expressed as follows:
ω t = ω t 1   ω t 2     ω t c T ,   w h e r e   0 ω t i 1
Here, c represents the number of predefined classes. The final result ω o u t , obtained by fusing ω t from time t to t N + 1 , is defined as follows:
ω o u t = g ω t N + 1   ω t N + 2     ω t  
where N denotes the number of feature windows, and g ( · ) represents the function that fuses the results of N classifiers. The fusion module process is summarized in Figure 5.
We used the following methods to obtain g(∙).

3.4.1. Voting Method

The final output ω o u t is obtained by using Equations (5)–(7) to determine the most frequent class among the results of N classifiers:
B k i = ω k i = 1 ,   i f max [ ω k 1   ω k 2     ω k c ] = ω k i ω k i = 0 ,   o t h e r w i s e  
ω v o t i n g ,   i = k = t N + 1 t B k i
ω o u t = argmax i = 1,2 , , C ω v o t i n g ,   i

3.4.2. Average Method

The final output ω o u t is determined by selecting the class with the highest average confidence score among the results of N classifiers as defined in Equation (8):
ω o u t = argmax i = 1,2 , , C 1 N k = t N + 1 t ω k i

3.4.3. Maximum Method

The final output ω o u t is obtained by selecting the class with the highest confidence score among the results of N classifiers. The equation used is as follows:
ω o u t = argmax i = 1,2 , C max [ ω t N + 1 i   ω t N + 2 i     ω t i ]

3.4.4. Probabilistic Fusion Method

A probabilistic approach is employed to aggregate the results from different time-point classifiers. In the fusion stage, the N results are fused using belief. As a new measure, we define belief as the posterior probability of ω o u t = i   ( i = 1,2 , , C ) conditioned on all time-level classifiers and combine the classifiers by using belief [39]. The posterior probability b e l n ω o u t = i at time levels from 1 to n is defined as follows:
b e l n ω o u t = i = p ω o u t = i   I 1 : n )
In this case, p ( ω o u t = i ) can be obtained from the confidence score of the i th class of a classifier, and I k represents the event where the classifier produces an output using the skeleton features in the k th frame. Motivated by [39,40], we calculate the current posterior distribution from the previous time step’s posterior distribution as shown in the following equation:
b e l n ω o u t = i = p ( I n | ω o u t = i , I 1 : n 1 ) p ( ω o u t = i | I 1 : n 1 ) p ( I n | I 1 : n 1 )
where p ( I n | ω o u t = i , I 1 : n 1 ) is the probability of the n th classifier when previous n 1 classifiers are given. Because each time-level classifier makes inferences separately and independently from the other classifiers, we obtain
b e l n ω o u t = i = p ( I n | ω o u t = i ) p ( ω o u t = i | I 1 : n 1 ) p ( I n | I 1 : n 1 )
Applying Bayes’ rule to p ( I n | ω o u t = i ) in (12), the following equation can be derived:
p I n ω o u t = i = p ( ω o u t = i | I n ) p ( I n ) p ( ω o u t = i )
Therefore, Equation (12) becomes the following equation:
b e l n ω o u t = i = p ( ω o u t = i | I n ) p ( I n ) p ( ω o u t = i ) p ( ω o u t = i | I n 1 ) p ( I n | I n 1 )
where p ( I n ) is the probability of the n th classifier, and p ( ω o u t = i ) is the probability that, when an unknown action is given, the class of the action is i . Analogously, we use the following equation for the opposite event:
1 b e l n ω o u t = i = p ( ω o u t i | I n ) p ( I n ) p ( ω o u t i ) p ( ω o u t i | I n 1 ) p ( I n | I n 1 )
By dividing Equation (14) by Equation (15), Equation (16) is obtained:
b e l n ω o u t = i 1 b e l n ω o u t = i = p ( ω o u t = i | I n ) p ( ω o u t i | I n ) p ( ω o u t = i | I n 1 ) p ( ω o u t i | I n 1 ) p ( ω o u t i ) p ( ω o u t = i )
We can express Equation (16) as follows:
b e l n ω o u t = i 1 b e l n ω o u t = i = p ( ω o u t = i | I n ) 1 p ( ω o u t = i | I n ) p ( ω o u t = i | I n 1 ) 1 p ( ω o u t = i | I n 1 ) 1 p ( ω o u t = i ) p ( ω o u t = i )
p ω o u t = i I 1 : n 1 in Equation (17) can be expressed as b e l n 1 ω o u t = i according to the definition of belief. Therefore, Equation (17) can be expressed as follows:
b e l n ω o u t = i 1 b e l n ω o u t = i = p ( ω o u t = i | I n ) 1 p ( ω o u t = i | I n ) b e l n 1 ω o u t = i 1 b e l n 1 ω o u t = i 1 b e l 0 ω o u t = i b e l 0 ω o u t = i
If we assume an equal ratio between falling and normal actions, we can define b e l 0 ω o u t = i = 0.5 and b e l 0 ω o u t i = 0.5 . The values of b e l 0 ω o u t = i and b e l 0 ω o u t i can be determined based on the ratio of the occurrence of falling and normal actions. Let us denote the expression b e l n ω o u t = i 1 b e l n ω o u t = i in Equation (18) as δ i n . Considering N time steps, we can calculate δ i N , and consequently, the final value of b e l N ω o u t = i can be computed using the following equation:
b e l N ω o u t = i = δ i N 1 + δ i N
Finally, the classification is made based on the individual belief:
ω o u t = argmax i = 1,2 , , C b e l N ( ω o u t = i )

4. Experimental Results

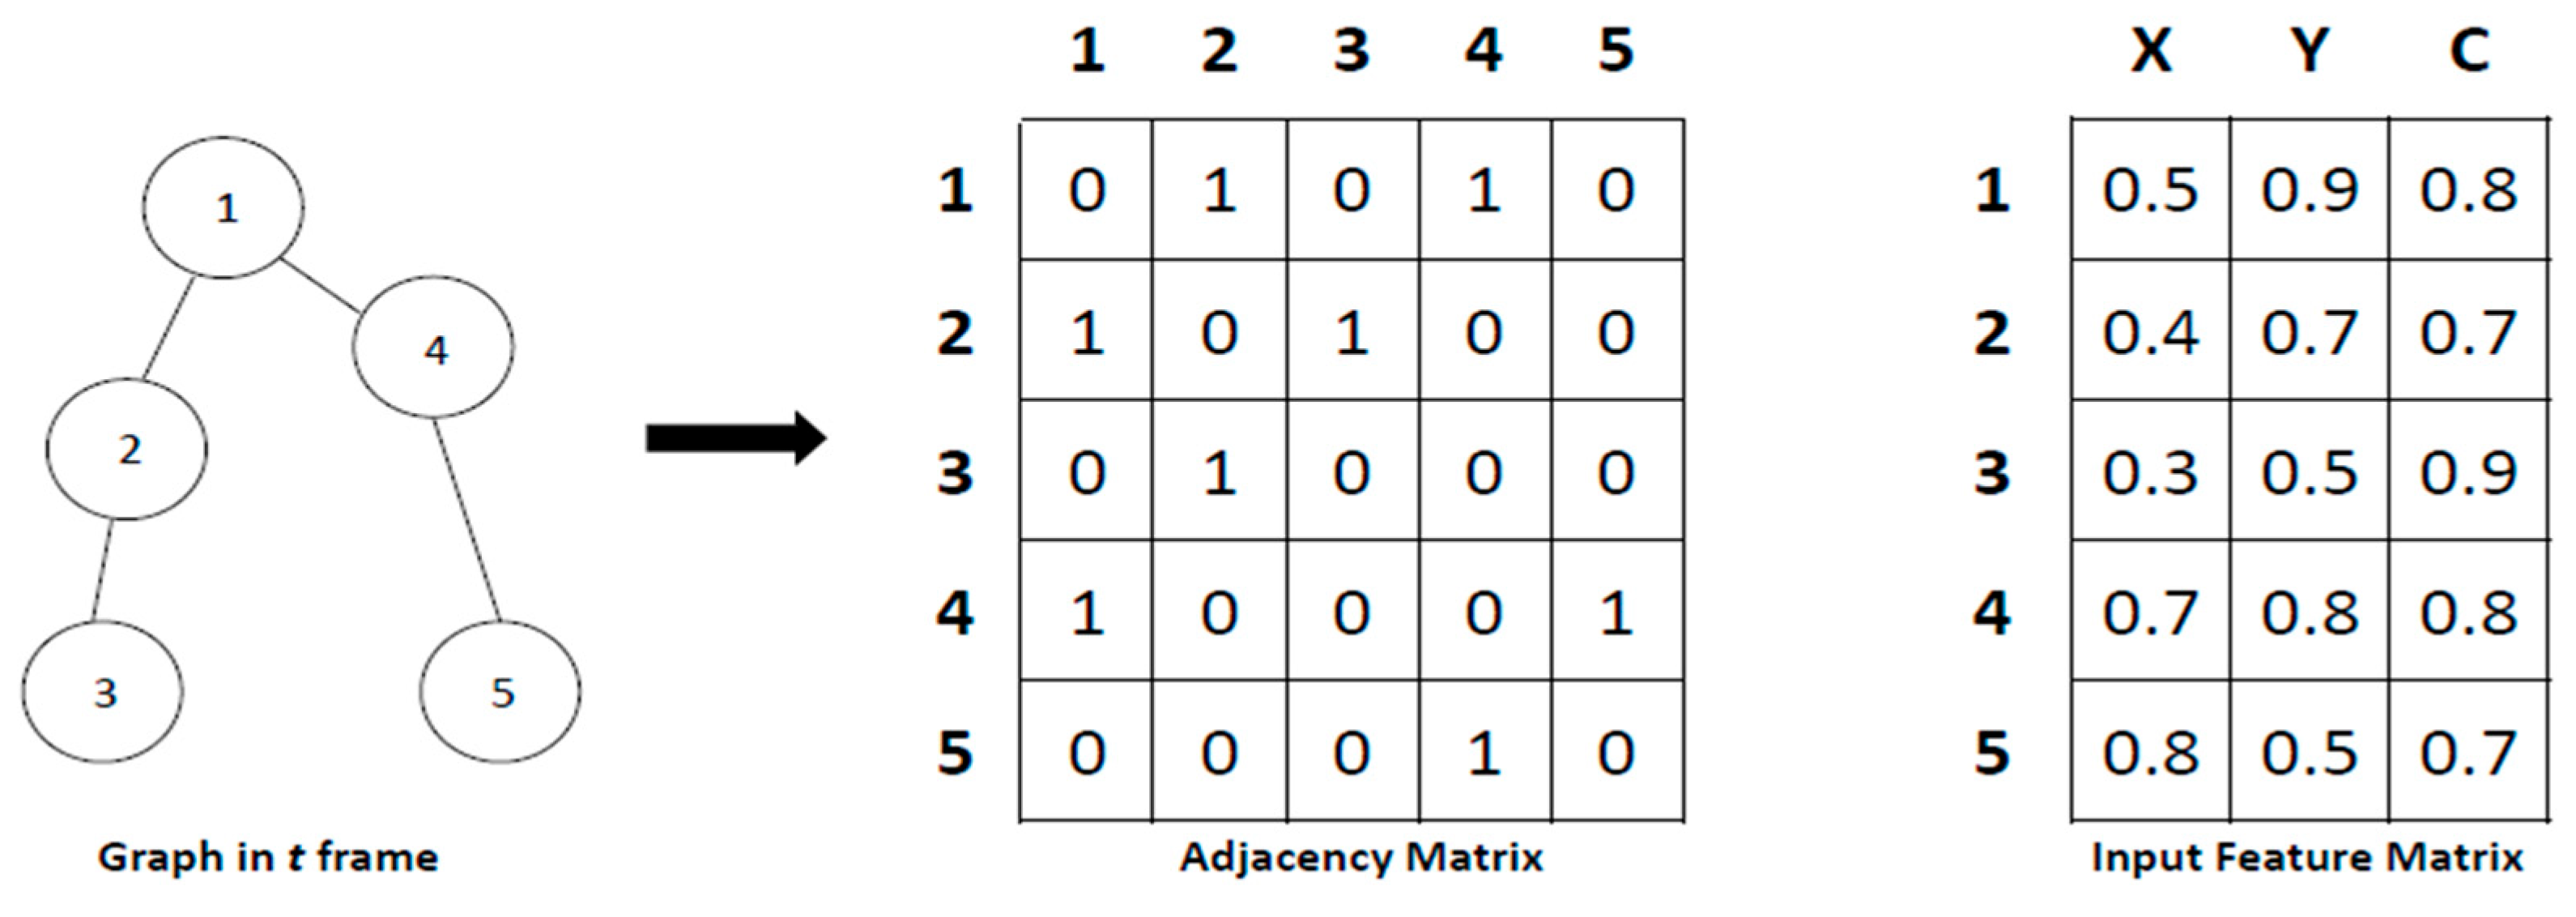
4.1. Graph Construction

In this study, we employed ST-GCN [35] as a classifier. To utilize the spatial and temporal connectivity information in ST-GCN, the skeleton data were structured into a graph format and used as the input for ST-GCN. To represent the skeleton data as a graph, each key point was treated as a node, and the connections between the nearest key points linked by bones, such as the knees and ankles, were represented as edges. An example of graph construction is shown in Figure 6.
The adjacency matrix represents the connection status between nodes. In Figure 6, nodes 1 and 2 are connected, so the values of the adjacency matrix in the second row and first column and in the first row and second column are both 1. In the skeleton, if the ankles and knees are connected, the corresponding value in the adjacency matrix becomes 1. The input feature matrix represents the features of the nodes. The features are the x-coordinate, y-coordinate, and confidence score of each node, which are computed in the pose estimation module. In the input feature matrix of Figure 6, we can see that for node 1, the x-coordinate is 0.5, the y-coordinate is 0.9, and the confidence score is 0.8. To simplify graph construction, the example used in Figure 6 illustrates a graph with five nodes. However, we utilized 13 key points, and thus, the graph data were constructed using 13 nodes.

4.2. Dataset and Experimental Setup

The HAR-UP dataset [27] was used to test the proposed system. The HAR-UP dataset consists of 11 categorized actions, each performed by 17 subjects in three trials and captured from two camera viewpoints. Among the 11 actions, 1–5 represent falls, whereas 6–11 depict different actions. In this study, the remaining seven actions, excluding falls, were categorized as normal actions, and the experiments were conducted accordingly. Furthermore, the sixth action in the dataset involves subjects moving out of the camera’s field of view and returning, making it challenging to define the region of interest (ROI). Hence, this behavior was excluded from the experiments. A total of 1016 videos were analyzed. Figure 7 shows examples of images from the HAR-UP dataset with fall and normal actions. To facilitate the understanding of the subjects’ actions, their behaviors were depicted using a sequence of eight images with a 10-frame interval, as shown in Figure 7.
In this work, we employed modules pre-trained on external datasets. For person detection, we utilized YOLO models trained by [28,29] on the MS COCO detection dataset. Additionally, for the pose estimation module, we utilized AlphaPose and ViTPose trained by [30,31] on the MS COCO keypoint dataset. For the classification module, we utilized the trained ST-GCN obtained from [41] using the Le2i Fall Detection dataset. Therefore, the HAR-UP dataset was utilized entirely as test data without being partitioned into separate training and testing datasets. Table 3 and Table 4 present the input and output data sizes, data type, and number of parameters of the object detection, pose estimation, and action recognition modules used in this experiment, as well as the specifications of the employed system.

4.3. Experimental Results

Figure 8 and Figure 9 present the recognition accuracy for fall and normal actions obtained by varying the number of classifiers of the fusion method using the HAR-UP dataset. As a baseline, we considered a scenario where if the ST-GCN result indicated a fall at least once in a video, it was considered a detected fall occurrence.
Figure 8 shows the results obtained using YOLOv3 for person detection, and Figure 9 shows the results obtained using YOLOv7. It can be observed that using both YOLOv3 and YOLOv7, the performance improved compared to that before fusion. With the use of YOLOv3 and YOLOv7, we observed instances where the fusion model exhibited superior performance compared to the baseline model. Specifically, the application of time-level fusion contributed to performance enhancement. When AlphaPose was used, the enhancement in the performance of the fusion model was significantly more substantial compared to the utilization of ViTPose. This signifies the efficacy of the fusion technique in effectively mitigating fluctuations in the skeleton sequence or classifier results arising from certain inaccuracies in AlphaPose estimation. Notably, the performance was consistently higher with the following fusion methods: probabilistic fusion, average, maximum, and voting. When YOLOv3 was used, the combination of ViTPose and probabilistic fusion with the number of classifiers being 10 exhibited the highest performance. However, when YOLOv7 was employed, the best performance was achieved using ViTPose and probabilistic fusion with the number of classifiers being five. YOLOv7 performed better than YOLOv3, and ViTPose performed better than AlphaPose. In general, accuracy tended to decrease when the number of classifiers exceeded 15. The results for all 1016 videos using the optimal numbers of classifiers for each fusion method are presented in Table 5 and Table 6.
In a binary classification problem, true (T) and false (F) indicate whether the predicted result is correct or not. Positive (P) and negative (N) indicate cases in which the model classifies the state as falling and normal, respectively. Precision, recall, and accuracy, presented in Table 5 and Table 6, are the most widely used indices for data learning of classifiers and are defined as follows:
P r e c i s i o n = T P T P + F P
R e c a l l = T P T P + F N
A c c u r a c y = T P + T N T P + F P + T N + F N
With the utilization of YOLOv3, the optimal precision for detecting fall cases was achieved by combining ViTPose with the voting method. Conversely, for normal cases, the baseline performance with ViTPose demonstrated the highest precision. Regarding recall, the baseline with ViTPose exhibited superior performance for fall cases, while the optimal result for normal cases was obtained by employing ViTPose and the voting method. In the context of YOLOv7 utilization, the highest precision for fall cases was observed with ViTPose and the voting method, whereas for normal cases, the highest precision was attained through the combination of ViTPose and the averaging method. Concerning recall, ViTPose combined with the averaging method resulted in the highest performance for fall cases, while ViTPose combined with the voting method proved to be the most effective strategy for normal cases. Table 7 presents a comparison of the recognition results for each action between ViTPose and AlphaPose when using the probabilistic fusion method and YOLOv7, which is the most effective.
In the experiments, the misclassification of falling incidents as normal situations mainly occurred due to failures in person detection. To address this issue, we constructed an additional training dataset with a focus on detecting individuals who were either obscured or in a fallen state, utilizing the HAR-UP dataset, and conducted subsequent experiments. During this process, the training dataset and the test dataset were divided in a 7:3 ratio, and 4375 images were selected from the training videos for training YOLOv7. Figure 10 shows the results obtained using the improved YOLOv7.
In Table 8, the performance of the proposed method is compared with that of previous methods using the HAR-UP dataset. The performance of these previous methods is directly cited from other research studies [18,20,27,42,43].

5. Conclusions

In this study, we utilized deep learning-based computer vision techniques to quickly address accidents caused by falls. To enhance the fall detection performance, we employed the aggregation of classifier result sequences, thereby overcoming scenarios that are challenging for the model to classify. Consequently, we were able to improve the fall detection performance by effectively using a light fusion module. In this study, we used various fusion methods, including voting, maximum, averaging, and probabilistic fusion. Compared to the other fusion methods, the probabilistic fusion method showed improvements in precision, recall, and accuracy. In our fall detection system, the accuracy of person detection and pose estimation significantly affects performance because the detection of falls is based on skeleton data. It was observed that using YOLOv7 for person detection and ViTPose led to an improved fall detection performance.
In the experiments, false negatives that classified falls as normal were primarily attributed to failures in person detection. Among these, false negatives occurred particularly when the entire form of a person was not visible in the video or when a person in a fallen state was not detected. Therefore, efforts to improve person detection are crucial to enhance the performance of the proposed system. The proposed fall detection system allows the easy replacement of its modules, making it possible to incorporate state-of-the-art object detection models that outperform YOLOv7. Alternatively, constructing additional training datasets that focus on detecting obscured persons or persons in a fallen state and training the detection model on these datasets could lead to an improvement in person detection performance. Not only the detection module but also the classifier module is replaceable. Therefore, it is worth considering modifying models that have achieved state-of-the-art performance in action recognition for the fall detection task. These are expected to significantly enhance the overall performance of the proposed system. Additionally, conducting experiments on various datasets [44,45] would be beneficial to demonstrate the general effectiveness of the proposed fusion method in enhancing fall detection performance.

Author Contributions

Conceptualization, J.K., B.K. and H.L.; methodology, J.K., B.K. and H.L.; software, J.K.; validation, J.K., B.K. and H.L.; formal analysis, B.K. and H.L.; investigation, J.K.; writing—original draft preparation, J.K.; writing—review and editing, B.K.; visualization, J.K.; supervision, H.L.; project administration, H.L.; funding acquisition, B.K. and H.L. All authors have read and agreed to the published version of the manuscript.

Funding

This work was supported by a National Research Foundation of Korea (NRF) grant funded by the Korea government (MSIP; Ministry of Science, ICT & Future Planning) (NRF-2021R1F1A1052074), and this work was also supported by another National Research Foundation of Korea (NRF) grant funded by the Korea government (MSIT) (No. RS-2022-00166346).

Institutional Review Board Statement

Not applicable.

Informed Consent Statement

Not applicable.

Data Availability Statement

HAR-UP dataset is available at https://github.com/jpnm561/HAR-UP (accessed on 9 January 2024).

Conflicts of Interest

The authors declare no conflicts of interest.

References

  1. Seydi, S.T.; Saeidi, V.; Kalantar, B.; Ueda, N.; Halin, A.A. Fire-Net: A Deep Learning Framework for Active Forest Fire Detection. J. Sens. 2022, 2022, 8044390. [Google Scholar] [CrossRef]
  2. Xie, Y.; Zhu, J.; Cao, Y.; Zhang, Y.; Feng, D.; Zhang, Y.; Chen, M. Efficient video fire detection exploiting motion-flicker-based dynamic features and deep static features. IEEE Access 2020, 8, 81904–81917. [Google Scholar] [CrossRef]
  3. Zhang, Y. Safety management of civil engineering construction based on artificial intelligence and machine vision technology. Adv. Civ. Eng. 2021, 2021, 1–14. [Google Scholar] [CrossRef]
  4. Degas, A.; Islam, M.R.; Hurter, C.; Barua, S.; Rahman, H.; Poudel, M.; Ruscio, D.; Ahmed, M.; Begum, S.; Rahman, M.; et al. A survey on artificial intelligence (ai) and explainable ai in air traffic management: Current trends and development with future research trajectory. Appl. Sci. 2022, 12, 1295. [Google Scholar] [CrossRef]
  5. Industrial Accident Analysis Booklet; Ministry of Employment and Labor of South Korea: Sejong, Republic of Korea, 2021; p. 12.
  6. Shany, T.; Redmond, S.J.; Narayanan, M.R.; Lovell, N.H. Sensors-based wearable systems for monitoring of human movement and falls. IEEE Sens. J. 2011, 12, 658–670. [Google Scholar] [CrossRef]
  7. Lindemann, U.; Hock, A.; Stuber, M.; Keck, W.; Becker, C. Evaluation of a fall detector based on accelerometers: A pilot study. Med. Biol. Eng. Comput. 2005, 43, 548–551. [Google Scholar] [CrossRef]
  8. Gibson, R.M.; Amira, A.; Ramzan, N.; Casaseca-de-la-Higuera, P.; Pervez, Z. Multiple comparator classifier framework for accelerometer-based fall detection and diagnostic. Appl. Soft Comput. 2016, 39, 94–103. [Google Scholar] [CrossRef]
  9. Jeong, S.S.; Kim, N.H.; Yu, Y.S. Fall Detection System Based on Simple Threshold Method and Long Short-Term Memory: Comparison with Hidden Markov Model and Extraction of Optimal Parameters. Appl. Sci. 2022, 12, 11031. [Google Scholar] [CrossRef]
  10. Cippitelli, E.; Fioranelli, F.; Gambi, E.; Spinsante, S. Radar and RGB-depth sensors for fall detection: A review. IEEE Sens. J. 2017, 17, 3585–3604. [Google Scholar] [CrossRef]
  11. Garripoli, C.; Mercuri, M.; Karsmakers, P.; Soh, P.J.; Crupi, G.; Vandenbosch, G.A.; Pace, C.; Leroux, P.; Schreurs, D. Embedded DSP-based telehealth radar system for remote in-door fall detection. IEEE J. Biomed. Health Inform. 2014, 19, 92–101. [Google Scholar] [CrossRef]
  12. Wang, B.; Guo, Y. Soft fall detection using frequency modulated continuous wave radar and regional power burst curve. In Proceedings of the 2022 Asia-Pacific Microwave Conference (APMC), Yokohama, Japan, 29 November–2 December 2022; pp. 240–242. [Google Scholar]
  13. Takabatake, W.; Yamamoto, K.; Toyoda, K.; Ohtsuki, T.; Shibata, Y.; Nagate, A. FMCW radar-based anomaly detection in toilet by supervised machine learning classifier. In Proceedings of the 2019 IEEE Global Communications Conference (GLOBECOM), Waikoloa, HI, USA, 9–13 December 2019; pp. 1–6. [Google Scholar]
  14. Cippitelli, E.; Gasparrini, S.; Gambi, E.; Spinsante, S. A human activity recognition system using skeleton data from RGBD sensors. Comput. Intell. Neurosci. 2016, 2016, 4351435. [Google Scholar] [CrossRef]
  15. Panahi, L.; Ghods, V. Human fall detection using machine vision techniques on RGB–D images. Biomed. Signal Process. Control 2018, 44, 146–153. [Google Scholar] [CrossRef]
  16. Keskes, O.; Noumeir, R. Vision-based fall detection using st-gcn. IEEE Access 2021, 9, 28224–28236. [Google Scholar] [CrossRef]
  17. Lie, W.N.; Le, A.T.; Lin, G.H. Human fall-down event detection based on 2D skeletons and deep learning approach. In Proceedings of the 2018 International Workshop on Advanced Image Technology (IWAIT), Chiang Mai, Thailand, 7–9 January 2018; pp. 1–4. [Google Scholar]
  18. Ramirez, H.; Velastin, S.A.; Meza, I.; Fabregas, E.; Makris, D.; Farias, G. Fall detection and activity recognition using human skeleton features. IEEE Access 2021, 9, 33532–33542. [Google Scholar] [CrossRef]
  19. Kim, J.; Lee, J.H.; Lee, H. Fall down detection using vision transformer and graph convolutional network. J. Korean Soc. Railw. 2023, 26, 251–259. [Google Scholar] [CrossRef]
  20. Galvão, Y.M.; Portela, L.; Ferreira, J.; Barros, P.; Fagundes, O.A.D.A.; Fernandes, B.J. A framework for anomaly identification applied on fall detection. IEEE Access 2021, 9, 77264–77274. [Google Scholar] [CrossRef]
  21. Alanazi, T.; Muhammad, G. Human fall detection using 3D multi-stream convolutional neural networks with fusion. Diagnostics 2022, 12, 3060. [Google Scholar] [CrossRef]
  22. Alanazi, T.; Babutain, K.; Muhammad, G. A Robust and Automated Vision-Based Human Fall Detection System Using 3D Multi-Stream CNNs with an Image Fusion Technique. Appl. Sci. 2023, 13, 6916. [Google Scholar] [CrossRef]
  23. Lara, O.D.; Pérez, A.J.; Labrador, M.A.; Posada, J.D. Centinela: A human activity recognition system based on acceleration and vital sign data. Pervasive Mob. Comput. 2012, 8, 717–729. [Google Scholar] [CrossRef]
  24. Li, H.; Shrestha, A.; Heidari, H.; Le Kernec, J.; Fioranelli, F. Bi-LSTM network for multimodal continuous human activity recognition and fall detection. IEEE Sens. J. 2019, 20, 1191–1201. [Google Scholar] [CrossRef]
  25. Chahyati, D.; Hawari, R. Fall detection on multimodal dataset using convolutional neural network and long short term memory. In Proceedings of the 2020 International Conference on Advanced Computer Science and Information Systems (ICACSIS), Depok, Indonesia, 17–18 October 2020; pp. 371–376. [Google Scholar]
  26. Wang, X.; Penta, R.; Sehgal, B.; Chen-Song, D. Human fall detection-multimodality approach. arXiv 2023, arXiv:2302.00224. [Google Scholar]
  27. Martínez-Villaseñor, L.; Ponce, H.; Brieva, J.; Moya-Albor, E.; Núñez-Martínez, J.; Peñafort-Asturiano, C. UP-fall detection dataset: A multimodal approach. Sensors 2019, 19, 1988. [Google Scholar] [CrossRef]
  28. Redmon, J.; Farhadi, A. Yolov3: An incremental improvement. arXiv 2018, arXiv:1804.02767. [Google Scholar]
  29. Wang, C.Y.; Bochkovskiy, A.; Liao, H.Y.M. YOLOv7: Trainable bag-of-freebies sets new state-of-the-art for real-time object detectors. In Proceedings of the IEEE/CVF Conference on Computer Vision and Pattern Recognition, Vancouver, BC, Canada, 17–24 June 2023; pp. 7464–7475. [Google Scholar]
  30. Fang, H.S.; Xie, S.; Tai, Y.W.; Lu, C. Rmpe: Regional multi-person pose estimation. In Proceedings of the IEEE International Conference on Computer Vision, Venice, Italy, 22–29 October 2017; pp. 2334–2343. [Google Scholar]
  31. Xu, Y.; Zhang, J.; Zhang, Q.; Tao, D. Vitpose: Simple vision transformer baselines for human pose estimation. Adv. Neural Inf. Process. Syst. 2022, 35, 38571–38584. [Google Scholar]
  32. Dosovitskiy, A.; Beyer, L.; Kolesnikov, A.; Weissenborn, D.; Zhai, X.; Unterthiner, T.; Dehghani, M.; Minderer, M.; Heigold, G.; Gelly, S.; et al. An image is worth 16x16 words: Transformers for image recognition at scale. arXiv 2020, arXiv:2010.11929. [Google Scholar]
  33. Redmon, J.; Divvala, S.; Girshick, R.; Farhadi, A. You only look once: Unified, real-time object detection. In Proceedings of the IEEE Conference on Computer Vision and Pattern Recognition, Las Vegas, NV, USA, 21–26 June 2016; pp. 779–788. [Google Scholar]
  34. Vaswani, A.; Shazeer, N.M.; Parmar, N.; Uszkoreit, J.; Jones, L.; Gomez, A.N.; Kaiser, L.; Polosukhin, I. Attention is all you need. In Proceedings of the 31st International Conference on Neural Information Processing System, Long Beach, CA, USA, 4–9 December 2017; pp. 6000–6010. [Google Scholar]
  35. Yan, S.; Xiong, Y.; Lin, D. Spatial temporal graph convolutional networks for skeleton-based action recognition. In Proceedings of the AAAI Conference on Artificial Intelligence, New Orleans, LO, USA, 2–7 February 2018. [Google Scholar]
  36. He, K.; Zhang, X.; Ren, S.; Sun, J. Deep residual learning for image recognition. In Proceedings of the IEEE Conference on Computer Vision and Pattern Recognition, Las Vegas, NV, USA, 27–30 June 2016; pp. 770–778. [Google Scholar]
  37. Hu, J.; Shen, L.; Sun, G. Squeeze-and-excitation networks. In Proceedings of the IEEE Conference on Computer Vision and Pattern Recognition, Salt Lake City, UT, USA, 24–27 June 2018; pp. 7132–7141. [Google Scholar]
  38. Yao, L.; Miller, J. Tiny imagenet classification with convolutional neural networks. CS 231n 2015, 2, 8. [Google Scholar]
  39. Lee, H.; Hong, S.; Kim, E. Neural network ensemble with probabilistic fusion and its application to gait recognition. Neurocomputing 2009, 72, 1557–1564. [Google Scholar] [CrossRef]
  40. Thrun, S.; Burgard, W.; Fox, D. Probabilistic Robotics; MIT Press: Cambridge, MA, USA, 2005; p. 28. [Google Scholar]
  41. Human-Falling-Detect-Tracks. Available online: https://github.com/GajuuzZ/Human-Falling-Detect-Tracks (accessed on 1 December 2023).
  42. Yadav, S.K.; Luthra, A.; Tiwari, K.; Pandey, H.M.; Akbar, S.A. ARFDNet: An efficient activity recognition & fall detection system using latent feature pooling. Knowl. Based Syst. 2022, 239, 107948. [Google Scholar]
  43. Raza, A.; Yousaf, M.H.; Velastin, S.A.; Viriri, S. Human fall detection from sequences of skeleton features using vision transformer. In Proceedings of the 18th International Joint Conference on Computer Vision, Imaging and Computer Graphics Theory and Applications, Lisbon, Porutugal, 8–10 February 2023; pp. 591–598. [Google Scholar]
  44. Kwolek, B.; Kepski, M. Human fall detection on embedded platform using depth maps and wireless accelerometer. Comput. Methods Programs Biomed. 2014, 117, 489–501. [Google Scholar] [CrossRef]
  45. Alzahrani, M.S.; Jarraya, S.K.; Salamah, M.A.; Ben-Abdallah, H. FallFree: Multiple fall scenario dataset of cane users for monitoring applications using kinect. In Proceedings of the International Conference on Signal-Image Technology & Internet-Based Systems, Jaipur, India, 4–7 December 2017; pp. 327–333. [Google Scholar]
Figure 1. The complete process of the proposed system.
Applsci 14 00709 g001
Figure 2. Results of person detection using YOLOv3 and YOLOv7: (a) detection result of YOLOv3 for normal activity; (b) detection result of YOLOv3 for fall activity; (c) detection result of YOLOv7 for normal activity; and (d) detection result of YOLOv7 for fall activity.
Applsci 14 00709 g002
Figure 3. Skeleton data output of ViTPose and AlphaPose: (a) result of ViTPose, and (b) result of AlphaPose.
Applsci 14 00709 g003
Figure 4. Structure of ST-GCN.
Applsci 14 00709 g004
Figure 5. Skeleton features are fed successively into the classifier, and the classifier outputs are aggregated in the fusion step to obtain ω o u t .
Applsci 14 00709 g005
Figure 6. Example of graph construction.
Applsci 14 00709 g006
Figure 7. HAR-UP dataset: (a) example of fall action, and (b) example of normal (picking up) action.
Applsci 14 00709 g007
Figure 8. Accuracy graph of each fusion method using YOLOv3.
Applsci 14 00709 g008
Figure 9. Accuracy graph of each fusion method using YOLOv7.
Applsci 14 00709 g009
Figure 10. Accuracy graph of the proposed method using improved YOLOv7.
Applsci 14 00709 g010
Table 1. Summary of pros and cons of fall detection methods using various sensors.
SensorProsCons
AccelerometerSensor sensitivityLimitation in catching the global movements of the body caused by the number of attached sensors.
Devices have to be worn.
RadarLow-light condition performance
Privacy friendliness
Limitation in recognizing different postures.
Difficulty in distinguishing between the fall of objects and humans.
VisionCapture of global body posture is possible
No requirements are imposed on users
Vulnerability in low-light conditions.
MultimodalEnhancement in performance through the utilization of abundant informationDecreased inference time due to processing of various sensor values.
Table 2. Vision-based fall detection studies with some pros and cons.
AuthorProsConsDataset
Panahi, L., 2018 [15]Fit a person’s silhouette on the ellipses and observe the changes in the ellipses and detect fall. In general, the extraction accuracy of silhouette is higher than skeleton coordinate prediction accuracy, so the performance degradation due to the silhouette step is less.It is difficult to detect detailed body movements because the method creates an ellipse by fitting silhouettes and observes changes in the ellipse to detect falls.UR-Fall
Lie, W. N., 2018 [17]It is possible to extract the temporal characteristics of the skeleton sequence because the predicted skeleton is used as an input for the LSTMThere is less temporal information using only 8 frames of input. And it is difficult to convey the relationship between the joints because the skeleton coordinate value itself is used as the input.Private dataset
Keskes, O., 2021 [16]This study uses 3D skeleton sequences as inputs and classifies them using ST-GCN models, so all spatial–temporal information can be considered.Since 3D skeleton predictions are less accurate than 2D skeleton predictions, incorrect 3D coordinate predictions are likely to occur in a real-world environment. This may result in performance degradation.TST v2
Fallfree dataset
Ramirez, H., 2021 [18]The authors present a comparison of various ML models as classifiers.Because it detects falling in frame, input data do not contain temporal information.HAR-UP
UR-FALL
Galvão, Y. M., 2021 [20]The authors trained an encoder–decoder model using action features extracted from the pre-trained ST-GCN. By using only data on activities of daily living (ADL) as the dataset for training the encoder–decoder model, it can address the scarcity of fall data.It is trained on ADL data, not fall data, and if the likelihood of an action as an ADL is below a certain level, it is classified as a fall. So there is a possibility of classifying actions as falls that are neither falls nor ADL.PRECIS HAR,
HAR-UP
UR-Fall
Kim, J., 2023 [19]Using the ST-GCN model as a classifier, spatial–temporal information can be considered.Person detection that precedes the extraction of skeleton data does not work well.HAR-UP
Alanazi, T., 2023 [22]The proposed image fusion method converts multiple frames into a richly informative image to detect falls.Since it is based on segmentation, a person’s clothes and belongings can be reflected in the silhouette and post-processing is required for incorrect segmentationLe2i fall detection dataset
Table 3. Input and output sizes of each module.
ModelData TypeParametersInputOutput
YOLOV3RGB image8,669,876(640, 480)(1, 7)
YOLOV7RGB image36,905,341(640, 480)(1, 7)
AlphaPoseRGB image40,577,745(256, 192)(3, 13)
ViTPoseRGB image89,994,513(256, 192)(3, 13)
ST-GCNSkeleton data6,144,323(3, 13, 30)(1, 2)
Table 4. System configuration.
TypeMain Specification
OSUbuntu 20.04LTS
GPUNVIDIA GeForce RTX 3090
CPUIntel Core i9 13900KF
RAMDDR5, 64GB
Table 5. Results of fall detection using YOLOv3 with the optimal number of classifiers.
Fusion MethodOptimal Number of ClassifiersModelData LabelPrecision (%)Recall (%)Accuracy (%)
Baseline-ViTPoseFall97.4991.5794.59
Normal91.9997.63
AlphaPoseFall93.6589.6191.73
Normal89.9693.87
Probability10ViTPoseFall97.9091.3794.69
Normal91.8598.02
AlphaPoseFall93.9491.1892.62
Normal91.3694.07
Average5ViTPoseFall97.2690.5994.00
Normal91.1397.43
AlphaPoseFall93.8790.0092.03
Normal90.3294.07
Max5ViTPoseFall97.4690.3994.00
Normal90.9897.63
AlphaPoseFall93.7888.6391.34
Normal89.1494.07
Voting5ViTPoseFall98.2889.8094.09
Normal90.5598.42
AlphaPoseFall93.7888.6391.34
Normal89.1494.07
Table 6. Results of fall detection using YOLOv7 with the optimal number of classifiers.
Fusion MethodOptimal Number of ClassifiersModelData LabelPrecision (%)Recall (%)Accuracy (%)
Baseline-ViTPoseFall96.7392.9494.88
Normal93.1696.84
AlphaPoseFall93.6589.6191.73
Normal89.9693.87
Probability5ViTPoseFall97.1593.5395.37
Normal93.7197.23
AlphaPoseFall95.6991.3793.60
Normal91.6895.85
Average15ViTPoseFall91.9698.1295.08
Normal98.2292.38
AlphaPoseFall88.8296.3892.72
Normal96.6489.56
Max10ViTPoseFall91.7697.7094.78
Normal97.8392.18
AlphaPoseFall89.2296.1992.81
Normal96.4489.87
Voting5ViTPoseFall97.7091.5794.69
Normal92.0197.83
AlphaPoseFall95.6189.6192.72
Normal90.1595.85
Table 7. Number of action recognition results of the probabilistic fusion method with the optimal number of classifiers.
ModelAction Predicted
Value
FallNormalRecall (%)
Actual
Value
ViTPose1Fall98496.08
AlphaPose101199.02
ViTPose2Fall881486.27
AlphaPose812179.41
ViTPose3Fall96694.12
AlphaPose93991.18
ViTPose4Fall96694.12
AlphaPose921090.20
ViTPose5Fall99397.06
AlphaPose99397.06
ViTPose7Normal
(Standing)
0102100
AlphaPose0102100
ViTPose8Normal
(Sitting)
0102100
AlphaPose0102100
ViTPose9Normal
(Picking up)
49896.08
AlphaPose59795.10
ViTPose10Normal
(Jumping)
0102100
AlphaPose0102100
ViTPose11Normal
(Lying down)
108889.80
AlphaPose168283.67
Table 8. Comparison of several algorithms using the HAR-UP dataset.
AuthorClassifierAccuracy (%)
Martínez-Villaseñor, L., 2019 [27]CNN95.10
Ramirez, H., 2021 [18]RF99.34
Galvão, Y. M., 2021 [20]Encoder–decoder98.62
Yadav, S. K., 2022 [42] ARFDNet96.70
Raza, A., 2023 [43]ViT97.36
Proposed methodST-GCN with probabilistic fusion99.33
Disclaimer/Publisher’s Note: The statements, opinions and data contained in all publications are solely those of the individual author(s) and contributor(s) and not of MDPI and/or the editor(s). MDPI and/or the editor(s) disclaim responsibility for any injury to people or property resulting from any ideas, methods, instructions or products referred to in the content.

