Abstract
The application feedback on existing silicon nitride ceramic bearings and RCF experimental research all indicate that the primary failure mode of silicon nitride ceramic bearings is material spalling on the contact surface. Spalling failure occurs due to the initiation and propagation of cracks under rolling contact. However, silicon nitride ceramic bearings, owing to their unique manufacturing method, inevitably exhibit defects and cracks. Therefore, as silicon nitride ceramic bearings are increasingly prevalent, reducing the probability of spalling failure is crucial for extending their service life. This can only be achieved by gaining a clear understanding of the crack initiation and expansion mechanisms in silicon nitride ceramic bearings. This paper is based on silicon nitride rolling friction experiments. It involves the joint simulation of Franc3D-V8.4 and ABAQUS2020, wherein the crack front SIFs are calculated for each load contact position of the surface crack on the silicon nitride ceramic bearing ring during cyclic movement. The study also delves into the determination of the maximum effective stress intensity factors and explores the influence of the initial crack depth on the cycle life and direction of crack propagation. The research yields several valuable conclusions. The findings of this research offer theoretical guidance for formulating grinding technologies for silicon nitride rings and adjusting and controlling working parameters of silicon nitride ceramic ball bearings. These insights are crucial for enhancing the reliability and longevity of silicon nitride ceramic bearings in practical applications.
1. Introduction
With the advancement of science, technology, and industrial production, silicon nitride ceramic bearings have found widespread applications [1,2,3]. This is owing to their advantages, including low density, high stiffness, good corrosion resistance, and resistance to high and low temperatures. In comparison to steel bearings, silicon nitride ceramic bearings exhibit advantages in terms of speed [4] and service life [5,6,7,8]. Moreover, they can be employed in special conditions such as extreme temperatures and high corrosion environments. However, silicon nitride ceramic bearings, due to their unique hot isostatic pressing (HIP) and grinding processes, possess a considerable number of defects and cracks on both the surface and internally. Additionally, the ceramic material is highly brittle, and its fracture toughness is low. Consequently, under high contact pressure, these defects are prone to initiating cracks. The original cracks and those formed subsequently are also inclined to propagate, ultimately leading to spalling failure on the material’s contact surface [9,10,11,12,13]. In recent years, despite substantial research efforts by scholars on the spalling failure of silicon nitride ceramic ball bearings, the precise mechanism underlying the surface spalling of these bearings remains poorly understood. Therefore, there is a pressing need for further research to comprehensively comprehend the crack propagation mechanism during the rolling contact of silicon nitride ceramic ball bearings. This understanding will facilitate adjustments to the processing technology and working parameters, thereby prolonging the service life of silicon nitride ceramic ball bearings.
In recent years, scholars have primarily focused their research on three key aspects: crack initiation and propagation, rolling contact fatigue (RCF) experiments, and stress intensity factor (SIFs) calculations. Regarding crack initiation and propagation, Geng et al. [14] and Wang et al. [15] have elucidated the mechanisms of crack initiation and propagation in metal bearings. These mechanisms are primarily attributed to surface cracks and subsurface cracks. Surface cracks are predominantly induced by pits resulting from cutting tool marks and the detachment of inclusions. Correspondingly, subsurface cracks are mainly caused by internal nonmetallic inclusions, such as Al, Ca, Si, and Mg oxides. In accordance with Paris law, Khader et al. [16] proposed that crack initiation and propagation are more likely to occur in locations subjected to alternating loads. Several criteria, such as the Jiang-Sehitoglu criterion [17], Brown-Miller strain-life equation [18], Basquin equation [19], and Paris law [20], have been employed to calculate the fatigue life of crack initiation and propagation. It is noteworthy that the majority of these studies primarily focus on RCF crack propagation in railway wheel hub steel under the rolling contact conditions of rail wheels. Limited attention has been given to the impact of bearing contact conditions on bearing RCF performance. However, bearing contact conditions are more intricate than rail wheel contact conditions. Slack et al. [21] introduced a series of finite element models to investigate the processes of crack initiation, propagation, and spalling in rolling contact fatigue. Warhadpande et al. [22] established a Voronoi finite element model (VFEM) based on damage mechanics. This model can simulate the initiation, propagation, and fatigue spalling of micro-cracks while also examining the influence of surface defects on the linear contact of elastohydrodynamic lubrication. Deng et al. [23] explored the effects of bending moment, radial load, and other factors on the stress intensity factor at the crack front, crack growth rate, and crack initiation. They proposed a simulation model to study the effects of crack inclination angle and inclusion hardness on bearing fatigue damage, concluding that the shear mode plays a crucial role in crack initiation, while other modes play a secondary role.
In terms of experiments, Zhou [24] designed a novel RCF experimental device and concluded that the primary mode of failure in ceramic bearings was material spalling due to crack propagation. Khan et al. [25,26,27,28] and Wang et al. [29,30] conducted numerous experimental studies utilizing four-ball and other RCF experimental devices, yielding a plethora of valuable conclusions. O. O. Balyts’kyi [31] conducted experimental investigations on the fracture behavior of gallium selenide crystals and concluded that under mechanical stress, slip bands propagate to the surface, resulting in crystal spalling at an angle of approximately 45° relative to the applied tensile stresses. Drissi-Habti et al. [32] employed the dye penetrant technique to study the R-curve behavior of polycrystalline alumina material and found that a work of fracture value of 73 jm-2 was achieved after crack extension a = 3 mm, while crack growth initiated at Go = 26 jm-2. The observed increase in the R curve is attributed to interlocking grains within the crack wake. Niihara et al. [33] employed a sharp diamond indentation technique to generate artificial surface cracks—an exceptionally effective experimental approach. This method allows for the creation of cracks with sufficiently large size and repeatable geometry, facilitating RCF experiments under controlled conditions. Building upon this technique, Kida et al. [34,35,36], Wang et al. [37,38,39], and Levesque et al. [40,41] initiated RCF experiments to validate their fracture mechanics theoretical models.
In fracture mechanics, SIFs play a crucial role in calculating the speed and direction of crack growth. Consequently, scholars have dedicated substantial efforts to researching SIF calculations in recent years. Trolle et al. [42] proposed a simulation for rail crack propagation under RCF using the XFEM. Additionally, Mousavi et al. [43] introduced a simulation for crack initiation and propagation under uniaxial load on Si3N4, based on the adaptive heavy grid cohesion element model. It is essential to note that although finite element SIF solution methods are relatively economical, the associated computation time is often extensive. Consequently, conducting systematic research on cracks with diverse geometric shapes and expansion paths becomes impractical. To address this limitation, a simplified method for calculating SIFs for surface cracks with different positions, orientations, and sizes has been developed. This method is based on the weight function program developed by Ckner [44] and Rice [45]. Utilizing this approach [46,47], one only needs information about the geometry of the crack propagation path, the stress within the crack plane, the stress perpendicular to the crack plane, and the approximate weight function suitable for the crack geometry.
In the operational phase of a silicon nitride ceramic bearing, the contact position between the bearing ball and ring undergoes constant variation. Consequently, the load contact position in relation to the surface crack of the ring channel is also in continual flux. Different load contact positions lead to distinct surface crack SIFs. Surprisingly, previous studies have not delved into the analysis of the crack propagation mechanism on the surface of silicon nitride ceramic bearing rings based on the relative contact position of cracks and loads. This paper initiates its exploration by conducting a rolling contact friction experiment, determining the friction coefficient essential for subsequent simulations. Subsequently, a three-dimensional finite element contact model is established between the silicon nitride ceramic ring and the ceramic ball. Following the insertion of the surface crack of the ring channel into the Franc3D-V8.4 software, a joint simulation of Franc3D-V8.4 and ABAQUS2020 is executed. The ensuing step involves calculating the crack front SIFs for various load contact positions during different propagation stages of cracks with diverse initial depths. The ensuing discussion delves into the changing patterns of crack front SIFs at distinct load contact positions as crack propagation unfolds. Notably, the research identifies the contact position where the maximum effective stress intensity factor load determines the crack front. Simultaneously, the paper explores the influence of the initial crack depth on the cycle life and direction of crack propagation.
2. Rolling Friction Experiment
2.1. Experimental Instruments
The experiment utilized the HKMM-W1B vertical universal rolling friction testing machine, the structure of which is illustrated in Figure 1. This machine comprises a control system, friction fixture, loading lever, and other components. It is versatile, allowing it to be paired with various rolling friction setups, including ball and disc friction pairs, four-ball friction pairs, three-piece ball bronze friction pairs, and other configurations for rolling friction experiments. Figure 2 shows the operational principle of the four-ball friction pair adopted in this paper. The spindle applies positive pressure load and rotating torque to the upper ball through the chuck. Subsequently, the upper ball imparts motion to the lower three balls, facilitating rolling friction movement. In this configuration, the stationary oil box represents the bearing outer ring, the three lower balls represent the bearing rolling body, and the upper ball symbolizes the inner ring.
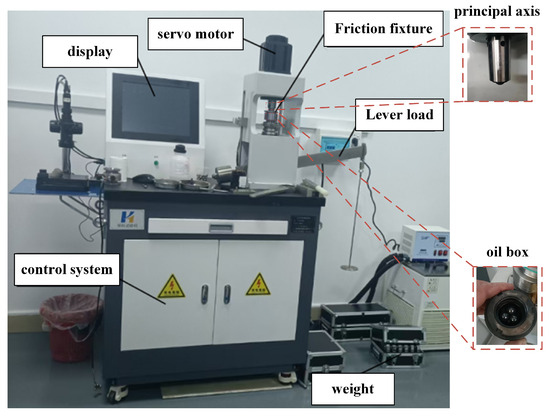
Figure 1.
Experimental instruments.
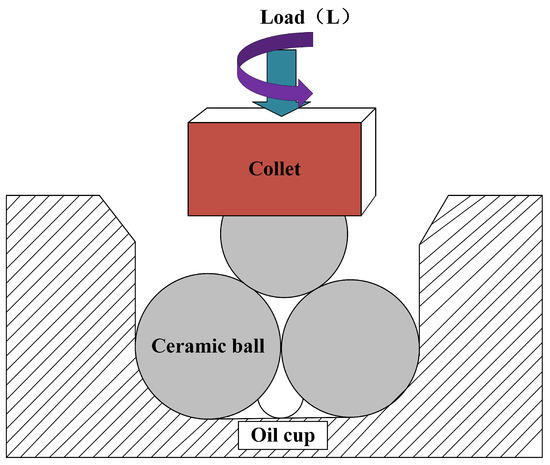
Figure 2.
Four ball friction pair working principle.
2.2. Experimental Materials
A customized 12.7 mm G5 silicon nitride ceramic ball was employed for the rolling friction experiment. Prior to integrating the ceramic ball into the oil box, it underwent a thorough cleaning and drying process using ether. Given the non-lubricated nature of this experiment, it is imperative that the oil box be similarly cleaned and air-blown dry before loading the ceramic ball into it.
2.3. Experimental Data Processing
The friction data was collected at intervals of 0.5 s between 50 and 200 s after the rolling friction experiment reached stabilization. Each group of pressure and speed conditions underwent three repetitions of the experiment. Figure 3 illustrates the data obtained from one experiment conducted under each working condition. Notably, all three graphs exhibit discernible fluctuations, albeit with limited amplitude. Consequently, the subsequent joint simulation discussed in the following sections of this paper relies on the analysis of average friction coefficients presented in Table 1.

Figure 3.
Experimental data of different working conditions. (a) friction coefficient data 10 N-1000 r/min; (b) 20 N-1000 r/min friction coefficient data; (c) 20 N-2000 r/min friction coefficient data.

Table 1.
Average friction coefficient under different working conditions.
3. Joint Simulation of Crack Propagation on Channel Surface of Silicon Nitride Ceramic Ball Bearing
3.1. Process of Joint Simulation
In this paper, two finite element software programs, Franc3D-V8.4 and ABAQUS2020, were utilized for joint simulation. Initially, a comprehensive finite element model of the rolling contact between silicon nitride ceramic rings and ceramic balls was established in ABAQUS, and appropriate boundary conditions were defined. Subsequently, Franc3D-V8.4 extracted its channel submodel, introduced the initial surface crack, and redivided the grid. The resulting combined model was employed for stress-strain analysis using ABAQUS2020. Finally, Franc3D-V8.4 utilized the stress-strain data to calculate the stress intensity factor at the crack front and generated the extended model. The specific procedural steps are illustrated in Figure 4.
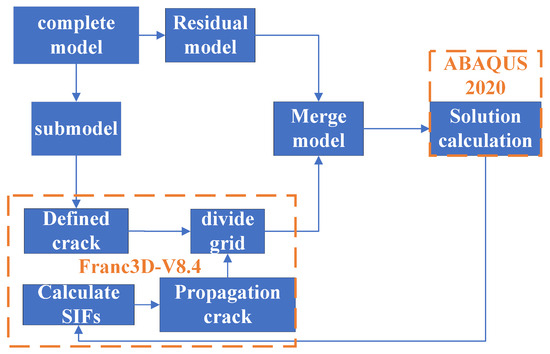
Figure 4.
Joint simulation flow chart.
3.2. Theory of Crack Propagation and Calculation Method of Franc3D-V8.4
In structural materials, cracks propagate under the influence of external forces through three primary modes, as illustrated in Figure 5. Mode I, often referred to as “the opening mode”, is predominantly induced by normal stress, resulting in the displacement of the crack surface perpendicular to the crack plane. Mode II, also known as “the sliding mode”, is generated by inplane shear. Mode III, or “the tearing mode”, is produced by out-of-plane shear, wherein the crack surface displacement occurs within the crack plane and runs parallel to the edge of the crack on the leading surface. , and represent the SIFs corresponding to mode I, mode II, and mode III, respectively.
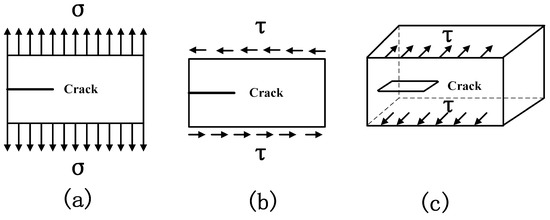
Figure 5.
Basic crack model diagram. (a) Mode I; (b) Mode II; (c) Mode III.
In the working process of a silicon nitride ceramic ball bearing, the surface of the ring channel experiences positive pressure and frictional force due to the rolling contact of the ceramic ball. If a surface crack is present on the ring channel’s surface, the crack becomes subject to contact stress caused by positive pressure and frictional force, resulting in SIFs at the crack front. When the amplitude of the effective stress intensity factor, , surpasses the threshold value, , of the silicon nitride material but remains below its fracture toughness, the crack will expand steadily. If it is below the threshold value, the crack will propagate extremely slowly. Conversely, when it exceeds the threshold value, the crack will propagate unstably, leading to rapid fracture. Ref. [23] indicates that when the contact load is distant from the crack, then . Therefore, can be determined using and expressed as follows:
The stable expansion interval is called the Paris region, and the formula of crack growth rate in this region can be calculated by the Paris formula, and its expression is as follows:
where a is the crack propagation length, N is the cycle movement life, c and m are the material constants of silicon nitride. In earlier studies, Wang et al. [36] gave the HIP silicon nitride ceramic material .
Therefore, the cyclic movement life can be expressed as:
where and is the initial length of the crack and the length after propagation, respectively.
Franc3D-V8.4 software uses the M-integral method to calculate the . Firstly, the relationship between the M-integral and stress-strain is as follows:
where Γ is an integral loop around the crack tip;
Then the relationship between the M-integral and SIFs is:
There are material mechanics relations:
Therefore, the equilibrium equation can be established by Formulas (4)–(7) to solve and .
3.3. Motion Model of Joint Simulation
Figure 6 illustrates the schematic diagram detailing the operational dynamics of a silicon nitride ceramic ball bearing. The ring channel surface experiences both the positive pressure, , arising from the vertical channel surface due to the rolling contact of the ceramic ball, and the opposing friction traction force, , acting in the opposite direction of the rolling motion. The contact load within the working mechanism follows a cyclic pattern, transitioning from a position distant from the crack to proximity through the crack and then gradually moving away from the crack. Consequently, to investigate the stress intensity factor of the crack front at various positions of the contact load, five distinct load contact positions, as depicted in Figure 7, were chosen around the crack. Each of these load contact positions was evenly spaced by . The numerical calculation expressions for and are as follows:
where is the maximum positive pressure, R is the radius of the load circle, and f is the friction coefficient. The friction coefficient of the joint simulation is 0.0417, which is obtained from the above rolling contact friction experiment.
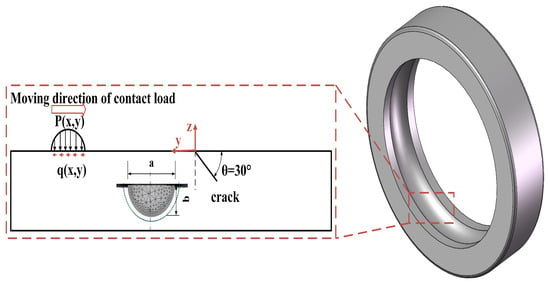
Figure 6.
Schematic diagram of the working motion of the silicon nitride ceramic ball bearing.
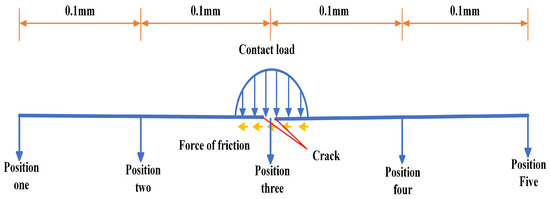
Figure 7.
Diagram of five positions next to the crack.
The width of the initial crack is is the inclination angle of the initial crack, and the depth b of the initial crack is , and , respectively. The constitutive model was adopted for the joint simulation of silicon nitride material, and its parameter settings are shown in Table 2.

Table 2.
Silicon nitride JH-2 material parameters table.
4. Calculation Results and Discussion
To facilitate the representation of the crack front, normalization is employed, wherein each point on the crack front is assigned a value between 0 and 1. Figure 8 illustrates a comparison of SIFs at five distinct load contact positions during cyclic motion, while the crack with an initial depth of remains non-propagated. Observing the SIFs at these positions, it becomes apparent that the magnitudes of , and are all within the same order of magnitude. This observation substantiates the categorization of the surface crack in the silicon nitride ring channel as a composite crack. Additionally, and of the five load contact positions exhibit an axisymmetrical distribution along the line where the midpoint 0.5 of the crack front is situated. is centrally and symmetrically distributed, with the midpoint 0.5 of the crack front serving as the symmetry center. The maximum values of the five load contact positions are as follows: and , respectively. Notably, all these maxima occur at the midpoint 0.5 of the crack front, demonstrating a pattern of initial increase followed by a subsequent decrease. Based on Figure 6 and Formula (8), it is evident that the midpoint of the crack front lies on the midline where . This location corresponds to a region with a substantial load pressure, leading to the maximum value for each load contact position at the midpoint (0.5). The reason behind the highest value among the maximum values of the five load contact positions occurring at position (4) instead of position (3), which is directly above the crack, is the initial inclination of the crack at . When the load contact is directly above the crack, the load center at remains relatively distant from the crack front point (0.5). However, as the load center shifts to the load contact position (4), it comes into closer proximity to the crack front point (0.5). Consequently, the load contact position of yielding the maximum value is position (4). The of the five load contact positions are all greater than and , except for the load contact position (3). It can be concluded that model I dominates the fatigue crack propagation behavior. With the exception of the load contact position (3), the maximum value of is still observed at the crack front point (0.5). The maximum values of are and , respectively. These values exhibit an initial increase followed by a subsequent decrease. It is evident that for , almost all five load contact positions in the crack’s initial state are less than and .
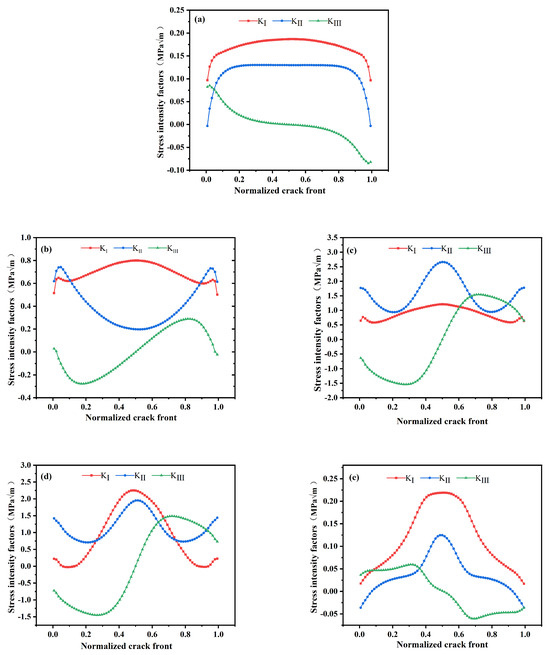
Figure 8.
The SIFs of initial depth 0.1 mm crack front without propagation. (a) Position one; (b) position two; (c) position three; (d) position four; (e) position five.
In Figure 9, it is evident that after the crack with an initial depth of undergoes propagation once, the symmetry characteristics of and remain consistent with those observed when the crack is not propagated. However, the maximum value among the five load contact positions no longer resides at the midpoint (0.5) of the crack front; instead, it is situated at points 0.23 and 0.77. Additionally, the maximum value of exhibits a pattern of initial increase followed by a subsequent decrease. Moreover, the maximum value among the five load contact positions shifts from load contact position (4) to load contact position (3), with a reduction compared to the scenario where the crack does not propagate. In addition to the load contact position (1), the maximum value for the remaining four load contact positions continues to occur at points 0.23 and 0.77. The trend of an initial increase and subsequent decrease persists for each load contact position, resulting in a decrease in the maximum value among the maximum values of for the five load contact positions compared to the case without crack propagation.
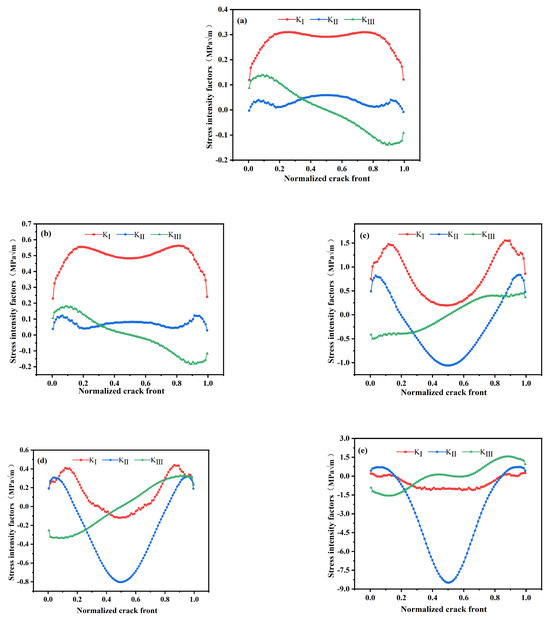
Figure 9.
The SIFs of initial depth 0.1 mm crack front after the first propagation. (a) Position one; (b) position two; (c) position three; (d) position four; (e) position five.
On one hand, the decrease in value can be attributed to the crack’s propagation, which moves the crack front farther away from the channel surface, resulting in reduced load pressure on the crack front. On the other hand, an increase in the inclination of the crack front contributes to a decrease in the value size.
Figure 10 depicts the comparison diagram of SIFs for the five load contact positions following the initial crack propagation for two cycles. It is evident that the symmetry characteristics of , and and the variation pattern of the maximum value remain consistent with the preceding two instances. The maximum value, among the peak values for the five load contact positions, is notably diminished compared to the scenario after the initial crack propagation for a single cycle. Specifically, and decrease by and , respectively.
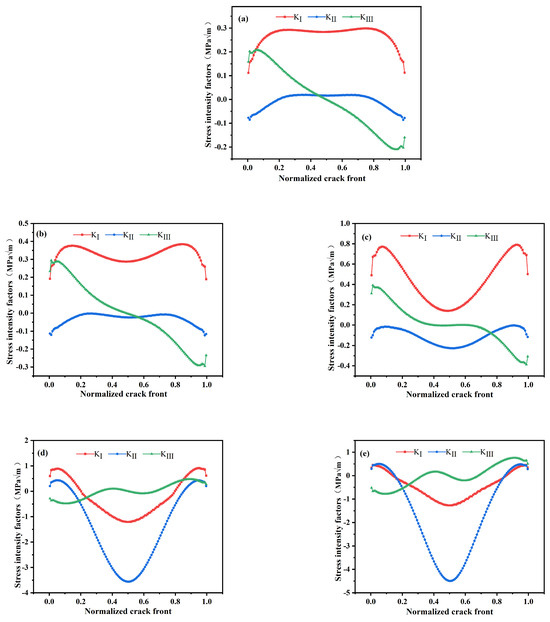
Figure 10.
The SIFs of initial depth 0.1 mm crack front after the second propagation. (a) Position one; (b) position two; (c) position three; (d) position four; (e) position five.
In Section 2.2, it is evident that the amplitude of the effective SIFs plays a crucial role in determining the propagation speed of a crack. Furthermore, the maximum value of effective SIFs at the crack front serves as a reflection of the amplitude of these factors. Therefore, studying and discussing the maximum value of effective SIFs at the crack front holds significant importance. Figure 11, Figure 12 and Figure 13 illustrates a comparison of the effective SIFs at the crack front for various load contact positions. The scenarios considered include the initial crack depth being , and , with instances of no propagation, propagation occurring once, and propagation occurring twice. The three-dimensional graphs of each effective SIF exhibit symmetrical distribution in a plane where the crack front point 0.5 is perpendicular to the axis. Upon combining the calculation formula of the effective SIFs, it becomes apparent that this is determined by the symmetric properties of and . It is noteworthy that the maximum effective SIFs at each initial crack depth propagation stage do not necessarily align with the effective stress intensity factor at the same load contact position.

Figure 11.
Comparison of effective stress intensity factors without propagation at the first propagation and the second propagation of the initial depth of 0.1 mm. (a) Without propagation; (b) first propagation; (c) second propagation.

Figure 12.
Comparison of effective stress intensity factors without propagation at the first propagation and the second propagation of the initial depth of 0.15 mm. (a) Without propagation; (b) first propagation; (c) second propagation.

Figure 13.
Comparison of effective stress intensity factors without propagation at the first propagation and the second propagation of the initial depth of 0.20 mm. (a) Without propagation; (b) first propagation; (c) second propagation.
In Figure 11a, when the crack at the initial depth of does not propagate, the maximum effective SIFs of the crack front are determined by the effective SIFs of the load contact positions (3) and (4). Among these, segments 0–0.349 and 0.651–1 are determined by the effective SIFs of the load contact position (3), while segments 0.349–0.651 are determined by the effective SIFs of the load contact position (4). In Figure 11b, after the initial depth of the crack has propagated once, the maximum effective SIFs of the crack front are determined by the effective SIFs of the load contact position (3). In Figure 11c, after the initial depth of the crack has propagated twice, the maximum effective SIFs of the crack front are determined by the effective SIFs of the load contact positions (3) and (5). In this case, segments 0–0.211 and 0.789–1 are determined by the effective SIFs of the load contact position (3), while segment 0.211–0.789 is determined by the effective SIFs of the load contact position (5).
In Figure 12a, when the crack at the initial depth of 0.15 mm does not propagate, the maximum effective SIFs of the crack front are determined by the effective SIFs of the load contact positions (3) and (4). Among these, segments 0–0.211 and 0.789–1 are determined by the effective SIFs of the load contact position (3), while segment 0.211–0.789 is determined by the effective SIFs of the load contact position (5). In Figure 12b, after the initial depth of the 0.15 mm crack has propagated once, the maximum effective SIFs of the crack front are determined by the effective SIFs of the load contact position (3). In Figure 12c, after the initial depth of the 0.15 mm crack has propagated twice, the maximum effective SIFs of the crack front are determined by the effective SIFs of the load contact position (3).
In Figure 13a, when the crack at the initial depth of 0.20 mm does not propagate, the maximum effective SIFs of the crack front are determined by the effective SIFs of the load contact position (3). In Figure 13b, after the initial depth of 0.20 mm, the crack propagated once, and the maximum effective SIFs of the crack front are determined by the effective SIFs of the load contact position (5). In Figure 13c, after the initial depth of 0.20 mm, the crack propagated twice, and the maximum effective SIFs of the crack front are determined by the effective SIFs of the load contact position (5).
Figure 14 depicts the cycle life of crack propagation with varying initial depths. The joint simulation establishes the single propagation as the maximum crack front size at 0.02 mm. It is evident that the cycle life of the second propagation for each initial depth of the crack surpasses that of the first. Specifically, the second propagation cycle life of a crack with an initial depth of 0.1 mm is 7.52% longer than the first, the second propagation cycle life of a crack with an initial depth of 0.15 mm is 6.57% longer than the first, and the second propagation cycle life of a crack with an initial depth of 0.2 mm is 29.5% longer than the first. Additionally, it is observable that with the increase in the initial depth of the crack, the total life of the two extended cycles also experiences a significant increase. Notably, the cycle life of a crack with an initial depth of 0.15 mm increases by 20.4% compared to the 0.1 mm crack cycle life, and the cycle life of a crack with an initial depth of 0.2 mm increases by 25.2% compared to the 0.15 mm crack cycle life. This trend is evidently attributable to the decrease in the maximum effective Stress Intensity Factors (SIFs) of the crack front with the progression of crack propagation and the increase in initial depth.
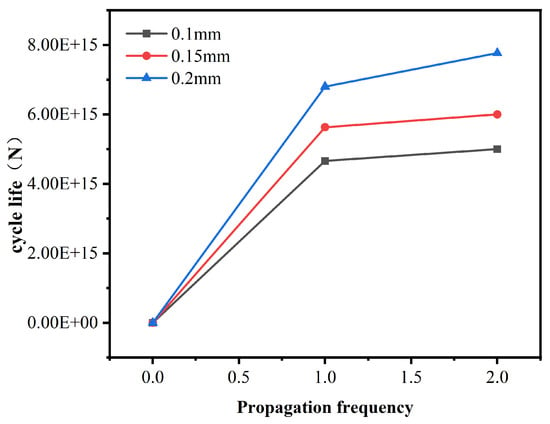
Figure 14.
Comparison of the propagation cycle life of cracks with initial depths of 0.1 mm, 0.15 mm and 0.2 mm.
Figure 15 depicts the primary and side views following two expansions of three types of cracks, each with initial depths of , and . It is evident that the deflection angle of crack propagation decreases with the increasing initial crack depth, with the difference gradually diminishing. Specifically, the deflection angle difference between the initial crack depths of and is , and the difference between the initial crack depths of and is . The deflection occurs towards the inside of the ring channel. Consequently, it can be inferred that the material is less susceptible to spalling due to these three types of cracks.
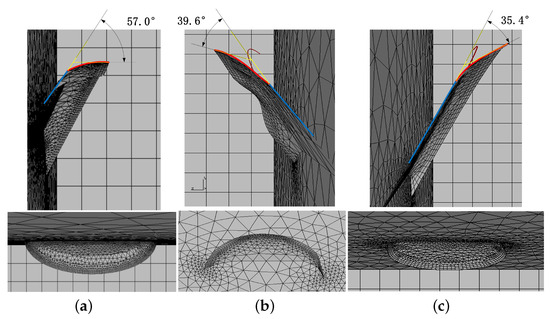
Figure 15.
Comparison of propagation angle of cracks with initial depths of (a) 0.1 mm, (b) 0.15 mm and (c) 0.2 mm.
5. Conclusions
This paper presents the completion of the joint simulation using Franc3D and ABAQUS based on the measured friction coefficient obtained from the rolling friction experiment. The study focuses on the variation in the SIFs along the crack front with crack propagation at five load contact positions during cyclic motion. Additionally, it investigates the determination of the maximum effective SIFs and the impact of the initial crack depth on the cycle life and direction of crack propagation. The following conclusions can be drawn:
- The SIFs associated with the surface cracks on the silicon nitride ring channel exhibit similar orders of magnitude throughout the propagation process, providing evidence of their compound crack nature. The and , corresponding to five loading contact positions, demonstrate an axisymmetric distribution along the line positioned at the midpoint of the crack front. In contrast, exhibits central and symmetrical distribution with the midpoint of the crack front serving as the symmetry center.
- During the progression of ring channel surface crack propagation, the and maximum values at five load contact positions exhibit an initial increase followed by a subsequent decrease. Nevertheless, after two instances of crack propagation, there is a noticeable alteration in both the load contact positions and crack front points where the and maximum values are situated, manifesting prominently during the cyclic movement. Concurrently, the and maximum values gradually decrease as the crack continues to propagate.
- The maximum effective SIFs at the crack front can indicate the amplitude of the effective SIFs. However, considering various stages of initial depth crack propagation, it is not necessarily determined by the same load contact position for the maximum effective SIFs at the ring channel surface crack front.
- For crack propagation with the same maximum propagation size, the deeper the initial crack depth, the longer the cycle life of the silicon nitride ring channel surface crack. Additionally, the cycle life increases with the growth in the number of crack propagations.
- The deflection angle of ring channel surface crack propagation decreases with the increase in the initial crack depth, and the difference decreases gradually. The deflection direction is towards the inside of the ring channel. Consequently, surface cracks of three different initial depths are less likely to cause material spalling.
Author Contributions
Conceptualization, P.W. and S.L.; methodology, P.W.; software, P.W.; validation, P.W., Y.W. (Yuhou Wu), C.W. and Y.W. (Yonghua Wang); formal analysis, P.W.; investigation, P.W., Y.Z. and Y.W. (Yuhou Wu); resources, P.W.; data curation, P.W.; writing—original draft preparation, P.W.; writing—review and editing, P.W.; visualization, Y.W. (Yuhou Wu) and Y.W. (Yonghua Wang); supervision, S.L.; project administration, P.W.; funding acquisition, S.L. All authors have read and agreed to the published version of the manuscript.
Funding
This research was funded by the National Natural Science Foundation of China under grant U23A20631, and by the Sichuan Provincial Department of Education university platform project under grant GK201920 and GK201915.
Institutional Review Board Statement
Not applicable.
Informed Consent Statement
Not applicable.
Data Availability Statement
The data presented in this study are available on request from the corresponding author due to privacy.
Conflicts of Interest
The authors declare no conflict of interest.
Abbreviations
The following abbreviations are used in this manuscript:
| RCF | Rolling contact fatigue |
| SIFs | Stress intensity factors |
| VFEM | Voronoi finite element model |
| XFEM | Extended finite element method |
References
- Liu, Z.; HE SQ, L. Rolling Element Bearings Application Handbook; China Machine Press: Beijing, China, 2006. [Google Scholar]
- Keer, L.; Bryant, M. A pitting model for rolling contact fatigue. J. Tribol. 1983, 105, 198–205. [Google Scholar] [CrossRef]
- Zhou, R.; Cheng, H.S.; Mura, T. Micropitting in rolling and sliding contact under mixed lubrication. J. Tribol. 1989, 111, 605–613. [Google Scholar] [CrossRef]
- Gloeckner, P.; Martin, M.; Flouros, M. Comparison of power losses and temperatures between an all-Steel and a direct outer ring–cooled, hybrid 133-mm-bore ball bearing at very high speeds. Tribol. Trans. 2017, 60, 1148–1158. [Google Scholar] [CrossRef]
- Wu, D.; Wang, H.; Liu, H.; He, T.; Xie, T. Health monitoring on the spacecraft bearings in high-speed rotating systems by using the clustering fusion of normal acoustic parameters. Appl. Sci. 2019, 9, 3246. [Google Scholar] [CrossRef]
- Cui, L.; Wang, X.; Wang, H.; Wu, N. Improved fault size estimation method for rolling element bearings based on concatenation dictionary. IEEE Access 2019, 7, 22710–22718. [Google Scholar] [CrossRef]
- Cui, L.; Wang, X.; Wang, H.; Ma, J. Research on remaining useful life prediction of rolling element bearings based on time-varying Kalman filter. IEEE Trans. Instrum. Meas. 2019, 69, 2858–2867. [Google Scholar] [CrossRef]
- Belinha, J.; Azevedo, J.; Dinis, L.M.d.J.S.; Jorge, R.N. Simulating fracture propagation in brittle materials using a meshless approach. Eng. Comput. 2018, 34, 503–522. [Google Scholar] [CrossRef]
- Ma, D.; Wang, J.; Sun, L. Methodology for measuring fracture toughness of ceramic materials by instrumented indentation test with vickers indenter. J. Am. Ceram. Soc. 2017, 100, 2296–2308. [Google Scholar] [CrossRef]
- Vieillard, C. Observation of subsurface rolling contact fatigue cracks in silicon nitride and comparison of their location to Hertzian contact subsurface stresses. Int. J. Fatigue 2017, 96, 283–292. [Google Scholar] [CrossRef]
- Sun, L.; Ma, D.; Wang, L.; Shi, X.; Wang, J.; Chen, W. Determining indentation fracture toughness of ceramics by finite element method using virtual crack closure technique. Eng. Fract. Mech. 2018, 197, 151–159. [Google Scholar] [CrossRef]
- Li, B.; Ma, H.; Yu, X.; Zeng, J.; Guo, X.; Wen, B. Nonlinear vibration and dynamic stability analysis of rotor-blade system with nonlinear supports. Arch. Appl. Mech. 2019, 89, 1375–1402. [Google Scholar] [CrossRef]
- Cui, L.; Jin, Z.; Huang, J.; Wang, H. Fault severity classification and size estimation for ball bearings based on vibration mechanism. IEEE Access 2019, 7, 56107–56116. [Google Scholar] [CrossRef]
- Geng, S.Y.; Yang, M.S.; Zhao, K.Y. Fatigue crack initiation and propagation behavior of high cobalt molybdenum stainless bearing steel. J. Iron Steel Res. 2018, 30, 906–915. [Google Scholar]
- Wang, Y.J.; Yang, M.S.; Sun, S.Q.; Zhang, Z.H. Fatigue crack formation and propagation behavior of 30Cr3WVE bearing steel. J. Iron Steel Res. 2018, 30, 213–221. [Google Scholar]
- Khader, I.; Rasche, S.; Lube, T.; Raga, R.; Degenhardt, U.; Kailer, A. Lifetime prediction of ceramic components–A case study on hybrid rolling contact. Eng. Fract. Mech. 2017, 169, 292–308. [Google Scholar] [CrossRef]
- Zhou, J.; Wu, G.; Zhu, W.; Chen, X. Tensile stress fatigue life model of silicon nitride ceramic balls. Tribol. Int. 2009, 42, 1838–1845. [Google Scholar] [CrossRef]
- Zhao, P.; Hadfield, M.; Wang, Y.; Vieillard, C. Subsurface propagation of partial ring cracks under rolling contact: Part II. Fracture mechanics analysis. Wear 2006, 261, 390–397. [Google Scholar] [CrossRef]
- Riesch-Oppermann, H.; Scherrer-Rudiy, S.; Härtelt, M.; Kraft, O. Reliability prediction for contact strength and fatigue of silicon nitride high strength components using an R-curve approach. Eng. Fract. Mech. 2013, 100, 52–62. [Google Scholar] [CrossRef]
- Azeggagh, N.; Joly-Pottuz, L.; Nélias, D.; Chevalier, J.; Omori, M.; Hashida, T. Hertzian contact damage in silicon nitride ceramics with different porosity contents. J. Eur. Ceram. Soc. 2015, 35, 2269–2276. [Google Scholar] [CrossRef]
- Slack, T.; Sadeghi, F. Cohesive zone modeling of intergranular fatigue damage in rolling contacts. Tribol. Int. 2011, 44, 797–804. [Google Scholar] [CrossRef]
- Warhadpande, A.; Sadeghi, F. Effects of surface defects on rolling contact fatigue of heavily loaded lubricated contacts. Proc. Inst. Mech. Eng. Part J J. Eng. Tribol. 2010, 224, 1061–1077. [Google Scholar] [CrossRef]
- Deng, S.; Hua, L.; Han, X.; Huang, S. Investigation of rolling contact fatigue cracks in ball bearings. Int. J. Fract. 2014, 188, 71–78. [Google Scholar] [CrossRef]
- Zhou, J. Rolling Contact Fatigue Life of Silicon Nitride Ceramic Balls. Doctor’s Dissertation, Shanghai University, Shanghai, China, 2006. [Google Scholar]
- Khan, Z.A.; Hadfield, M. Manufacturing induced residual stress influence on the rolling contact fatigue life performance of lubricated silicon nitride bearing materials. Mater. Des. 2007, 28, 2688–2693. [Google Scholar] [CrossRef]
- Khan, Z.A.; Hadfield, M.; Tobe, S.; Wang, Y. Ceramic rolling elements with ring crack defects—A residual stress approach. Mater. Sci. Eng. A 2005, 404, 221–226. [Google Scholar] [CrossRef]
- Khan, Z.A.; Hadfield, M.; Tobe, S.; Wang, Y. Residual stress variations during rolling contact fatigue of refrigerant lubricated silicon nitride bearing elements. Ceram. Int. 2006, 32, 751–754. [Google Scholar] [CrossRef]
- Khan, Z.A.; Hadfield, M.; Wang, Y. Pressurised chamber design for conducting rolling contact experiments with liquid refrigerant lubrication. Mater. Des. 2005, 26, 680–689. [Google Scholar] [CrossRef]
- Wang, Y.; Hadfield, M. A study of line defect fatigue failure of ceramic rolling elements in rolling contact. Wear 2002, 253, 975–985. [Google Scholar] [CrossRef]
- Wang, Y.; Hadfield, M. The influence of ring crack location on the rolling contact fatigue failure of lubricated silicon nitride: Experimental studies. Wear 2000, 243, 157–166. [Google Scholar] [CrossRef]
- Balyts’ kyi, O. Degradation and fracture of crystals of gallium and indium selenides. Mater. Sci. 2003, 39, 561–565. [Google Scholar] [CrossRef]
- Drissi-Habti, M.; Gomina, M. Crack growth resistance from natural crack lengths in polycrystalline alumina. J. Alloys Compd. 1992, 188, 259–263. [Google Scholar] [CrossRef]
- Niihara, K.; Morena, R.; Hasselman, D. Evaluation of K Ic of brittle solids by the indentation method with low crack-to-indent ratios. J. Mater. Sci. Lett. 1982, 1, 13–16. [Google Scholar] [CrossRef]
- Kida, K.; Urakami, T.; Yamazaki, T.; Kitamura, K. Surface crack growth of silicon nitride bearings under rolling contact fatigue. Fatigue Fract. Eng. Mater. Struct. 2004, 27, 657–668. [Google Scholar] [CrossRef]
- Kida, K.; Saito, M.; Kitamura, K. Flaking failure originating from a single surface crack in silicon nitride under rolling contact fatigue. Fatigue Fract. Eng. Mater. Struct. 2005, 28, 1087–1097. [Google Scholar] [CrossRef]
- Kida, K.; Honda, T.; Santos, E. Mode II surface crack growth under rolling contact fatigue and cyclic shear stress in Si3N4. WIT Trans. Eng. Sci. 2012, 76, 175–187. [Google Scholar]
- Wang, Y.; Hadfield, M. Life prediction for surface crack initiated contact fatigue of silicon nitride bearing balls. In Tribology Series; Elsevier: Amsterdam, The Netherlands, 2003; Volume 41, pp. 349–358. [Google Scholar]
- Wang, Y.; Hadfield, M. Failure modes of ceramic rolling elements with surface crack defects. Wear 2004, 256, 208–219. [Google Scholar] [CrossRef]
- Wang, Y.; Hadfield, M. A mechanism for nucleating secondary fractures near a pre-existing flaw subjected to contact loading. Wear 2003, 254, 597–605. [Google Scholar] [CrossRef]
- Levesque, G.A.; Arakere, N.K. Critical flaw size in silicon nitride ball bearings. Tribol. Trans. 2010, 53, 511–519. [Google Scholar] [CrossRef]
- Levesque, G.; Arakere, N.K. An investigation of partial cone cracks in silicon nitride balls. Int. J. Solids Struct. 2008, 45, 6301–6315. [Google Scholar] [CrossRef]
- Trollé, B.; Baietto, M.C.; Gravouil, A.; Mai, S.; Nguyen-Tajan, T. XFEM crack propagation under rolling contact fatigue. Procedia Eng. 2013, 66, 775–782. [Google Scholar] [CrossRef]
- Mousavi, S.T.; Richart, N.; Wolff, C.; Molinari, J.F. Dynamic crack propagation in a heterogeneous ceramic microstructure, insights from a cohesive model. Acta Mater. 2015, 88, 136–146. [Google Scholar] [CrossRef]
- Bueckner, H. Novel principle for the computation of stress intensity factors. Z. Fuer Angew. Math. Mech. 1970, 50, 529–546. [Google Scholar]
- Rice, J.R. Some remarks on elastic crack-tip stress fields. Int. J. Solids Struct. 1972, 8, 751–758. [Google Scholar] [CrossRef]
- Fett, T.; Munz, D. Stress Intensity Factors and Weight Functions for Special Crack Problems; FZKA Karlsruhe: Karlsruhe, Germany, 1998; Volume 6025. [Google Scholar]
- Fett, T. Stress Intensity Factors-t-Stresses-Weight Functions; KIT Scientific Publishing: Karlsruhe, Germany, 2008. [Google Scholar]
Disclaimer/Publisher’s Note: The statements, opinions and data contained in all publications are solely those of the individual author(s) and contributor(s) and not of MDPI and/or the editor(s). MDPI and/or the editor(s) disclaim responsibility for any injury to people or property resulting from any ideas, methods, instructions or products referred to in the content. |
© 2024 by the authors. Licensee MDPI, Basel, Switzerland. This article is an open access article distributed under the terms and conditions of the Creative Commons Attribution (CC BY) license (https://creativecommons.org/licenses/by/4.0/).