Analysis of Technical Condition of Cars in Western Poland: A Study Based on Selected Indicators
Abstract
1. Introduction
2. Materials and Methods
3. Results
4. Discussion
5. Conclusions
Author Contributions
Funding
Institutional Review Board Statement
Informed Consent Statement
Data Availability Statement
Conflicts of Interest
References
- Martín-delosReyes, L.M.; Lardelli-Claret, P.; García-Cuerva, L.; Rivera-Izquierdo, M.; Jiménez-Mejías, E.; Martínez-Ruiz, V. Effect of Periodic Vehicle Inspection on Road Crashes and Injuries: A Systematic Review. Int. J. Environ. Res. Public Health 2021, 18, 6476. [Google Scholar] [CrossRef] [PubMed]
- Filipczyk, J. The inspections of cars in the scope of traffic safety and environmental protection—The present situation and the prospects of development. Transp. Probl. 2010, 5, 115–122. [Google Scholar]
- Bazhinov, O.; Gerlici, J.; Kravchenko, O.; Haiek, Y.; Bazhynova, T.; Zaverukha, R.; Kravchenko, K. Development of a Method for Evaluating the Technical Condition of a Car’s Hybrid Powertrain. Symmetry 2021, 13, 2356. [Google Scholar] [CrossRef]
- Hudec, J.; Sarkan, B.; Czodorova, R.; Caban, J.; Droździel, P. The impact of roadside technical inspections on transport and logistics systems in the Slovak Republic. Transp. Probl. 2022, 17, 61–73. [Google Scholar] [CrossRef]
- Kalmakov, V.A.; Andreev, A.A.; Martyanov, A.S. Remaining Vehicles Useful Lifetime Estimation Based on Operation Conditions Measurement. Procedia Eng. 2017, 206, 1716–1721. [Google Scholar] [CrossRef]
- Hudec, J.; Šarkan, B.; Cződörová, R. Examination of the results of the vehicles technical inspections in relation to the average age of vehicles in selected EU states. Transp. Res. Procedia 2021, 55, 2–9. [Google Scholar] [CrossRef]
- Bril, J.; Łukasik, Z. Diagnostyka pojazdów samochodowych. Autobusy 2013, 3, 203–211. (In Polish) [Google Scholar]
- Wituszyński, K.P.; Jakubowski, W. Analiza stanu technicznego pojazdów samochodowych podlegających kontrolnym badaniom technicznym na Stacjach Kontroli Pojazdów w rejonie podlaskim. Archiwum Motoryzacji 2008, 1, 19–32. [Google Scholar]
- Kozłowski, E.; Borucka, A.; Szymczak, T.; Świderski, A.; Gil, L. Predicting the Fatigue Life of a Ball Joint. Transp. Telecommun. 2021, 22, 453–460. [Google Scholar]
- Malinowski, A.; Taryma, S. Badania Techniczne Pojazdów Zabytkowych w Stacjach Kontroli Pojazdów. Autobusy 2012, 5, 284–289. [Google Scholar]
- Malinowski, A.; Szczepańska, P.; Mioduszewski, P.; Taryma, S. Pomiary skuteczności hamowania w stacjach kontroli pojazdów. Eksploatacja Testy 2019, 20, 39–41. [Google Scholar]
- Karpievich, Y.D.; Bakhanovich, A.G.; Bondarenko, I.I. On-Board Monitoring of Technical State for Power Units of Wheeled and Tracked Vehicles. Sci. Tech. 2016, 15, 427–434. [Google Scholar] [CrossRef][Green Version]
- Filipczyk, J.; Kutrzyk-Nykiel, A. The Relation Between the Technical State and the Exaust Gasses Emission for a Group of Particular Vegicle Age. J. KONES Powertrain Transp. 2011, 18, 105–111. [Google Scholar]
- Filipczyk, J.; Madej, H. The Application of on-board diagnostics systems for assessing the technical state of automotive vehicles. J. KONES Powertrain Transp. 2010, 17, 99–104. [Google Scholar]
- Zhang, F.; Wang, Y.; Hu, J.; Yin, G.; Chen, S.; Zhang, H.; Zhou, D. A Novel Comprehensive Scheme for Vehicle State Estimation Using Dual Extended H-Infinity Kalman Filter. Electronics 2021, 10, 1526. [Google Scholar] [CrossRef]
- Dobromirov, V.; Dotsenko, S.; Verstov, V.; Volkov, S. Methods of Examining Vehicle Electronic Systems in the Course of Automotive Forensic Expert Examinations. Transp. Res. Procedia 2017, 20, 143–150. [Google Scholar] [CrossRef]
- Available online: https://www.heka.warszawa.pl/linia-diagnostyczna-heka-bolid.html (accessed on 26 December 2023).
- Glowinski, S.; Bryndal, A.; Grochulska, A. Spinal pain in physiotherapists—Prevalence and risk factors. PeerJ 2021, 9, e11715. [Google Scholar] [CrossRef] [PubMed]
- Available online: https://www.tuvsud.com/en/press-and-media/2022/november/tuev-report-2023-the-average-age-of-vehicles-on-the-road-is-now-over-10-years (accessed on 10 November 2023).
- Auto Serwis Wadowicka. Car Inspection—Why Is It So Important? Available online: https://twojmechanik.com/en/blog_1/car-inspection-why-is-it-so-important/ (accessed on 26 December 2023).
- Christensen, P.; Elvik, R. Effects on accidents of periodic motor vehicle inspection in Norway. Accid. Anal. Prev. 2007, 39, 47–52. [Google Scholar] [CrossRef] [PubMed]
- Elvik, R. What would a road safety policy fully consistent with safe system principles mean for road safety? Accid. Anal. Prev. 2023, 193, 107336. [Google Scholar] [CrossRef]
- Jasosiński, W. Periodic technical inspections of vehicles and road traffic safety with the number of road accidents involving fatalities. Maint. Relaibility 2014, 16, 105–111. [Google Scholar]
- Gorzelańczyk, P. Assessment of technical condition of means of transport moving around Great Poland and their impact on road safety. Tech. Sci. 2020, 23, 233–252. [Google Scholar] [CrossRef]
- Kołsut, B.; Stryjakiewicz, T.; Gadziński, J. Do Motorisation Statistics Reflect the Real Geography of Car Ownership in Poland? Quaest. Geogr. 2022, 41, 95–108. [Google Scholar] [CrossRef]
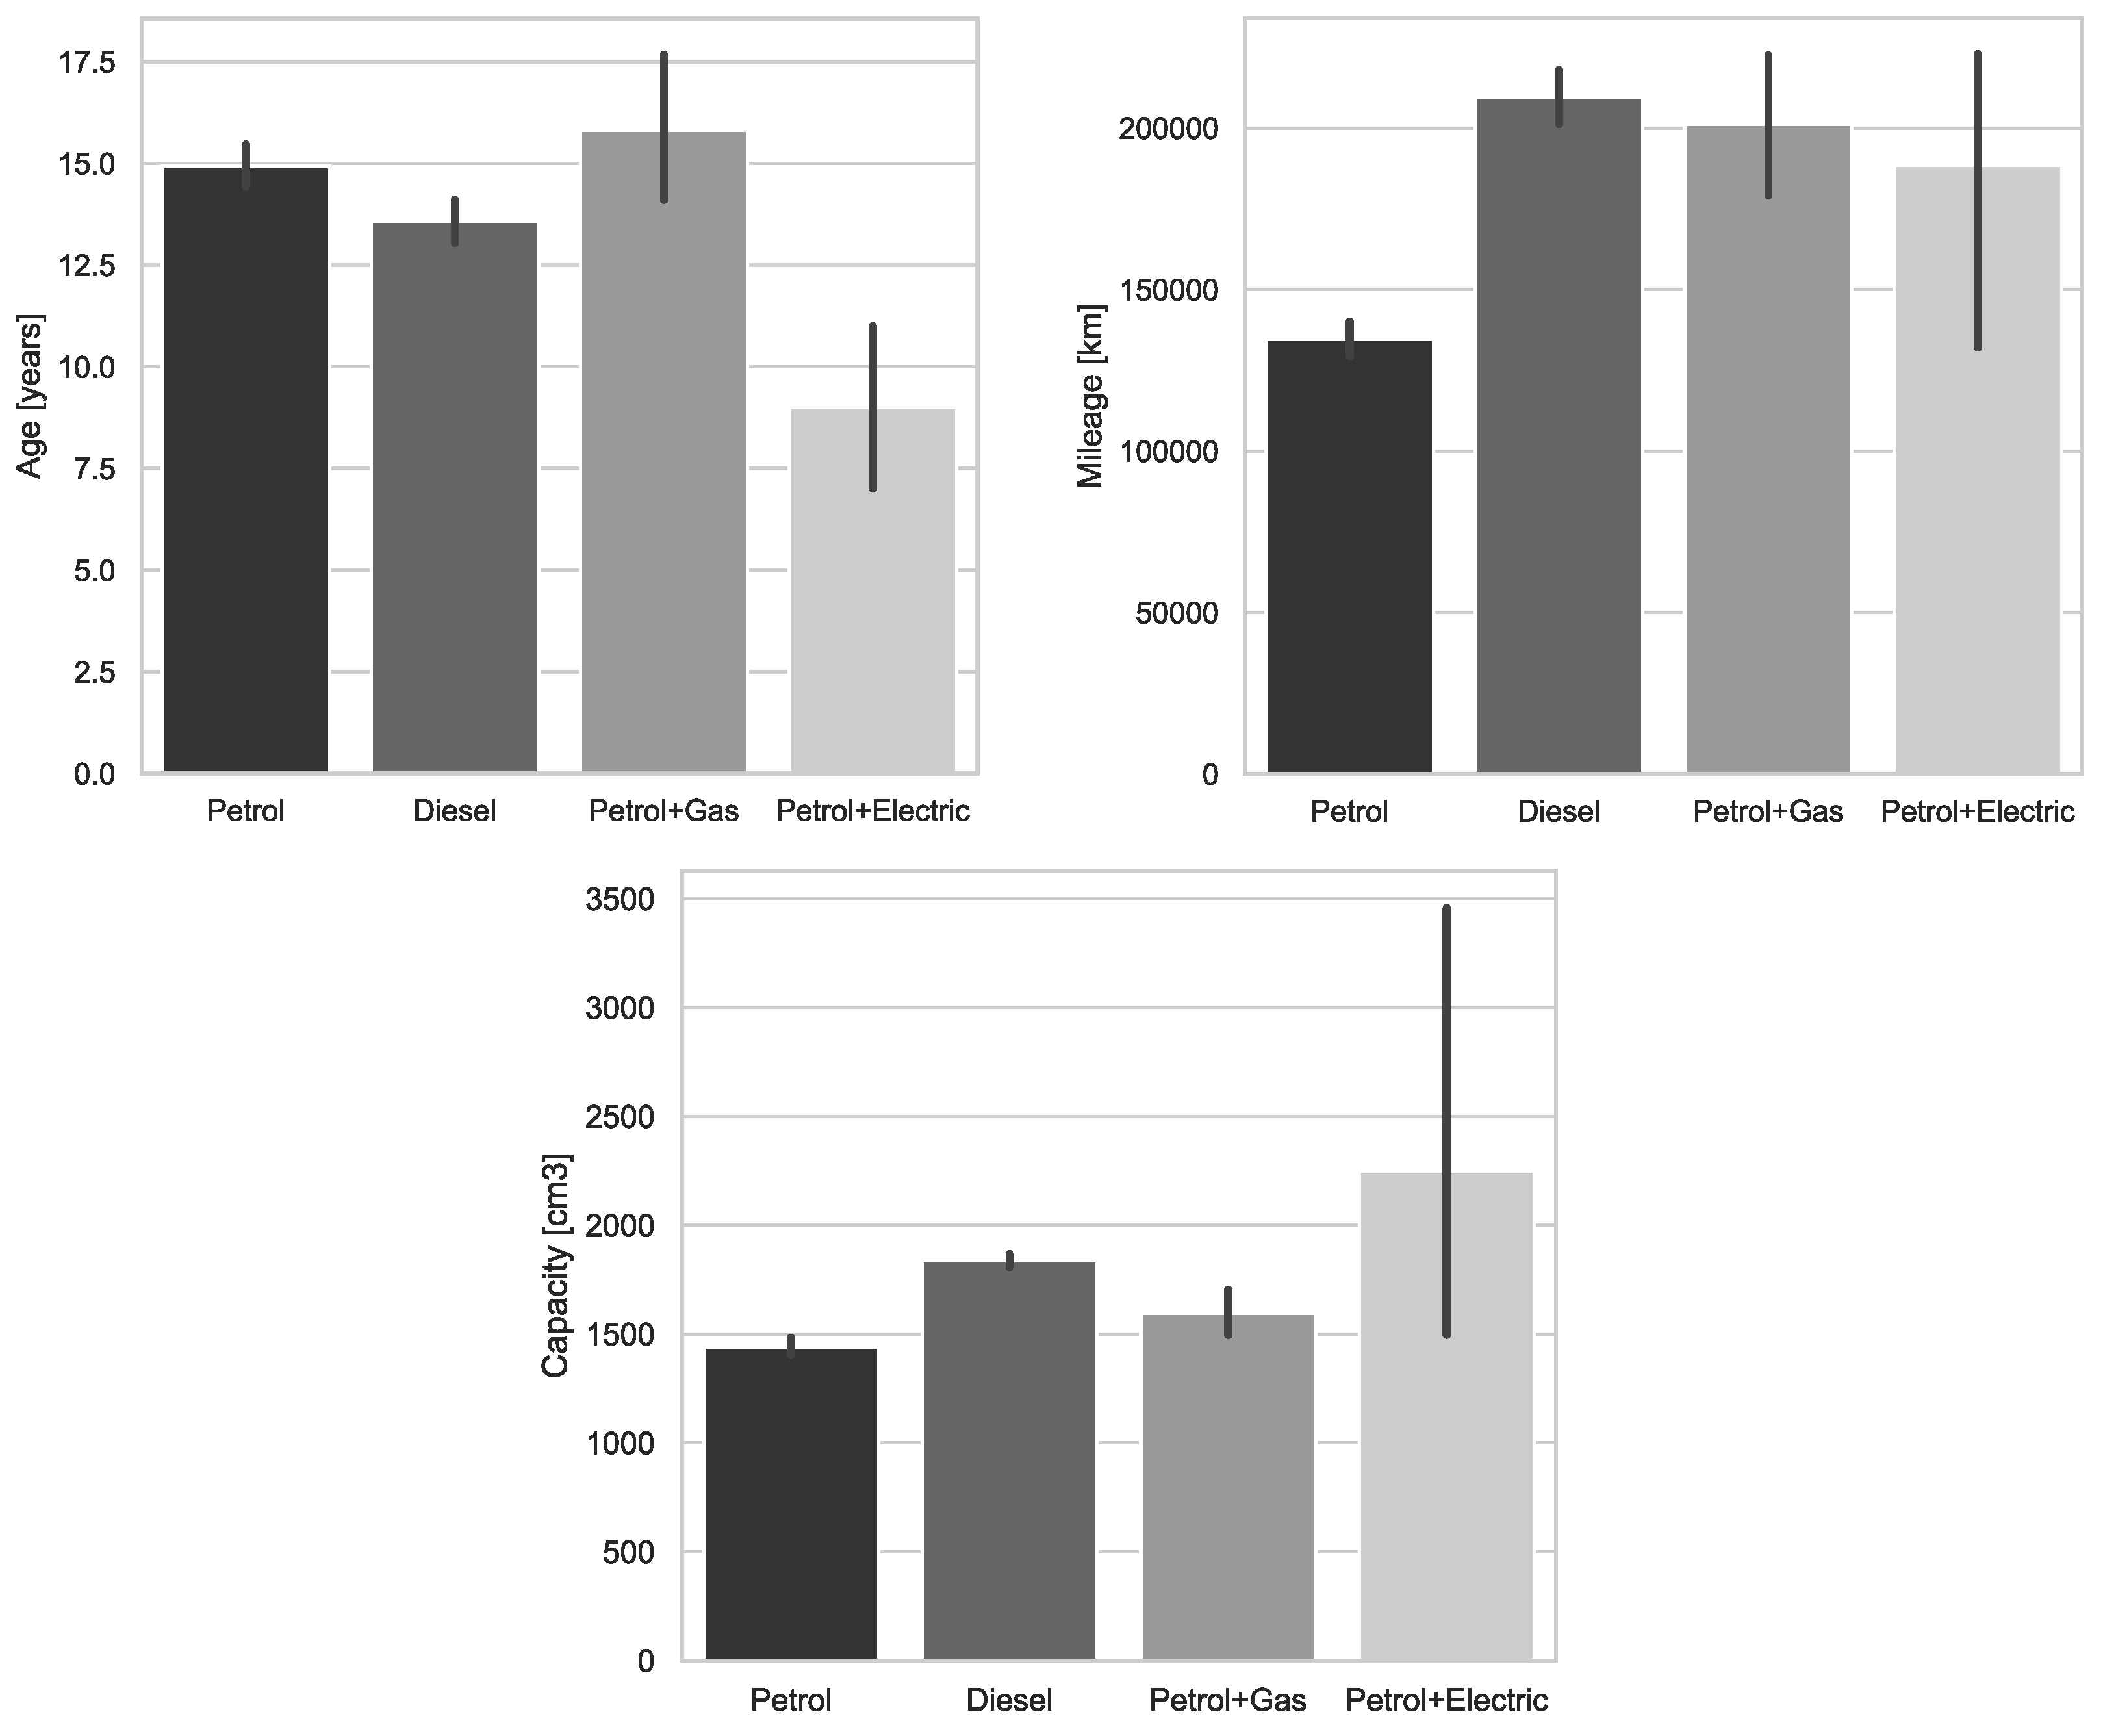
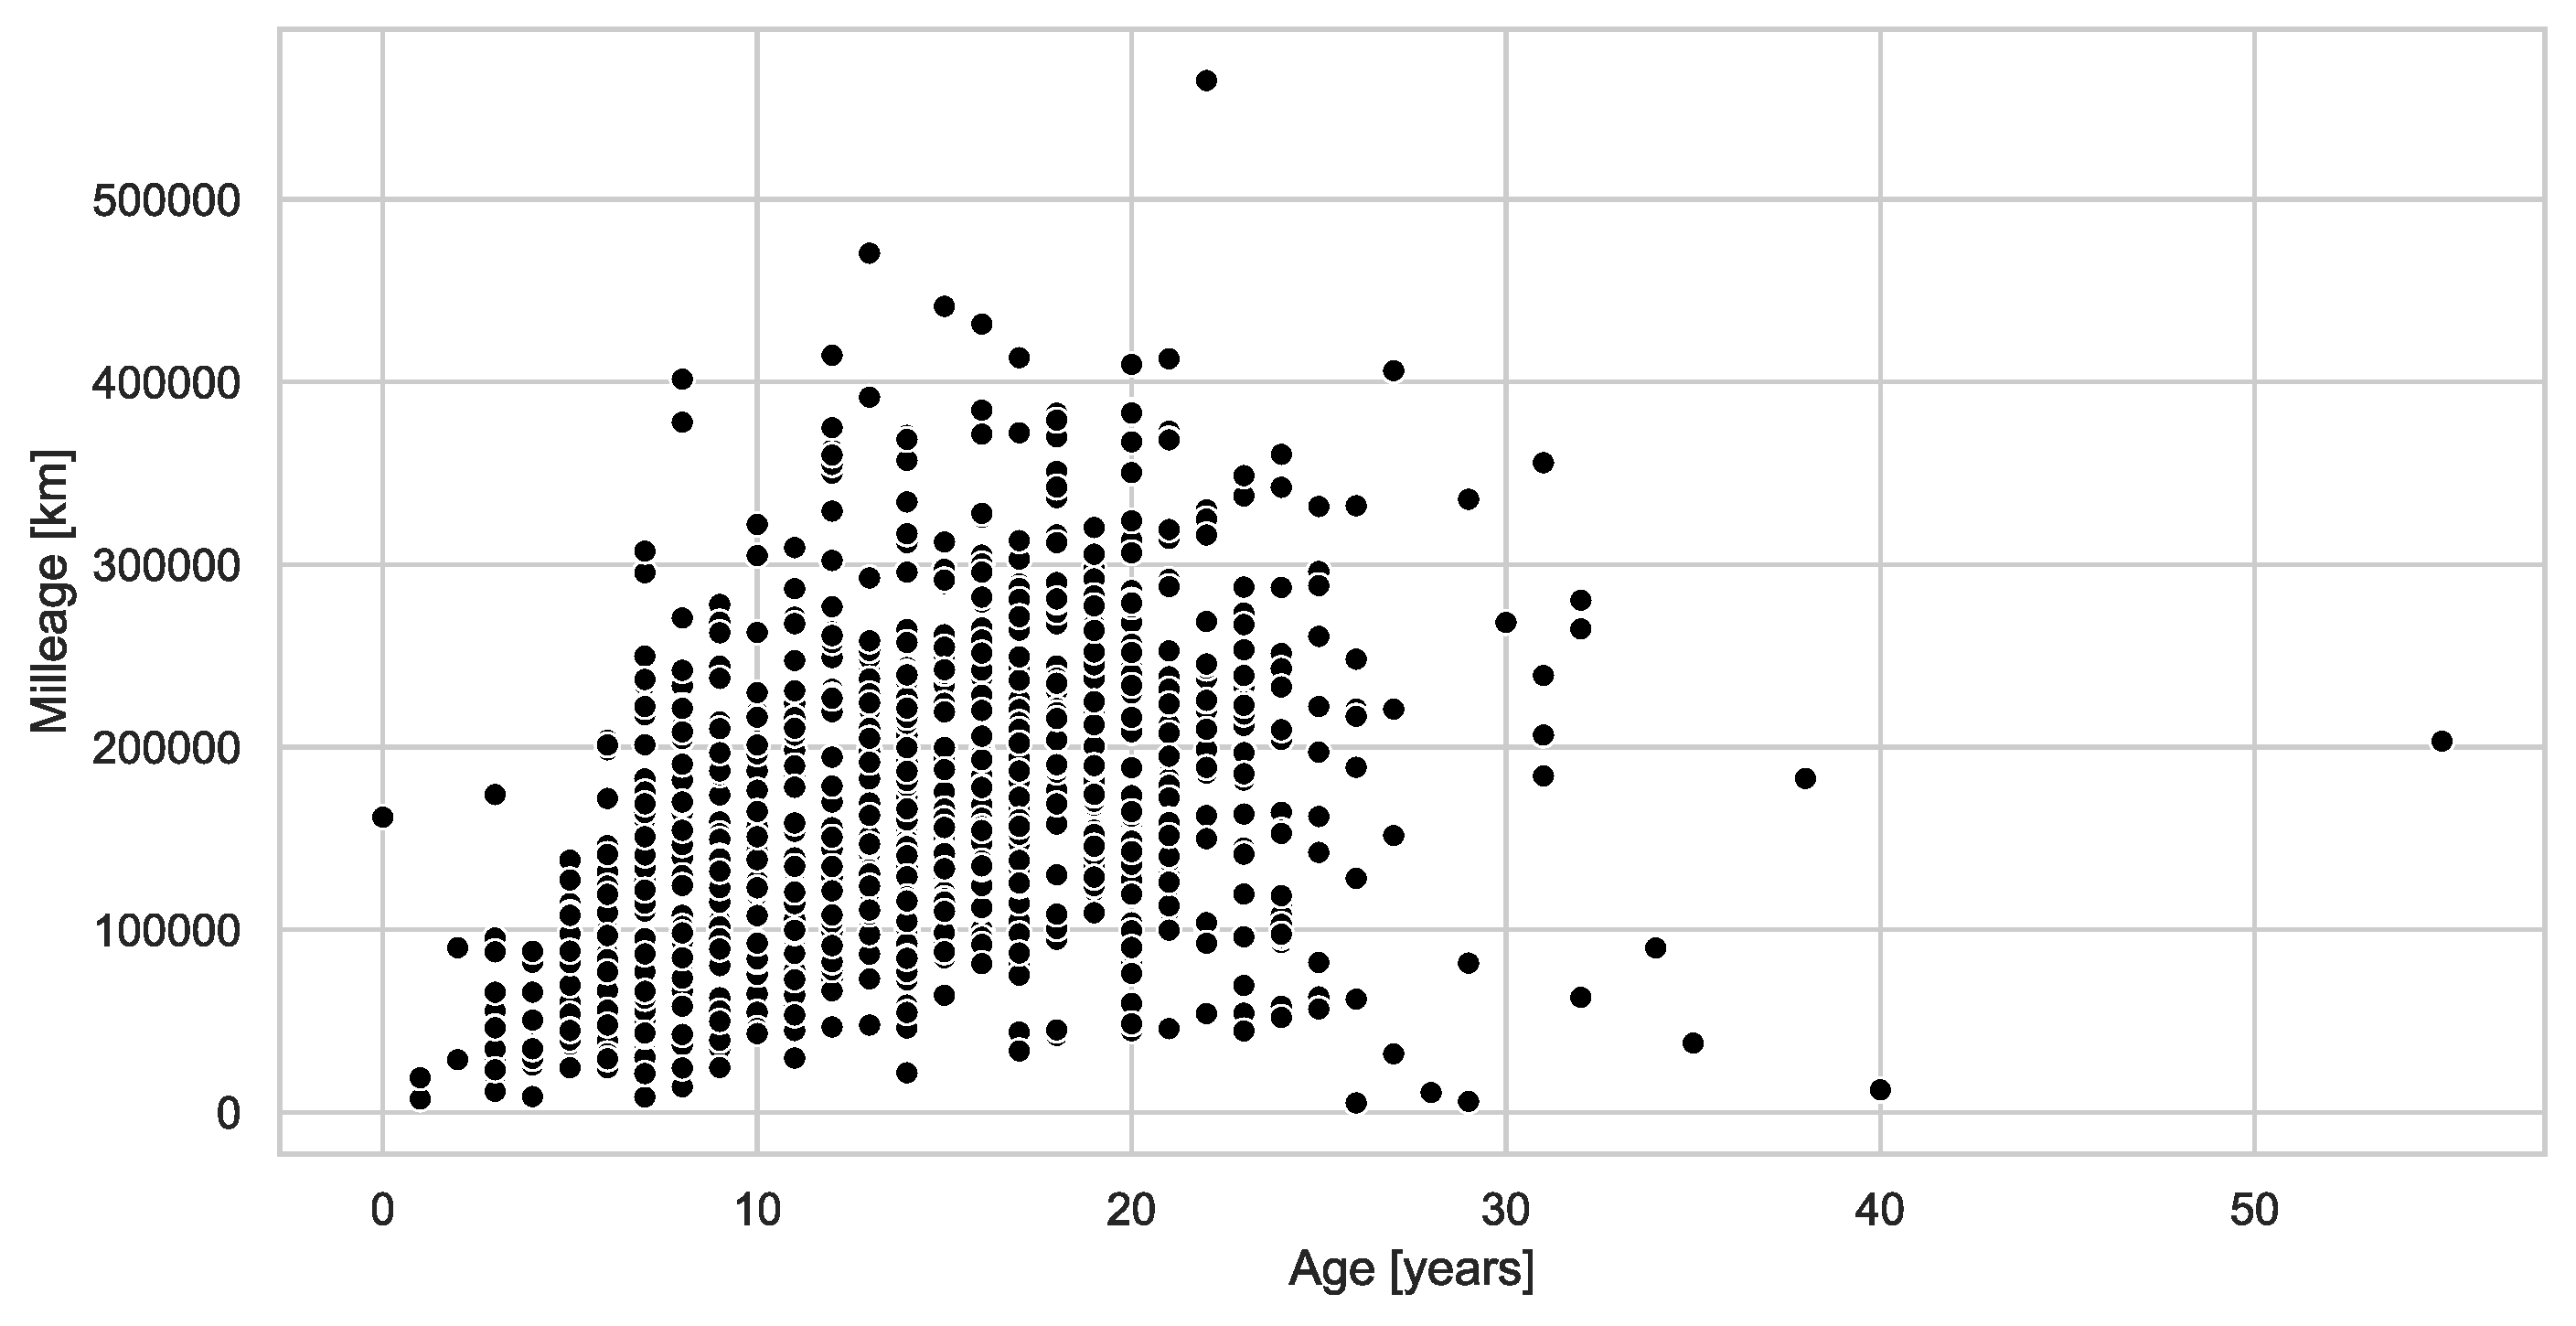



| Age (years) | 14.4 (6.17) 0.0–55.0 14.0 [14.04; 14.78] | Diesel (n = 428) | 13.6 (5.5) |
| 1.0–55.0 | |||
| 13.0 | |||
| [13.04; 14.09] | |||
| Fuel (n = 580) | 14.9 (6.5) | ||
| 1.0–38.0 | |||
| 15.0 | |||
| [14.39; 17.59] | |||
| Fuel + Gas (n = 56) | 15.8 (6.6) | ||
| 0.0–35.0 | |||
| 16.5 | |||
| [14.05; 17.59] | |||
| Hybrid (n = 3) | 9.0 (2.0) | ||
| 7.0–11.0 | |||
| 9.0 | |||
| [4.03; 13.97] | |||
| p-value | 0.0004 1 | ||
| Mileage (km) | 168,325 (85,307) 5128–565,101 160,594 [163,200; 173,449] | Diesel (n = 428) | 209,631 (86,200) |
| 7312–565,101 | |||
| 208,058 | |||
| [201,441; 217,820] | |||
| Fuel (n = 580) | 134,567 (69,046) | ||
| 5128–413,292 | |||
| 129,819 | |||
| [128,936; 140,198] | |||
| Fuel + Gas (n = 56) | 201,200 (81,654) | ||
| 30,905–406,234 | |||
| 199,738 | |||
| [179,333; 223,067] | |||
| Hybrid (n = 3) | 188,442 (49,264) | ||
| 132,022–222,942 | |||
| 210,362 | |||
| [66,063; 310,821] | |||
| p-value | 0.0000 1 | ||
| Capacity (cm3) | 1610.0 (451.2) 652.0–6208.0 1590.0 [1582.9; 1637.1] | Diesel (n = 428) | 1836.2 (337.3) |
| 1199.0–3222.0 | |||
| 1896.0 | |||
| [1804.2; 1868.3] | |||
| Fuel (n = 580) | 1441.0 (450.0) | ||
| 652.0–6208.0 | |||
| 1390.0 | |||
| [1404.3; 1478.7] | |||
| Fuel + Gas (n = 56) | 1596.5 (411.8) | ||
| 963.0–2976.0 | |||
| 1593.0 | |||
| [1486.3; 1706.8] | |||
| Hybrid (n = 3) | 2250.3 (1054.9) | ||
| 1497.0–3456.0 | |||
| 1798 | |||
| [0.0; 4870.9] | |||
| p-value | 0.0000 1 |
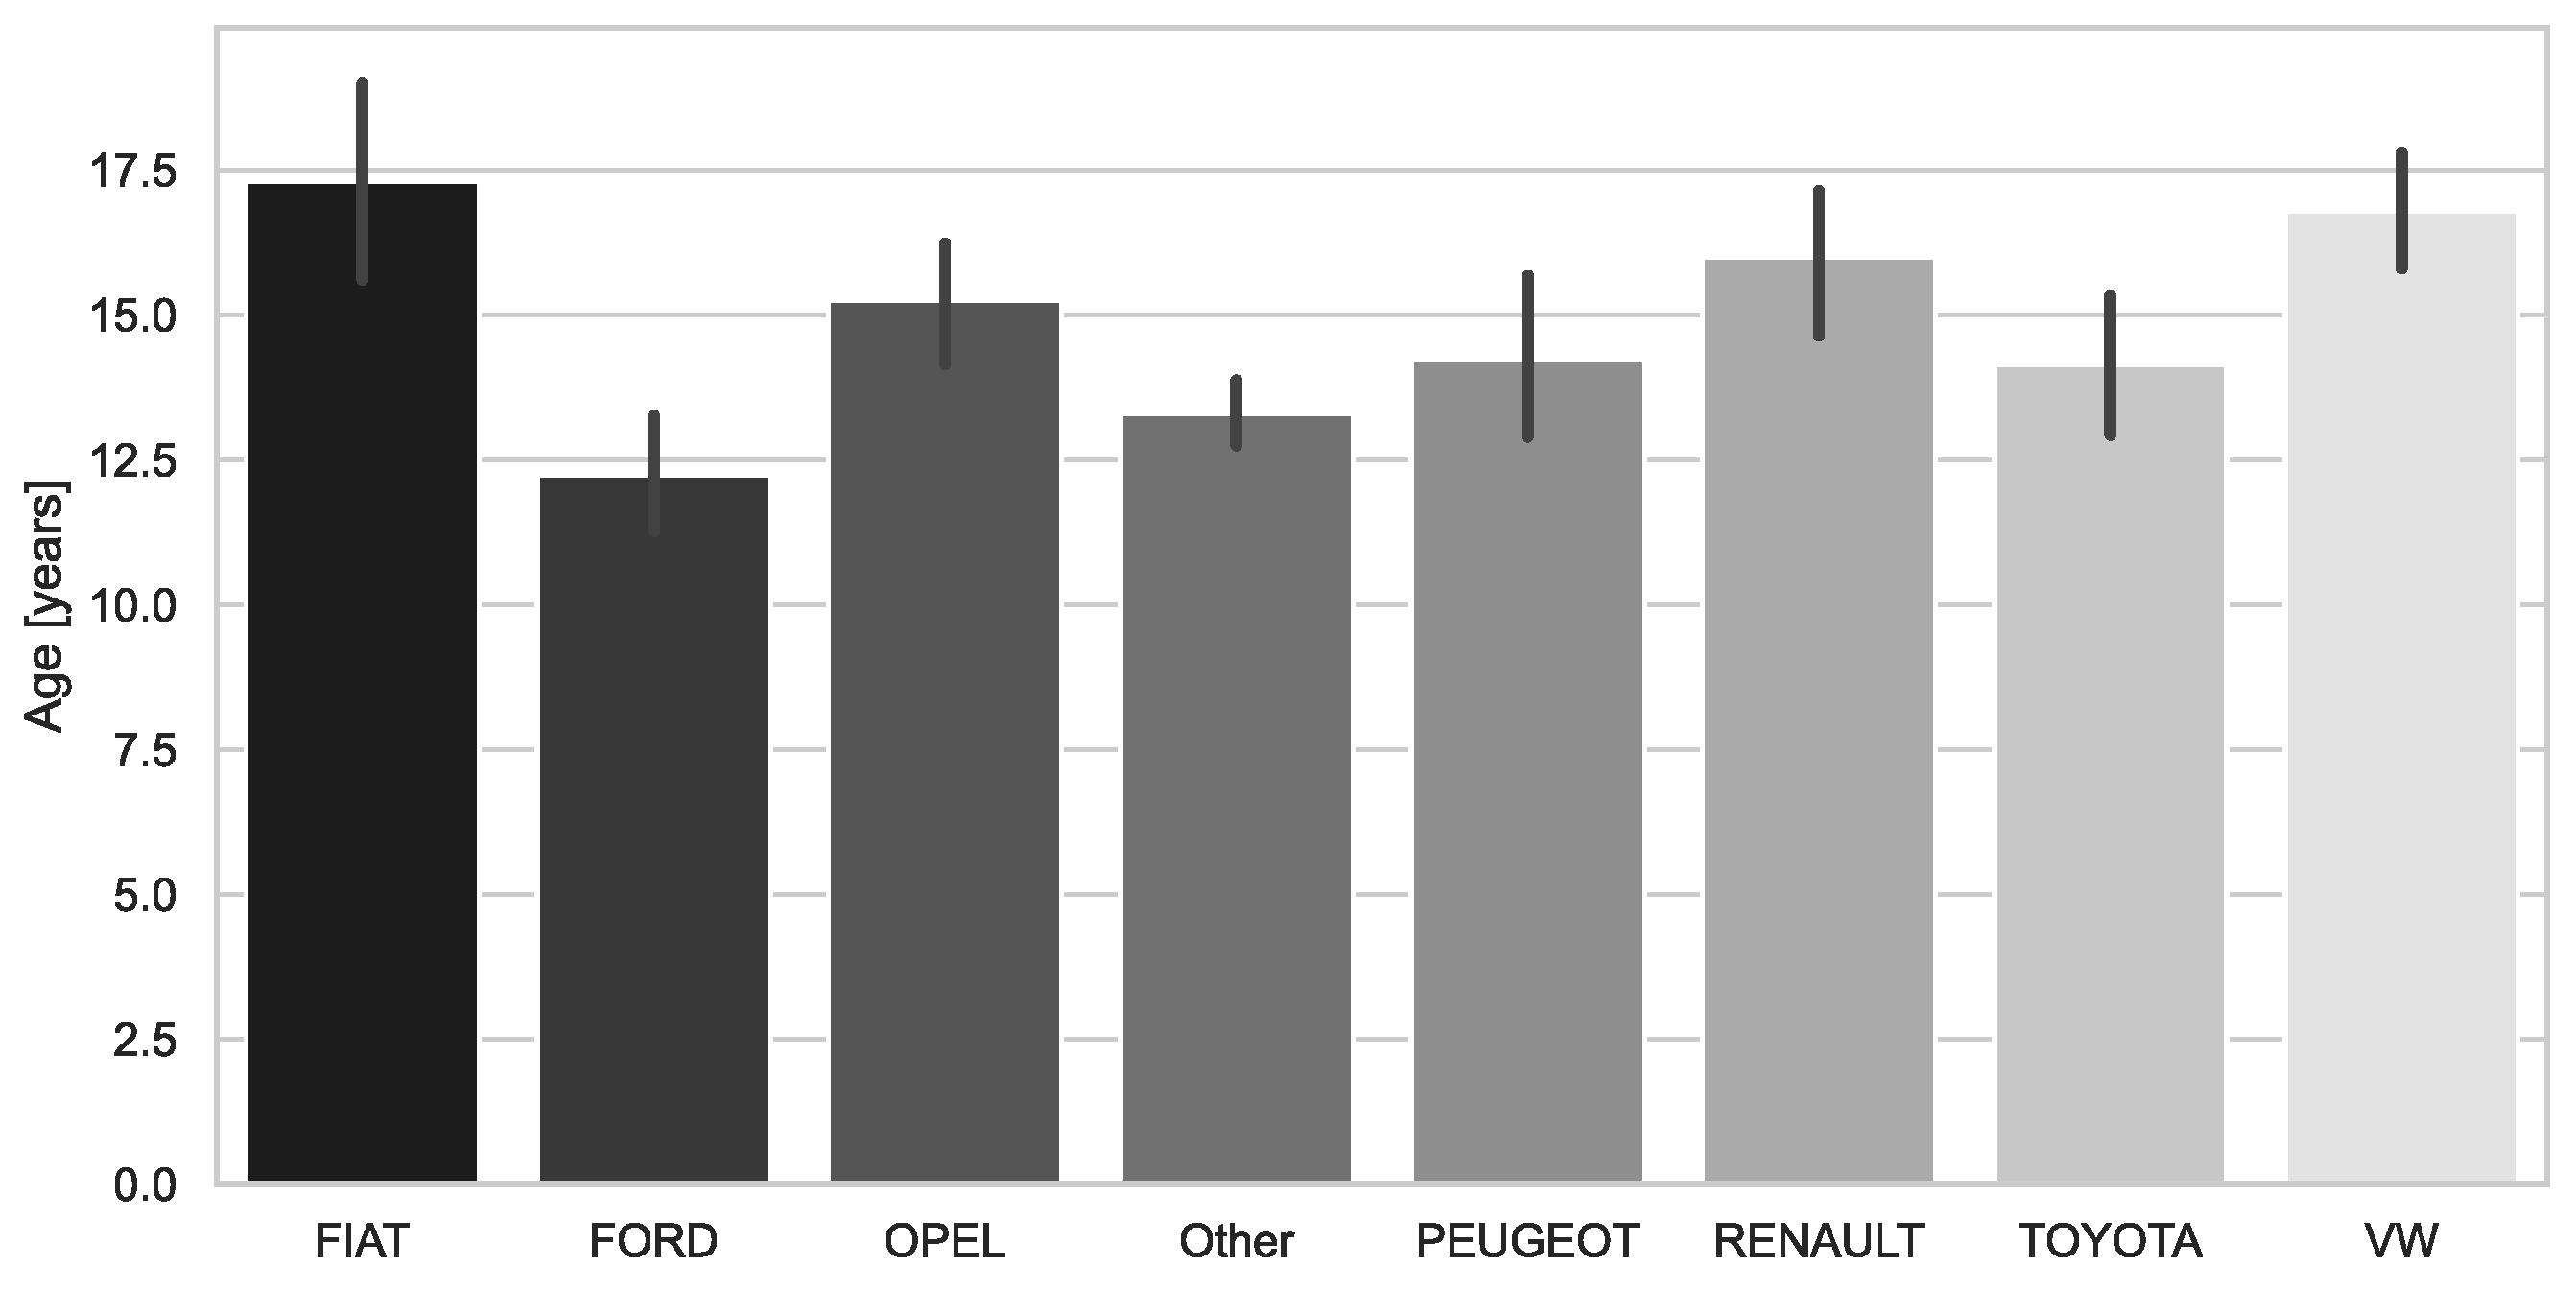
| Brand | Age [Years] | Mileage [km] | Capacity [cm3] |
|---|---|---|---|
| VW (n = 158) | 16.8 (6.8) | 217,256 (95,501) | 1692 (319) |
| 3–55 | 10,809–565,101 | 999–2967 | |
| 16.5 | 219,074 | 1714 | |
| [15.7; 17.8] | [202,250; 232,263] | [1642; 1742] | |
| Opel (n = 115) | 15.2 (6.5) | 166,360 (81,828) | 1557 (314) |
| 3–31 | 19,886–391,640 | 973–2231 | |
| 15 | 176,979 | 1598 | |
| [14.2; 16.3] | [151,243; 181,476] | [1498; 1615] | |
| Ford (n = 88) | 12.2 (5.1) | 175,121 (80,281) | 1650 (472) |
| 3–24 | 8367–470,520 | 998–4951 | |
| 12 | 172,594 | 1560 | |
| [11.2; 13.3] | [158,111; 192,131] | [1550; 1750] | |
| Toyota (n = 72) | 14.1 (6.7) | 142,028 (72,691) | 1429 (347) |
| 3–25 | 23,293–382,998 | 998–2231 | |
| 15 | 135,270 | 1329 | |
| [12.8; 15.5] | [124,947; 159,110] | [1347; 1510] | |
| Renault (n = 68) | 16.0 (6.1) | 177,632 (73,728) | 1434 (256) |
| 0–24 | 24,285–351,044 | 898–1998 | |
| 17 | 179,956 | 1461 | |
| [14.8; 17.2] | [159,786; 195,478] | [1372; 1496] | |
| Peugeot (n = 59) | 14.2 (6.5) | 185,302 (91,935) | 1567 (299) |
| 3–27 | 11,506–441,427 | 998–1997 | |
| 15 | 178,678 | 1560 | |
| [12.8; 15.6] | [161,344; 209,261] | [1468; 1624] | |
| Fiat (n = 53) (F = 40; D = 10, F + G = 3) | 17.3 (8.3) | 127,448 (64,778) | 1205 (282) |
| 2–29 | 8584–287,623 | 652–1997 | |
| 19 | 121,360 | 1108 | |
| [15.4; 19.2] | [109,593; 145,303] | [1127; 1283] | |
| Other (n = 454) | 13.3 (6.1) | 155,819 (80,544) | 1698 (535) |
| 1–38 | 5128–409,635 | 652–6208 | |
| 13 | 146,017 | 1595 | |
| [12.7; 13.9] | [148,391; 163,248] | [1649; 1747] | |
| p-value | 0.0000 1 | 0.0000 1 | 0.0000 1 |
| Dependent: Age (Years) | Independent Variable (Grouping): Brand Kruskal–Wallis Test: H (7, N = 1067) = 73.64346, p = 0.0000 | |||||||
|---|---|---|---|---|---|---|---|---|
| Peugeot R: 534.21 | VW R: 641.71 | Toyota R: 532.22 | Other R: 472.10 | Fiat R: 692.42 | Ford R: 423.02 | Renault R: 636.74 | Opel R: 582.56 | |
| Peugeot | 0.6224 | 1.0000 | 1.0000 | 0.1869 | 0.8959 | 1.0000 | 1.0000 | |
| VW | 0.6224 | 0.3488 | p < 0.0001 | 1.0000 | p < 0.0001 | 1.0000 | 1.0000 | |
| Toyota | 1.0000 | 0.3488 | 1.0000 | 0.1141 | 0.7211 | 1.0000 | 1.0000 | |
| Other | 1.0000 | p < 0.0001 | 1.0000 | p < 0.0001 | 1.0000 | 0.0011 | 0.0167 | |
| Fiat | 0.1869 | 1.0000 | 0.1141 | p < 0.0001 | p < 0.0001 | 1.0000 | 0.8898 | |
| Ford | 0.8959 | p < 0.0001 | 0.7211 | 1.0000 | p < 0.0001 | 0.0005 | 0.0072 | |
| Renault | 1.0000 | 1.0000 | 1.0000 | 0.0011 | 1.0000 | 0.0005 | 1.0000 | |
| Opel | 1.0000 | 1.0000 | 1.0000 | 0.0167 | 0.8998 | 0.0072 | 1.0000 | |
| Dependent: Milleage (km) | Independent Variable(Grouping): Brand Kruskal–Wallis Test: H (7, N = 1067) = 77.82803, p = 0.0000 | |||||||
| Fiat R: 381.15 | Ford R: 567.00 | Opel R: 540.26 | Other R: 488.20 | Peugeot R: 585.63 | Renault R: 582.10 | Toyota R: 441.04 | VW R: 696.32 | |
| Fiat | 0.0146 | 0.0524 | 0.4678 | 0.0127 | 0.0104 | 1.0000 | p < 0.0001 | |
| Ford | 0.0146 | 1.0000 | 0.7877 | 1.0000 | 1.0000 | 0.2830 | 0.0449 | |
| Opel | 0.0524 | 1.0000 | 1.0000 | 1.0000 | 1.0000 | 0.9006 | 0.0010 | |
| Other | 0.4678 | 0.7877 | 1.0000 | 0.6255 | 0.5350 | 1.0000 | p < 0.0001 | |
| Peugeot | 0.0127 | 1.0000 | 1.0000 | 0.6255 | 1.0000 | 0.2112 | 0.5195 | |
| Renault | 0.0104 | 1.0000 | 1.0000 | 0.5350 | 1.0000 | 0.1901 | 0.2968 | |
| Toyota | 1.0000 | 0.2830 | 0.9006 | 1.0000 | 0.2112 | 0.1901 | p < 0.0001 | |
| VW | p < 0.0001 | 0.0449 | 0.0010 | p < 0.0001 | 0.5195 | 0.2968 | p < 0.0001 | |
| Dependent: Capacity (cm3) | Independent Variable (Grouping): Brand Kruskal–Wallis Test: H (7, N = 1067) = 102.8552, p = 0.000 | |||||||
| Fiat R: 212.29 | Ford R: 571.44 | Opel R: 523.33 | Other R: 581.33 | Peugeot R: 502.59 | Renault R: 419.65 | Toyota R: 405.17 | VW R: 612.46 | |
| Fiat | p < 0.0001 | p < 0.0001 | p < 0.0001 | p < 0.0001 | 0.0067 | 0.0152 | p < 0.0001 | |
| Ford | p < 0.0001 | 1.0000 | 1.0000 | 1.0000 | 0.0640 | 0.0192 | 1.0000 | |
| Opel | p < 0.0001 | 1.0000 | 1.0000 | 1.0000 | 0.7799 | 0.3002 | 0.5123 | |
| Other | p < 0.0001 | 1.0000 | 1.0000 | 1.0000 | 0.0015 | 0.0002 | 1.0000 | |
| Peugeot | p < 0.0001 | 1.0000 | 1.0000 | 1.0000 | 1.0000 | 1.0000 | 0.5446 | |
| Renault | 0.0067 | 0.0640 | 0.7799 | 0.0015 | 1.0000 | 1.0000 | 0.0004 | |
| Toyota | 0.0152 | 0.0192 | 0.3002 | 0.0002 | 1.0000 | 1.0000 | 0.0001 | |
| VW | p < 0.0001 | 1.0000 | 0.5123 | 1.0000 | 0.5446 | 0.0004 | 0.0001 | |
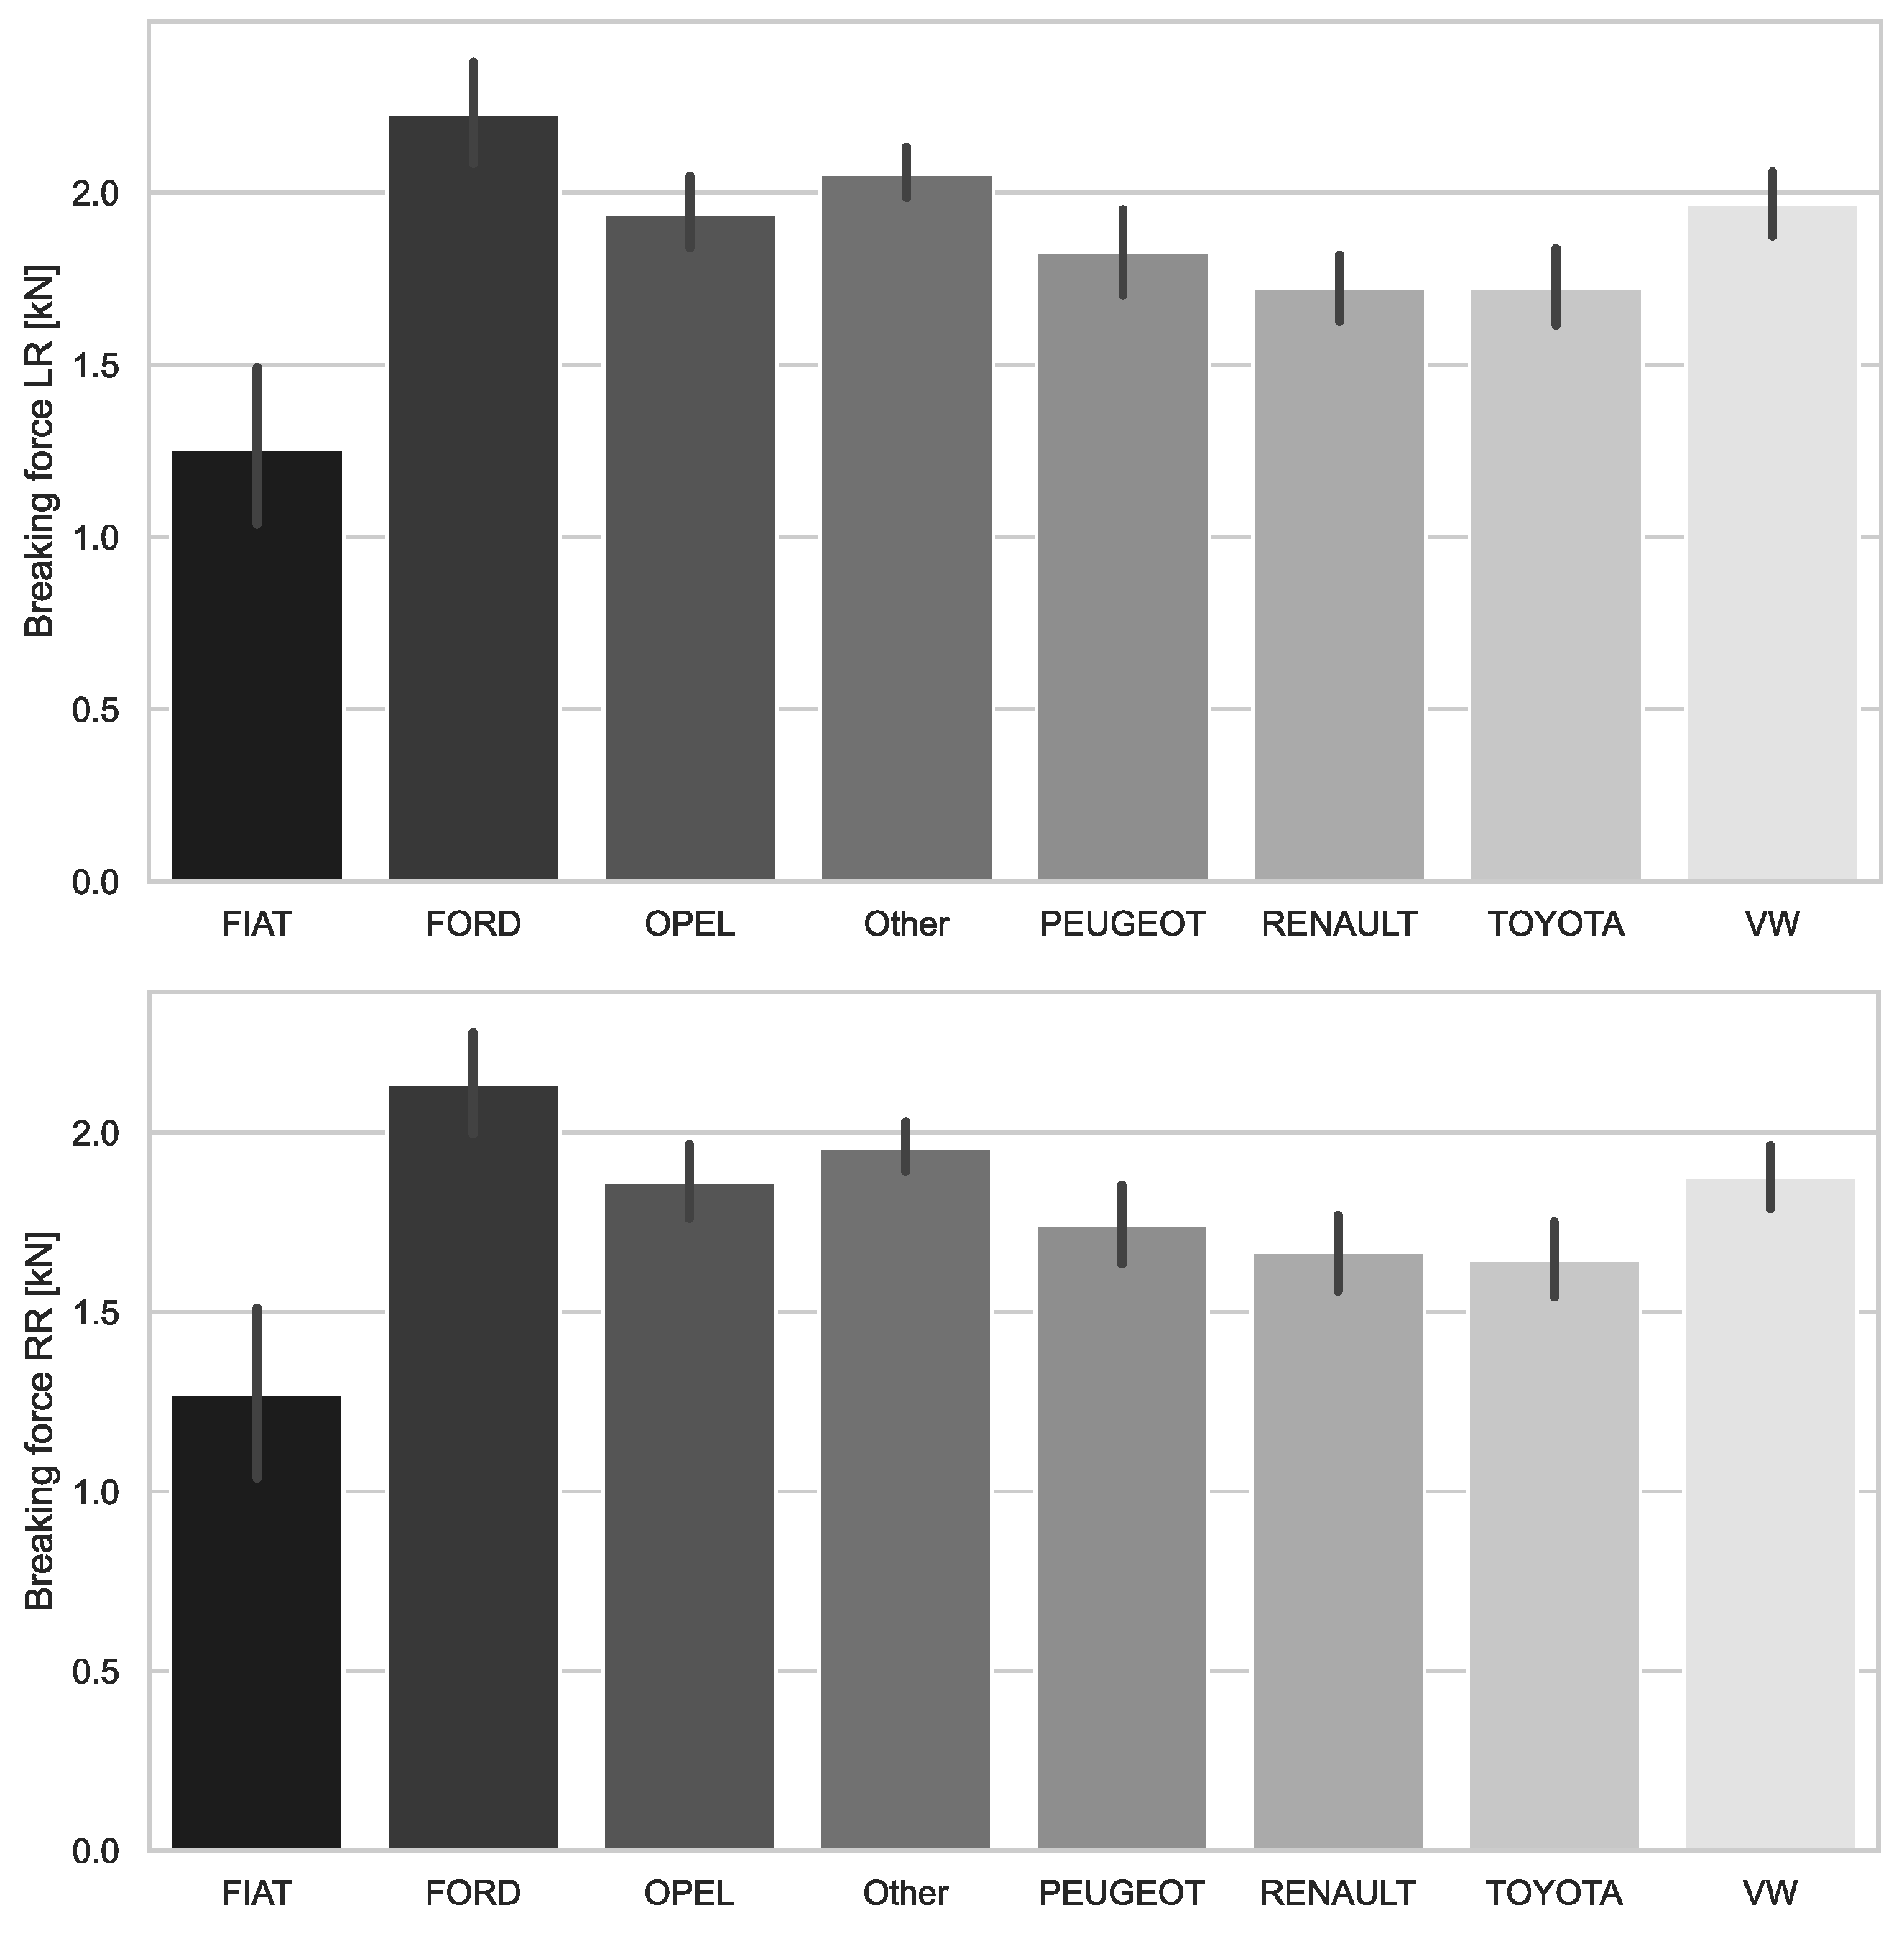
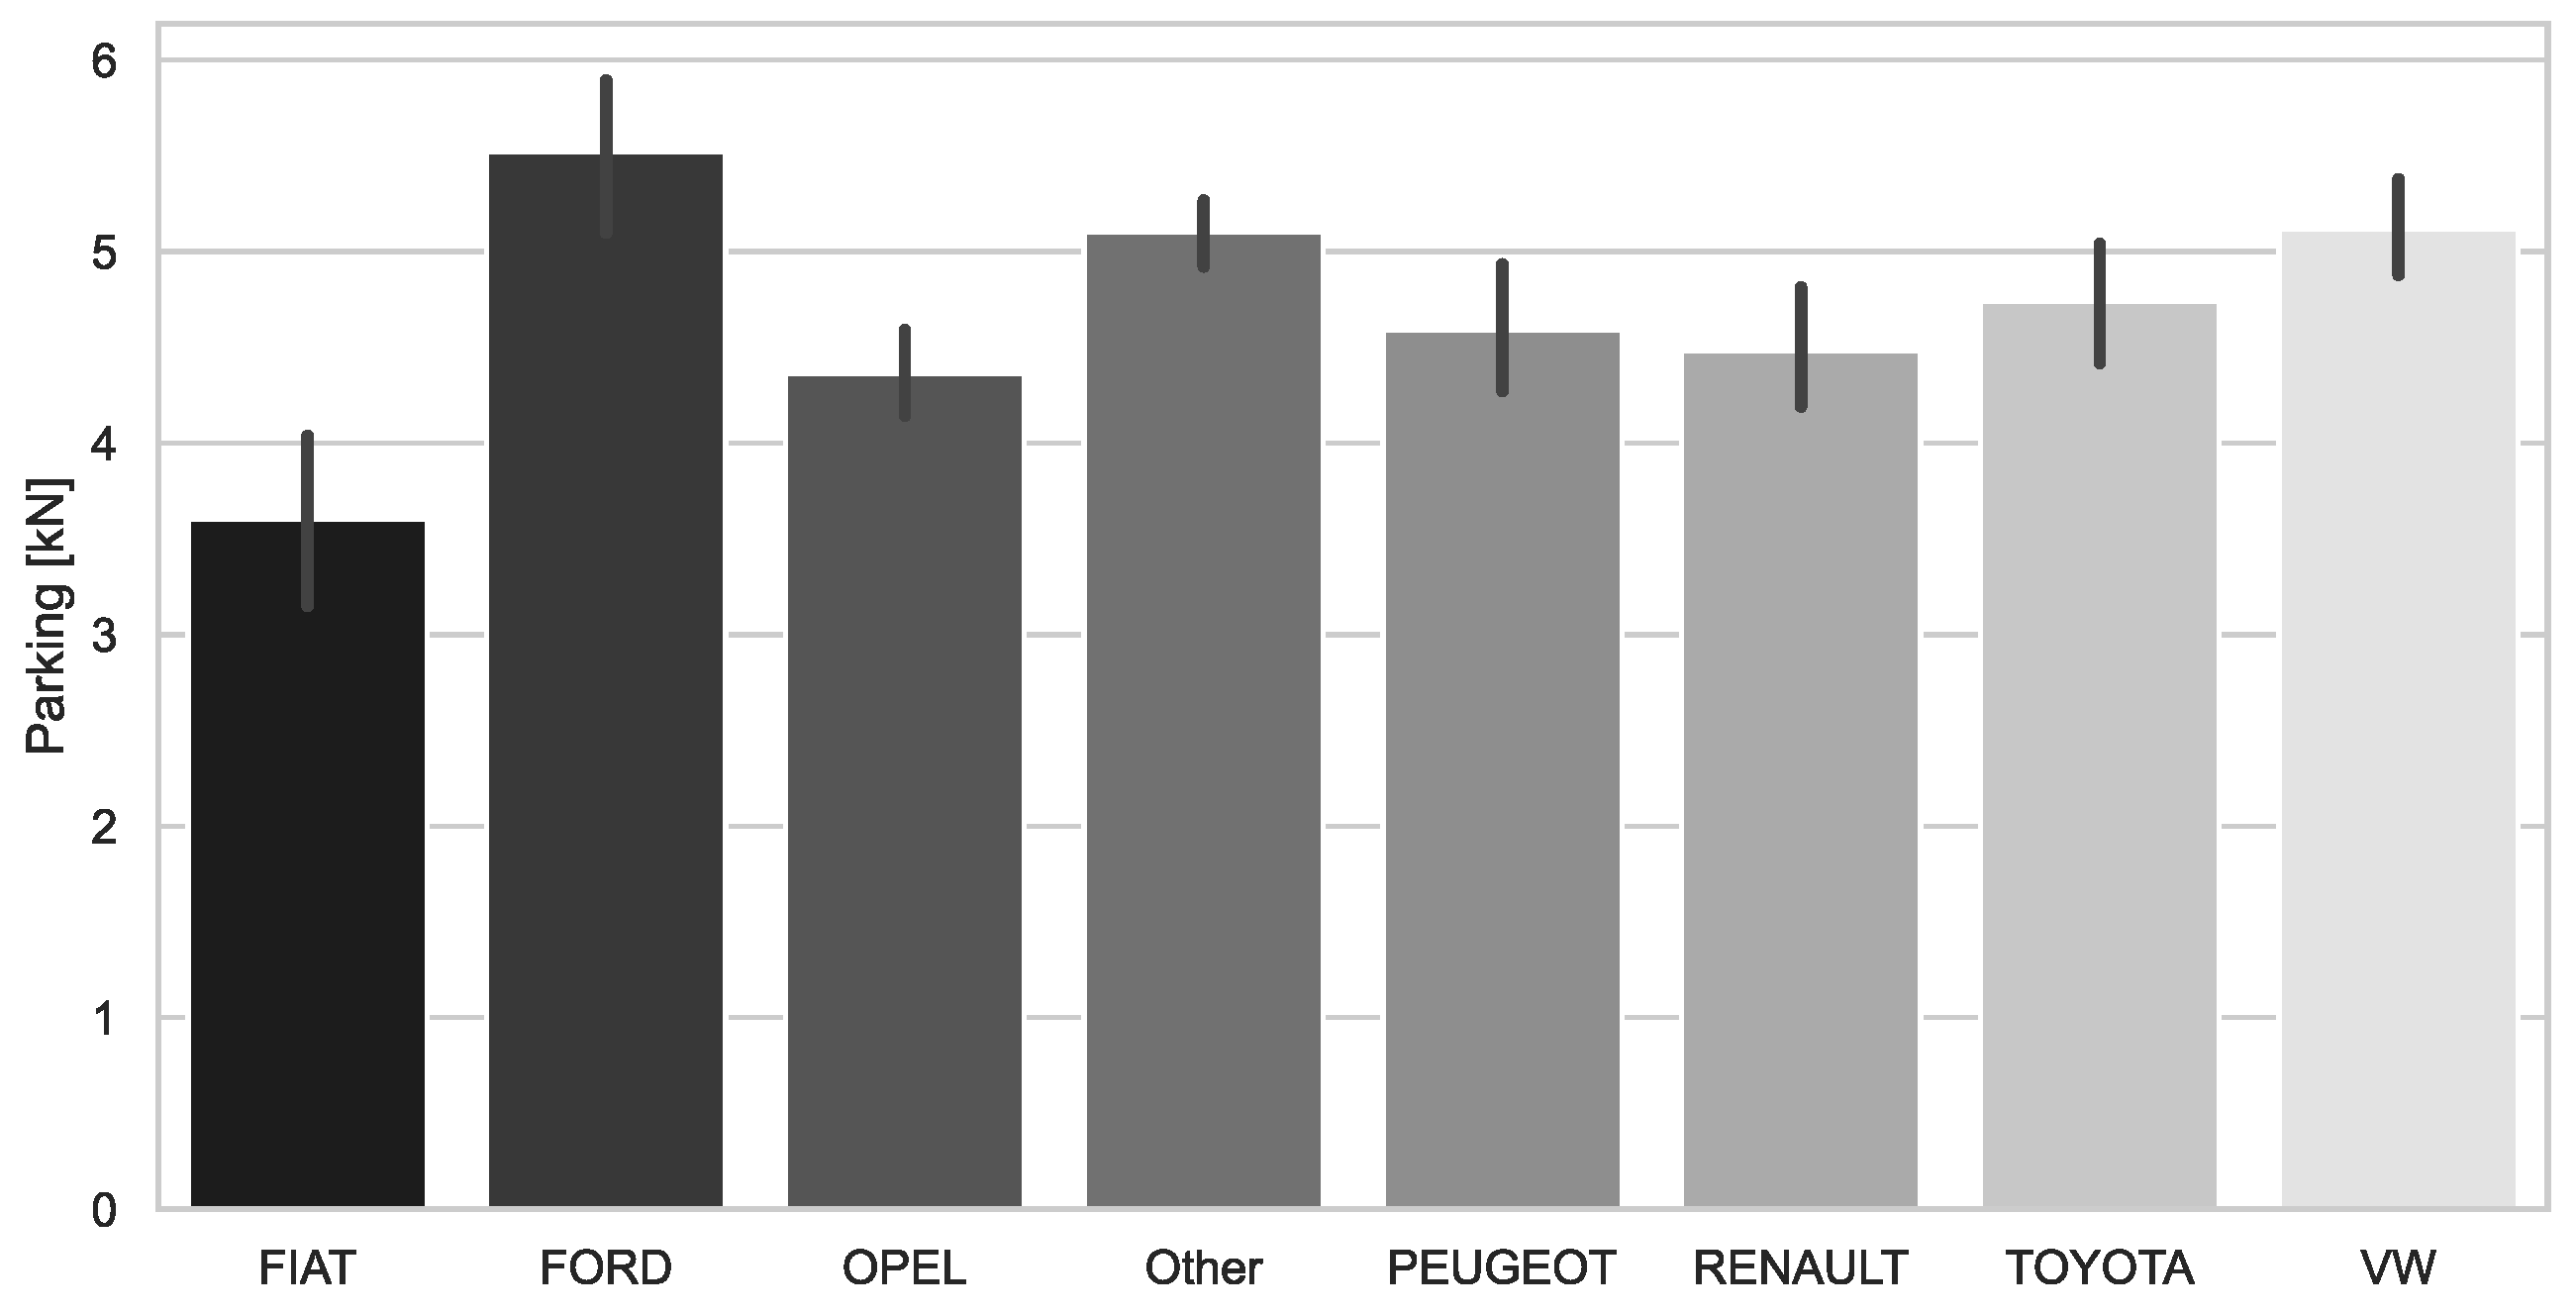
| Brand | Breaking Force LF (kN) | Breaking Force RF (kN) | p-Value | Breaking Force LR (kN) | Breaking Force RR (kN) | p-Value | Breaking Force Parking (kN) |
|---|---|---|---|---|---|---|---|
| VW (n = 158) | 6.2 (1.4) | 6.2 (1.4) | 0.4812 3 | 2.0 (0.6) | 1.9 (0.6) | 0.7681 3 | 5.1 (1.3) |
| 2.5–11.4 | 2.5–10.0 | 0.5–4.0 | 0.4–4.0 | 2.0–10.0 | |||
| 6.0 | 6.1 | 2.0 | 1.9 | 5.0 | |||
| [6.0; 6.4] | [6.0; 6.4] | [1.9; 2.1] | [1.8; 2.0] | [4.9; 5.4] | |||
| Opel (n = 115) | 6.3 (1.6) | 6.3 (1.5) | 0.2696 3 | 1.9 (0.6) | 1.9 (0.5) | 0.7708 3 | 4.4 (1.3) |
| 3.1–11.4 | 3.3–11.4 | 0.6–4.0 | 0.6–3.3 | 0.0–7.9 | |||
| 6.1 | 6.2 | 1.9 | 1.8 | 4.5 | |||
| [6.0; 6.6] | [6.0; 6.6] | [1.8; 2.0] | [1.8; 2.0] | [4.1; 4.6] | |||
| Ford (n = 88) | 6.8 (1.8) | 6.8 (1.8) | 0.9634 3 | 2.2 (0.7) | 2.1 (0.7) | 0.9611 3 | 5.5 (1.9) |
| 2.7–11.4 | 2.6–11.4 | 0.6–5.6 | 0.5–5.6 | 1.4–11.0 | |||
| 6.7 | 6.8 | 2.3 | 2.2 | 5.3 | |||
| [6.4; 7.1] | [6.4; 7.2] | [2.1; 2.4] | [2.0; 2.3] | [5.1; 5.9] | |||
| Toyota (n = 72) | 5.7 (1.6) | 5.7 (1.6) | 0.8105 3 | 1.7 (0.5) | 1.6 (0.5) | 0.9331 3 | 4.7 (1.4) |
| 3.0–10.0 | 3.0–10.0 | 0.5–3.3 | 0.5–3.3 | 2.7–8.7 | |||
| 5.0 | 5.4 | 1.7 | 1.6 | 6.0 | |||
| [5.3; 6.0] | [5.4; 6.1] | [1.6; 1.8] | [1.5; 1.8] | [4.4; 5.1] | |||
| Renault (n = 68) | 5.7 (1.5) | 5.7 (1.4) | 0.9601 3 | 1.7 (0.4) | 1.7 (0.4) | 0.9445 3 | 4.5 (1.3) |
| 3.4–9.8 | 3.3–9.4 | 0.9–2.8 | 0.8–2.9 | 1.2–8.7 | |||
| 5.4 | 5.4 | 1.7 | 1.6 | 4.5 | |||
| [5.3; 6.0] | [5.3; 6.0] | [1.6; 1.8] | [1.6; 1.8] | [4.2; 4.8] | |||
| Peugeot (n = 59) | 6.3 (1.5) | 6.2 (1.5) | 0.4658 2 | 1.8 (0.5) | 1.7 (0.4) | 0.9774 3 | 4.6 (1.3) |
| 3.7–10.0 | 3.3–10.0 | 0.4–3.0 | 0.7–3.2 | 1.2–8.8 | |||
| 6.0 | 5.9 | 1.8 | 1.8 | 4.6 | |||
| [5.9; 6.7] | [5.8; 6.6] | [1.7; 2.0] | [1.6; 1.9] | [4.2; 4.9] | |||
| Fiat (n = 53) | 5.2 (1.9) | 5.1 (2.0) | 0.8041 2 | 1.3 (0.8) | 1.3 (0.9) | 0.9195 3 | 3.6 (1.7) |
| 1.9–10.7 | 1.5–10.3 | 0.3–3.2 | 0.1–3.8 | 0.7–8.0 | |||
| 4.6 | 4.6 | 1.0 | 1.0 | 3.3 | |||
| [4.7; 5.7] | [4.5; 5.6] | [1.0; 1.5] | [1.0; 1.5] | [3.1; 4.1] | |||
| Other (n = 454) | 6.6 (1.7) | 6.6 (1.7) | 0.2894 3 | 2.1 (0.8) | 2.0 (0.8) | 0.6742 3 | 5.1 (1.8) |
| 1.8–11.4 | 2.1–11.4 | 0.3–6.4 | 0.4–6.4 | 1.0–10.0 | |||
| 6.5 | 6.4 | 1.9 | 1.8 | 4.8 | |||
| [6.4; 6.7] | [6.4; 6.8] | [2.0; 2.1] | [1.9; 2.0] | [4.9; 5.3] | |||
| p-value | 0.2294 1 | 0.5450 1 | --- | 0.0000 1 | 0.0000 1 | 0.0000 1 |
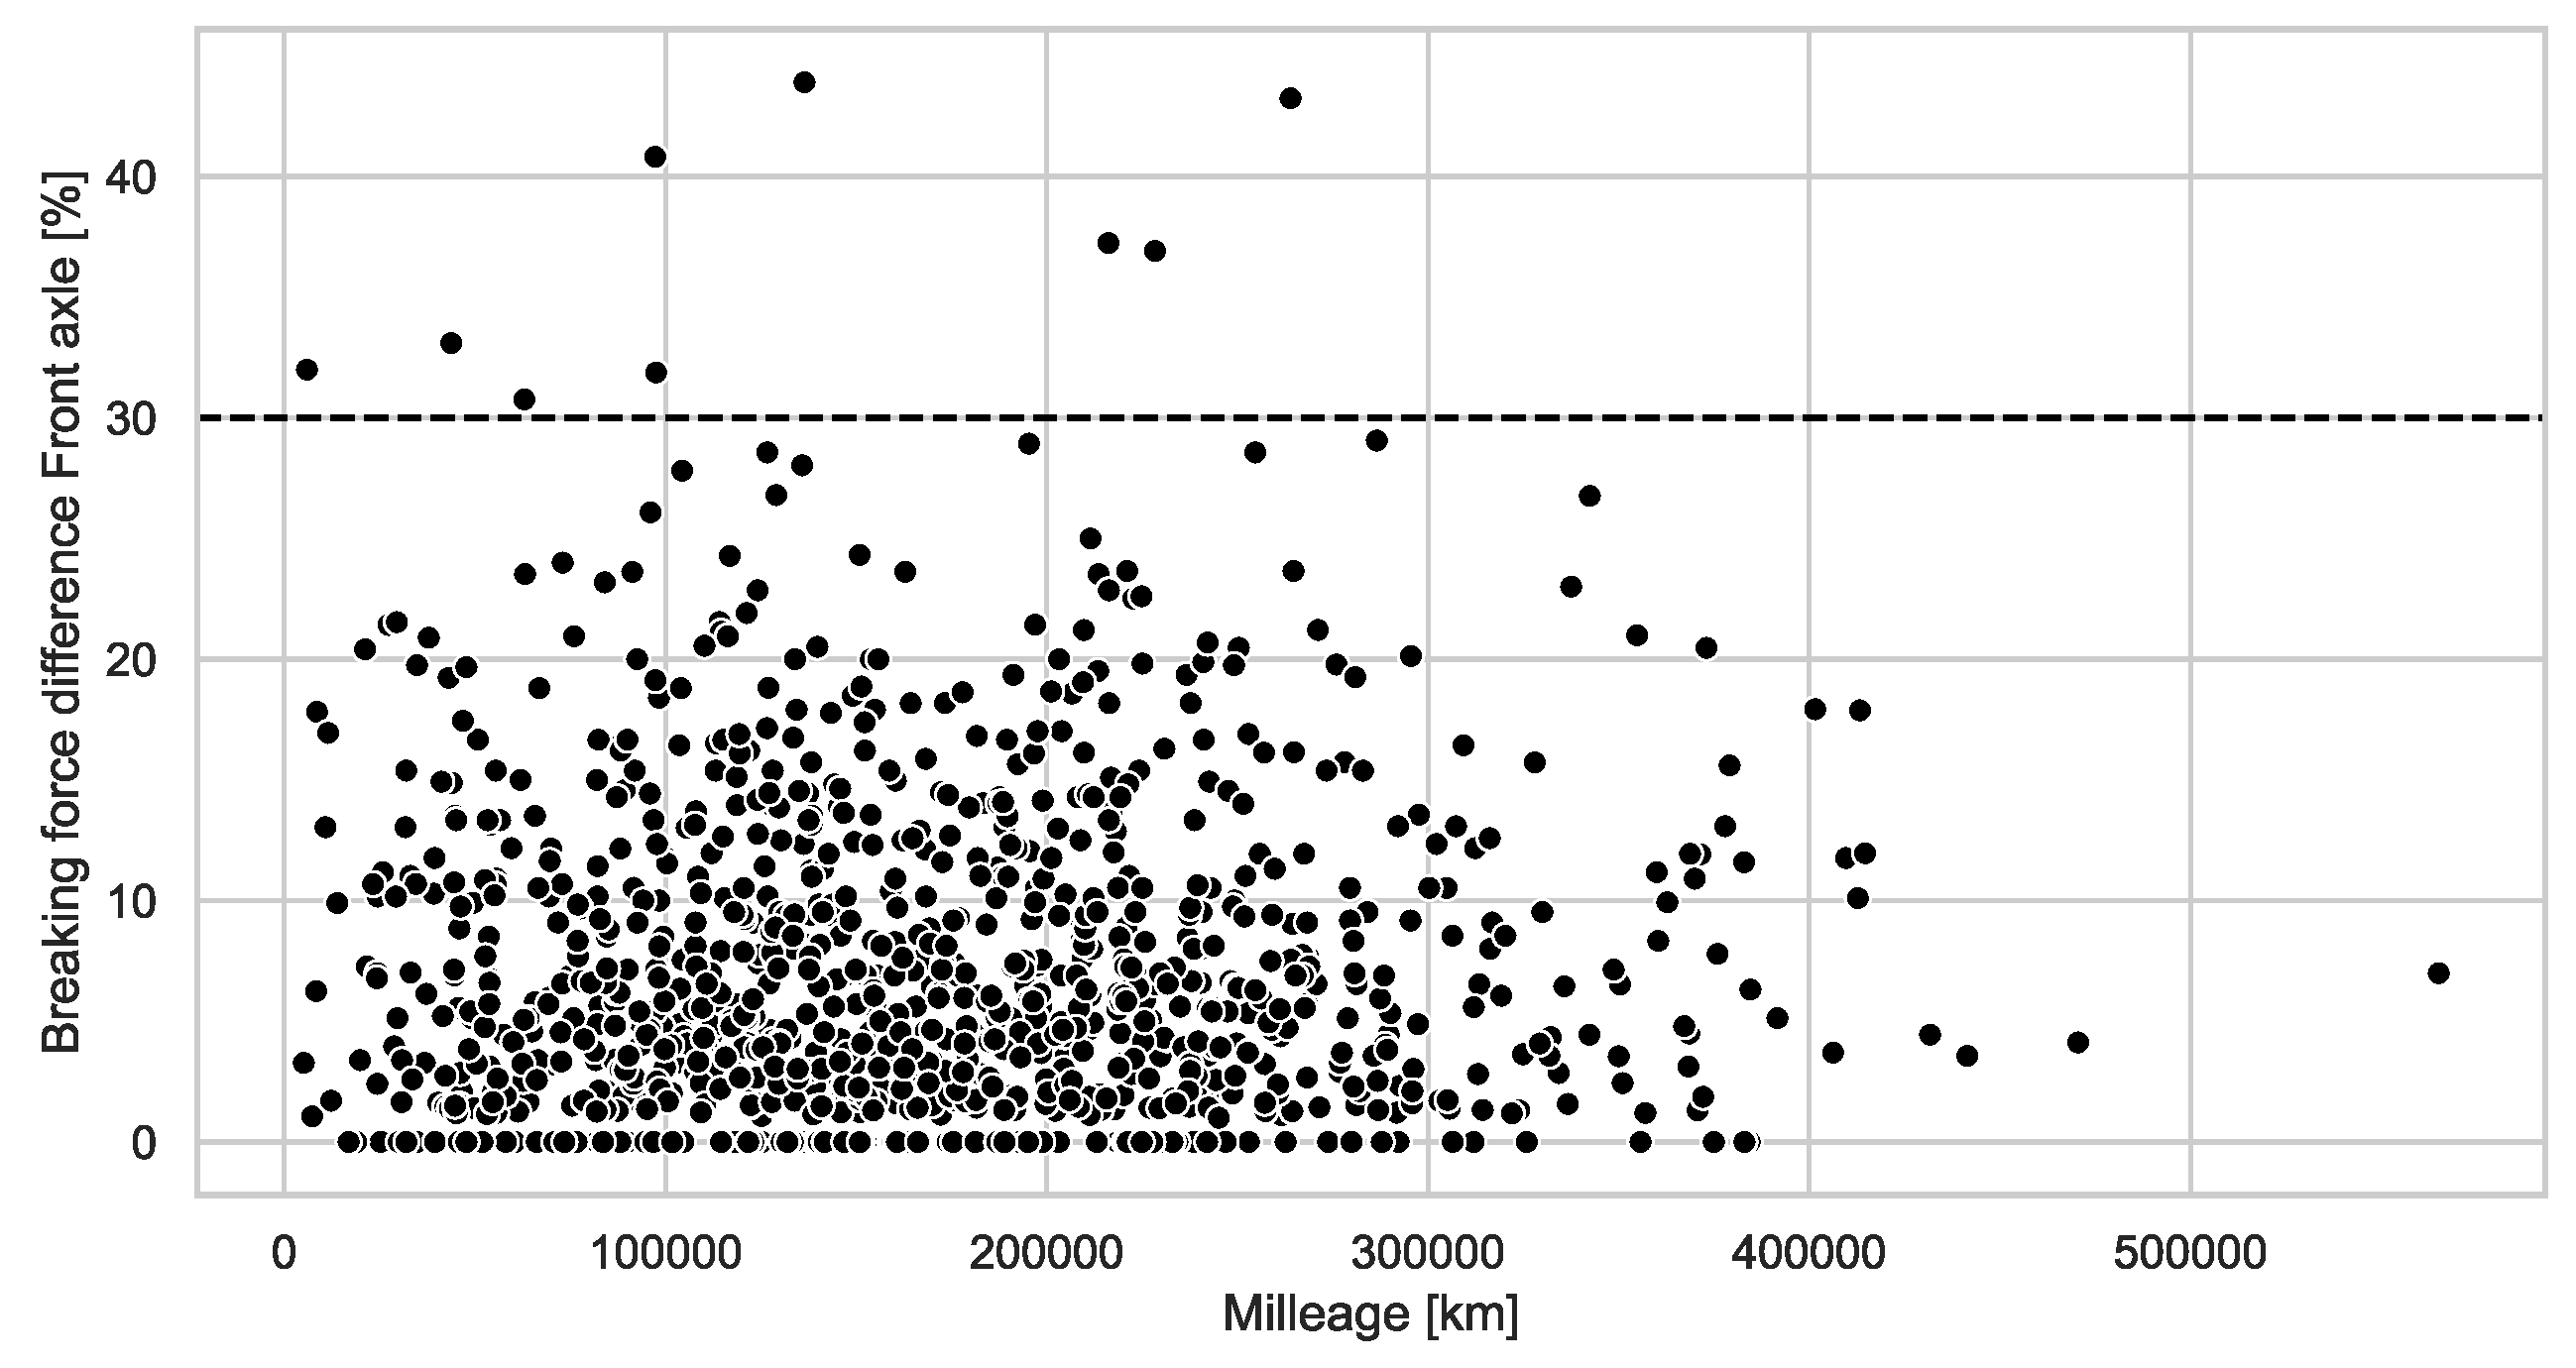
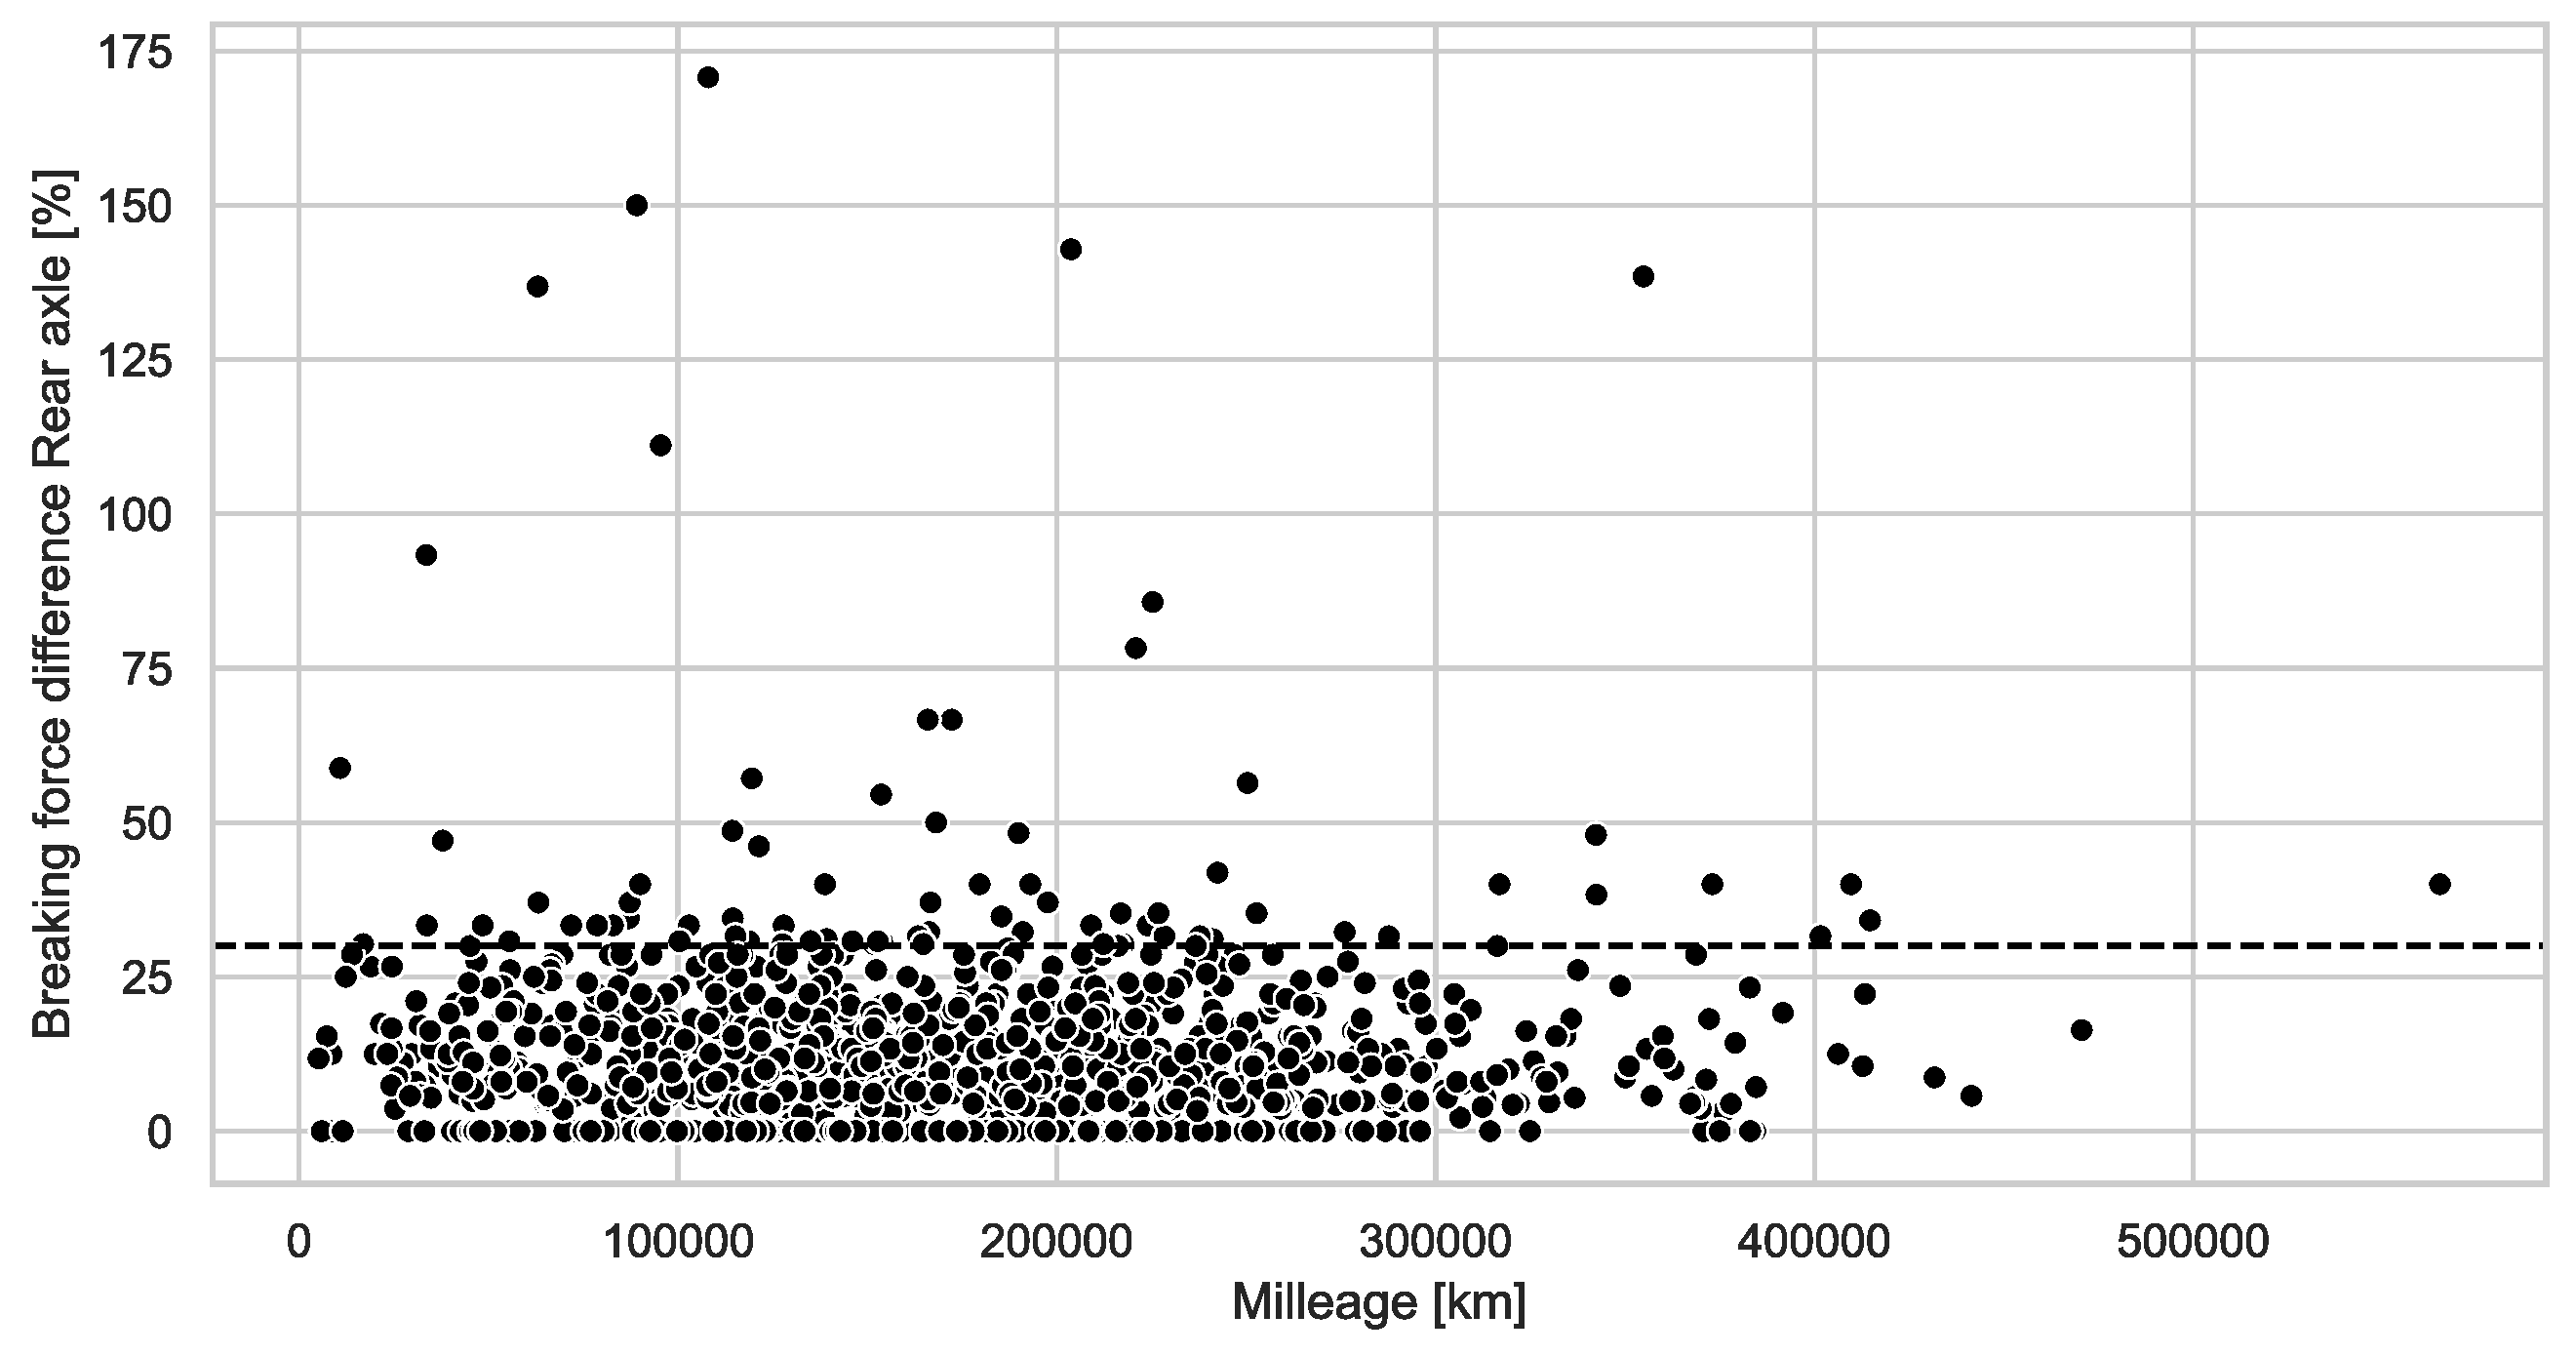
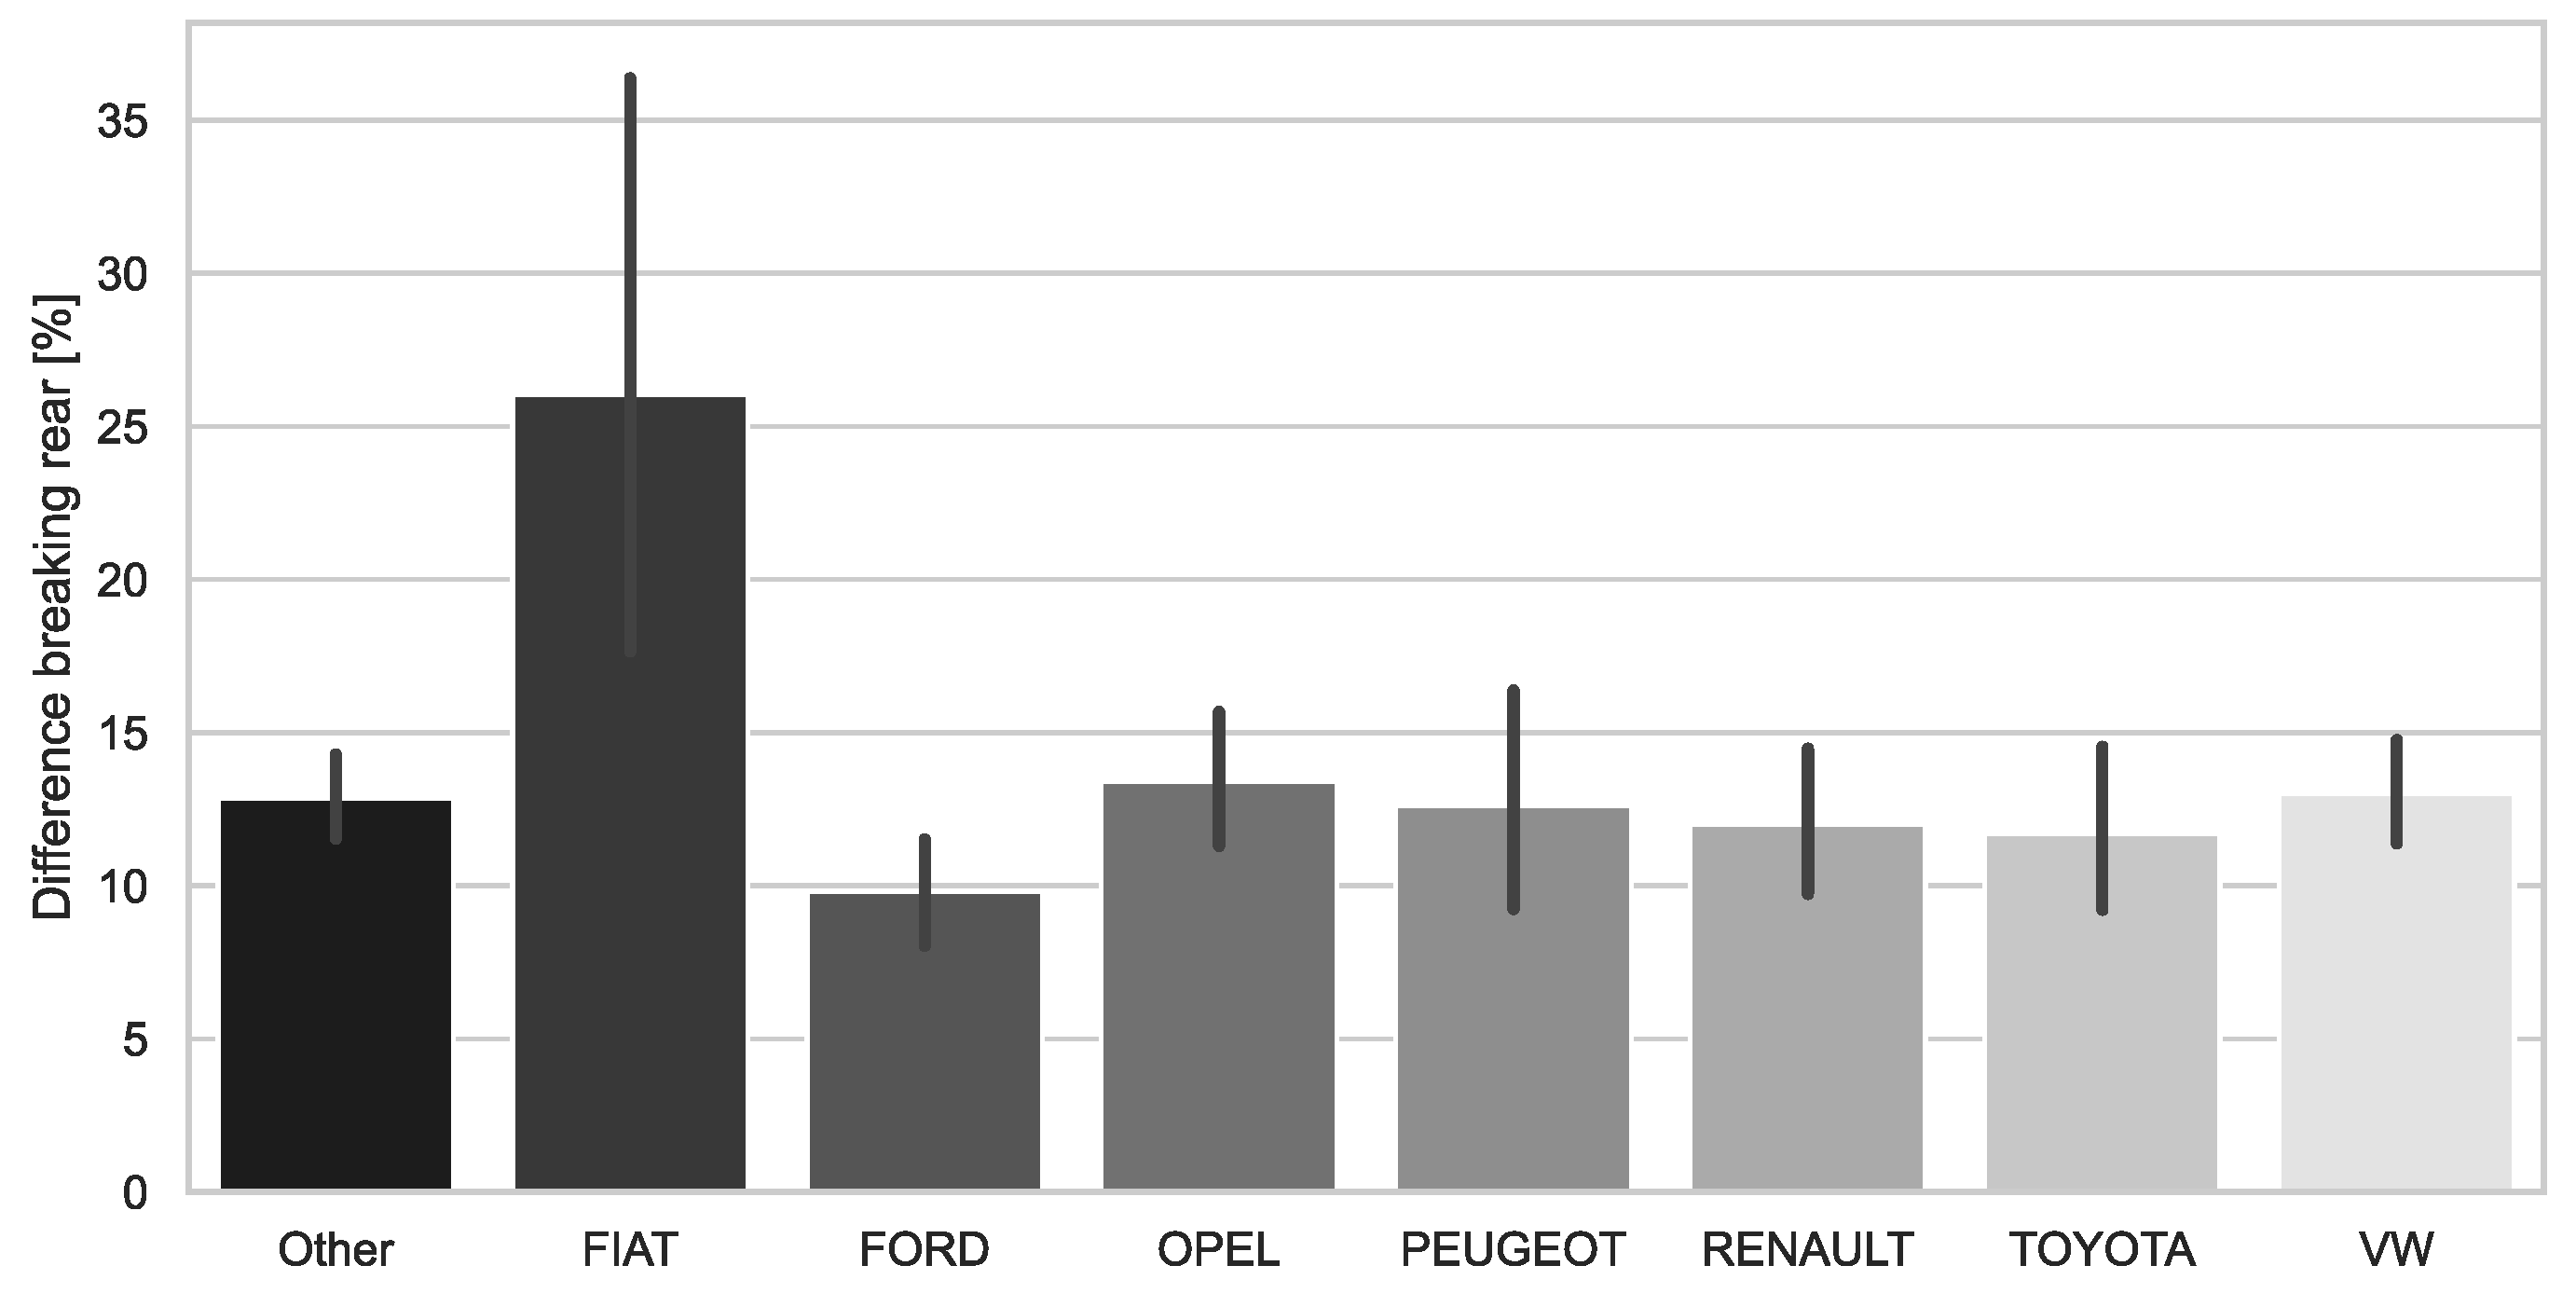
| Brand | Front Breaking Difference (%) | Rear Breaking Difference (%) | Front Pressure Difference (%) | Rear Pressure Difference (%) | Milleage per Year (km) |
|---|---|---|---|---|---|
| VW (n = 158) | 8.32 (6.76) | 12.99 (10.88) | 7.56 (11.51) | 8.99 (13.94) | 13,883 (6422) |
| 0.0–43.24 | 0.0–58.82 | 0.00–85.71 | 0.00–100.00 | 308–38,420 | |
| 6.90 | 10.26 | 4.65 | 4.49 | 12,593 | |
| [7.27; 9.39] | [11.29; 14.70] | [5.76; 9.37] | [6.80; 11.18] | [12,874; 14,892] | |
| Opel (n = 115) | 7.00 (6.03) | 13.40 (11.84) | 8.76 (13.22) | 6.96 (8.97) | 10,862 (4688) |
| 0.0–29.06 | 0.0–56.41 | 0.00–104.76 | 0.00–50.00 | 2420–30,126 | |
| 5.71 | 10.53 | 4.88 | 4.44 | 9832 | |
| [5.88; 8.11] | [11.21; 15.58] | [6.32; 11.20] | [5.30; 8.62] | [9996; 11,728] | |
| Ford (n = 88) | 7.16 (7.51) | 9.80 (8.38) | 9.74 (20.74) | 8.31 (10.78) | 15,237 (7391) |
| 0.00–40.82 | 0.0–34.48 | 0.00–175.33 | 0.00–50.00 | 1195–43,506 | |
| 4.82 | 7.70 | 4.65 | 4.88 | 14,368 | |
| [5.57; 8.75] | [8.03; 11.57] | [5.34; 14.13] | [6.03; 10.60] | [13,671; 16,803] | |
| Toyota (n = 72) | 6.40 (6.34) | 11.71 (12.02) | 5.44 (10.58) | 5.29 (7.30) | 10,394 (4608) |
| 0.00–28.04 | 0.00–57.14 | 0.00–72.73 | 0.00–32.26 | 2165–26,071 | |
| 4.20 | 9.11 | 4.09 | 4.26 | 9557 | |
| [4.91; 7.89] | [8.89; 14.54] | [2.96; 7.93] | [3.58; 7.01] | [9312; 11,477] | |
| Renault (n = 68) | 7.87 (6.63) | 12.00 (9.88) | 10.43 (13.68) | 10.26 (14.89) | 10,934 (4991) |
| 0.00–28.57 | 0.00–40.00 | 0.00–70.59 | 0.00–66.67 | 101–36,940 | |
| 5.77 | 10.53 | 5.13 | 5.13 | 10,557 | |
| [6.26; 9.47] | [8.89; 14.54] | [7.11; 13.74] | [6.66; 13.87] | [9312; 11,477] | |
| Peugeot (n = 59) | 9.27 (9.01) | 12.62 (14.59) | 7.62 (11.22) | 9.28 (13.41) | 13,512 (7041) |
| 0.00–37.24 | 0.00–93.33 | 0.00–62.86 | 0.00–81.48 | 1977–44,618 | |
| 7.14 | 8.00 | 4.88 | 4.88 | 12,622 | |
| [6.92; 11.62] | [8.81; 16.42] | [4.69; 10.54] | [5.79; 12.78] | [11,678; 15,348] | |
| Fiat (n = 53) | 8.13 (6.92) | 26.02 (34.89) | 11.80 (19.35) | 7.99 (9.81) | 8710 (6448) |
| 0.00–26.09 | 0.00–100.00 | 0.00–103.03 | 0.00–42.86 | 1185–31,096 | |
| 5.00 | 16.22 | 5.13 | 5.41 | 6731 | |
| [6.23; 10.04] | [16.41; 35.64] | [6.47; 17.14] | [5.28; 10.69] | [6932; 10,487] | |
| Other (n = 454) | 7.03 (6.30) | 12.85 (14.17) | 7.02 (13.24) | 6.66 (9.93) | 12,650 (6565) |
| 0.00–43.90 | 0.00–100.00 | 0.00–165.22 | 0.00–63.41 | 197–41,993 | |
| 5.71 | 10.72 | 4.44 | 4.44 | 11,651 | |
| [6.45; 7.61] | [11.54; 14.16] | [5.80; 8.24] | [5.75; 7.58] | [12,045; 13,256] | |
| p-value | 0.1536 1 | 0.0372 1 | 0.0069 1 | 0.0578 1 | 0.0000 1 |
| Brand | Front Axle (mm) | Rear Axle (mm) | Light Setting: Yes/No Correction | Front Suspension Play: Yes/No | Chassis Corrosion: No/Foci/Holes | Oil Leaks: None/Sweating/Drops | Lighting Fault Yes/No |
|---|---|---|---|---|---|---|---|
| VW (n = 158) | 0.6 (2.7) −7.5–8.5 0.6 [0.2; 1.0] | 2.7 (2.0) −3.4–8.6 2.9 [2.4; 3.0] | Y—84 (53.2%) N—74 (46.8%) | Y—12 (8.6%) N—146 (92.4%) | F—10 (6.3%) N—147 (93.0%) H—1 (0.6%) | S—25 (15.8%) N—128 (81.0%) D—5 (3.2%) | Y—4 (2.5%) N—154 (97.5%) |
| Opel (n = 115) | 0.1 (2.5) −9.0–5.7 0.3 [−0.4; 0.5] | 2.7 (1.3) −0.7–6.5 2.6 [2.5; 3.0] | Y—48 (41.7%) N—67 (58.3%) | Y—12 (10.4%) N—103 (89.6%) | F—3 (2.6%) N—112 (97.4%) | S—32 (13.9%) N—93 (80.9%) D—4 (3.5%) | Y—6 (5.2%) N—109 (94.8%) |
| Ford (n = 88) | 0.7 (2.3) −8.5–6.7 1.0 [0.2–1.2] | 3.1 (2.5) −7.6–6.6 3.7 [2.6; 3.7] | Y—40 (45.5%) N—48 (54.5%) | Y—9 (10.2%) N—79 (89.8%) | N—88 (100%) | S—5 (5.7%) N—82 (93.2%) D—1 (1.1%) | Y—6 (6.8%) N—82 (93.2%) |
| Toyota (n = 72) | 0.0 (1.7) −3.5– 4.8 0.3 [−0.4; 0.4] | 4.5 (11.6) −3.4–8.6 2.9 [2.4; 3.0] | Y—39 (54.2%) N—33 (45.8%) | N—72 (100%) | F—1 (1.4%) N—70 (97.2%) H—1 (1.4%) | S—3 (4.2%) N—67 (93.1%) D—2 (2.8%) | Y—3 (4.2%) N—69 (95.8%) |
| Renault (n = 68) | −0.2 (2.4) −7.8–6.5 −0.5 [−0.8; 0.4] | 4.0 (1.5) 0.0–6.9 4.3 [3.7; 4.4] | Y—33 (48.5%) N—35 (51.5%) | Y—10 (14.7%) N—58 (85.3%) | F—2 (2.9%) N—66 (97.1%) | S—15 (22.1%) N—50 (73.5%) D—3 (4.4%) | Y—10 (14.7%) N—58 (85.3%) |
| Peugeot (n = 59) | −0.5 (2.6) −7.6–5.3 0.0 [−1.1; 0.2] | 3.2 (2.1) −3.2–6.7 3.4 [2.7; 3.8] | Y—27 (45.8%) N—32 (54.2%) | Y—12 (20.3%) N—47 (79.7%) | F—1 (1.7%) N—57 (96.6%) H—1 (1.7%) | S—10 (16.9%) N—48 (81.4%) D—1 (1.7%) | Y—8 (13.6%) N—51 (86.4%) |
| Fiat (n = 53) | 0.9 (2.8) −5.2–8.6 1.0 [0.1; 1.6] | 1.7 (1.8) −2.1–4.8 1.6 [1.2; 2.2] | Y—29 (54.7%) N—24 (45.3%) | Y—4 (7.5%) N—49 (92.5%) | F—3 (5.7%) N—49 (92.5%) H—1 (1.9%) | S—12 (22.6%) N—38 (52.8%) D—3 (5.7%) | Y—1 (1.9%) N—52 (98.1%) |
| Other (n = 454) | 0.5 (2.7) −9.4–8.5 0.7 [0.2; 0.7] | 2.9 (2.4) −7.5–8.0 3.2 [2.7; 3.1] | Y—169 (37.2%) N—285 (62.8%) | Y—50 (11.0%) N—404 (89.0%) | F—7 (1.5%) N—445 (98.0%) H—3 (0.7%) | S—32 (7.0%) N—406 (89.4%) D—15 (3.3%) | Y—18 (4.0%) N—436 (96.0%) |
| p-value | 0.0056 1 | 0.0000 1 | 0.0050 2 0.0049 3 | 0.0111 2 0.0011 3 | 0.3265 2 0.2759 3 | 0.0000 2 0.0040 3 | 0.0594 2 0.3127 3 |
Disclaimer/Publisher’s Note: The statements, opinions and data contained in all publications are solely those of the individual author(s) and contributor(s) and not of MDPI and/or the editor(s). MDPI and/or the editor(s) disclaim responsibility for any injury to people or property resulting from any ideas, methods, instructions or products referred to in the content. |
© 2024 by the authors. Licensee MDPI, Basel, Switzerland. This article is an open access article distributed under the terms and conditions of the Creative Commons Attribution (CC BY) license (https://creativecommons.org/licenses/by/4.0/).
Share and Cite
Obst, M.; Glowinski, S.; Kurpisz, D. Analysis of Technical Condition of Cars in Western Poland: A Study Based on Selected Indicators. Appl. Sci. 2024, 14, 645. https://doi.org/10.3390/app14020645
Obst M, Glowinski S, Kurpisz D. Analysis of Technical Condition of Cars in Western Poland: A Study Based on Selected Indicators. Applied Sciences. 2024; 14(2):645. https://doi.org/10.3390/app14020645
Chicago/Turabian StyleObst, Maciej, Sebastian Glowinski, and Dariusz Kurpisz. 2024. "Analysis of Technical Condition of Cars in Western Poland: A Study Based on Selected Indicators" Applied Sciences 14, no. 2: 645. https://doi.org/10.3390/app14020645
APA StyleObst, M., Glowinski, S., & Kurpisz, D. (2024). Analysis of Technical Condition of Cars in Western Poland: A Study Based on Selected Indicators. Applied Sciences, 14(2), 645. https://doi.org/10.3390/app14020645


