Article

A PZT-Based Smart Anchor Washer for Monitoring Prestressing Force Based on the Wavelet Packet Analysis Method

School of Highway, Chang’an University, Xi’an 710064, China
*
Author to whom correspondence should be addressed.
Appl. Sci. 2024, 14(2), 641; https://doi.org/10.3390/app14020641
Submission received: 5 December 2023 / Revised: 5 January 2024 / Accepted: 10 January 2024 / Published: 12 January 2024

Abstract

:
Prestressed steel strands in prestressed structures offset or reduce the tensile stress caused by external loads, making them the primary load-bearing components. Great concerns have been raised about prestress monitoring due to the growing use of structural health monitoring (SHM). Piezoceramic (PZT) active sensing methods are commonly used in this field. However, there appears to be a problem of “energy saturation” in the utilization of piezoceramic active sensing methods. In this study, a smart anchor washer with semi-cylinders was developed to alleviate the saturation problem. An intelligent monitoring system is formed by combining the upper and lower annular cylinders with two piezoelectric patches. The piezoelectric patch on the upper annular cylinder is used as an actuator to emit signals through the contact interface of the smart anchor washer, which are then received by the piezoelectric patch on the lower annular cylinder. Based on wavelet packet decomposition, we investigate the correlation between the energy of the received signal and the applied tension force. Finally, a prestressing force index is developed for monitoring prestressing force using Shannon entropy. It is found that the index decreases with the increase in tension. The proposed design and index are also sensitive to early monitoring of prestressing force and can be used to monitor the entire prestressing process of steel strands.

1. Introduction

Prestressed structures have the advantages of strong crack resistance, high stiffness, high strength, and good shear capacity [1]. They are highly effective in reducing the cross-sectional area, preventing cracking, and minimizing deflection, making them a preferred choice for small to medium-span bridges [2]. However, during construction and service, prestress loss occurs due to factors such as corrosion or long-term relaxation [3,4]. This leads to decreased levels of prestress and an uneven distribution of prestress. Prestress loss is a gradual process of internal manifestation of damage accumulation [5]. The loss of prestress directly reduces the loading bearing capacity of the prestressed structure, resulting in damage accumulation, resistance attenuation, and failure without warning [6]. Therefore, prestress monitoring should be carried out so that the structure can be maintained in time to prevent further catastrophic consequences [7].
With the advancement of long-term structural health monitoring (SHM), several techniques have been utilized to identify prestress loss. These methods include impedance-based methods [8,9], elasto-magnetic methods [8,9], and acoustoelastic methods [10,11]. These methods currently cannot directly measure prestress along the beam [12]. Elasto-magnetic methods can embed sensors in concrete and prestress, but they require pre-embedding. Relevant research is still being explored due to the large size of the sensor [13,14]. Detecting prestress near the anchor head may indicate any potential loss in prestress. Kleitsa et al. [15] demonstrated that the propagation time and amplitude of ultrasonic waves can provide insight into changes in contact pressure between the steel strand and the anchor head.
Recently, there has been active research on techniques for structural health monitoring (SHM) based on smart materials [16,17]. Piezoelectric materials, which are a type of smart material, have the ability to convert electrical energy into mechanical energy. They can serve as both actuators [18] and sensors [19]. In addition, piezoceramic transducers can be easily embedded in a structure [20] or mounted on the surface [21]. Furthermore, piezoelectric materials enable the active sensing method, which is effective in monitoring concrete strength [22,23], structural damage [24,25], and bolt preload [26,27]. Gu et al. [28] conducted early monitoring of concrete strength using embedded piezoelectric transducers. Chen et al. [29] monitored the development process of concrete strength by utilizing piezoelectric ceramic materials embedded in precast concrete blocks. Sharma et al. [30] monitored the setting and curing process of freshly poured concrete. Kocherla et al. [31] developed a technique for sensing the stress-induced localization of damage in the form of discrete cracks in a concrete substrate using embedded PZT patches. Zhang et al. [32] proposed an approach to monitor the crack growth process of reinforced concrete beams using embedded piezoelectric aggregates. Wang et al. [33,34] investigated the correlation between the torque of the bolt and the energy generated by the ultrasonic wave. They also examined the relationship between the peak amplitude of the time reversal focusing signal and the pre-tightening force of the bolt. The study has shown that the active sensing method, based on piezoceramics, has the potential to monitor structural loosening states. However, researchers have observed a phenomenon called “energy saturation” [35].
Due to microscopic roughness and unevenness at the contact surface, energy saturation can be explained by the rough interface. In the field of contact mechanics, the G-W contact model [36] and fractal contact theory [37] were proposed to determine the actual contact area of the interface under load. It was found that fractal roughness parameters have a significant effect on the actual contact area [35]. In addition, rough contact interfaces also affect the energy dissipation of ultrasonic waves. Wang et al. [38] explained the inherent mechanism of this effect. Since traditional linear acoustic methods, which are based on wave energy dissipation, have limitations, there is a need for new methods or indices to analyze the nonlinear characteristics of the signal and address the phenomenon of energy saturation. Second-order acoustic nonlinearity has been identified and emphasized in the field of ultrasonic health monitoring [39,40]. For example, Zhang et al. [41] compared the linear wave energy dissipation (WED) method with the nonlinear vibration-acoustic modulation (VAM) method and found that the VAM-based nonlinear method is more sensitive for monitoring loosening. In addition, new damage indices (DIs) have been developed. Wang et al. introduced a new entropy-based DI using the multiscale multivariate sample entropy (MMSE) algorithm [42] and the multiscale permutation entropy algorithm [43]. By extracting nonlinear features from stress wave signals, Jiang et al. [44] demonstrated that the recursive entropy index could effectively mitigate energy saturation and fluctuation. This enhancement improved the performance of the piezoceramic-enabled active sensing method in early loosening monitoring.
Due to the high design value of bridge prestress, monitoring the entire range of bridge prestress is undoubtedly a significant challenge. Zhang et al. [45,46] utilized the piezoceramic active sensing method, which is based on time reversal and the wavelet packet energy method, to monitor the prestress in the anchorage connection of the bridge. Their study demonstrated a certain potential for monitoring small prestress values, but it still falls short of the design value for bridge prestress.
In this paper, two proposals are suggested to solve the problem of monitoring bridge prestress. (1) The contact area of the contact interface does not increase under a certain preload force, which is influenced by the roughness of the contact interface. Therefore, a “smart anchor washer” is designed to increase the roughness of the contact interface and delay the saturation of signal energy. (2) Since the entropy method has shown potential in analyzing the underlying complexity of time series signals, a new entropy-based DI is developed to address the issue of signal energy saturation. The rest of the paper is organized as follows: Section 2 introduces the design of the “smart anchor washer” and explains the basic principles of the methodology. Section 3 describes the experimental setup and procedure. In Section 4, the energy of the received signal and the entropy-based DI are calculated and demonstrated to be effective. Finally, Section 5 concludes the paper.

2. Principles

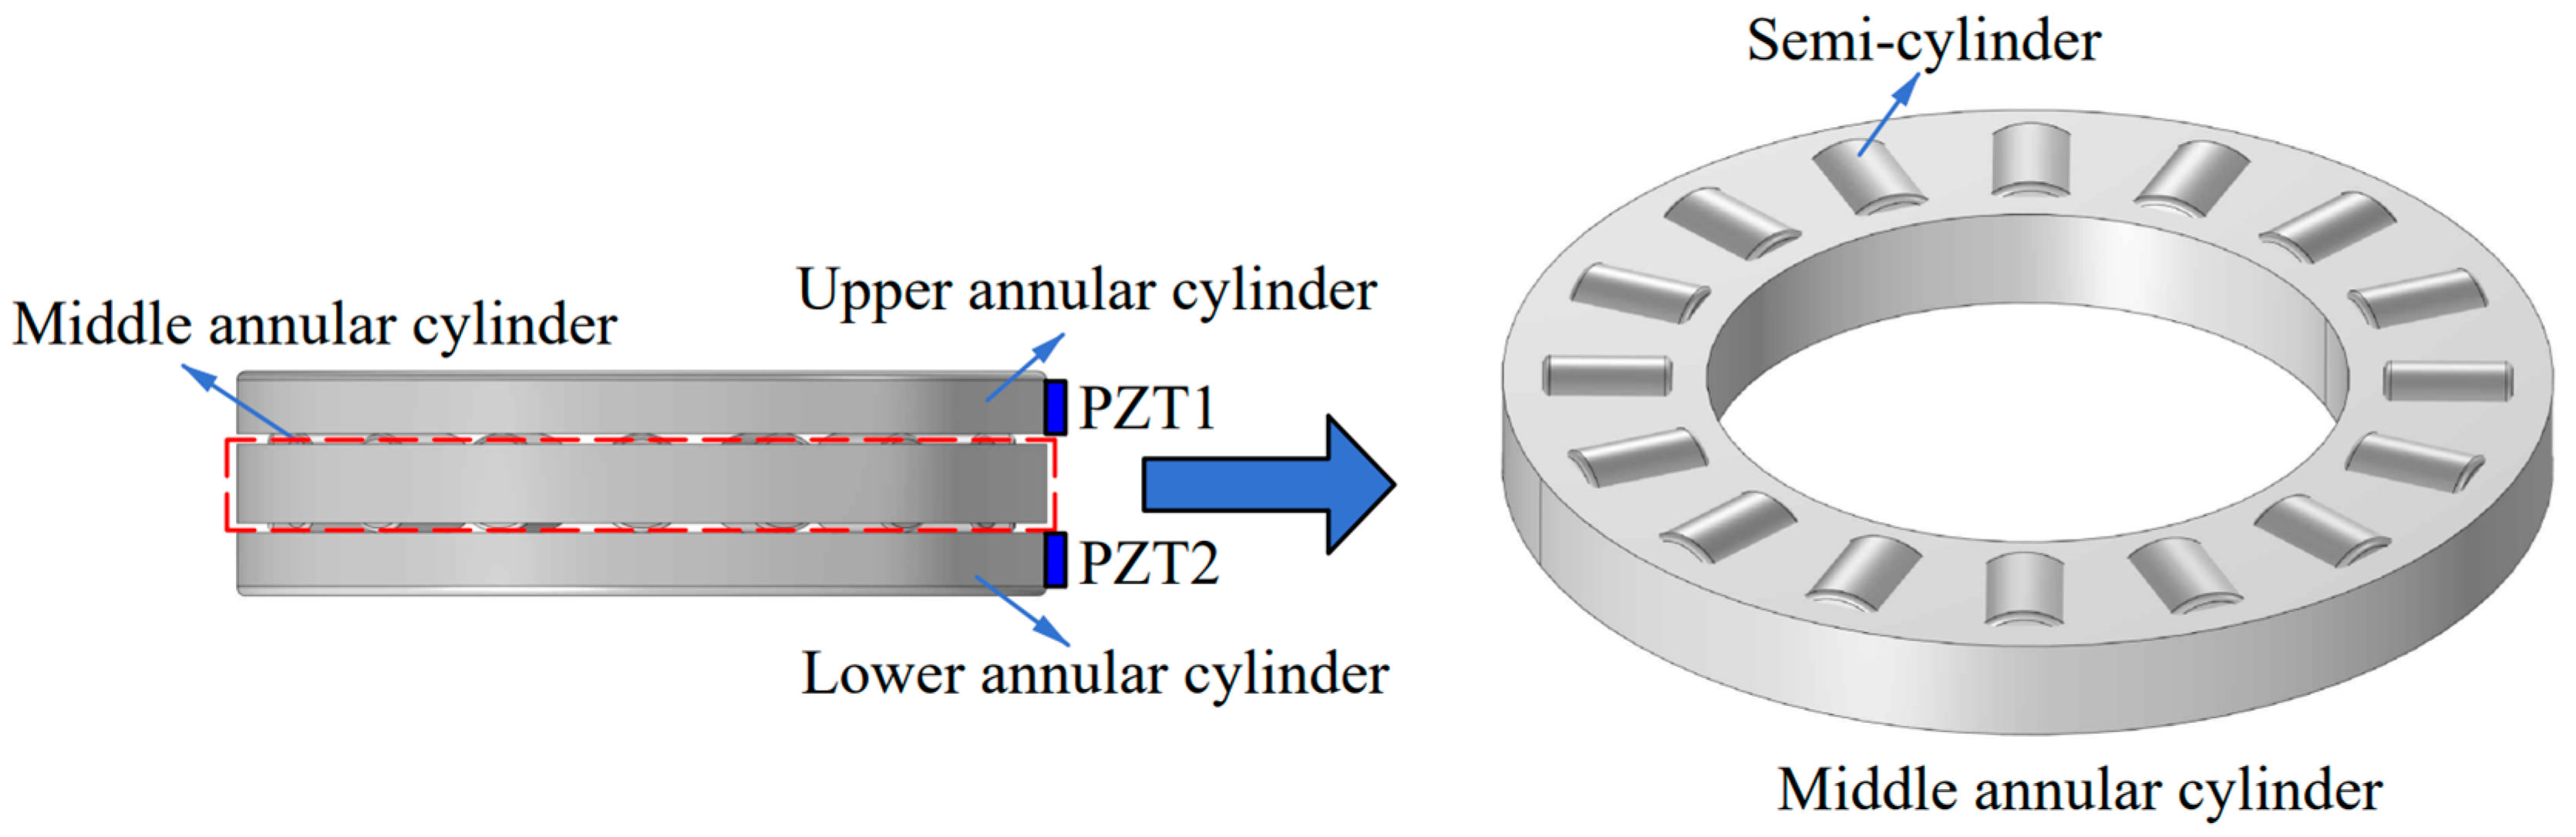
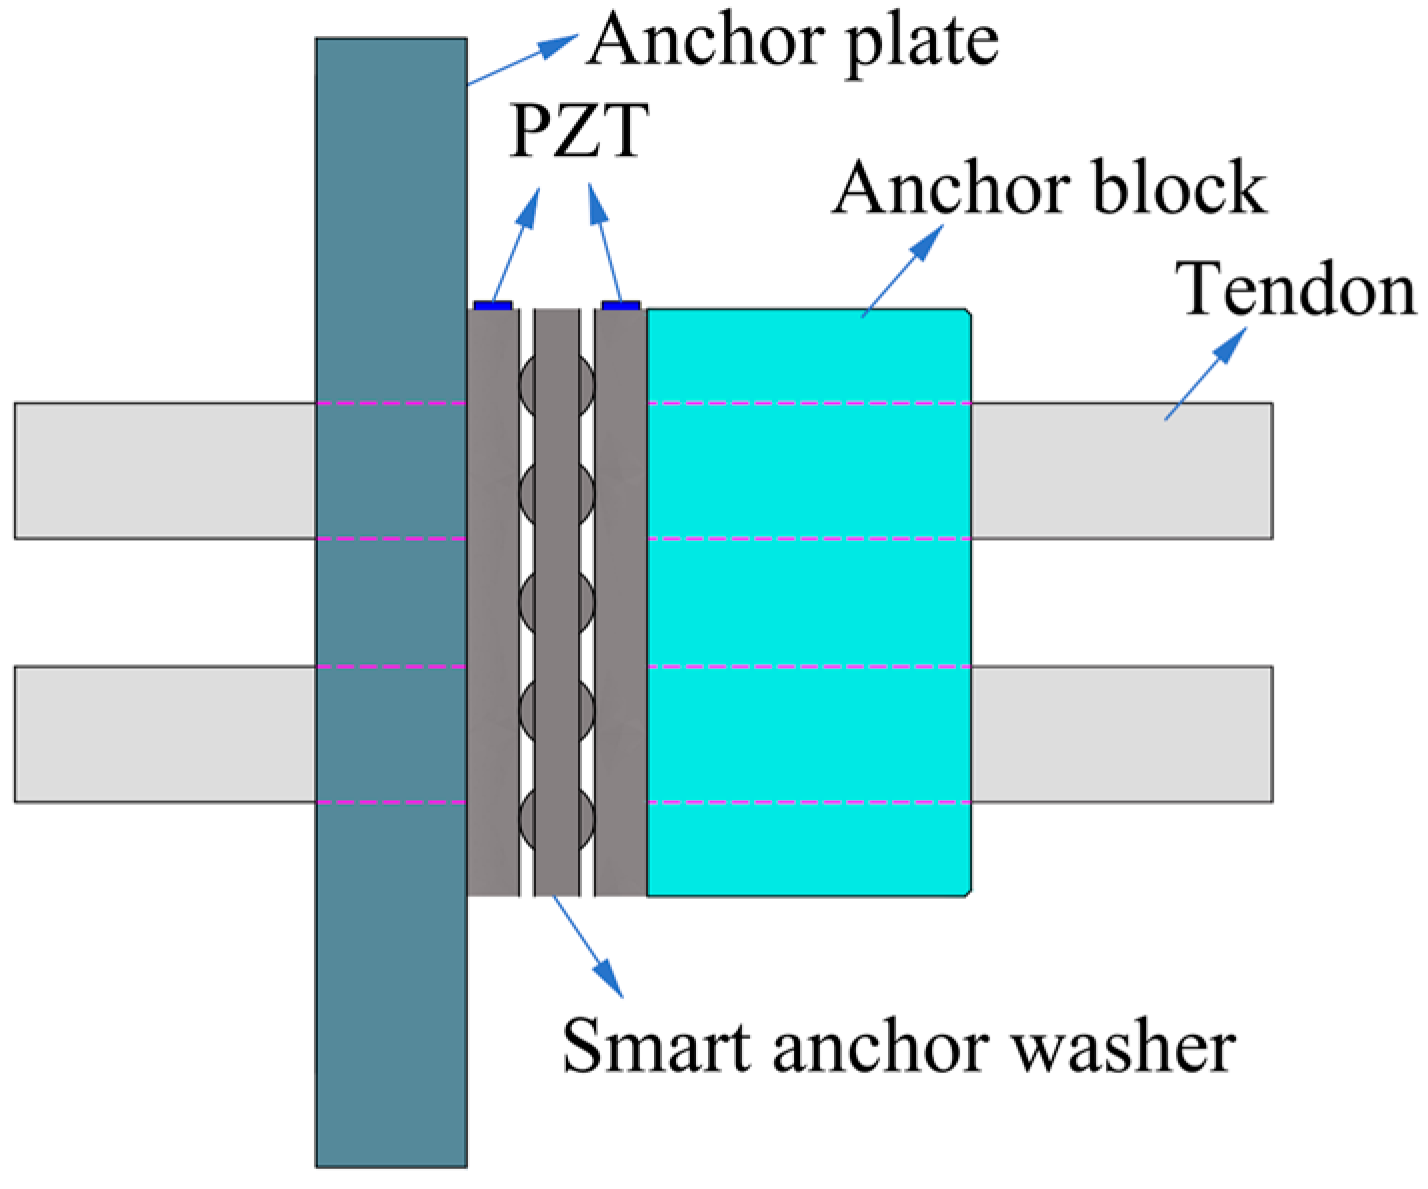
2.1. Smart Anchor Washer

The smart anchor washer consists of three parts: the middle, upper, and lower annular cylinders, as shown in Figure 1. Marked with the red dashed line is the middle annular cylinder, whose precise shape is depicted in the enlarged view on the right in Figure 1. In the active sensing method, an ultrasonic wave is generated and propagated through the contact interface. The signal energy carried by ultrasonic waves through the contact interface is related to the actual contact area [35,47]. When the contact interface is compressed, the transmitted energy will no longer increase. Therefore, the middle annular cylinder is specially designed with semi-cylinders to prevent the saturation phenomenon. Two lead zirconate titanate (PZT) transducers are bonded to the upper and lower annular cylinders, respectively. The PZT1 patch on the upper annular cylinder functions as an actuator, emitting the signal through the semi-cylinders. On the other hand, the PZT2 patch on the lower annular cylinder serves as a sensor, receiving the signal.
The upper and lower annular cylinders can also be used to prevent plastic deformation of the anchor caused by stress concentration at the contact point. The material used for the entire smart anchor washer is GCr15, which possesses high design strength and can maintain elasticity under prestress tension. The contact area between the semi-cylinders, the upper annular cylinder, and the lower annular cylinder increases as the stress levels increase. Therefore, the smart anchor washer is installed between the anchor block and the anchor plate to monitor the prestress of the bridge through the energy transmitted from the contact area, as shown in Figure 2.

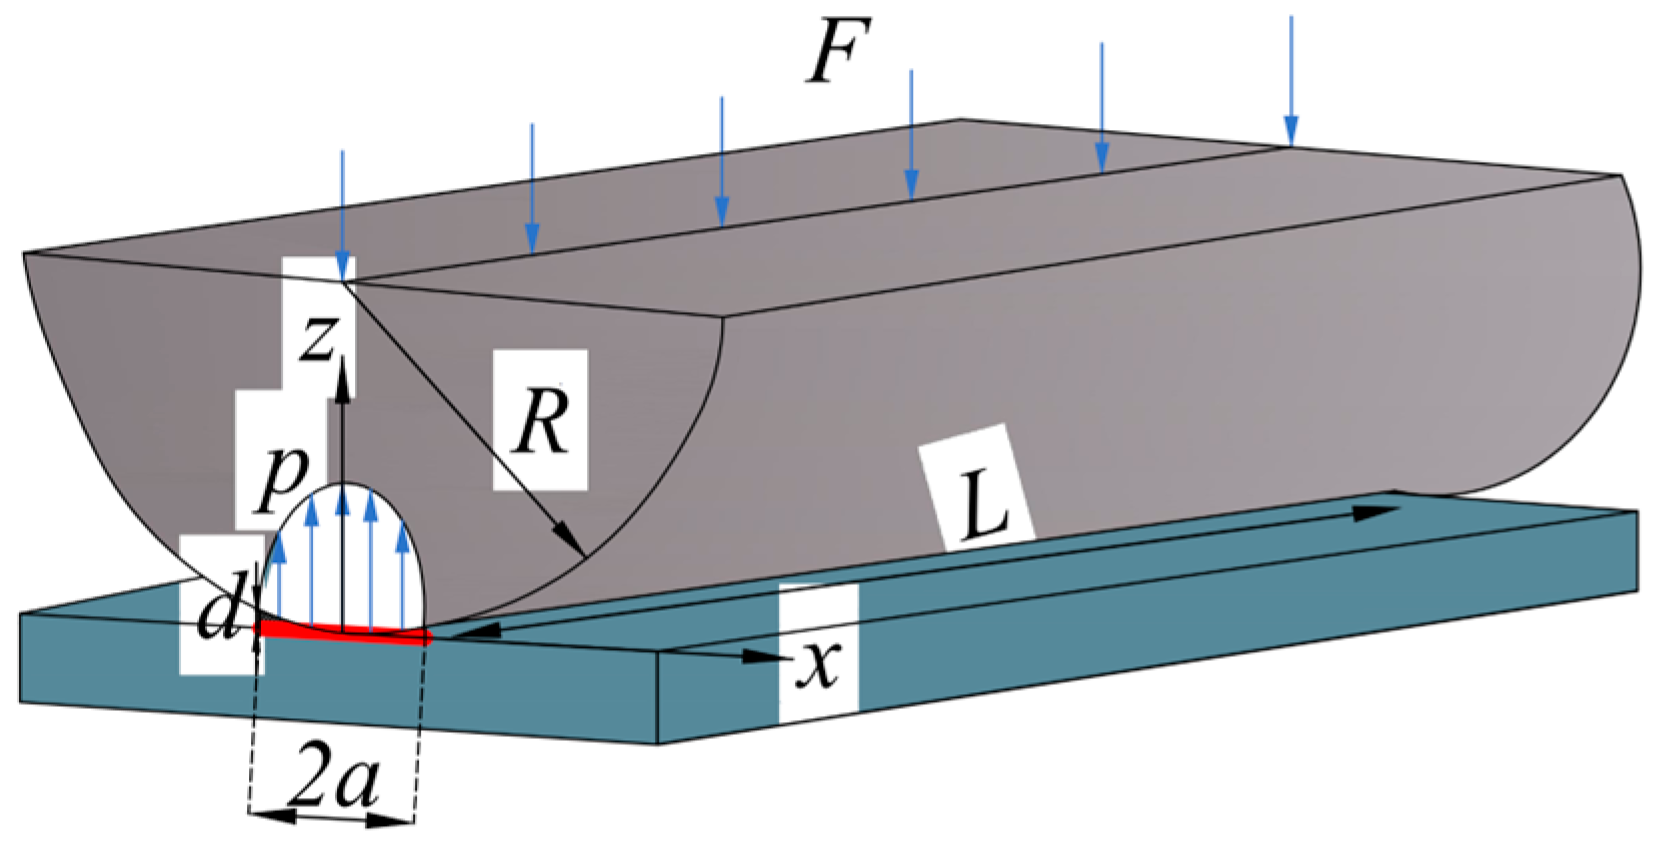
2.2. Elastic Contact Theory between a Rigid Cylinder and a Plane

To establish the relationship between the contact area and the force F, it is essential to analyze the contact model. According to classical Hertz contact theory, the contact area between a rigid cylinder and an elastic half space can be simplified as a rectangle with a length of L and a width of 2a [48], as illustrated in Figure 3.
In the case of contact between a rigid cylinder and an elastic half-space (Figure 3), the contact stress, p, distributed in a semi-elliptic cylinder is
p ( x ) = p 0 1 x 2 a 2 , x a
where p 0 represents the maximum contact stress, x denotes the radial distance between the contact point and the contact center, and a represents half of the contact width.
Half of the contact width is determined by the following equation:
a = R d
where R represents the radius of the cylinder and d represents the penetration depth.
The total force is calculated as follows:
F = 0 a p ( x ) 2 L d x = π p 0 a L 2
where F represents the external force and L represents the contact length.
The order of magnitude of elastic deformation in the contact region is ε = d / 2 a . The maximum contact stress is equal to
p 0 = E * d 2 a
where E* represents the effective elastic modulus, E * = E / ( 1 ν 2 ) ; E represents the elasticity modulus, and ν denotes the Poisson’s ratio.
Substituting Equation (4) into Equation (3) gives
F = π 4 E * L d
The force is linearly proportional to the penetration depth d.
Substituting Equation (2) into Equation (5) yields
a = 4 F R π E * L
Given that the contact area is A = 2 a L , the relationship between the contact area and the force is as follows:
A = 4 R L π E * F
It can be observed that the contact area, A, is directly proportional to the square root of the external force, F. Therefore, the contact area can serve as an indicator of the magnitude of the external force.
When an elastic wave propagates through an interface, a portion of the wave is dissipated due to interface friction ( Ω d i s s i p a t e d ), another portion of the wave passes through the contact interface ( Ω p a s s ), and the remaining portion is reflected ( Ω r e f l e c t e d ). The incident elastic wave can then be expressed as
Ω = Ω d i s s i p a t e d + Ω p a s s + Ω r e f l e c t e d
The relationship between the passing wave Ω p a s s , the contact area, and the external force is as follows [41]:
Ω p a s s A F
As shown in Figure 3, the wave energy that passes through the interface is received by the PZT patch on the lower annular cylinder. As can be seen from Equation (9), the energy of the incident wave remains unchanged with the increase in external force, and the energy of the transmitted wave will increase with the increase in external force. This is because the contact area also increases. Thus, the wave energy received by the lower annular cylinder can be utilized to accurately measure the level of prestress tightness.

2.3. Wavelet Packet Energy Method

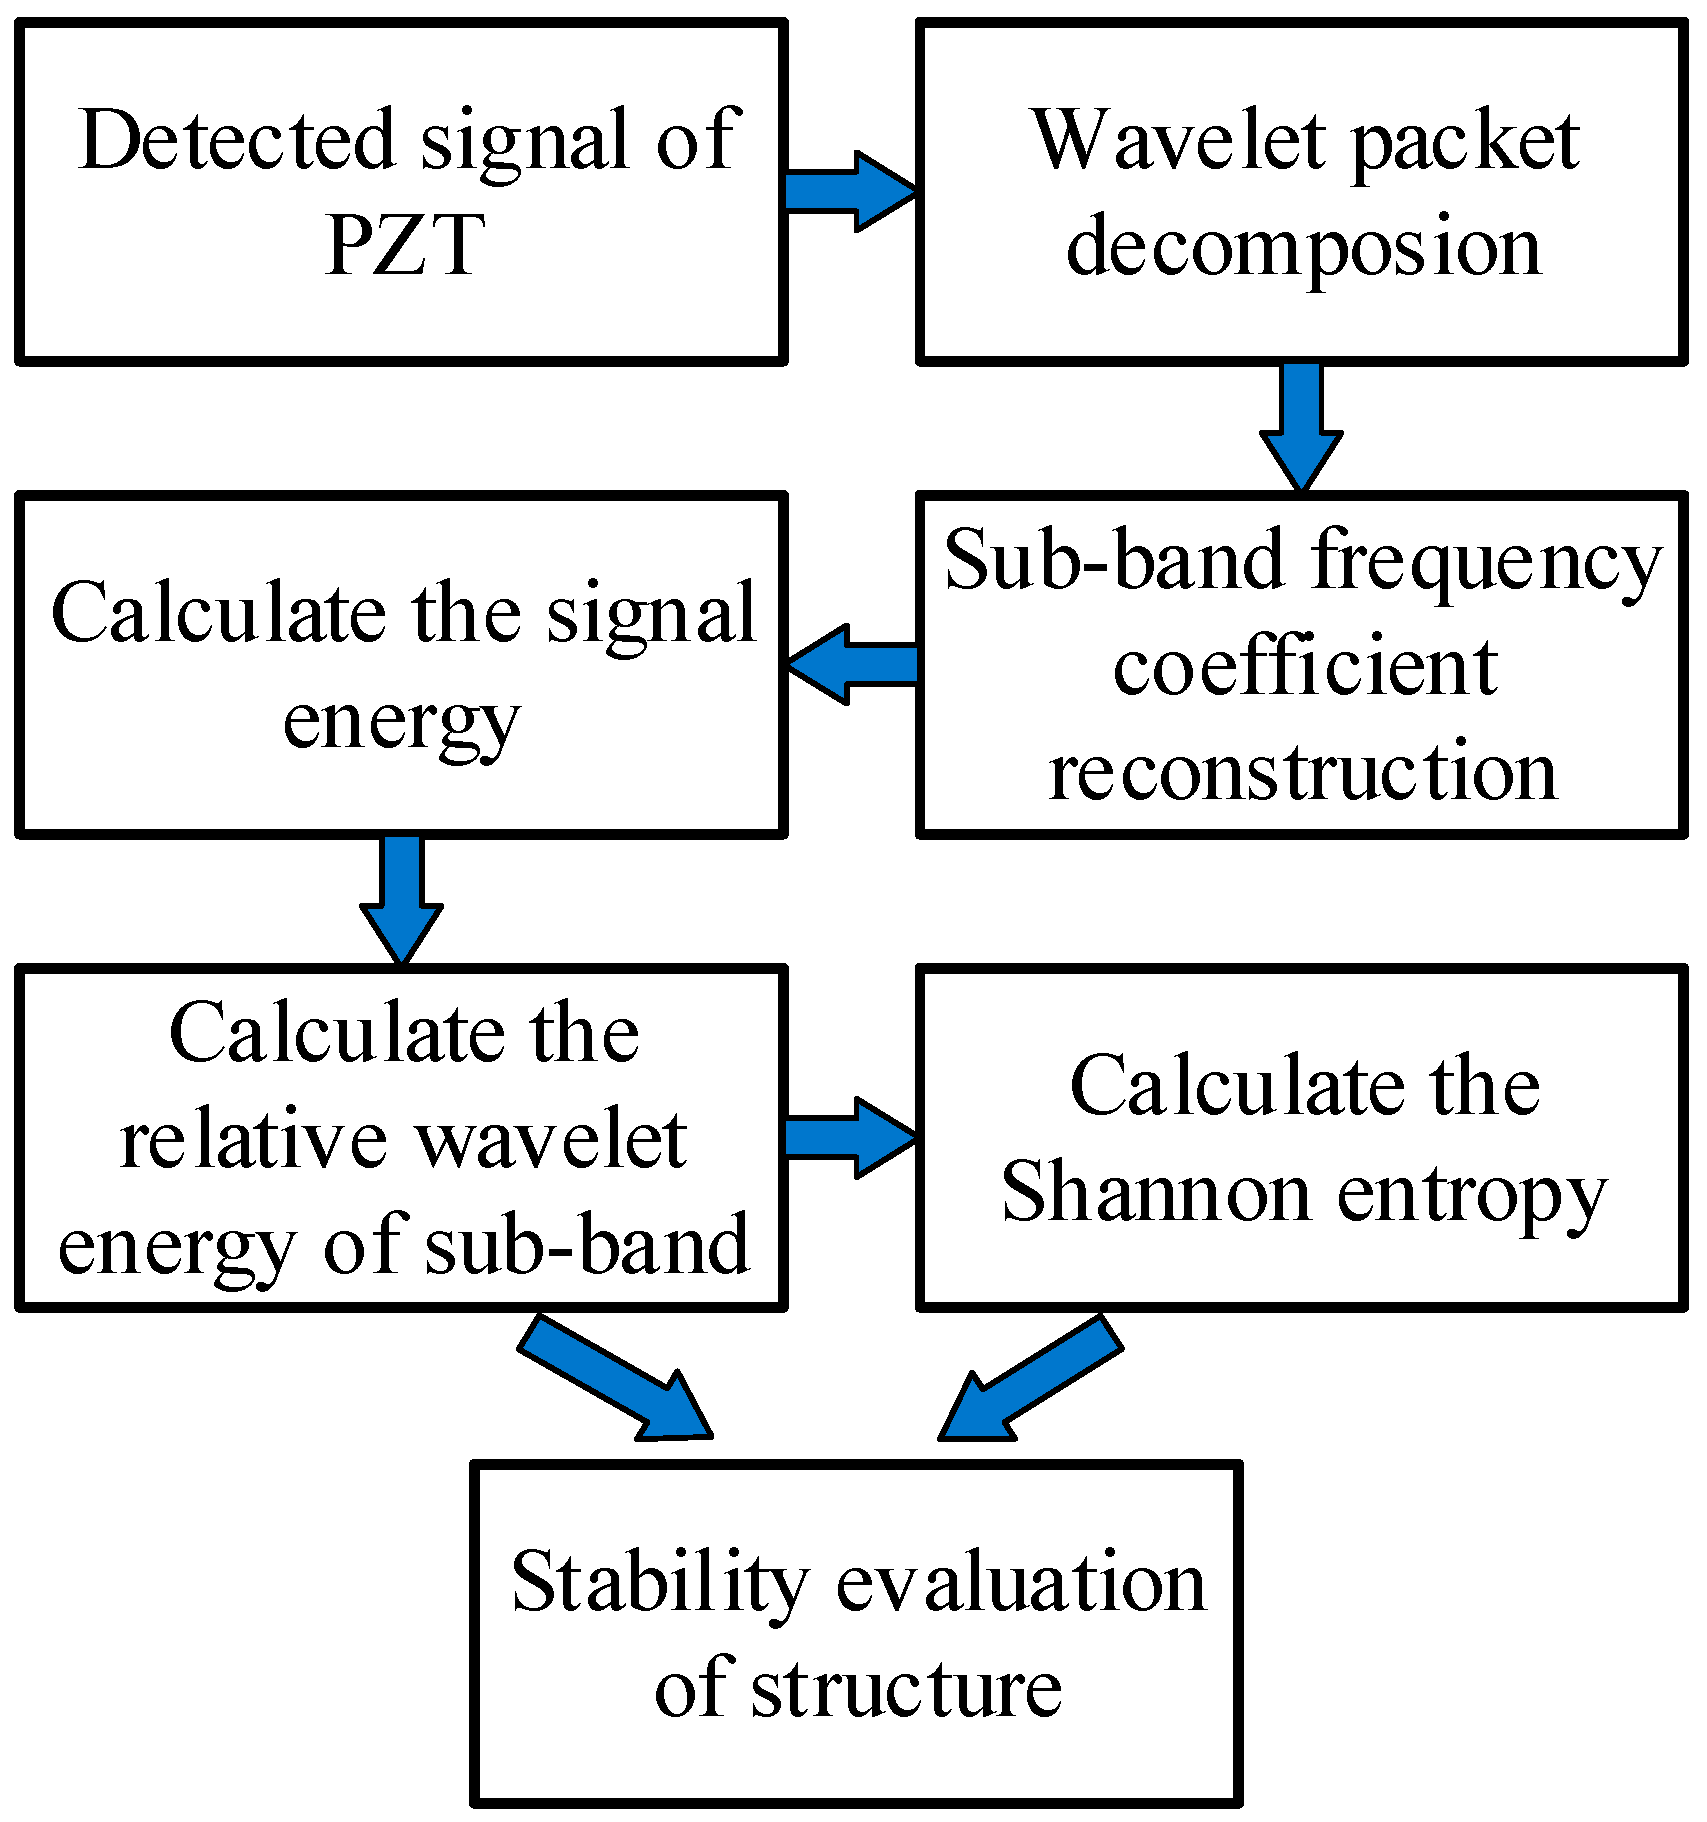
2.3.1. Wavelet Packet Decomposition

Wavelet packet decomposition (WPD), also known as optimal subband tree structuring, is a further optimization of wavelet transform. On the basis of the wavelet transform, both low-frequency and high-frequency subbands are decomposed at each level of signal decomposition. A cost function is then minimized to calculate the optimal signal decomposition path, which determines the decomposition of the original signal. The three-layer wavelet packet decomposition tree is shown in Figure 4.
By using wavelet packet decomposition, the original signal x ( t ) can be expressed as [49]
x ( t ) = i = 1 2 j x j i ( t )
where x j i ( t ) represents the i-th subband of the j-th decomposition layer, and can be expressed as
x j i ( t ) = + c j , k i ( t ) ψ j , k i ( t )
where ψ j , k i ( t ) represents the wavelet packet function and c j , k i ( t ) represents the wavelet packet coefficient.
The relationship between the j-th decomposition layer and the (j + 1)-th decomposition layer is
x j i ( t ) = x j + 1 2 i 1 ( t ) + x j + 1 2 i ( t ) x j + 1 2 i 1 ( t ) = x j i ( t ) k = + h ( k 2 t ) x j + 1 2 i ( t ) = x j i ( t ) k = + g ( k 2 t )
where h(k) represents the low-pass filter, g(k) represents the high-pass filter, and k is the translation parameter.

2.3.2. Wavelet Packet Energy and Shannon Entropy

The coefficients of the final wavelet packet layer are reconstructed, and the coefficients of the reconstructed wavelet packet, which has the same length as the original data, are obtained. The energy of the signal can be obtained by calculating it using Equations (13) and (14).
E j m = S j m 2
E t o t a l = m = 0 2 j 1 E j m
where S j m represents the reconstructed subband, m = 0 , 1 , 2 2 j - 1 .
In 1948, Shannon introduced the concept of information entropy as a means of quantifying information [50]. In the field of nonlinear time series, it serves as a measure of information uncertainty [51].
The relative energy of each subband can be calculated as
p j m = E j m E t o t a l
Then, the Shannon entropy is calculated as follows:
H j S h a n n o n = m = 0 2 j 1 p j m ln | p j m |
The flowchart of the method proposed in this paper is illustrated in Figure 5. First, the signal received by the PZT patch is decomposed using wavelet packets, and WPD is performed from level 1 to level n. Then, the coefficients of the obtained subbands are reconstructed to calculate the signal energy and the relative energy of the subbands. Finally, the Shannon method is used to calculate wavelet packet entropy. The greater the entropy, the greater the uncertainty, and the lower the stress level at the contact surface [52]. The index used in this paper evaluates the tightness of prestressed steel strands.

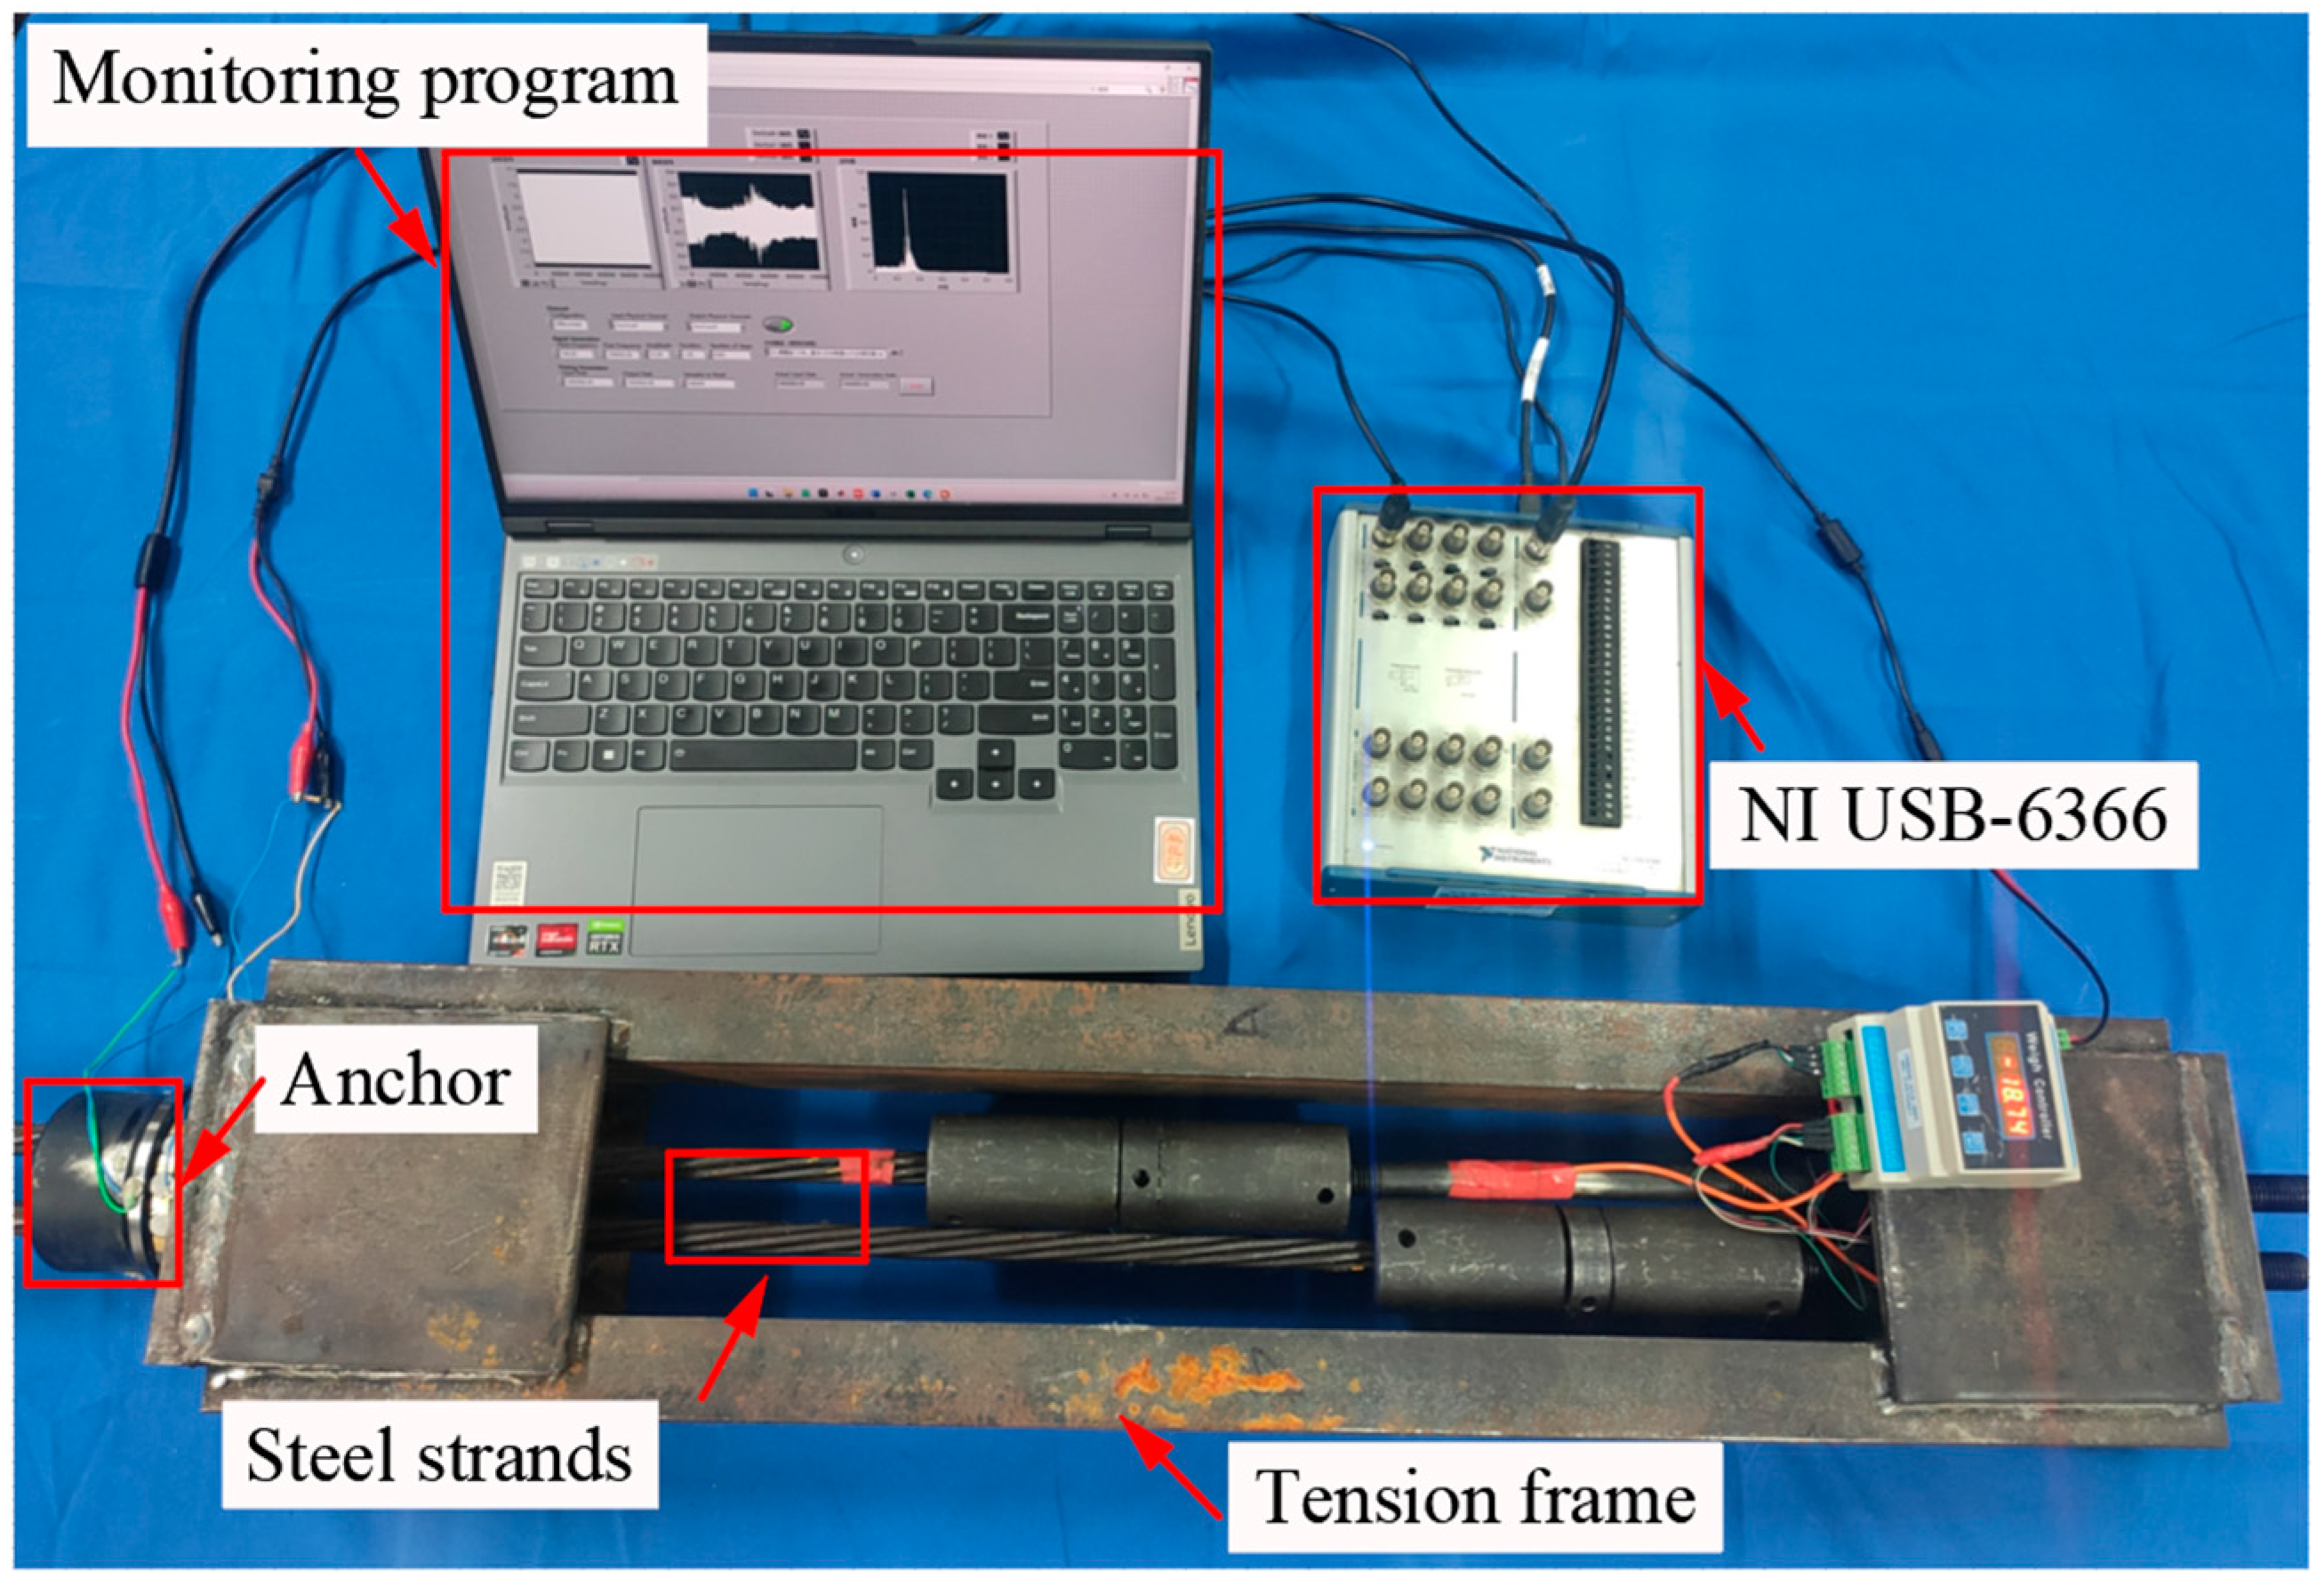
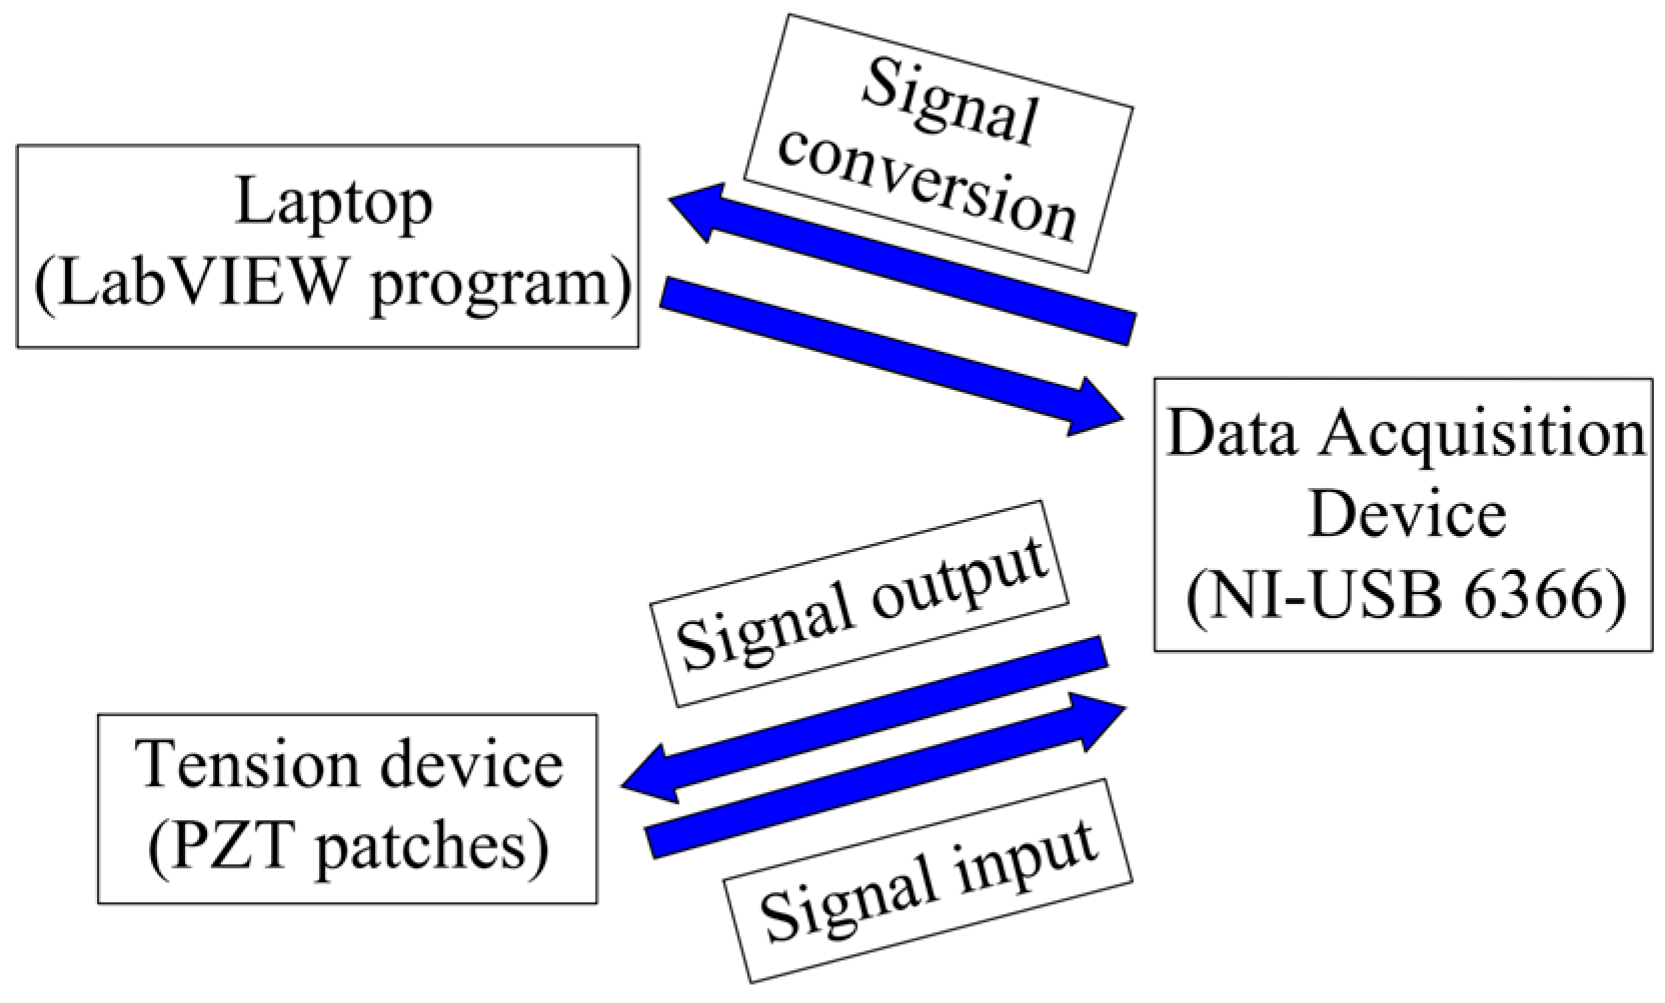
3. Experimental Setup

In order to verify the effectiveness of the proposed method, tension tests were carried out on steel strands with a specifically designed frame. The test involved two steel strands, a tension frame, a hydraulic jack, a laptop, and an NI multifunction data acquisition (DAQ) device (NI USB-6366). The overall test setup is illustrated in Figure 6. The circular two-hole anchor (YJM15-2) is used here, and its performance and technical indicators fully meet the requirements of the Chinese National Standard GB/T 14370-2007 [53]. The smart anchor washer was installed between the anchor and the tension frame. Two 1 mm thick PZT patches were utilized: one was attached to the upper annular cylinder as an actuator, and the other was attached to the lower annular cylinder as a receiver. They were used to emit and receive signals labeled PZT1 and PZT2, respectively.
The purpose of this paper is to address the issue of saturation in the energy transfer process. Therefore, the maximum tensile force is controlled at 18 tons, which is the designated value for the prestressed steel strand. This value effectively ensures early monitoring of the prestress levels in the strand. During the stretching process, a hollow hydraulic jack with a measuring range of 20 tons was used. The steel strands were stretched and tested at one-ton intervals, up to the controlled limit of 18 tons.
In order to verify the reproducibility of the experiment, a total of five tests were conducted. The signal transmission process of the PZT-based prestress monitoring system is shown in Figure 7. Signal conversion is realized between the LabView program on the laptop and the data acquisition device. Additionally, signal input and output are achieved between the data acquisition device and the PZT patches on the tension device. The specific operational process is as follows:
A laptop is used to control the transmission and reception of signals. First, the LabVIEW program on the laptop generated a linear sweep sine wave with a frequency range of 50 kHz to 1 MHz. According to the Shannon sampling theorem, the sampling rate should be greater than or equal to twice the highest frequency in the analog signal spectrum. Therefore, the sampling rate is set to 2 MHz. The NI USB-6366 converted it into an analog signal and then sent it to the PZT1. The signal was then transmitted via the contact interface to the lower annular cylinder and received by PZT2. The NI USB-6366 converted the received signal into a digital format, which was then saved and analyzed by the LabVIEW program. To ensure the independence of the test, the contact was fully disengaged at the end of each test by unloading the stress level to zero and turning off the power until the next test commenced.

4. Results and Discussion

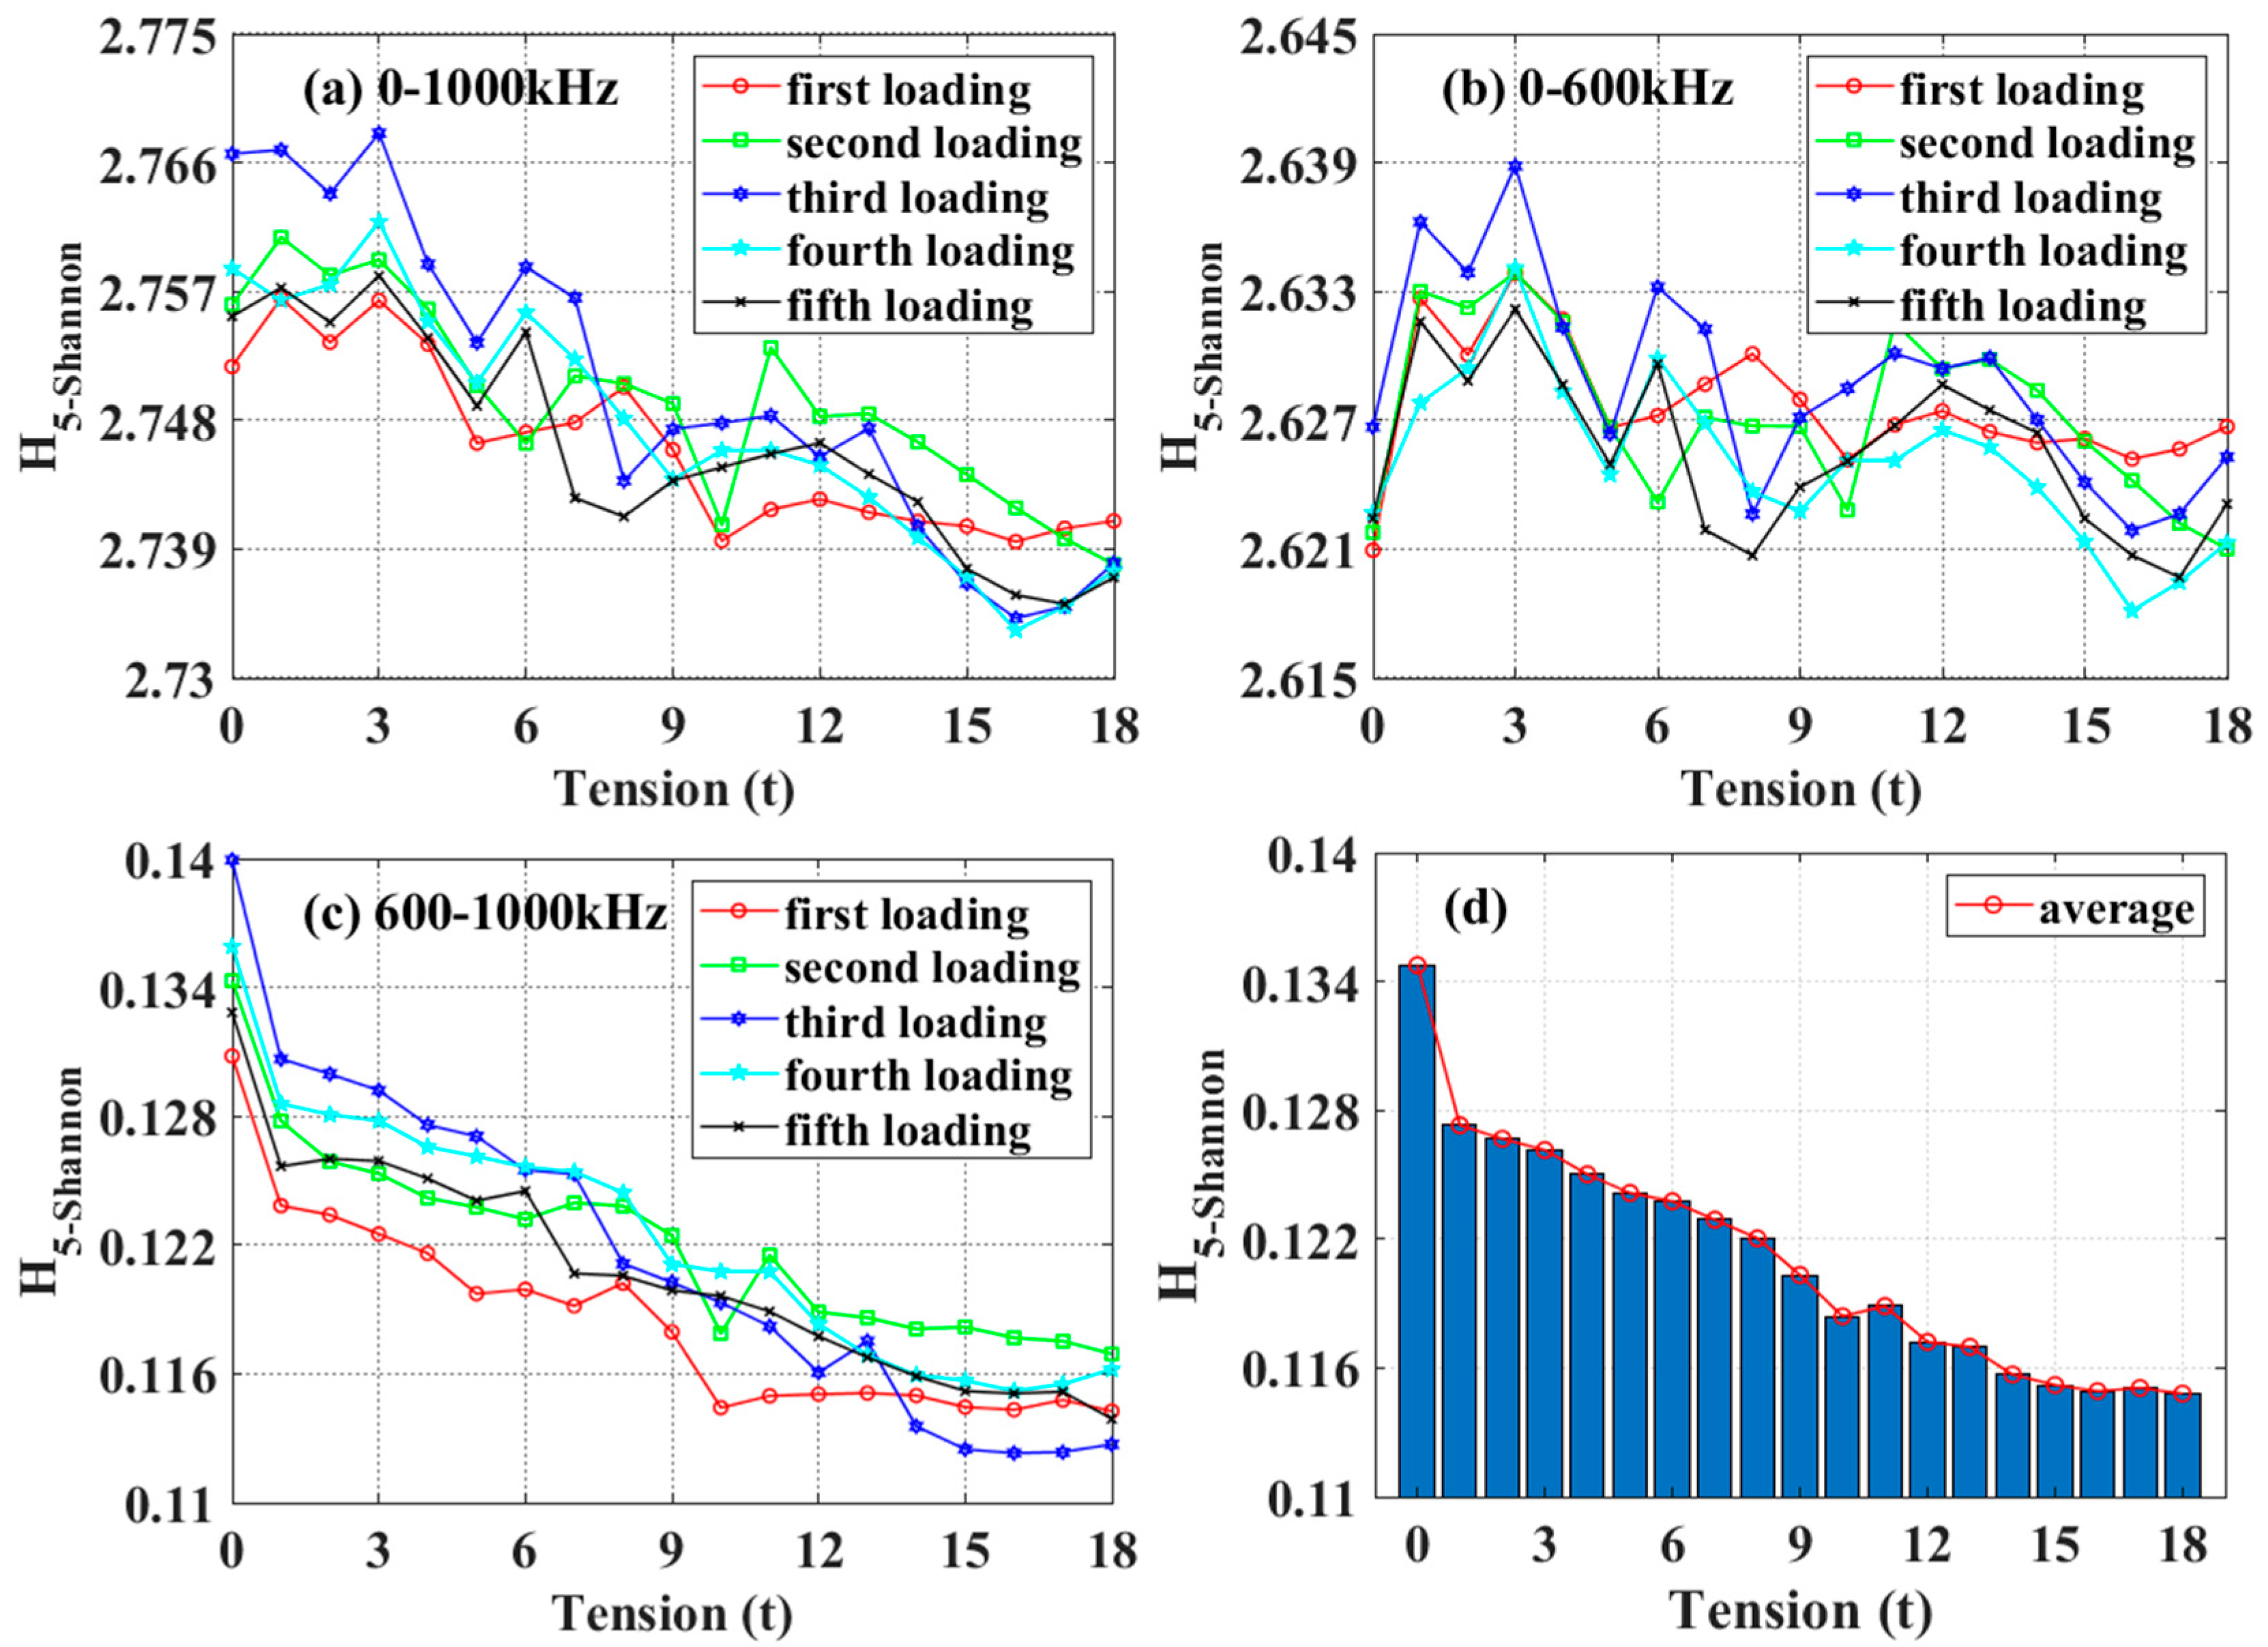
4.1. Processing of Raw Data

In the experiment, the tension force is controlled by the hydraulic jack. The tension forces for the five tests are presented in Table 1.
Due to the instability of oil pressure, the magnitude of each tension force varies slightly. The results of the fifth test, with tension forces of 4 t, 8 t, 12 t, and 16 t, are shown in Figure 8. As can be seen, the relationship between the received signals and the four tension scenarios of the prestressing force is not immediately apparent. The magnitude of prestress cannot be directly determined solely from the peak value of the received signal, and the peak value of each received signal does not occur at the same time. There are two possible reasons for this phenomenon: (1) different components of the wave have different propagation velocities (typically, lower energy components have higher velocities, and higher energy components have lower velocities); and (2) lower energy components may propagate directly to the sensor, while higher energy components may experience significant reflection and scattering at the interface before reaching the sensor. Therefore, we calculated and compared the signal energies for each tension case, as shown in Figure 9.
As described in Section 2.3, the signal received at each load level was subjected to wavelet packet decomposition. Appropriate decomposition layers can preserve the main features of the signal and reduce noise. As recommended by Wang et al. [54], the formula L = int[log(N)] is used to select the appropriate decomposition layer, where N represents the series length. The wavelet packet decomposition layer was set to 5. The energy value after decomposition at each load level was obtained by calculating Equation (14). The relationship between prestress levels and wavelet packet energy was then described, as shown in Figure 9a. When the tension force was small, the growth rate was high and gradually slowed down with an increase in force. In general, the signal energy increases as the tension force increases. This result is consistent with previous findings [35,38]. It can be explained by the fact that the energy of the transmitted wave is proportional to the contact area, and the actual contact area increases when greater tension is applied. However, it is worth noting that this increase is not monotonic. The energy value at 13 t, as measured in the third measurement, can clearly be identified as an outlier. This may be due to measurement distortion, so we have excluded it from further analysis.
Figure 9b shows the energy distribution of the frequency subbands present in the fifth layer after wavelet packet decomposition. It is evident that the energy of the signal between 0–600 kHz constitutes 98.5% of the total energy, with the majority concentrated around 100 kHz and 350 kHz. The energy of the signal with a frequency above 600 kHz accounts for only 1.5% of the total energy. This indicates that while the energy of the signal is widely distributed in the frequency domain, the high-frequency component of the signal is easily attenuated, and most of the signal’s energy is concentrated in the low-frequency part.
We processed the raw data in Figure 9a by using the signal energy at a tension of 0 tons as the reference point, in the form of an energy ratio. The relative energy ratio is illustrated in Figure 9c. It can be observed that the trends of the signal energy ratios are essentially the same. The values at the black circle markers in the figure may indicate interference from the equipment and environment during the acquisition process and are labeled as abnormal values. Therefore, in the subsequent analysis, we use the average energy ratio of other measurement curves to replace it.

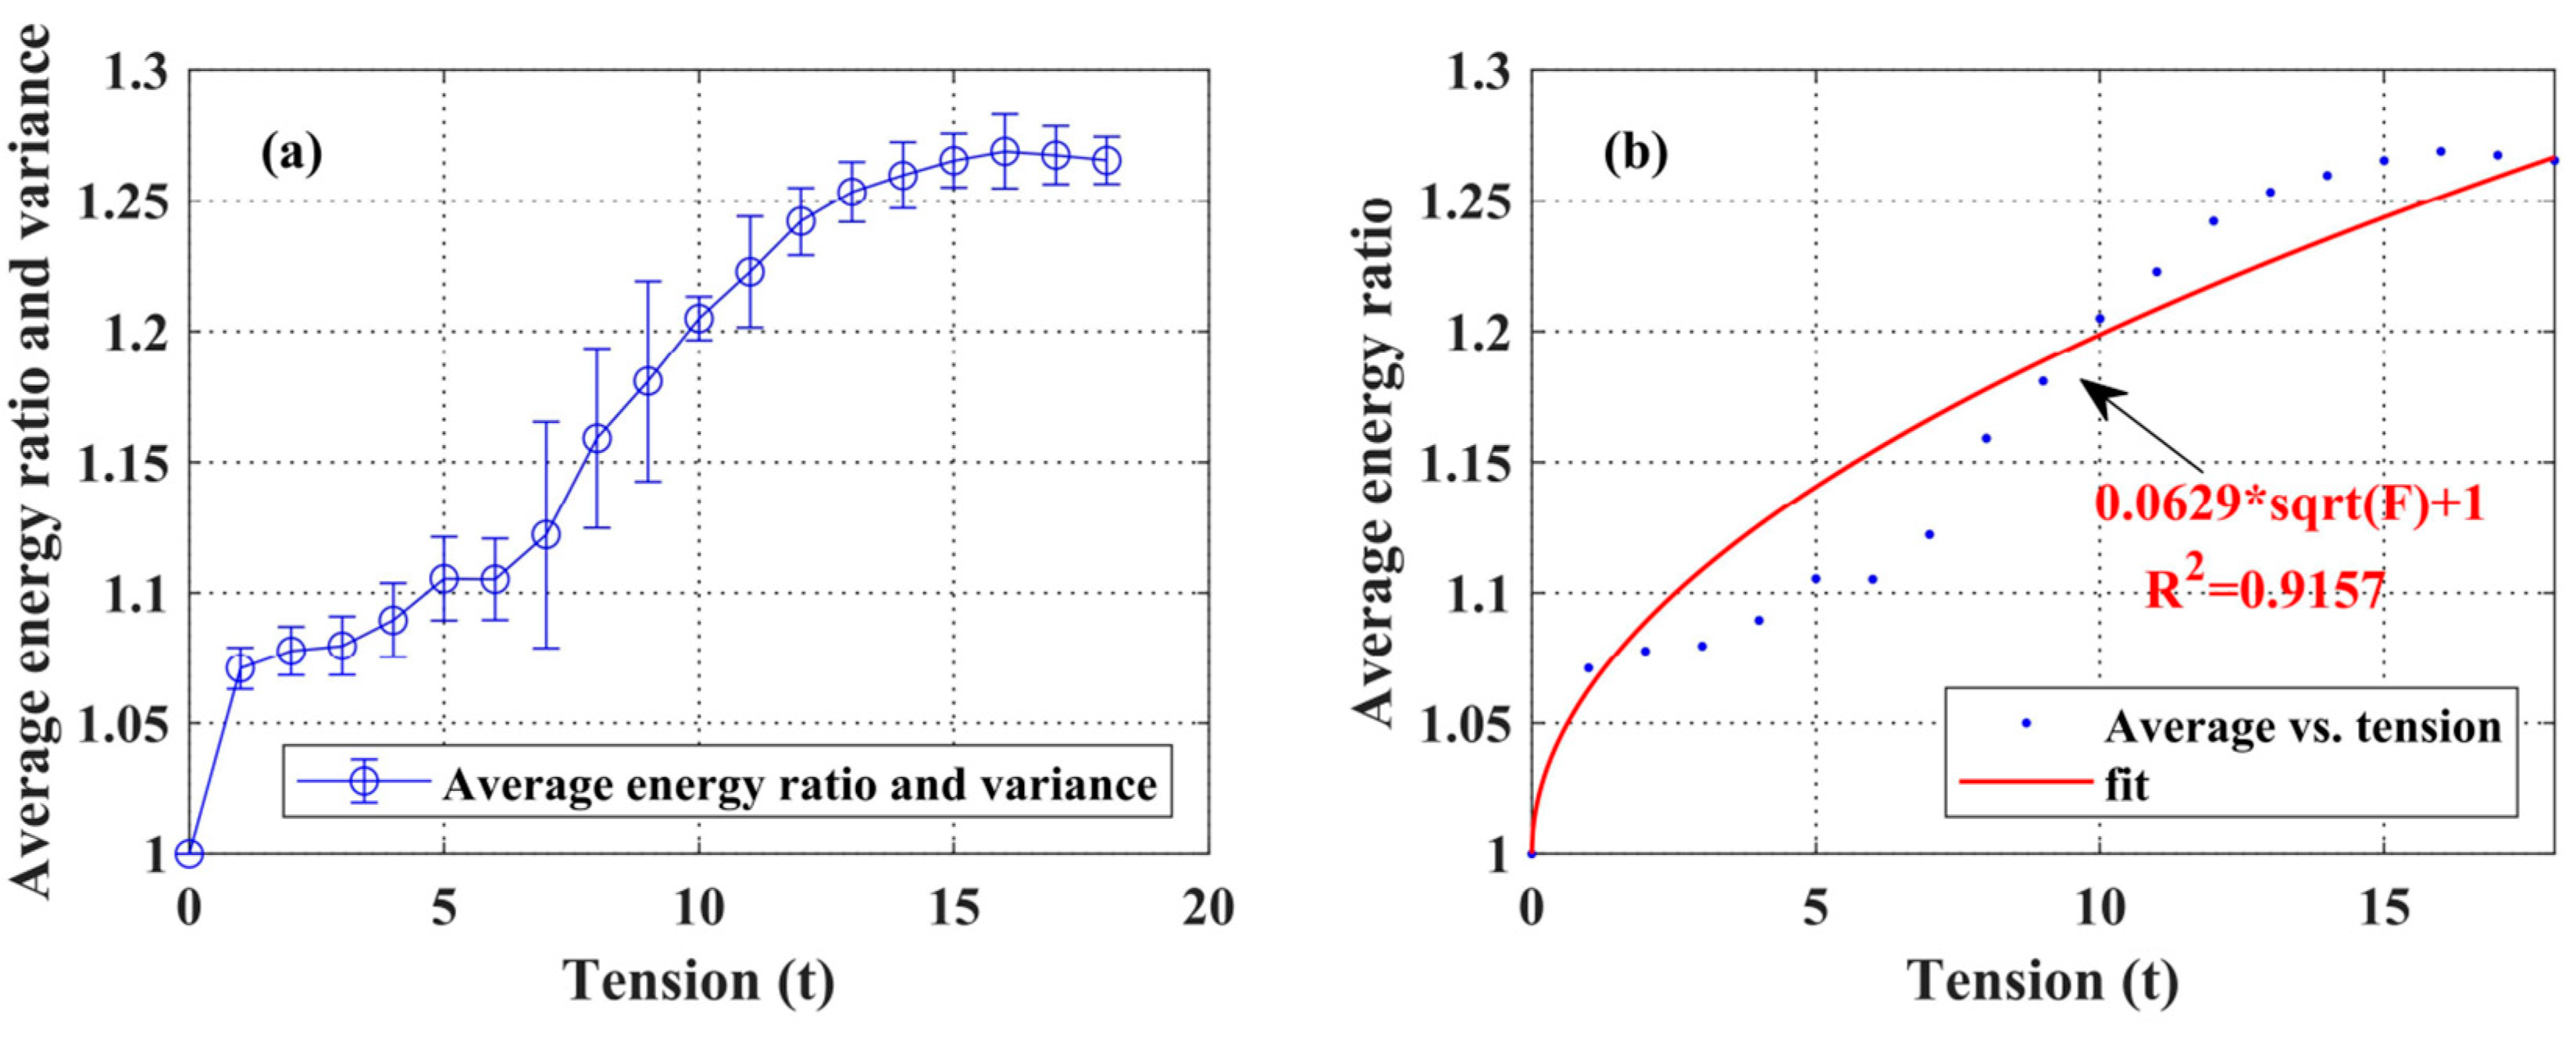
4.2. Data Fitting and the Index

The energy values of the five tests were averaged, and their mean value and standard deviation were obtained, as shown in Figure 10a. As the tension increases, the energy value gradually increases. Before the tension reaches 10 tons, the energy value increases continuously. Although the tension value fluctuates after 10 tons, the curve still exhibits a consistent upward trend. The mean energy value is fitted, as shown in Figure 10b. The fitted curve demonstrates that the magnitude of the energy value is directly proportional to the square root of the tension. As expected, it is in good agreement with Equation (9), and the R-squared value of the fit is 0.9157. However, it is evident from the fitted curves that the test results for 2–9 tons are lower, while the test results for 11–17 tons are higher. This discrepancy may be affected by the accuracy of the testing equipment and environmental interference. The aim of this paper is to propose a practical and universal testing method. The details will be further refined and optimized to enhance testing accuracy in the future.
Finally, an index H5-Shannon for prestress monitoring was introduced by calculating the Shannon entropy using Equations (15) and (16). The results of five tests are shown in Figure 11. Figure 11a–c display the results of the Shannon entropy for the entire frequency range (0–1000 kHz), the low-frequency range (0–600 kHz), and the high-frequency range (600–1000 kHz) calculated for the five trials, respectively. It can be observed that the entropy results in the low-frequency range (Figure 11b) exhibit more random fluctuations, while the entropy results in the high-frequency range (Figure 11c) demonstrate good linearity. This is due to the shorter wavelength of the high-frequency component of the signal, which enables it to better avoid external interference and provides strong anti-interference capability. Therefore, we utilized the entropy results calculated in the high-frequency range as an index, and the results obtained after processing its mean value are depicted in Figure 11d.
As shown in Figure 11d, H5-Shannon was high at low tension, implying high prestressing force, and low at high tension, indicating low prestressing force. There is a good linear relationship between the index and the prestressing force. The conclusion shows that as the tension increases, the index gradually decreases, indicating that the prestress system is more stable. The tension force in this paper reached 18 tons, which far exceeded the 16,256 N tested by Zhang et al. [46]. However, it should be noted that the inevitable interference of surrounding environmental factors affected the resulting curve for each tension level, causing some degree of fluctuation. Nevertheless, the Shannon entropy and tension force followed a linear trend, with resolution even at high force levels, making it suitable for monitoring early prestressing force.

5. Conclusions

In this paper, we propose a smart washer and prestressing force index for monitoring the prestressing force of steel strands. The problem of energy saturation was effectively mitigated by installing a smart anchor washer on the anchor. During prestress tension tests, PZT patches were used on the upper and lower annular cylinders to excite and receive signals transmitted through the contact interface. The received signals were quantized using wavelet packet decomposition. It is evident from the results that as the tension force increases, the energy of the received signal also increases. This finding aligns with the theory that relates the passing wave to the contact area. The degree of prestressing force was successfully evaluated by using Shannon entropy extracted from the signal as the prestressing force index. The proposed method is low-cost, simple, and feasible, and it allows for the monitoring of prestressing force in steel strands. It should be noted that the method presented here is only applicable to anchored prestressing force in post-tensioned anchorage systems and is not applicable to any general location along the layout of prestressing tendons. The significant variation in test results may be attributed to the control of tension force during the test and the design precision of the smart anchor washer. Based on the method proposed in this paper, the testing accuracy is expected to be further improved in the future. Furthermore, the research will focus on analyzing the difference in prestress in each steel strand using an array of PZT transducers.

Author Contributions

Conceptualization, L.W. and L.Z.; methodology, L.W.; software, L.W.; validation, L.W., L.Z. and D.M.; formal analysis, D.M.; investigation, L.W.; resources, X.W.; data curation, D.M.; writing—original draft preparation, L.W.; writing—review and editing, L.W.; visualization, L.W.; supervision, L.Z.; project administration, X.W.; funding acquisition, L.Z. All authors have read and agreed to the published version of the manuscript.

Funding

This research received no external funding.

Institutional Review Board Statement

Not applicable.

Informed Consent Statement

Not applicable.

Data Availability Statement

All data that support the findings of this study are included within the article.

Conflicts of Interest

The authors declare no conflicts of interest.

References

  1. Dai, L.; Bian, H.; Wang, L.; Potier-Ferry, M.; Zhang, J. Prestress Loss Diagnostics in Pretensioned Concrete Structures with Corrosive Cracking. J. Struct. Eng. 2020, 146, 4020013. [Google Scholar] [CrossRef]
  2. Biswal, S.; Ramaswamy, A. Uncertainty Based Model Averaging for Prediction of Long-Time Prestress Losses in Concrete Structures. Constr. Build. Mater. 2017, 153, 469–480. [Google Scholar] [CrossRef]
  3. Kral’ovanec, J.; Prokop, J. Indirect Methods for Determining the State of Prestressing. Transp. Res. Procedia 2021, 55, 1236–1243. [Google Scholar] [CrossRef]
  4. Au, F.T.K.; Si, X.T. Accurate Time-Dependent Analysis of Concrete Bridges Considering Concrete Creep, Concrete Shrinkage and Cable Relaxation. Eng. Struct. 2011, 33, 118–126. [Google Scholar] [CrossRef]
  5. Zhang, W.; Yuan, X.; Yang, L.; Deng, M. Research on Creep Constitutive Model of Steel Cables. Constr. Build. Mater. 2020, 246, 118481. [Google Scholar] [CrossRef]
  6. Pirskawetz, S.M.; Schmidt, S. Detection of Wire Breaks in Prestressed Concrete Bridges by Acoustic Emission Analysis. Dev. Built Environ. 2023, 14, 100151. [Google Scholar] [CrossRef]
  7. Abdel-Jaber, H.; Glisic, B. Monitoring of Prestressing Forces in Prestressed Concrete Structures—An Overview. Struct. Control Health Monit. 2019, 26, e2374. [Google Scholar] [CrossRef]
  8. Fabo, P.; Jarosevic, A.; Chandoga, M. Health Monitoring of the Steel Cables Using the Elasto-Magnetic Method. In Proceedings of the ASME International Mechanical Engineering Congress and Exposition, New Orleans, LA, USA, 17–22 November 2002; ASME: New York, NY, USA, 2002; Volume 36258, pp. 295–299. [Google Scholar]
  9. Yim, J.; Wang, M.L.; Shin, S.W.; Yun, C.-B.; Jung, H.-J.; Kim, J.-T.; Eem, S.-H. Field Application of Elasto-Magnetic Stress Sensors for Monitoring of Cable Tension Force in Cable-Stayed Bridges. Smart Struct. Syst. 2013, 12, 465–482. [Google Scholar] [CrossRef]
  10. Rizzo, P.; di Scalea, F. Wave Propagation in Multi-Wire Strands by Wavelet-Based Laser Ultrasound. Exp. Mech. 2004, 44, 407–415. [Google Scholar] [CrossRef]
  11. Rizzo, P. Ultrasonic Wave Propagation in Progressively Loaded Multi-Wire Strands. Exp. Mech. 2006, 46, 297–306. [Google Scholar] [CrossRef]
  12. Dan, D.; Jia, P.; Li, G.; Niu, P. Experimental Study on Mechanical and Sensing Properties of Smart Composite Prestressed Tendon. Materials 2018, 11, 2087. [Google Scholar] [CrossRef] [PubMed]
  13. Sumitro, S.; Kurokawa, S.; Shimano, K.; Wang, M.L. Monitoring Based Maintenance Utilizing Actual Stress Sensory Technology. Smart Mater. Struct. 2005, 14, S68. [Google Scholar] [CrossRef]
  14. Halvonik, J.; Dolnak, J.; Borzovič, V. Long-Term Losses of Prestress in Precast Members Cast from HPC. Procedia Eng. 2013, 65, 81–86. [Google Scholar] [CrossRef]
  15. Kleitsa, D.; Kawai, K.; Shiotani, T.; Aggelis, D.G. Assessment of Metal Strand Wire Pre-Stress in Anchor Head by Ultrasonics. NDT E Int. 2010, 43, 547–554. [Google Scholar] [CrossRef]
  16. Yan, S.; Ma, H.; Li, P.; Song, G.; Wu, J. Development and Application of a Structural Health Monitoring System Based on Wireless Smart Aggregates. Sensors 2017, 17, 1641. [Google Scholar] [CrossRef] [PubMed]
  17. Liao, W.-I.; Wang, J.X.; Song, G.; Gu, H.; Olmi, C.; Mo, Y.L.; Chang, K.C.; Loh, C.H. Structural Health Monitoring of Concrete Columns Subjected to Seismic Excitations Using Piezoceramic-Based Sensors. Smart Mater. Struct. 2011, 20, 125015. [Google Scholar] [CrossRef]
  18. Agrawal, B.N.; Elshafei, M.A.; Song, G. Adaptive Antenna Shape Control Using Piezoelectric Actuators. Acta Astronaut. 1997, 40, 821–826. [Google Scholar] [CrossRef]
  19. Xu, B.; Zhang, T.; Song, G.; Gu, H. Active Interface Debonding Detection of a Concrete-Filled Steel Tube with Piezoelectric Technologies Using Wavelet Packet Analysis. Mech. Syst. Signal Process. 2013, 36, 7–17. [Google Scholar] [CrossRef]
  20. Kong, Q.; Fan, S.; Bai, X.; Mo, Y.L.; Song, G. A Novel Embeddable Spherical Smart Aggregate for Structural Health Monitoring: Part I. Fabrication and Electrical Characterization. Smart Mater. Struct. 2017, 26, 95050. [Google Scholar] [CrossRef]
  21. Li, N.; Wang, F.; Song, G. New Entropy-Based Vibro-Acoustic Modulation Method for Metal Fatigue Crack Detection: An Exploratory Study. Measurement 2020, 150, 107075. [Google Scholar] [CrossRef]
  22. Kong, Q.; Hou, S.; Ji, Q.; Mo, Y.L.; Song, G. Very Early Age Concrete Hydration Characterization Monitoring Using Piezoceramic Based Smart Aggregates. Smart Mater. Struct. 2013, 22, 85025. [Google Scholar] [CrossRef]
  23. Kong, Q.; Song, G. A Comparative Study of the Very Early Age Cement Hydration Monitoring Using Compressive and Shear Mode Smart Aggregates. IEEE Sens. J. 2016, 17, 256–260. [Google Scholar] [CrossRef]
  24. Zhou, L.; Zheng, Y.; Song, G.; Chen, D.; Ye, Y. Identification of the Structural Damage Mechanism of BFRP Bars Reinforced Concrete Beams Using Smart Transducers Based on Time Reversal Method. Constr. Build. Mater. 2019, 220, 615–627. [Google Scholar] [CrossRef]
  25. Kong, Q.; Robert, R.H.; Silva, P.; Mo, Y.L. Cyclic Crack Monitoring of a Reinforced Concrete Column under Simulated Pseudo-Dynamic Loading Using Piezoceramic-Based Smart Aggregates. Appl. Sci. 2016, 6, 341. [Google Scholar] [CrossRef]
  26. Wang, F.; Chen, Z.; Song, G. Monitoring of Multi-Bolt Connection Looseness Using Entropy-Based Active Sensing and Genetic Algorithm-Based Least Square Support Vector Machine. Mech. Syst. Signal Process. 2020, 136, 106507. [Google Scholar] [CrossRef]
  27. Huo, L.; Chen, D.; Kong, Q.; Li, H.; Song, G. Smart Washer—A Piezoceramic-Based Transducer to Monitor Looseness of Bolted Connection. Smart Mater. Struct. 2017, 26, 25033. [Google Scholar] [CrossRef]
  28. Gu, H.; Song, G.; Dhonde, H.; Mo, Y.L.; Yan, S. Concrete Early-Age Strength Monitoring Using Embedded Piezoelectric Transducers. Smart Mater. Struct. 2006, 15, 1837. [Google Scholar] [CrossRef]
  29. Chen, J.; Li, P.; Song, G.; Ren, Z. Piezo-Based Wireless Sensor Network for Early-Age Concrete Strength Monitoring. Optik 2016, 127, 2983–2987. [Google Scholar] [CrossRef]
  30. Sharma, S.; Mukherjee, A. Monitoring Freshly Poured Concrete Using Ultrasonic Waves Guided through Reinforcing Bars. Cem. Concr. Compos. 2015, 55, 337–347. [Google Scholar] [CrossRef]
  31. Kocherla, A.; Duddi, M.; Subramaniam, K.V.L. Embedded PZT Sensors for Monitoring Formation and Crack Opening in Concrete Structures. Measurement 2021, 182, 109698. [Google Scholar] [CrossRef]
  32. Zhang, H.; Wang, L.; Li, J.; Kang, F. Embedded PZT Aggregates for Monitoring Crack Growth and Predicting Surface Crack in Reinforced Concrete Beam. Constr. Build. Mater. 2023, 364, 129979. [Google Scholar] [CrossRef]
  33. Wang, T.; Song, G.; Wang, Z.; Li, Y. Proof-of-Concept Study of Monitoring Bolt Connection Status Using a Piezoelectric Based Active Sensing Method. Smart Mater. Struct. 2013, 22, 87001. [Google Scholar] [CrossRef]
  34. Tao, W.; Shaopeng, L.; Junhua, S.; Yourong, L. Health Monitoring of Bolted Joints Using the Time Reversal Method and Piezoelectric Transducers. Smart Mater. Struct. 2016, 25, 25010. [Google Scholar] [CrossRef]
  35. Huo, L.; Wang, F.; Li, H.; Song, G. A Fractal Contact Theory Based Model for Bolted Connection Looseness Monitoring Using Piezoceramic Transducers. Smart Mater. Struct. 2017, 26, 104010. [Google Scholar] [CrossRef]
  36. Greenwood, J.A.; Williamson, J.B.P. Contact of Nominally Flat Surfaces. Proc. R. Soc. London Ser. A. Math. Phys. Sci. 1966, 295, 300–319. [Google Scholar]
  37. Majumdar, A.; Bhushan, B. Fractal Model of Elastic-Plastic Contact between Rough Surfaces. J. Tribol. 1991, 113, 1–11. [Google Scholar] [CrossRef]
  38. Wang, F.; Huo, L.; Song, G. A Piezoelectric Active Sensing Method for Quantitative Monitoring of Bolt Loosening Using Energy Dissipation Caused by Tangential Damping Based on the Fractal Contact Theory. Smart Mater. Struct. 2017, 27, 15023. [Google Scholar] [CrossRef]
  39. Kim, J.-Y.; Lee, J.-S. A Micromechanical Model for Nonlinear Acoustic Properties of Interfaces between Solids. J. Appl. Phys. 2007, 101, 43501. [Google Scholar] [CrossRef]
  40. Broda, D.; Staszewski, W.J.; Martowicz, A.; Uhl, T.; Silberschmidt, V. V Modelling of Nonlinear Crack--Wave Interactions for Damage Detection Based on Ultrasound—A Review. J. Sound Vib. 2014, 333, 1097–1118. [Google Scholar] [CrossRef]
  41. Zhang, Z.; Liu, M.; Su, Z.; Xiao, Y. Quantitative Evaluation of Residual Torque of a Loose Bolt Based on Wave Energy Dissipation and Vibro-Acoustic Modulation: A Comparative Study. J. Sound Vib. 2016, 383, 156–170. [Google Scholar] [CrossRef]
  42. Wang, F.; Song, G. Bolt Early Looseness Monitoring Using Modified Vibro-Acoustic Modulation by Time-Reversal. Mech. Syst. Signal Process. 2019, 130, 349–360. [Google Scholar] [CrossRef]
  43. Wang, F.; Ho, S.C.M.; Song, G. Monitoring of Early Looseness of Multi-Bolt Connection: A New Entropy-Based Active Sensing Method without Saturation. Smart Mater. Struct. 2019, 28, 10LT01. [Google Scholar] [CrossRef]
  44. Jiang, J.; Chen, Y.; Dai, J.; Liang, Y. Multi-Bolt Looseness State Monitoring Using the Recursive Analytic Based Active Sensing Technique. Measurement 2022, 191, 110779. [Google Scholar] [CrossRef]
  45. Zhang, X.; Zhang, L.; Liu, L.; Huo, L. Prestress Monitoring of a Steel Strand in an Anchorage Connection Using Piezoceramic Transducers and Time Reversal Method. Sensors 2018, 18, 4018. [Google Scholar] [CrossRef] [PubMed]
  46. Zhang, X.; Zhang, L.; Liu, L.; Huo, L. Tension Monitoring of Wedge Connection Using Piezoceramic Transducers and Wavelet Packet Analysis Method. Sensors 2020, 20, 364. [Google Scholar] [CrossRef] [PubMed]
  47. Esteban, J.; Rogers, C.A. Energy Dissipation through Joints: Theory and Experiments. Comput. Struct. 2000, 75, 347–359. [Google Scholar] [CrossRef]
  48. Popov, V.L. Contact Mechanics and Friction; Springer: Berlin/Heidelberg, Germany, 2010. [Google Scholar]
  49. Zhou, H.; He, Z.; Sun, L.; Zhang, D.; Zhou, H.; Li, X. Improved Power Normalized Cepstrum Coefficient Based on Wavelet Packet Decomposition for Trunk Borer Detection in Harsh Acoustic Environment. Appl. Sci. 2021, 11, 2236. [Google Scholar] [CrossRef]
  50. Rioul, O. This Is IT: A Primer on Shannon’s Entropy and Information. In Information Theory: Poincaré Seminar 2018; Duplantier, B., Rivasseau, V., Eds.; Springer International Publishing: Cham, Switzerland, 2021; pp. 49–86. ISBN 978-3-030-81480-9. [Google Scholar]
  51. Rizal, A.; Hidayat, R.; Nugroho, H.A. Comparison of Multilevel Wavelet Packet Entropy Using Various Entropy Measurement for Lung Sound Classification. Int. J. Adv. Comput. Sci. Appl. 2019, 10, 77–82. [Google Scholar] [CrossRef]
  52. Tu, W.; Zhong, S.; Zhang, Q.; Shen, Y.; Incecik, A. Quality Evaluation of Organic Protective Paints Using Terahertz Pulse Imaging Technology Based on Wavelet Packet Energy Method. Ocean Eng. 2023, 267, 113282. [Google Scholar] [CrossRef]
  53. GB/T 14370-2007; Anchorage, Grip and Coupler for Prestressing Tendons. Chinese Standard: Beijing, China, 2007.
  54. Wang, W.; Ding, J. Wavelet Network Model and Its Application to the Prediction of Hydrology. Nat. Sci. 2003, 1, 67–71. [Google Scholar]
Figure 1. Schematic diagram of the smart anchor washer.
Applsci 14 00641 g001
Figure 2. Installation diagram of the smart anchor washer.
Applsci 14 00641 g002
Figure 3. Schematic diagram of Hertz contact between cylinder and plane.
Applsci 14 00641 g003
Figure 4. Wavelet packet decomposition diagram.
Applsci 14 00641 g004
Figure 5. Flow diagram of the calculation.
Applsci 14 00641 g005
Figure 6. The overall layout of the test.
Applsci 14 00641 g006
Figure 7. Signal transmission process.
Applsci 14 00641 g007
Figure 8. Received signal results of the fifth test: (a) 4 t; (b) 8 t; (c) 12 t; (d) 16 t.
Applsci 14 00641 g008
Figure 9. (a) The relationship between prestress levels and wavelet packet energy; (b) the proportion of energy in each frequency subband; and (c) the relationship between prestress levels and energy ratio.
Applsci 14 00641 g009
Figure 10. (a) The average energy ratio and standard deviation of the five tests, and (b) the fitted curve of the average.
Applsci 14 00641 g010
Figure 11. The index H5-Shannon for prestress monitoring: (a) entire frequency range (0–1000 kHz), (b) low-frequency range (0–600 kHz), (c) high-frequency range (600–1000 kHz), and (d) average value of the high-frequency range.
Applsci 14 00641 g011
Table 1. The tension force of 5 tests.
Number of TestsTension Force (t)
12345678910
1st01.2232.0072.9624.0505.2026.0137.0558.0109.005
2nd00.9121.7482.8703.8284.9765.9876.8428.0848.902
3rd01.3411.9312.9614.0765.0266.0707.0377.9568.986
4th00.7741.8702.9293.9815.0416.0147.1118.1048.979
5th01.5262.1993.4884.3425.4636.4037.3888.3469.440
Number of TestsTension Force (t)
111213141516171819
1st10.11011.08512.03313.21014.17515.27516.07017.14018.010
2nd9.79210.78212.07712.92713.80714.93715.81416.86317.917
3rd10.01111.01112.19112.99114.00615.01416.01117.13117.969
4th9.87411.07111.95213.06414.03714.94516.15916.93518.006
5th10.34511.38212.26113.26414.40115.36116.39617.23818.306
Disclaimer/Publisher’s Note: The statements, opinions and data contained in all publications are solely those of the individual author(s) and contributor(s) and not of MDPI and/or the editor(s). MDPI and/or the editor(s) disclaim responsibility for any injury to people or property resulting from any ideas, methods, instructions or products referred to in the content.

