
Real-Time Protozoa Detection from Microscopic Imaging Using YOLOv4 Algorithm


Abstract
1. Introduction
2. Methodology
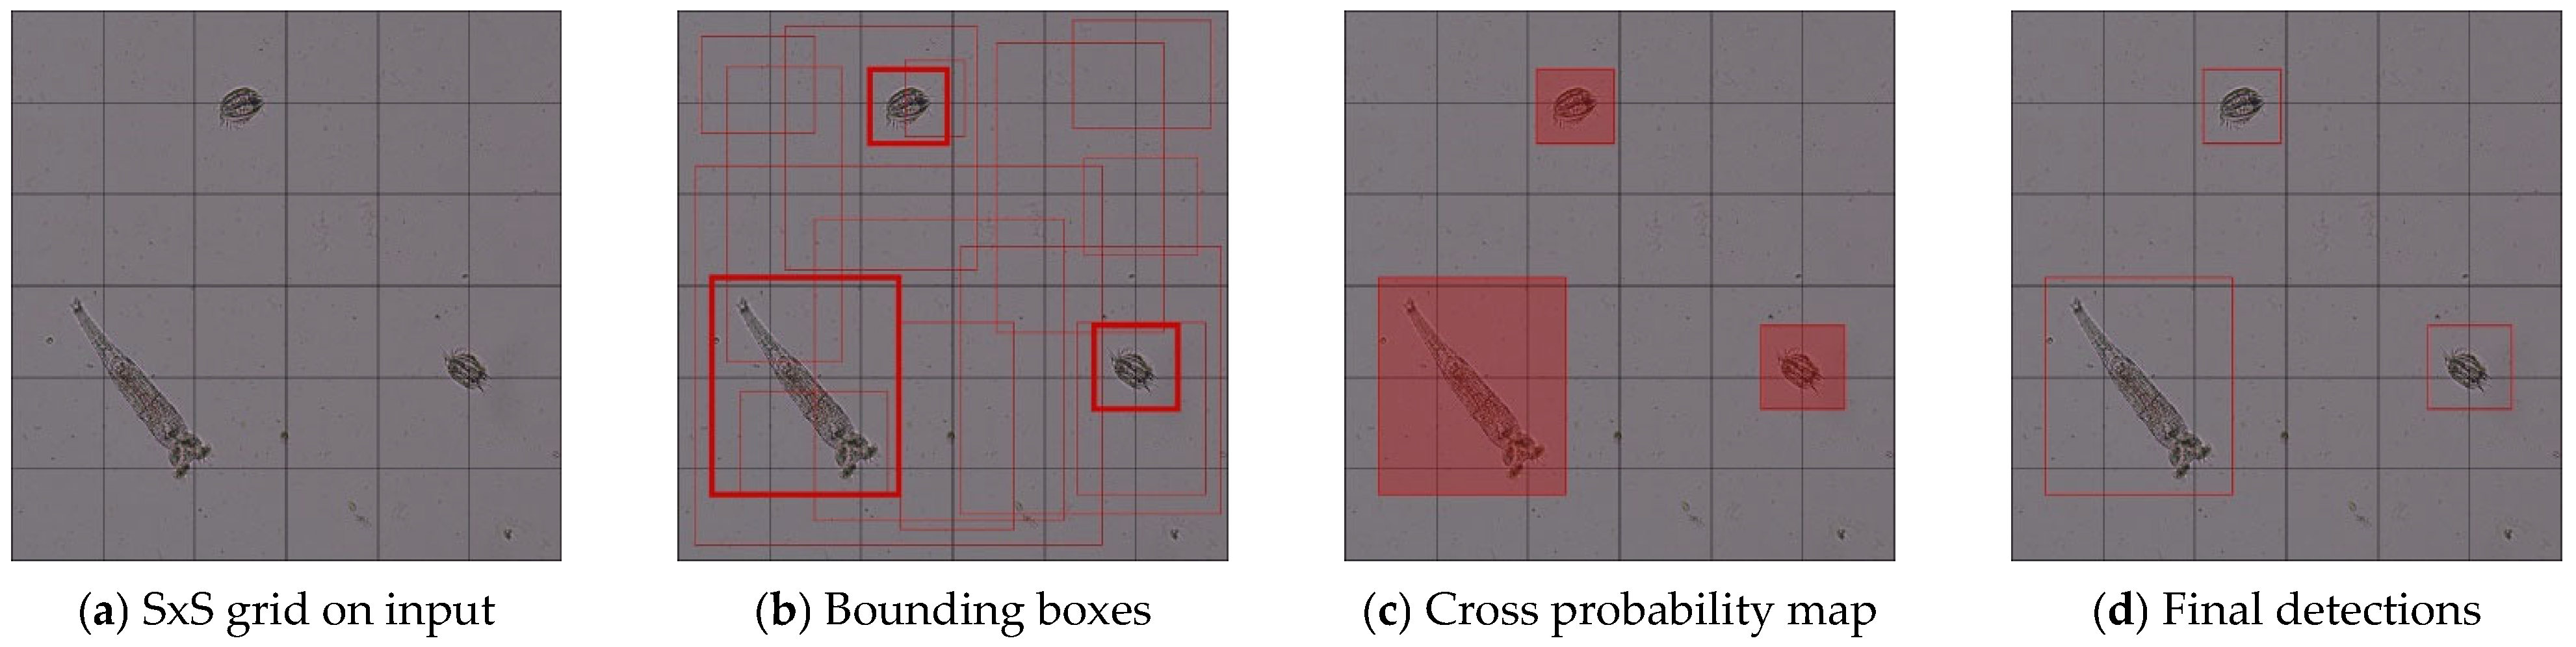
2.1. YOLO (You Only Look Once)
2.2. Detector
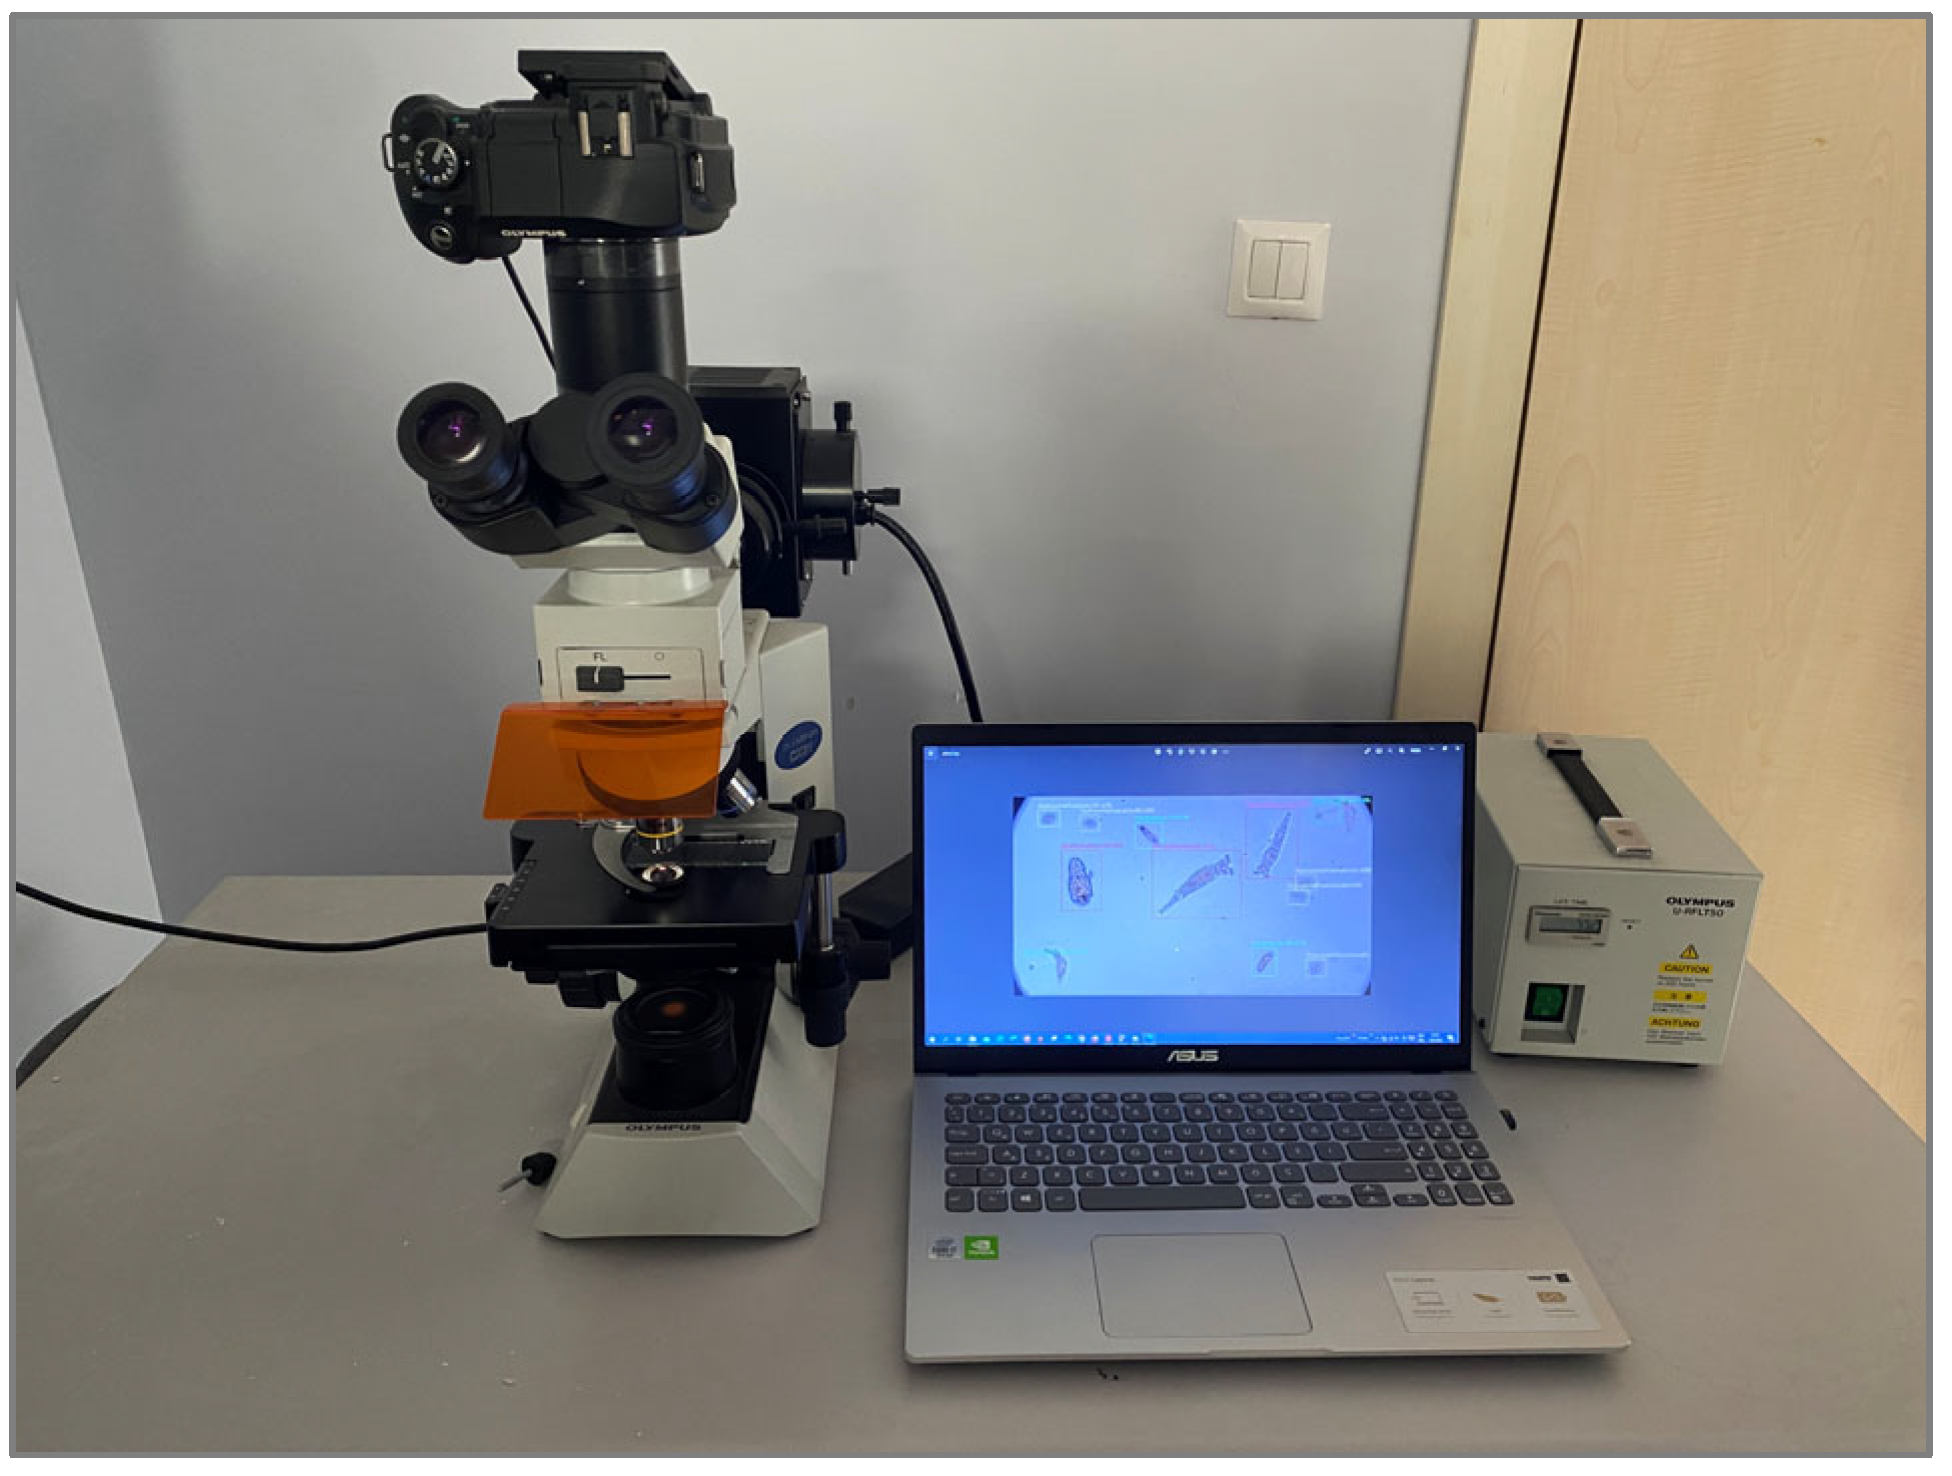
3. Experiment
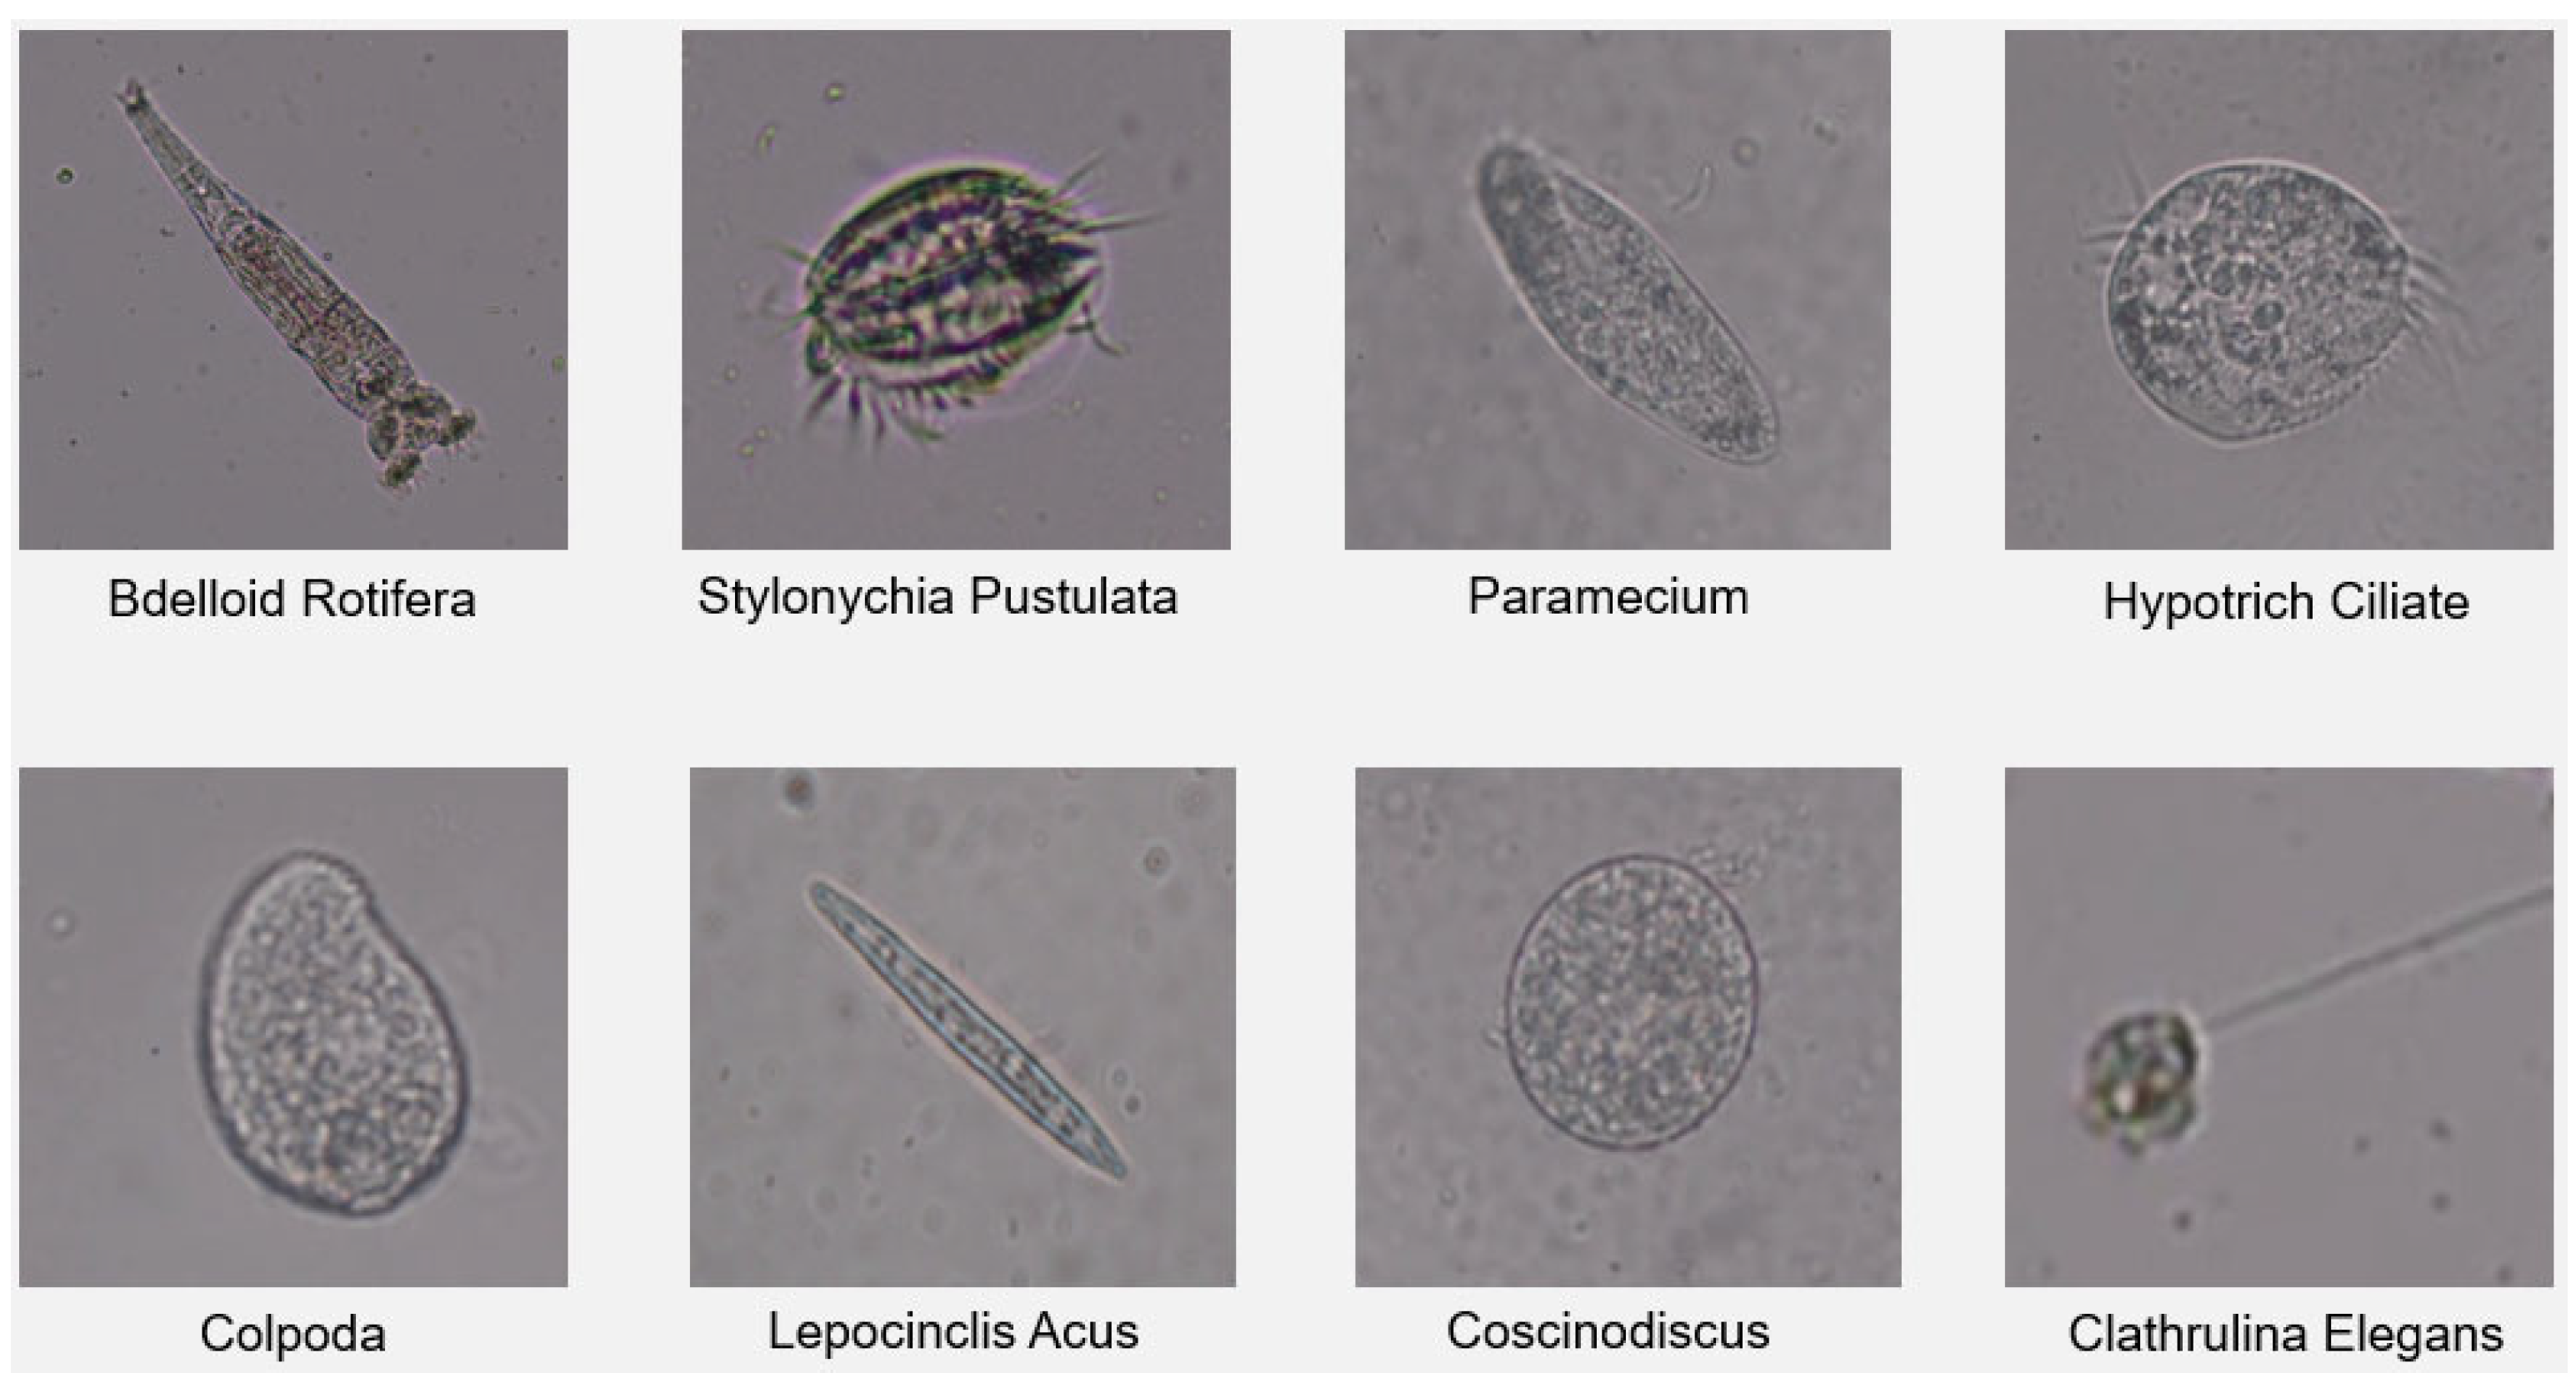
3.1. Data Set Preparation
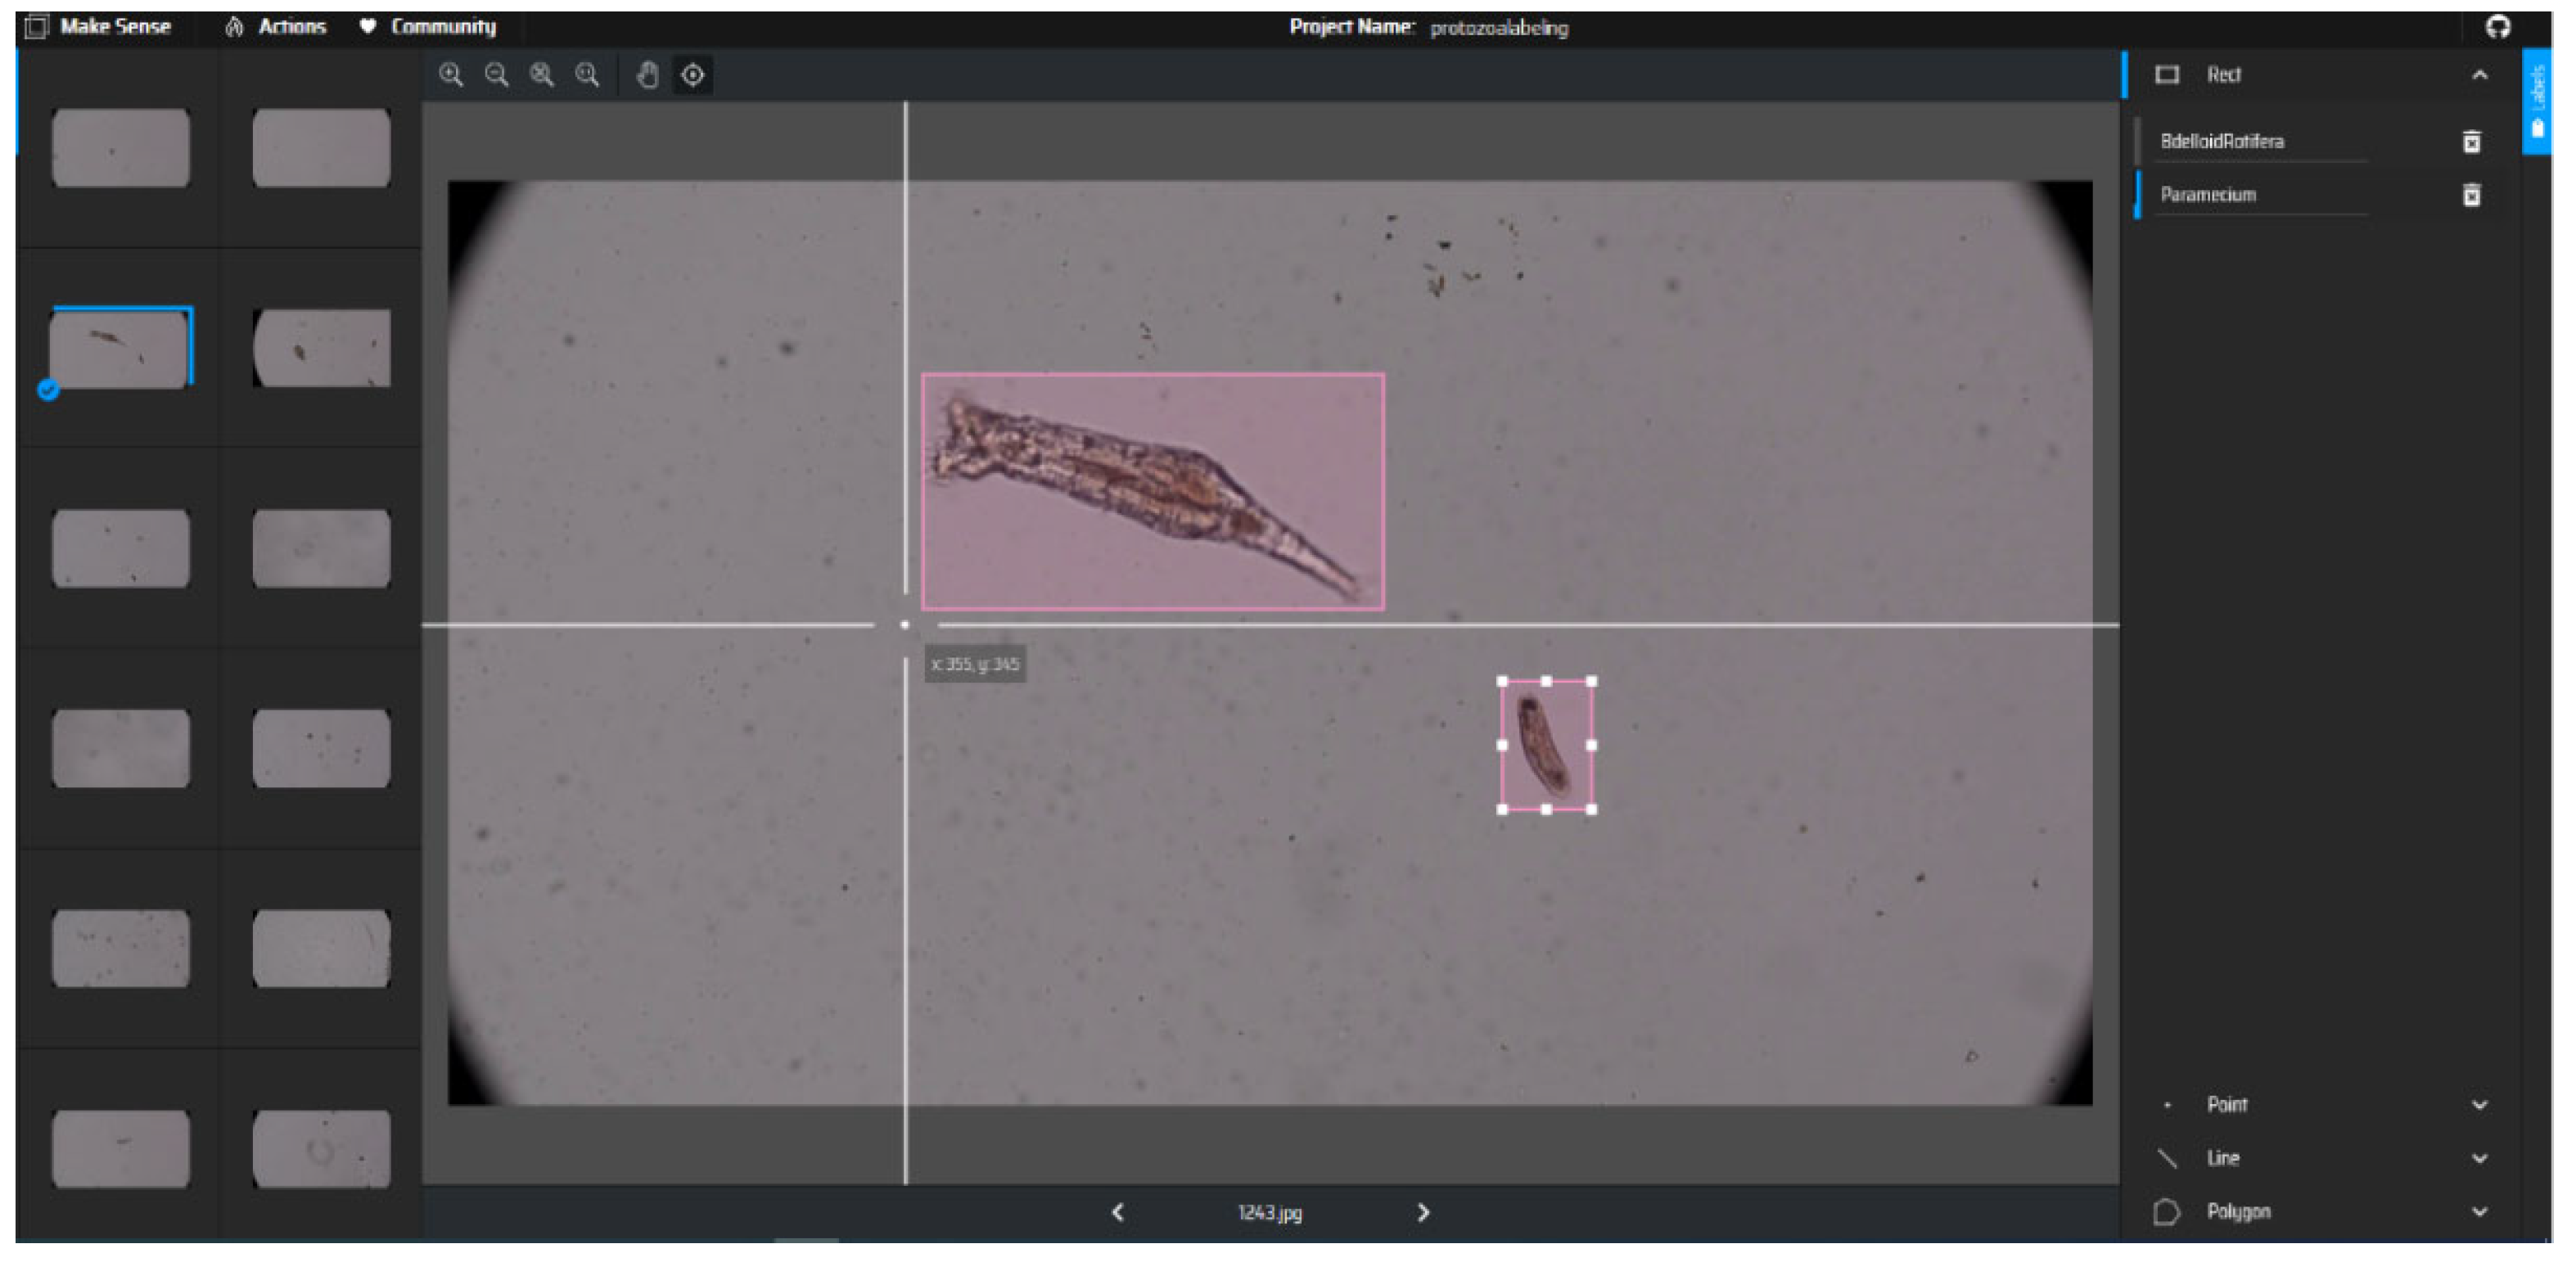
3.2. Labeling
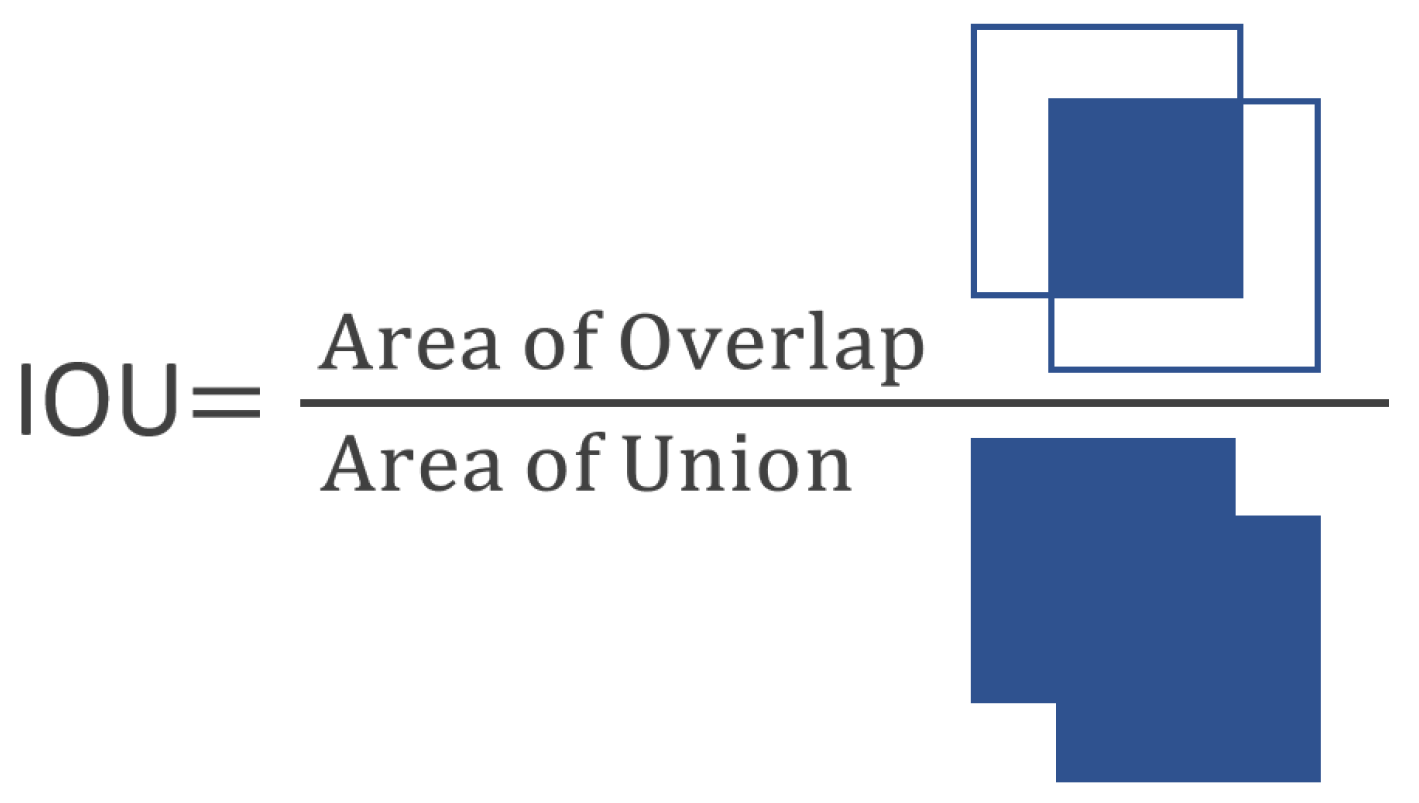
3.3. Performance Matrix
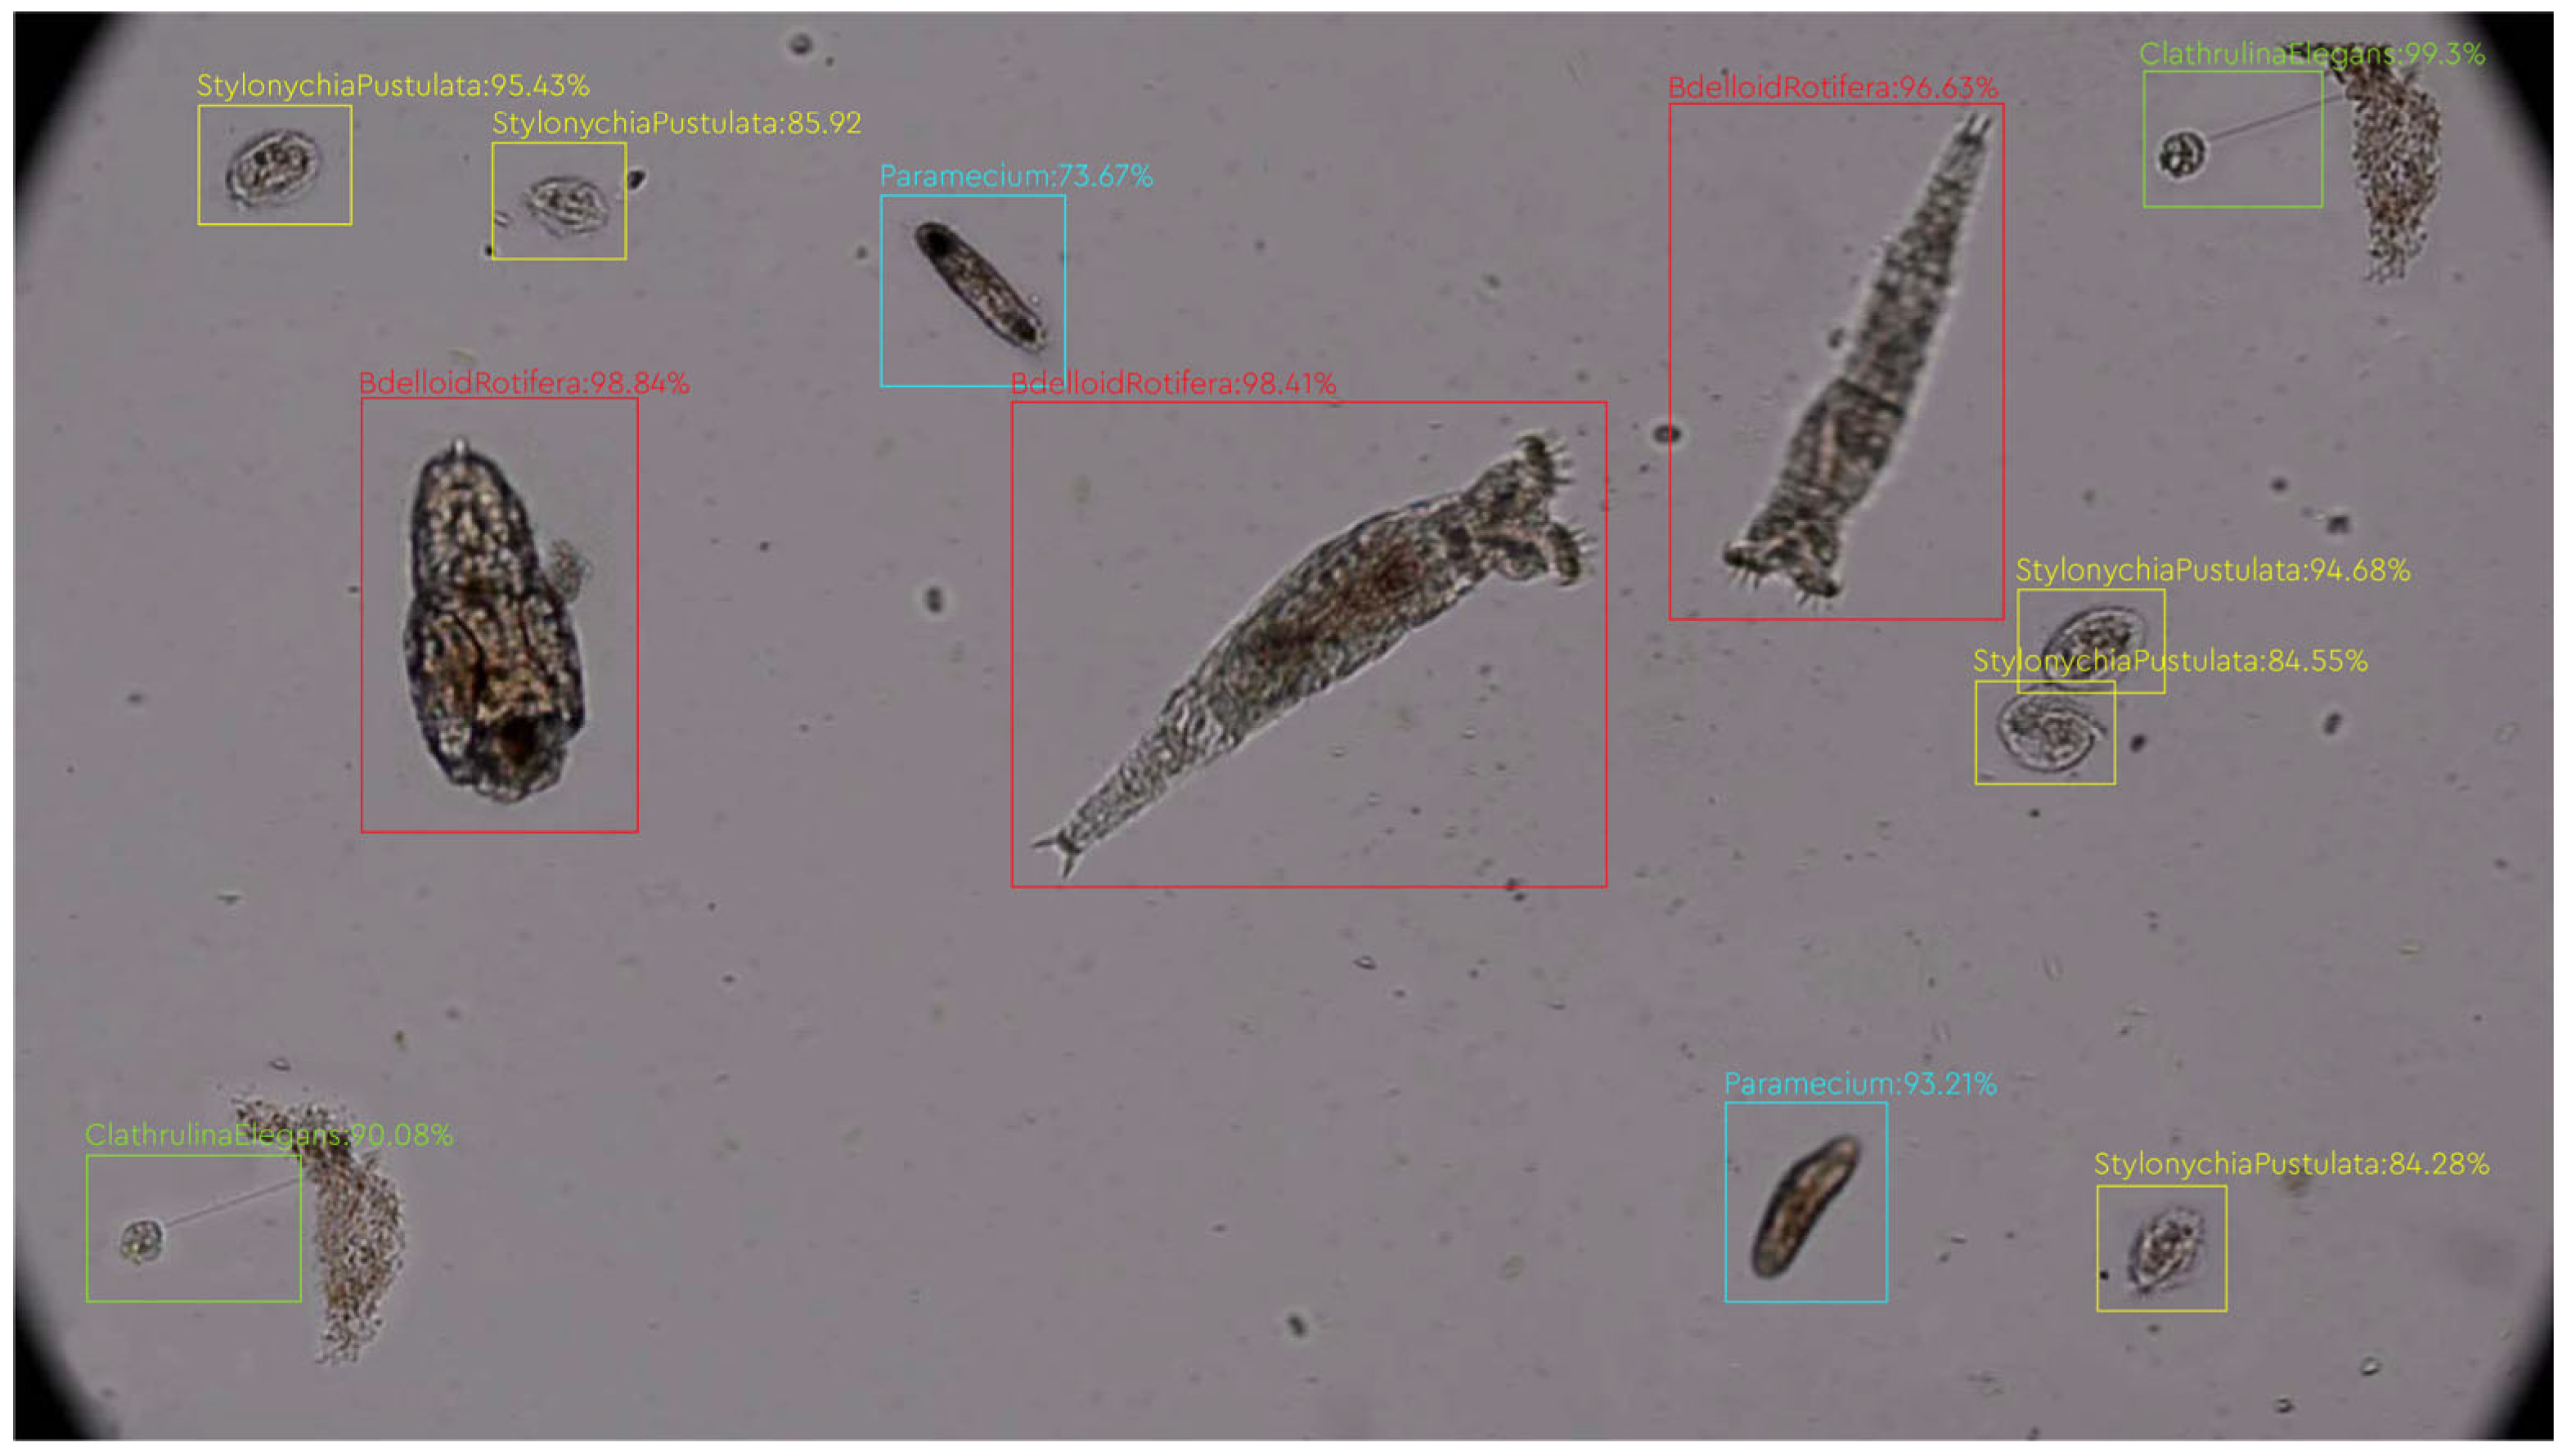
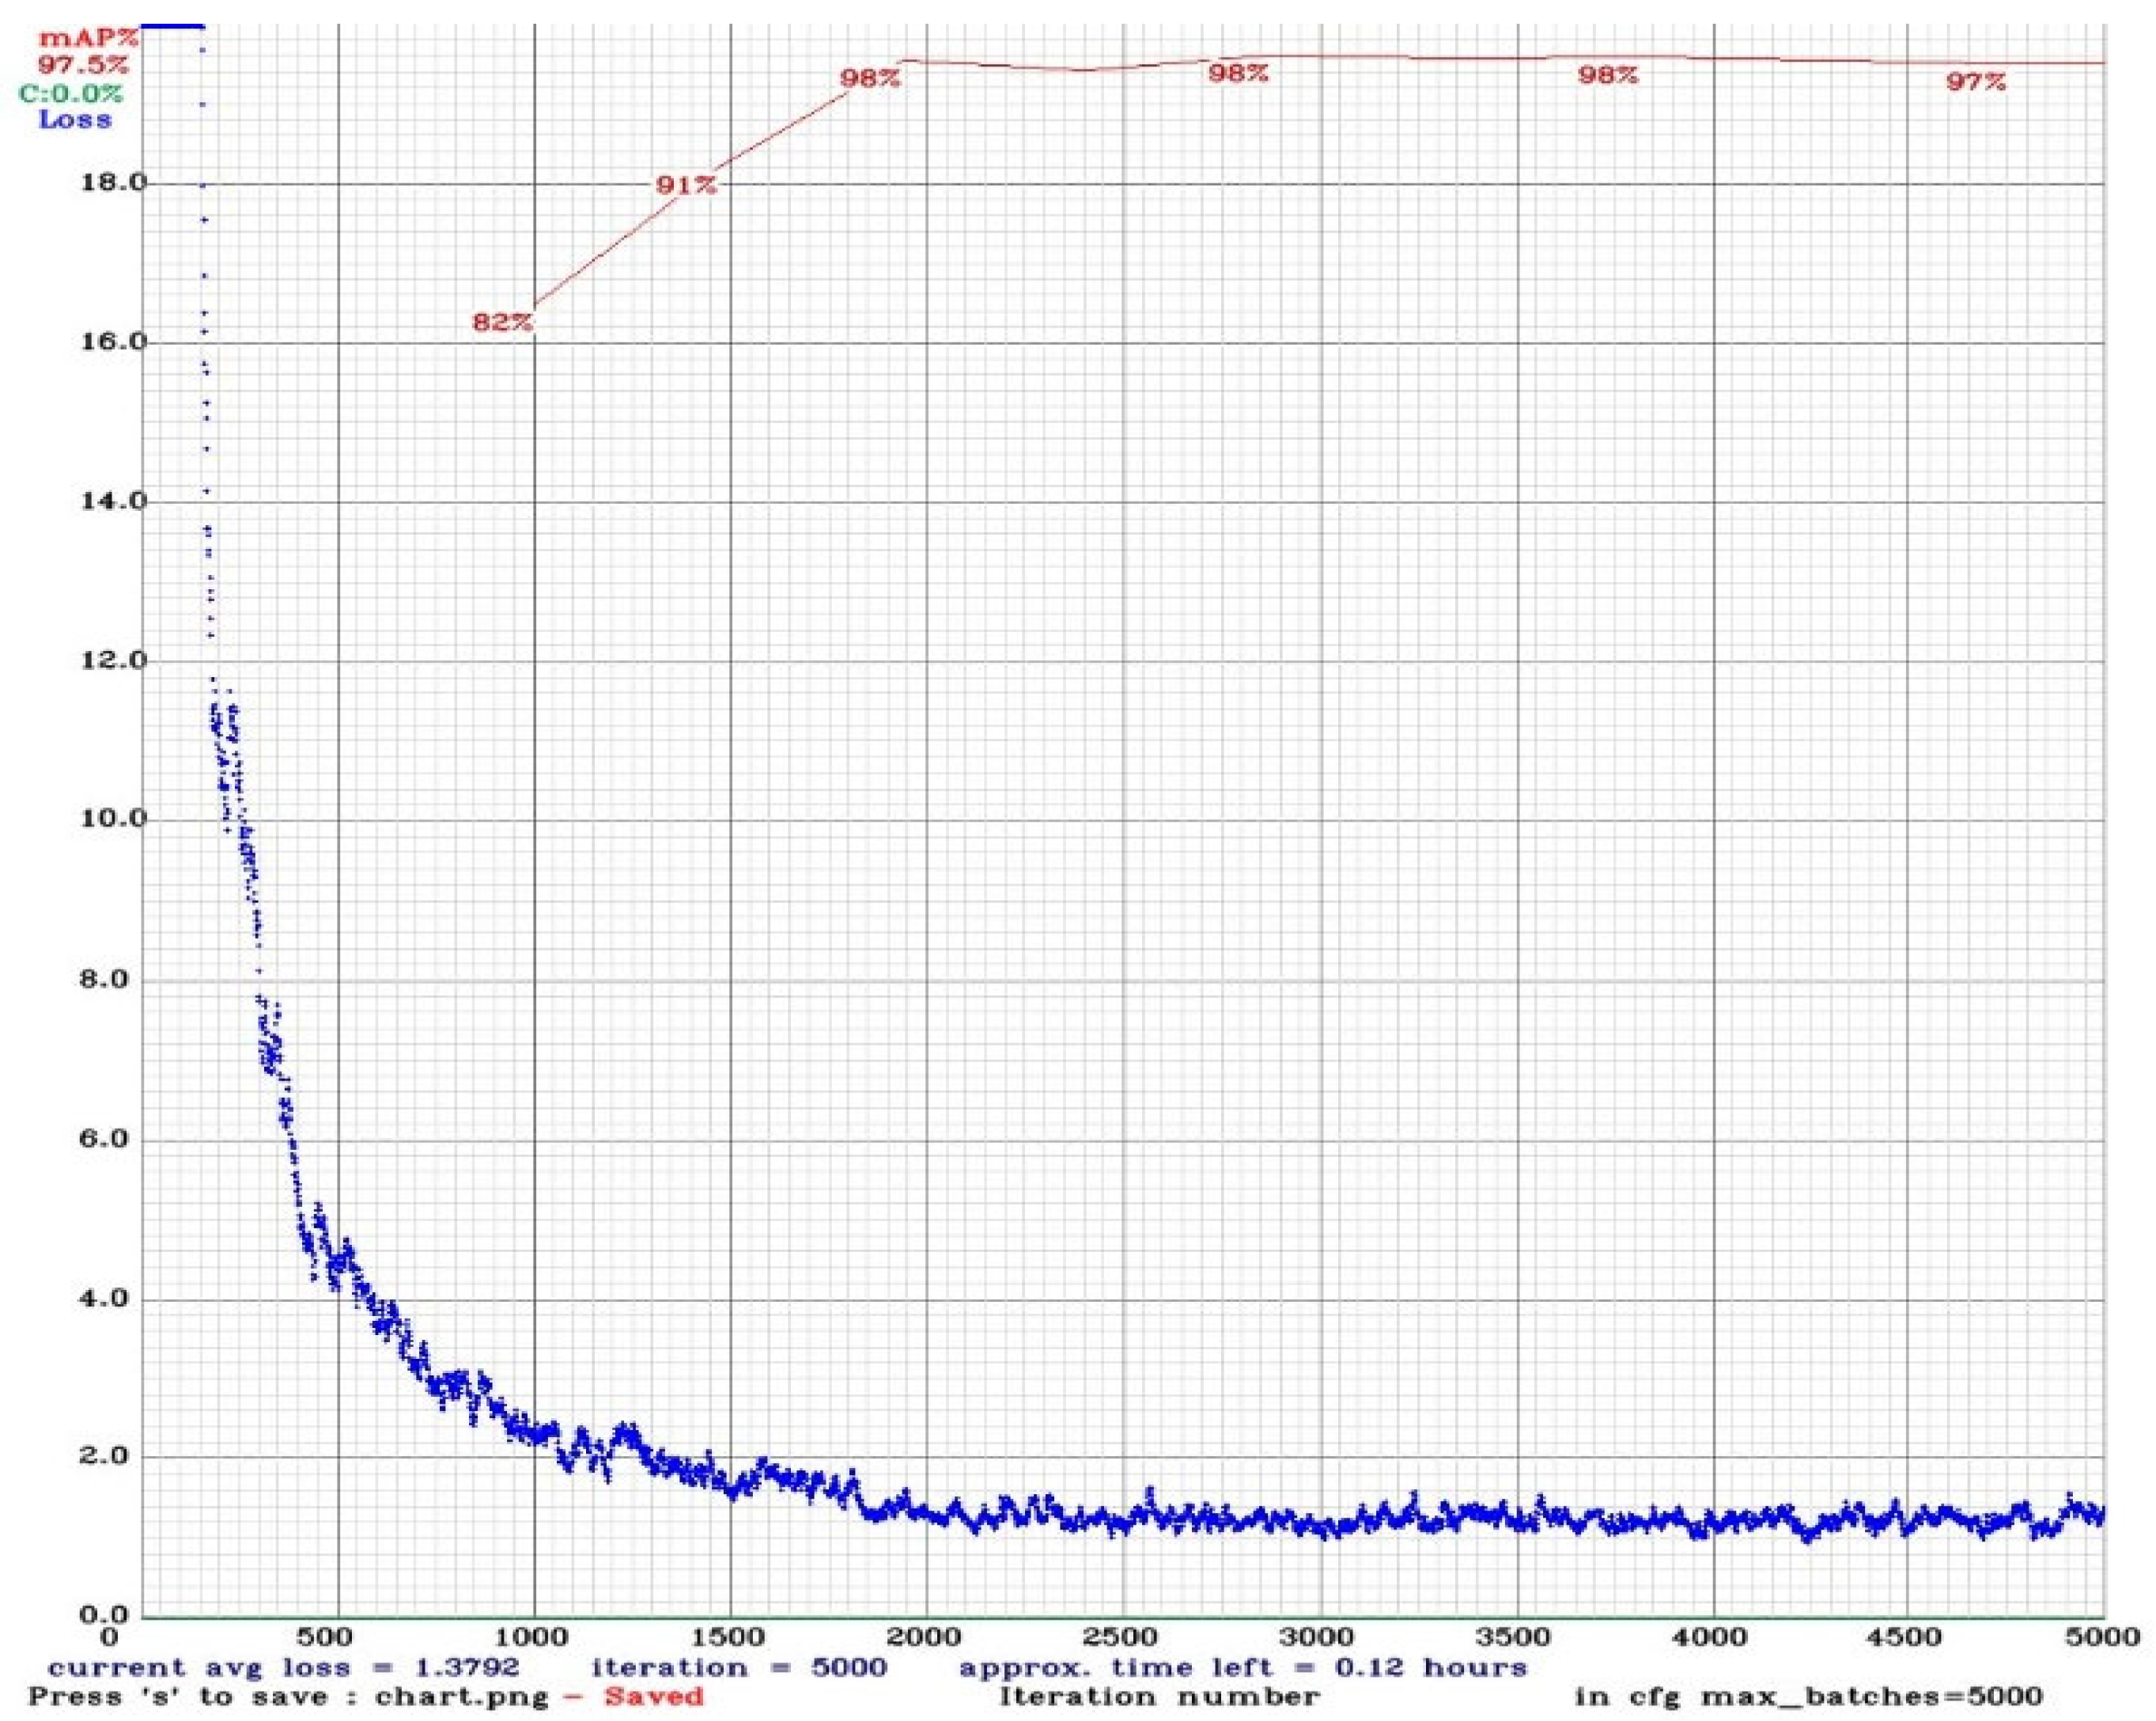
3.4. Result and Discussion
4. Conclusions
5. Suggestions for the Future
Author Contributions
Funding
Data Availability Statement
Acknowledgments
Conflicts of Interest
References
- Pandey, P.K.; Kass, P.H.; Soupir, M.L.; Biswas, S.; Singh, V.P. Contamination of Water Resources by Pathogenic Bacteria. AMB Express 2014, 4, 1–16. [Google Scholar] [CrossRef]
- Al Bayati, M.A.Z.; Çakmak, M. Real-Time Vehicle Detection for Surveillance of River Dredging Areas Using Convolutional Neural Networks. Int. J. Image Graph. Signal Process. 2023, 15, 17–28. [Google Scholar] [CrossRef]
- Atila, Ü.; Baydilli, Y.Y.; Sehirli, E.; Turan, M.K. Classification of DNA Damages on Segmented Comet Assay Images Using Convolutional Neural Network. Comput. Methods Programs Biomed. 2020, 186, 105192. [Google Scholar] [CrossRef] [PubMed]
- Baydilli, Y.Y.; Atila, Ü. Classification of White Blood Cells Using Capsule Networks. Comput. Med. Imaging Graph. 2020, 80, 101699. [Google Scholar] [CrossRef] [PubMed]
- Duru, A.; Karaş, İ.R.; Karayürek, F.; Gülses, A. A Deep Learning Approach for Classification of Dentinal Tubule Occlusions. Appl. Artif. Intell. 2022, 36, 2094446. [Google Scholar] [CrossRef]
- Ahmed, A.H.; Alwan, H.B.; Çakmak, M. Convolutional Neural Network-Based Lung Cancer Nodule Detection Based on Computer Tomography. In Lecture Notes in Networks and Systems; Springer: Singapore, 2023; Volume 572, pp. 89–102. [Google Scholar]
- Fasihfar, Z.; Rokhsati, H.; Sadeghsalehi, H.; Ghaderzadeh, M.; Gheisari, M. AI-Driven Malaria Diagnosis: Developing a Robust Model for Accurate Detection and Classification of Malaria Parasites. Iran. J. Blood Cancer 2023, 15, 112–124. [Google Scholar] [CrossRef]
- Ghaderzadeh, M.; Hosseini, A.; Asadi, F.; Abolghasemi, H.; Bashash, D.; Roshanpoor, A. Automated Detection Model in Classification of B-Lymphoblast Cells from Normal B-Lymphoid Precursors in Blood Smear Microscopic Images Based on the Majority Voting Technique. Sci. Program 2022, 2022, 4801671. [Google Scholar] [CrossRef]
- Ghaderzadeh, M.; Asadi, F.; Ramezan Ghorbani, N.; Almasi, S.; Taami, T. Toward Artificial Intelligence (AI) Applications in the Determination of COVID-19 Infection Severity: Considering AI as a Disease Control Strategy in Future Pandemics. Iran. J. Blood Cancer 2023, 15, 93–111. [Google Scholar] [CrossRef]
- Hosseini, A.; Eshraghi, M.A.; Taami, T.; Sadeghsalehi, H.; Hoseinzadeh, Z.; Ghaderzadeh, M.; Rafiee, M. A Mobile Application Based on Efficient Lightweight CNN Model for Classification of B-ALL Cancer from Non-Cancerous Cells: A Design and Implementation Study. Inform. Med. Unlocked 2023, 39, 101244. [Google Scholar] [CrossRef]
- Skotarczak, B. Methods for Parasitic Protozoans Detection in the Environmental Samples. Parasite 2009, 16, 183–190. [Google Scholar] [CrossRef]
- Maas, L.; Dorigo-Zetsma, J.W.; de Groot, C.J.; Bouter, S.; Plötz, F.B.; van Ewijk, B.E. Detection of Intestinal Protozoa in Paediatric Patients with Gastrointestinal Symptoms by Multiplex Real-Time PCR. Clin. Microbiol. Infect. 2014, 20, 545–550. [Google Scholar] [CrossRef]
- Le Calvez, T.; Trouilhé, M.C.; Humeau, P.; Moletta-Denat, M.; Frère, J.; Héchard, Y. Detection of Free-Living Amoebae by Using Multiplex Quantitative PCR. Mol. Cell. Probes 2012, 26, 116–120. [Google Scholar] [CrossRef]
- Baltrušis, P.; Höglund, J. Digital PCR: Modern Solution to Parasite Diagnostics and Population Trait Genetics. Parasit. Vectors 2023, 16, 143. [Google Scholar] [CrossRef]
- Houssin, T.; Bridle, H.; Senez, V. Electrochemical Detection. In Waterborne Pathogens; Academic Press: Cambridge, MA, USA, 2021; pp. 147–187. [Google Scholar] [CrossRef]
- da Silva, A.D.; Paschoalino, W.J.; Neto, R.C.; Kubota, L.T. Electrochemical Point-of-Care Devices for Monitoring Waterborne Pathogens: Protozoa, Bacteria, and Viruses—An Overview. Case Stud. Chem. Environ. Eng. 2022, 5, 100182. [Google Scholar] [CrossRef]
- McGrath, J.S.; Honrado, C.; Spencer, D.; Horton, B.; Bridle, H.L.; Morgan, H. Analysis of Parasitic Protozoa at the Single-Cell Level Using Microfluidic Impedance Cytometry. Sci. Rep. 2017, 7, 2601. [Google Scholar] [CrossRef] [PubMed]
- Bharadwaj, P.; Tripathi, D.; Pandey, S.; Tapadar, S.; Bhattacharjee, A.; Das, D.; Palwan, E.; Rani, M.; Kumar, A. Molecular Biology Techniques for the Detection of Contaminants in Wastewater. In Wastewater Treatment: Cutting-Edge Molecular Tools, Techniques and Applied Aspects; Elsevier: Amsterdam, The Netherlands, 2021; pp. 217–235. [Google Scholar] [CrossRef]
- Boztoprak, H.; Özbay, Y. Detection of Protozoa in Wastewater Using ANN and Active Contour in Image Processing. Istanb. Univ. J. Electr. Electron. Eng. 2013, 13, 1661–1666. [Google Scholar]
- Abidin, S.R.; Salamah, U.; Nugroho, A.S. Segmentation of Malaria Parasite Candidates from Thick Blood Smear Microphotographs Image Using Active Contour without Edge. In Proceedings of the 2016 1st International Conference on Biomedical Engineering (IBIOMED), Yogyakarta, Indonesia, 5–6 October 2016; IEEE: New York, NY, USA, 2016; pp. 1–6. [Google Scholar] [CrossRef]
- Dave, I.R.; Upla, K.P. Computer Aided Diagnosis of Malaria Disease for Thin and Thick Blood Smear Microscopic Images. In Proceedings of the 2017 4th International Conference on Signal Processing and Integrated Networks (SPIN), Noida, India, 2–3 February 2017; pp. 561–565. [Google Scholar] [CrossRef]
- Traore, B.B.; Kamsu-Foguem, B.; Tangara, F. Deep Convolution Neural Network for Image Recognition. Ecol. Inform. 2018, 48, 257–268. [Google Scholar] [CrossRef]
- Mathison, B.A.; Kohan, J.L.; Walker, J.F.; Smith, R.B.; Ardon, O.; Ardon, O.; Couturier, M.R.; Couturier, M.R. Detection of Intestinal Protozoa in Trichrome-Stained Stool Specimens by Use of a Deep Convolutional Neural Network. J. Clin. Microbiol. 2020, 58, e02053-19. [Google Scholar] [CrossRef]
- Pho, K.; Mohammed Amin, M.K.; Yoshitaka, A. Segmentation-Driven Hierarchical RetinaNet for Detecting Protozoa in Micrograph. Int. J. Semant. Comput. 2019, 13, 393–413. [Google Scholar] [CrossRef]
- Nakasi, R.; Mwebaze, E.; Zawedde, A.; Tusubira, J.; Akera, B.; Maiga, G. A New Approach for Microscopic Diagnosis of Malaria Parasites in Thick Blood Smears Using Pre-Trained Deep Learning Models. SN Appl. Sci. 2020, 2, 1255. [Google Scholar] [CrossRef]
- Osaku, D.; Cuba, C.F.; Suzuki, C.T.N.; Gomes, J.F.; Falcão, A.X. Automated Diagnosis of Intestinal Parasites: A New Hybrid Approach and Its Benefits. Comput. Biol. Med. 2020, 123, 103917. [Google Scholar] [CrossRef] [PubMed]
- Górriz, M.; Aparicio, A.; Raventós, B.; Vilaplana, V.; Sayrol, E.; López-Codina, D. Leishmaniasis Parasite Segmentation and Classification Using Deep Learning; Lecture Notes in Computer Science (Including Subseries Lecture Notes in Artificial Intelligence and Lecture Notes in Bioinformatics); Springer: Cham, Switzerland, 2018; Volume 10945, pp. 53–62. [Google Scholar] [CrossRef]
- Hoorali, F.; Khosravi, H.; Moradi, B. Automatic Bacillus Anthracis Bacteria Detection and Segmentation in Microscopic Images Using UNet++. J. Microbiol. Methods 2020, 177, 106056. [Google Scholar] [CrossRef] [PubMed]
- de Souza Oliveira, A.; Guimarães Fernandes Costa, M.; das Graças Vale Barbosa, M.; Ferreira Fernandes Costa Filho, C. A New Approach for Malaria Diagnosis in Thick Blood Smear Images. Biomed. Signal Process. Control 2022, 78, 103931. [Google Scholar] [CrossRef]
- Abdurahman, F.; Fante, K.A.; Aliy, M. Malaria Parasite Detection in Thick Blood Smear Microscopic Images Using Modified YOLOV3 and YOLOV4 Models. BMC Bioinform. 2021, 22, 112. [Google Scholar] [CrossRef]
- Nakasi, R.; Mwebaze, E.; Zawedde, A. Mobile-Aware Deep Learning Algorithms for Malaria Parasites and White Blood Cells Localization in Thick Blood Smears. Algorithms 2021, 14, 17. [Google Scholar] [CrossRef]
- Zhang, C.; Jiang, H.; Jiang, H.; Xi, H.; Chen, B.; Liu, Y.; Juhas, M.; Li, J.; Zhang, Y. Deep Learning for Microscopic Examination of Protozoan Parasites. Comput. Struct. Biotechnol. J. 2022, 20, 1036–1043. [Google Scholar] [CrossRef] [PubMed]
- Althomali, R.H.; Abdu Musad Saleh, E.; Gupta, J.; Mohammed Baqir Al-Dhalimy, A.; Hjazi, A.; Hussien, B.M.; AL-Erjan, A.M.; Jalil, A.T.; Romero-Parra, R.M.; Barboza-Arenas, L.A. State-of-the-Art of Portable (Bio)Sensors Based on Smartphone, Lateral Flow and Microfluidics Systems in Protozoan Parasites Monitoring: A Review. Microchem. J. 2023, 191, 108804. [Google Scholar] [CrossRef]
- Ünver, H.M.; Ayan, E. Skin Lesion Segmentation in Dermoscopic Images with Combination of Yolo and Grabcut Algorithm. Diagnostics 2019, 9, 72. [Google Scholar] [CrossRef]
- Redmon, J.; Divvala, S.; Girshick, R.; Farhadi, A. You Only Look Once: Unified, Real-Time Object Detection. In Proceedings of the 2016 IEEE Conference on Computer Vision and Pattern Recognition (CVPR), Las Vegas, NV, USA, 27–30 June 2016; pp. 779–788. [Google Scholar] [CrossRef]
- Bochkovskiy, A.; Wang, C.Y.; Liao, H.Y.M. YOLOv4: Optimal Speed and Accuracy of Object Detection. ArXiv 2020. [Google Scholar] [CrossRef]
- Lin, T.Y.; Maire, M.; Belongie, S.; Hays, J.; Perona, P.; Ramanan, D.; Dollár, P.; Zitnick, C.L. Microsoft COCO: Common Objects in Context; Lecture Notes in Computer Science (Including Subseries Lecture Notes in Artificial Intelligence and Lecture Notes in Bioinformatics); Springer: Cham, Switzerland, 2014; Volume 8693. [Google Scholar] [CrossRef]
- Skalski, P. Make Sense. Available online: https://github.com/SkalskiP/make-sense/ (accessed on 18 December 2023).


| Reference | Type of Organism | Database | Data Source | Number of Class | Pre-Processing | Segmentation/Classifier | Performance Evaluation | Results (%) |
|---|---|---|---|---|---|---|---|---|
| [7] | Protozoa in wastewater | 1920 images | Original | 4 | Segmentation, decoding and resizing, normalization | Traditional NN, 6-layer CNN | Average accuracy | NN: 95.11, CNN: 99.59 |
| [19] | Malaria parasite | 27 images with 1288 × 966 pixels | Original | 2 (malaria or not) | Grey level with histogram, equalization, median filter | Prewitt Edge Detector, ANN | Number of detections | Not specified |
| [20] | Malaria parasite candidates | 50 images with 1280 × 960 pixels | Original | - | Noise filtering (lowpass filtering), contrast enhancement (contrast stretching) | Active Contour Without Edge, | Confusion matrix | Accuracy: 97.57 |
| [22] | Cholera pathogen, malaria parasite | 400 images | Google images | 2 | Not applied | CNN generated model | Full image accuracy | Accuracy: 94 |
| [23] | Intestinal Protozoa | 372 slides | Original | 11 | Augmentation (random 250-by 250-pixel crops) | CNN | Total recall | Recall: 92 |
| [24] | Protozoa | 69 images with various pixels | Original | 8 | Data augmentation | Hierarchical RetinaNet | Binary accuracy, precision, and recall | Binary accuracy: 98, precision: 93, recall: 95 |
| [25] | Malaria | 643 images with 750 × 750 pixels | Original | 2 (malaria or not) | Data augmentation (horizontal flip augmentation) | Faster R-CNN, SSD, RetinaNet | Malaria detection in full image | Faster R-CNN mAP: 94.48, SSD mAP: 83.97, RetinaNet mAP: 77.46 |
| [26] | Intestinal parasite | LAR-2: 1852, EGG-9: 12,691, PRO-7: 37,375 | LAR-2, EGG-9, PRO-7 Dataset | LAR-2: 2, EGG-9: 9, PRO-7: 7 | IFT-based image processing operations | Hybrid System DS1(p-SVM) + DS2 (Vgg-16) | Average mean accuracy | Accuracy (PRO-7): 91.01 |
| [27] | Leishmaniasis Parasite | 45 images with 1500 × 1300 pixels | Original | 7 | Data augmentation | U-Net | Average (Dice score, precision, recall, and f1-score) | Dice score: 80.01, precision: 79.15, recall: 75.53, f1-score: 75.85 |
| [28] | Bacillus anthracis bacteria | 956 images with 512 × 512 pixels | Original | 1 | Feature normalization Data augmentation | UNET++ | Bacillus detection in patch | Recall: 98, accuracy: 97 |
| [29] | Malaria | 676 images with 1388 × 1040 pixels | Original | 2 (malaria or not) | Noise filtering | CNN1 (40 × 40), CNN2 (100 × 100), fusion process | Full image, accuracy, sensitivity, specificity, precision, f1-score | Accuracy (CNN1): 90.10, Accuracy (CNN2): 88.91 |
| [30] | Malaria | 1182 images with 750 × 750 pixels | Public malaria dataset | 2 (malaria or not) | Not applied | YOLOV4 modified, YOLOV3 modified1, YOLOV3 modified2 | Malaria detection in full image | YOLOV4 MOD mAP: 96.32, YOLOV3 MOD1 mAP: 95.46, YOLOV3 MOD mAP: 96.14 |
| [31] | Malaria | 903 images with 3264 × 2448 pixels | Original | 2 (malaria or not) | Data augmentation through random vertical and horizontal flipping | Faster R-CNN, SSD MobileNet | Malaria detection in full image | Faster R-CNN mAP: 66.09, SSD MobileNet: 62.92 |
| F1-Score | Precision | Sensitivity | mAP | |
|---|---|---|---|---|
| YOLOv4 | 0.95 | 0.92 | 0.98 | 0.9752 |
| Classes | AP (Average Precision) | TP (True Positive) | FP (False Positive) |
|---|---|---|---|
| Class-1 (Stylonychia Pustulata) | 97.13% | 559 | 81 |
| Class-2 (Bdelloid Rotifera) | 97.77% | 357 | 7 |
| Class-3 (Colpoda) | 92.37% | 419 | 58 |
| Class-4 (Paramecium) | 98.91% | 324 | 6 |
| Class-5 (Clathrulina Elegans) | 95.32% | 30 | 1 |
| Class-6 (Coscinodiscus) | 100% | 131 | 0 |
| Class-7 (Lepocinclis Acus) | 98.91% | 92 | 9 |
| Class-8 (Hypotrich Ciliate) | 99.78% | 107 | 3 |
| Batch Size | FPS | mAP | |
|---|---|---|---|
| YOLOv4 | 64 | 5 | 0.9752 |
| Faster R-CNN | 64 | 2 | 0.9438 |
| SSD | 64 | 3 | 0.8746 |
Disclaimer/Publisher’s Note: The statements, opinions and data contained in all publications are solely those of the individual author(s) and contributor(s) and not of MDPI and/or the editor(s). MDPI and/or the editor(s) disclaim responsibility for any injury to people or property resulting from any ideas, methods, instructions or products referred to in the content. |
© 2024 by the authors. Licensee MDPI, Basel, Switzerland. This article is an open access article distributed under the terms and conditions of the Creative Commons Attribution (CC BY) license (https://creativecommons.org/licenses/by/4.0/).
Share and Cite
Kahraman, İ.; Karaş, İ.R.; Turan, M.K. Real-Time Protozoa Detection from Microscopic Imaging Using YOLOv4 Algorithm. Appl. Sci. 2024, 14, 607. https://doi.org/10.3390/app14020607
Kahraman İ, Karaş İR, Turan MK. Real-Time Protozoa Detection from Microscopic Imaging Using YOLOv4 Algorithm. Applied Sciences. 2024; 14(2):607. https://doi.org/10.3390/app14020607
Chicago/Turabian StyleKahraman, İdris, İsmail Rakıp Karaş, and Muhammed Kamil Turan. 2024. "Real-Time Protozoa Detection from Microscopic Imaging Using YOLOv4 Algorithm" Applied Sciences 14, no. 2: 607. https://doi.org/10.3390/app14020607
APA StyleKahraman, İ., Karaş, İ. R., & Turan, M. K. (2024). Real-Time Protozoa Detection from Microscopic Imaging Using YOLOv4 Algorithm. Applied Sciences, 14(2), 607. https://doi.org/10.3390/app14020607