

Effect of Electric Field on Membrane Fouling and Membrane Performance in Reverse Osmosis Treatment of Brackish Water


Abstract
1. Introduction
2. Materials and Methods
2.1. Materials
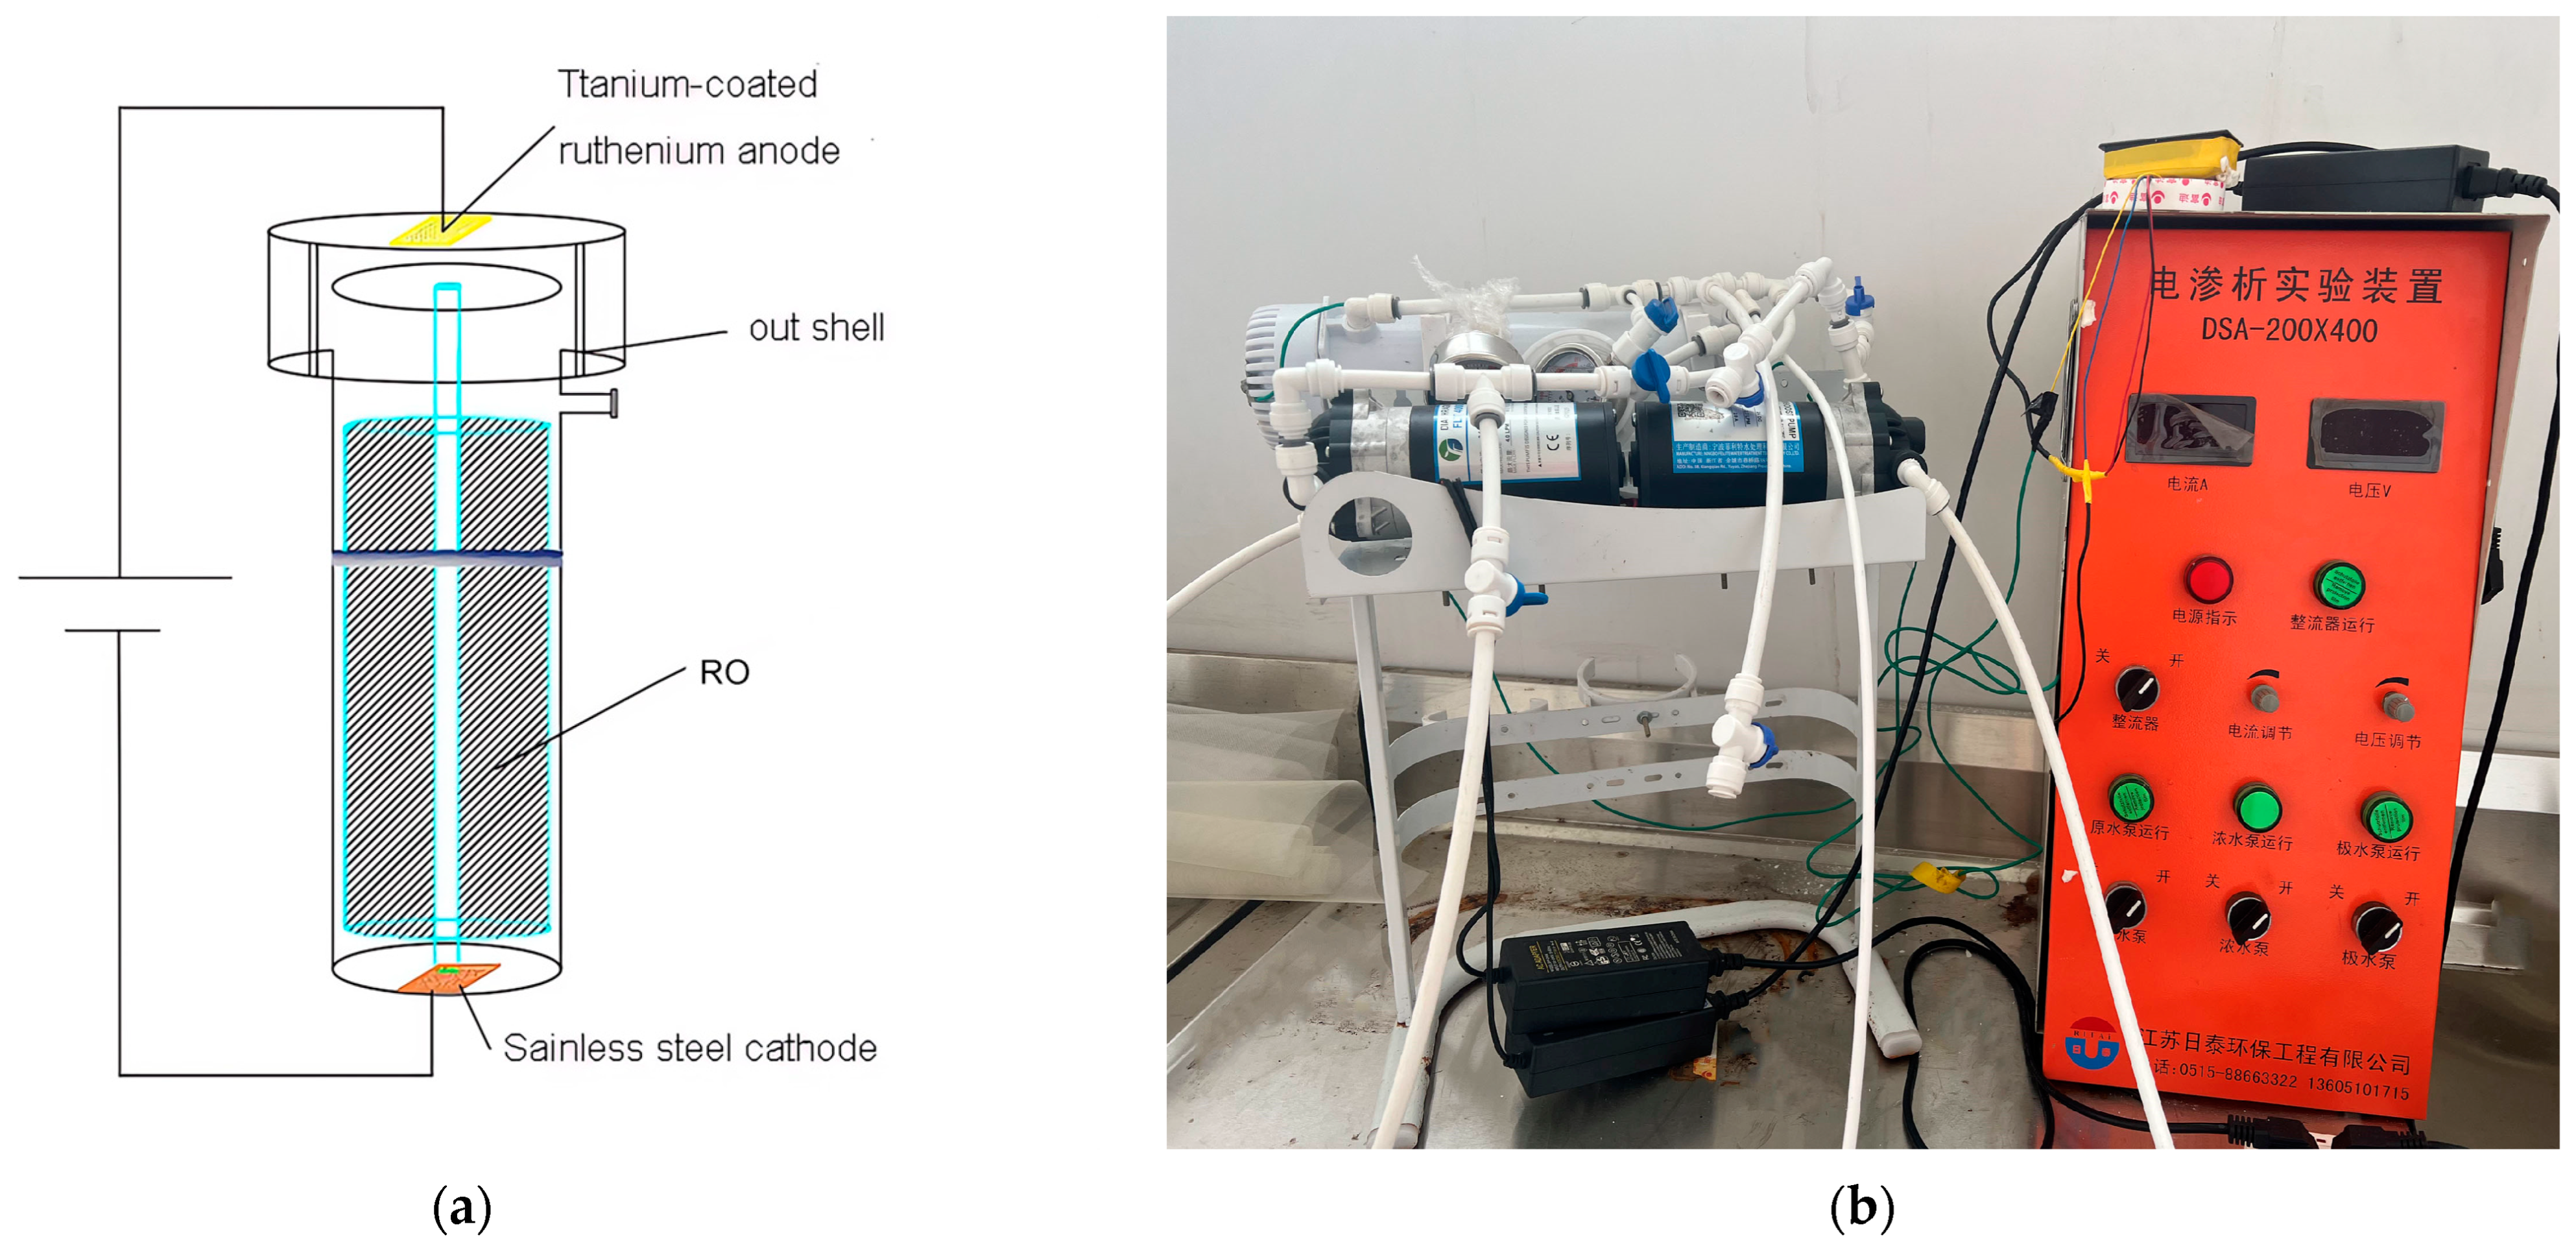
2.2. Test Equipment
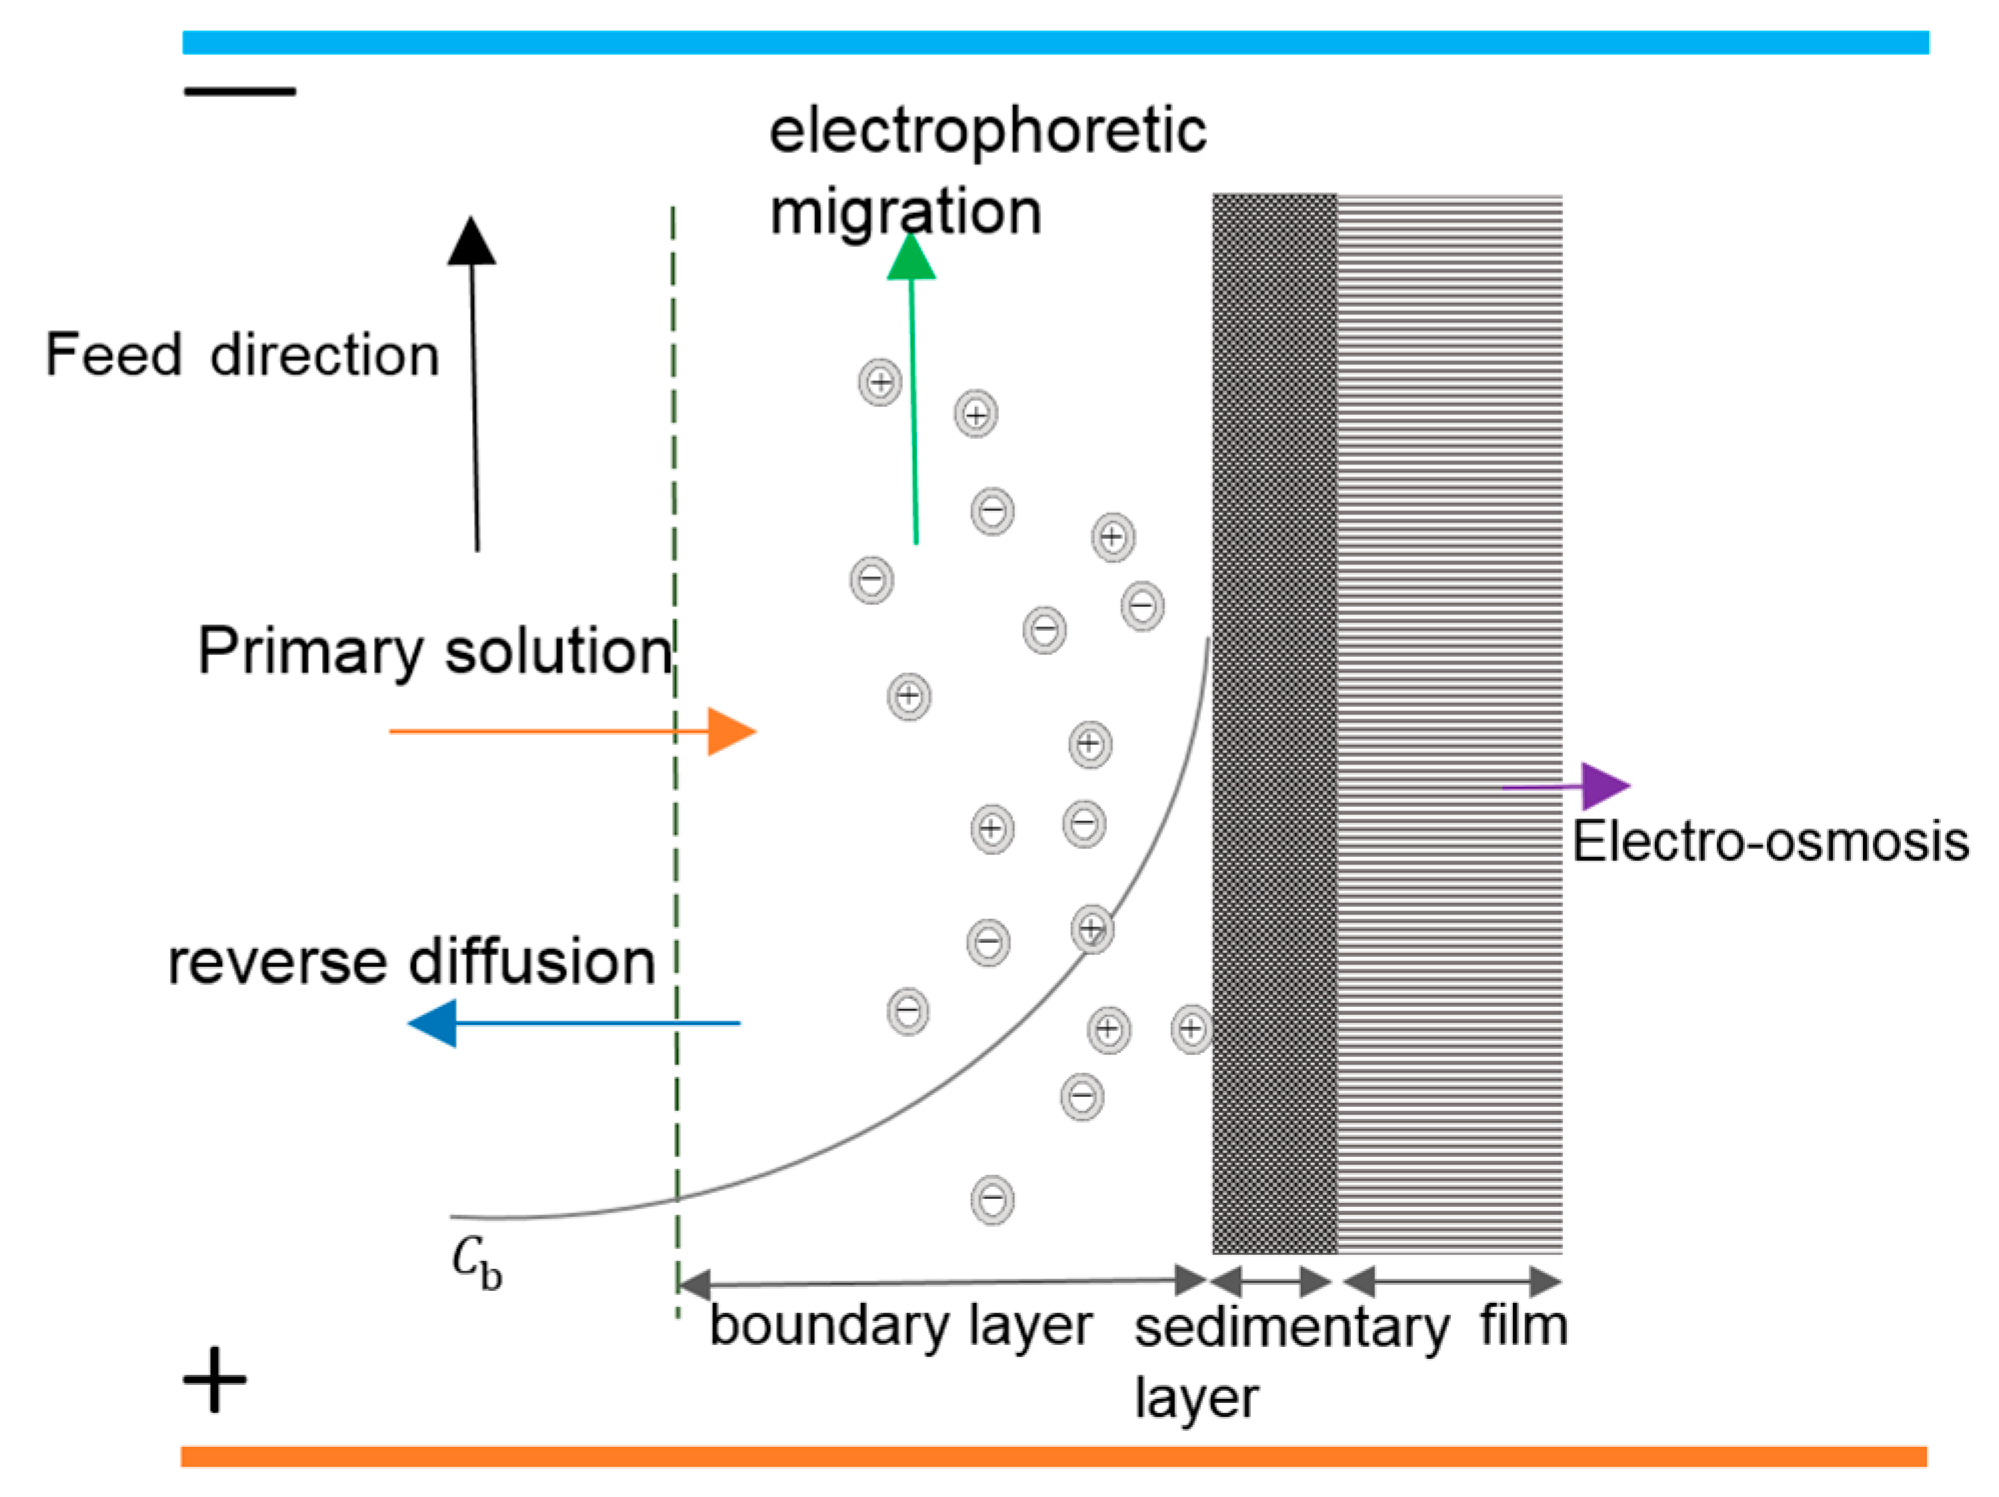
2.3. The Impact Mechanism of Electric Field on RO
2.4. Steps in the Implementation of the Experiment
2.5. Analytical Methods
2.6. Calculations
3. Results
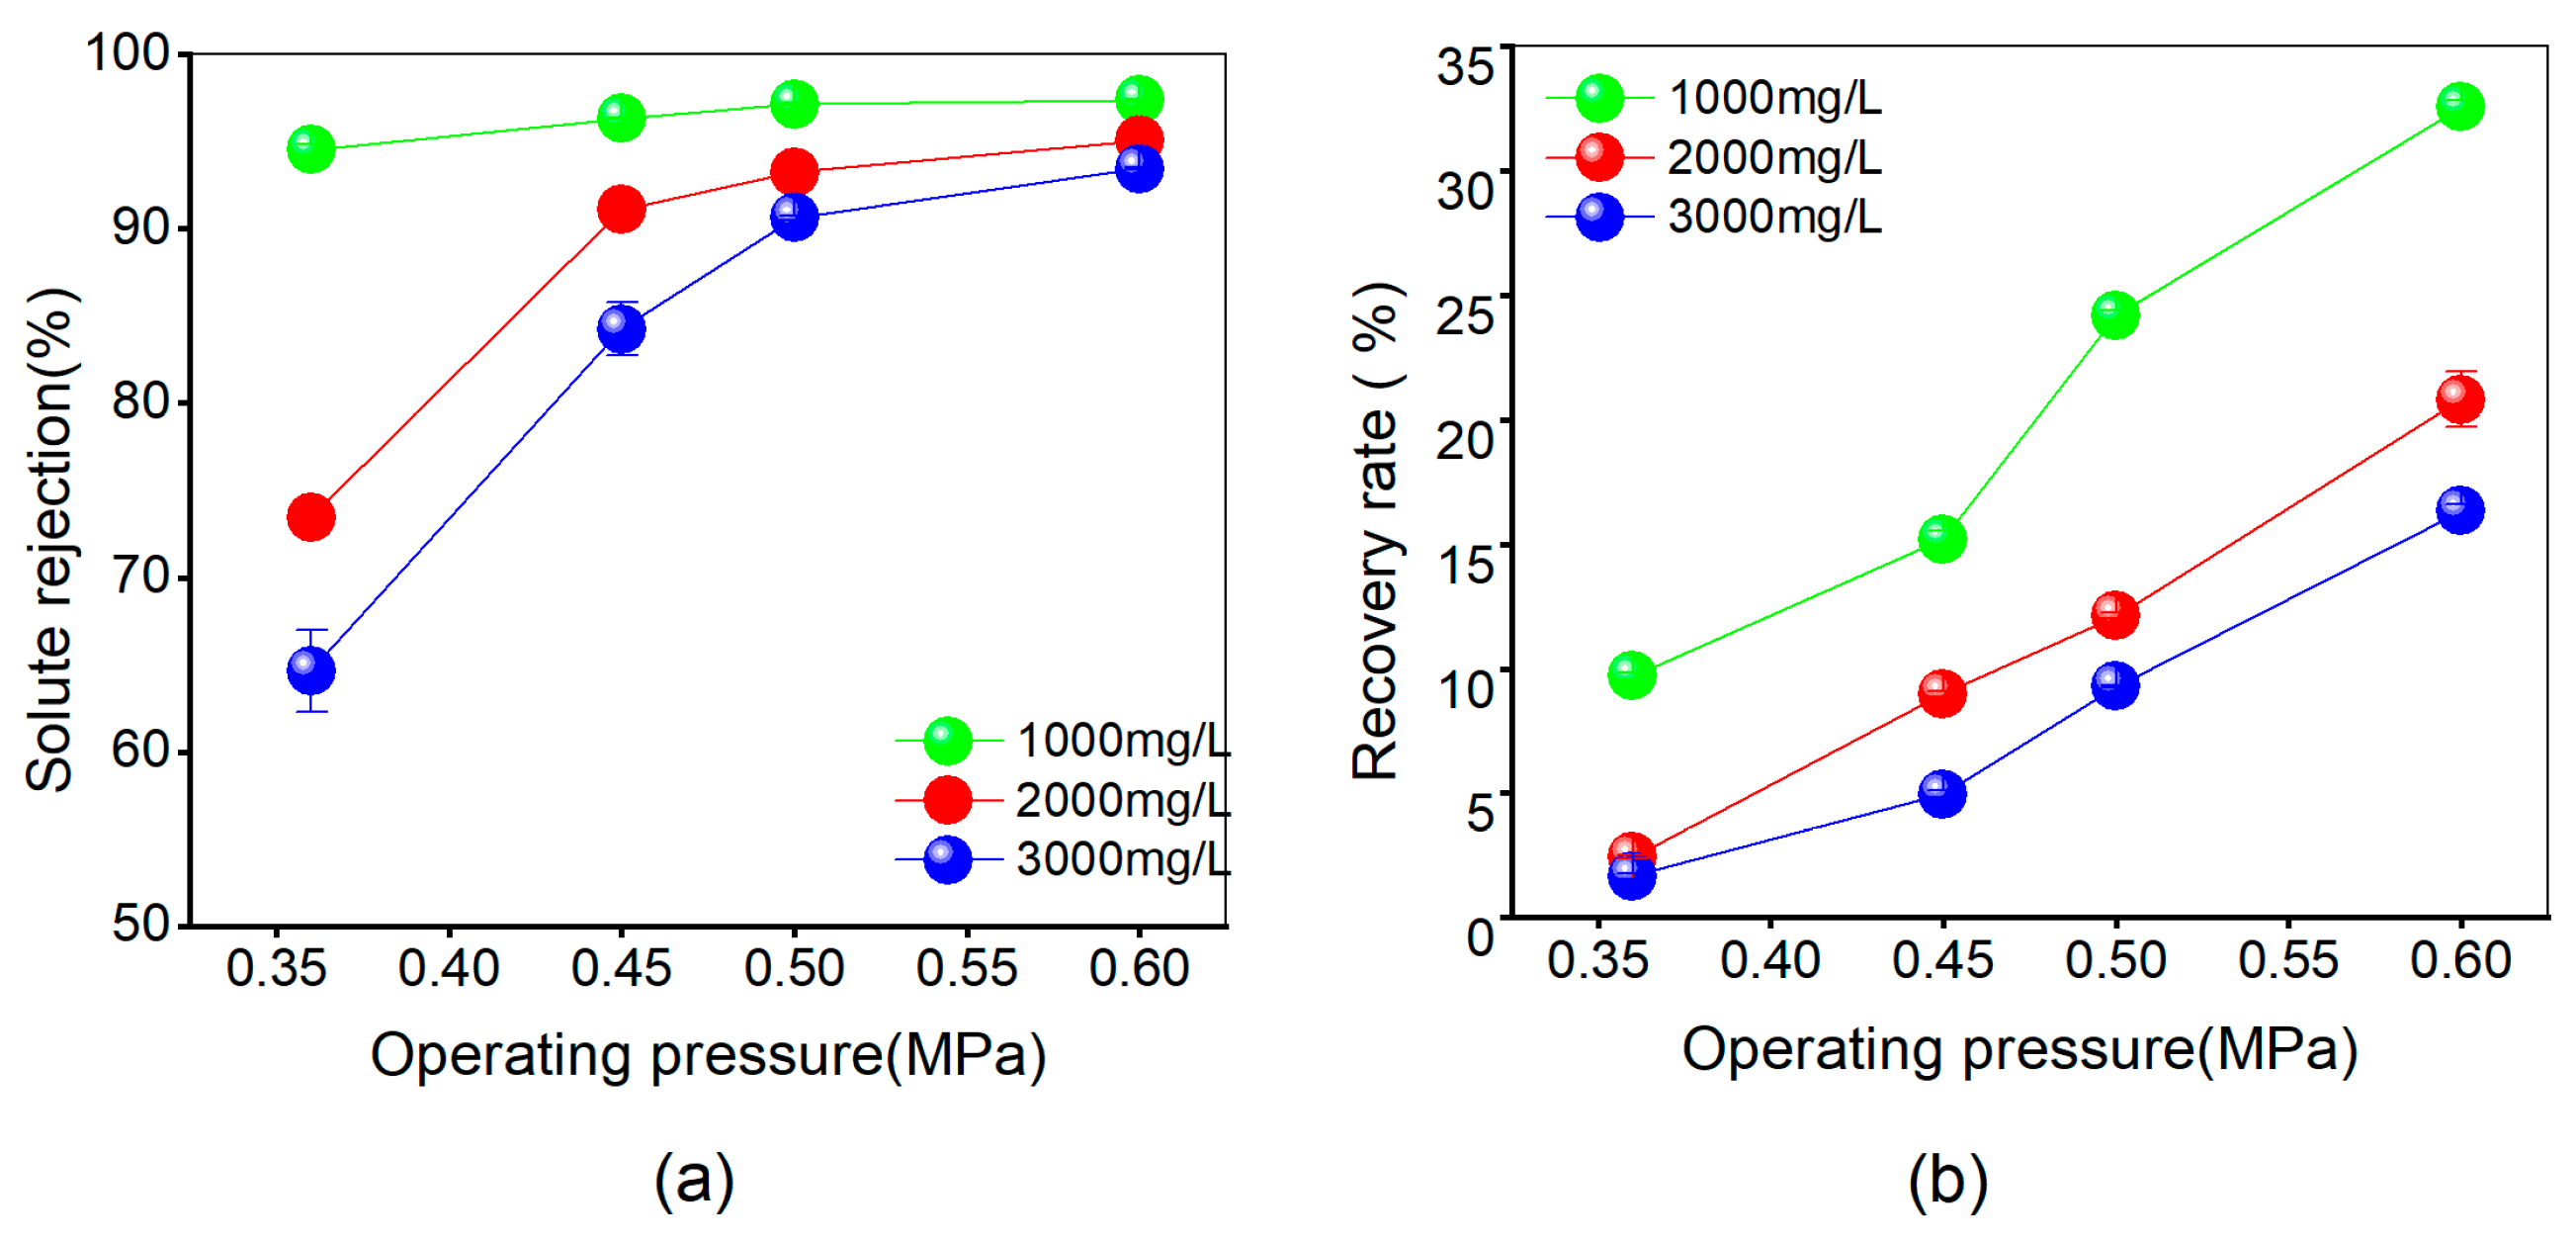
3.1. Influence of the MFRO on the Desalination Efficiency in Purified Salt Water
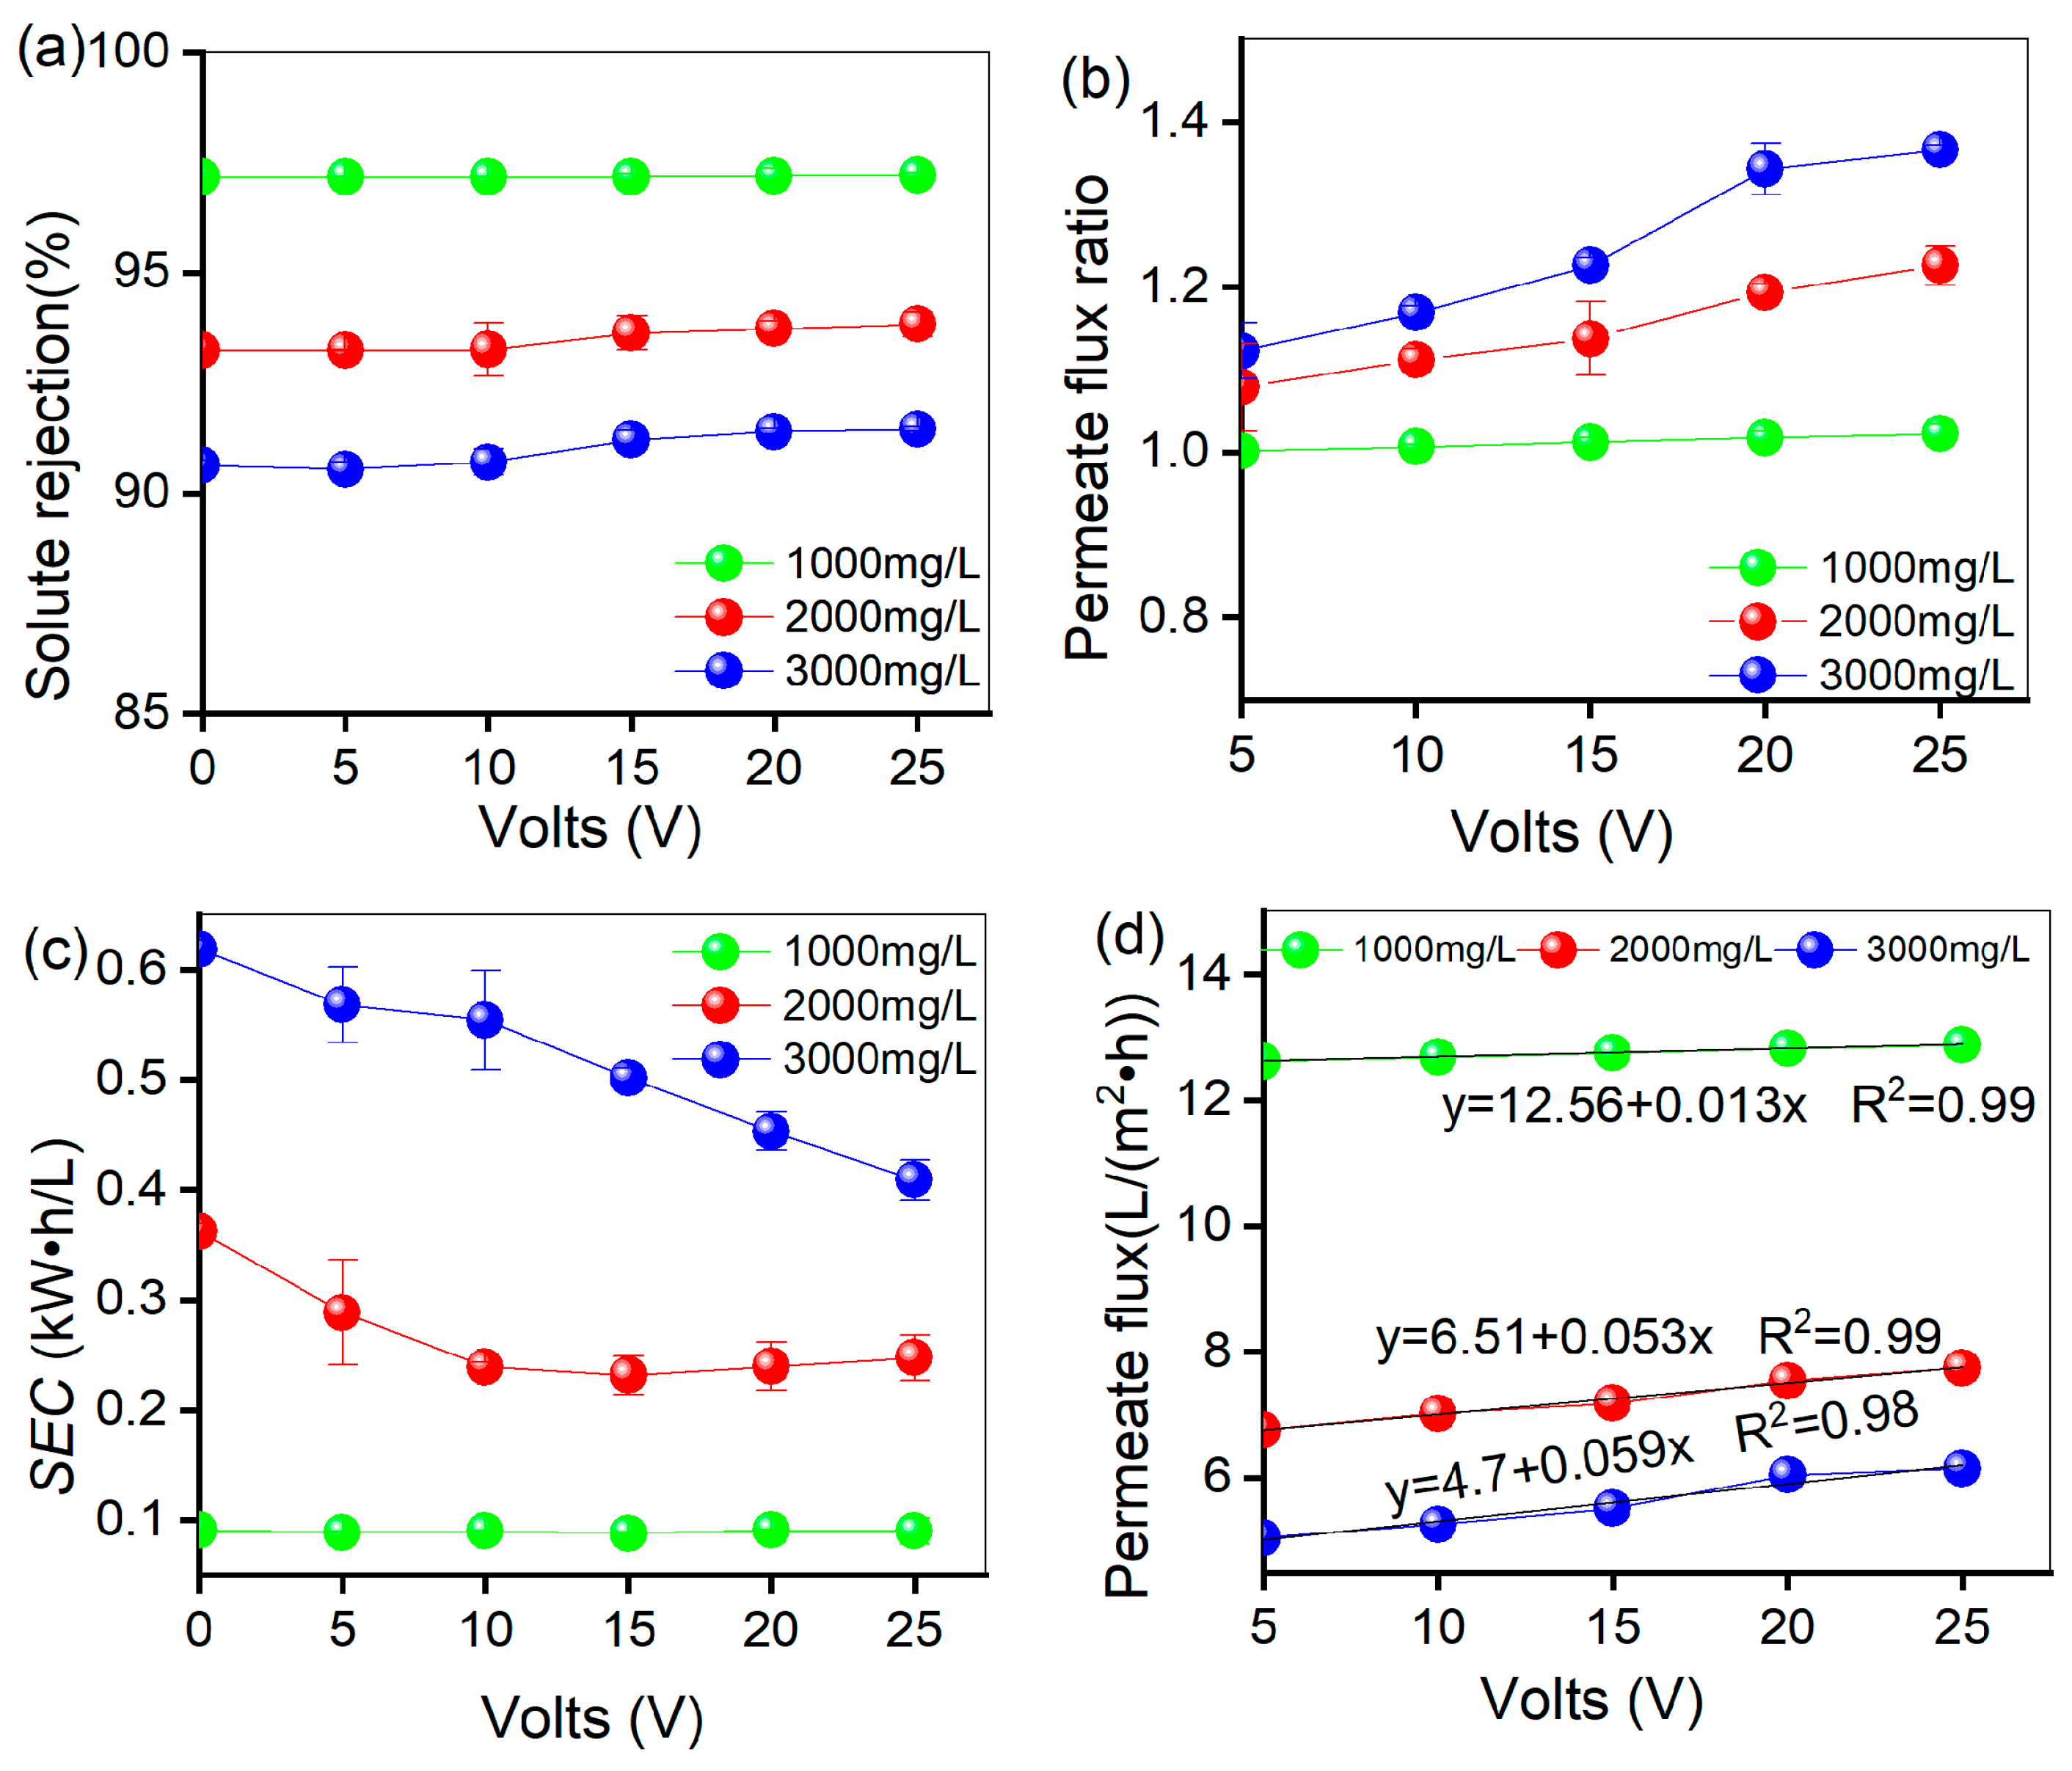
3.2. Influence of Electrical Field on the Performance of MFRO Desalination
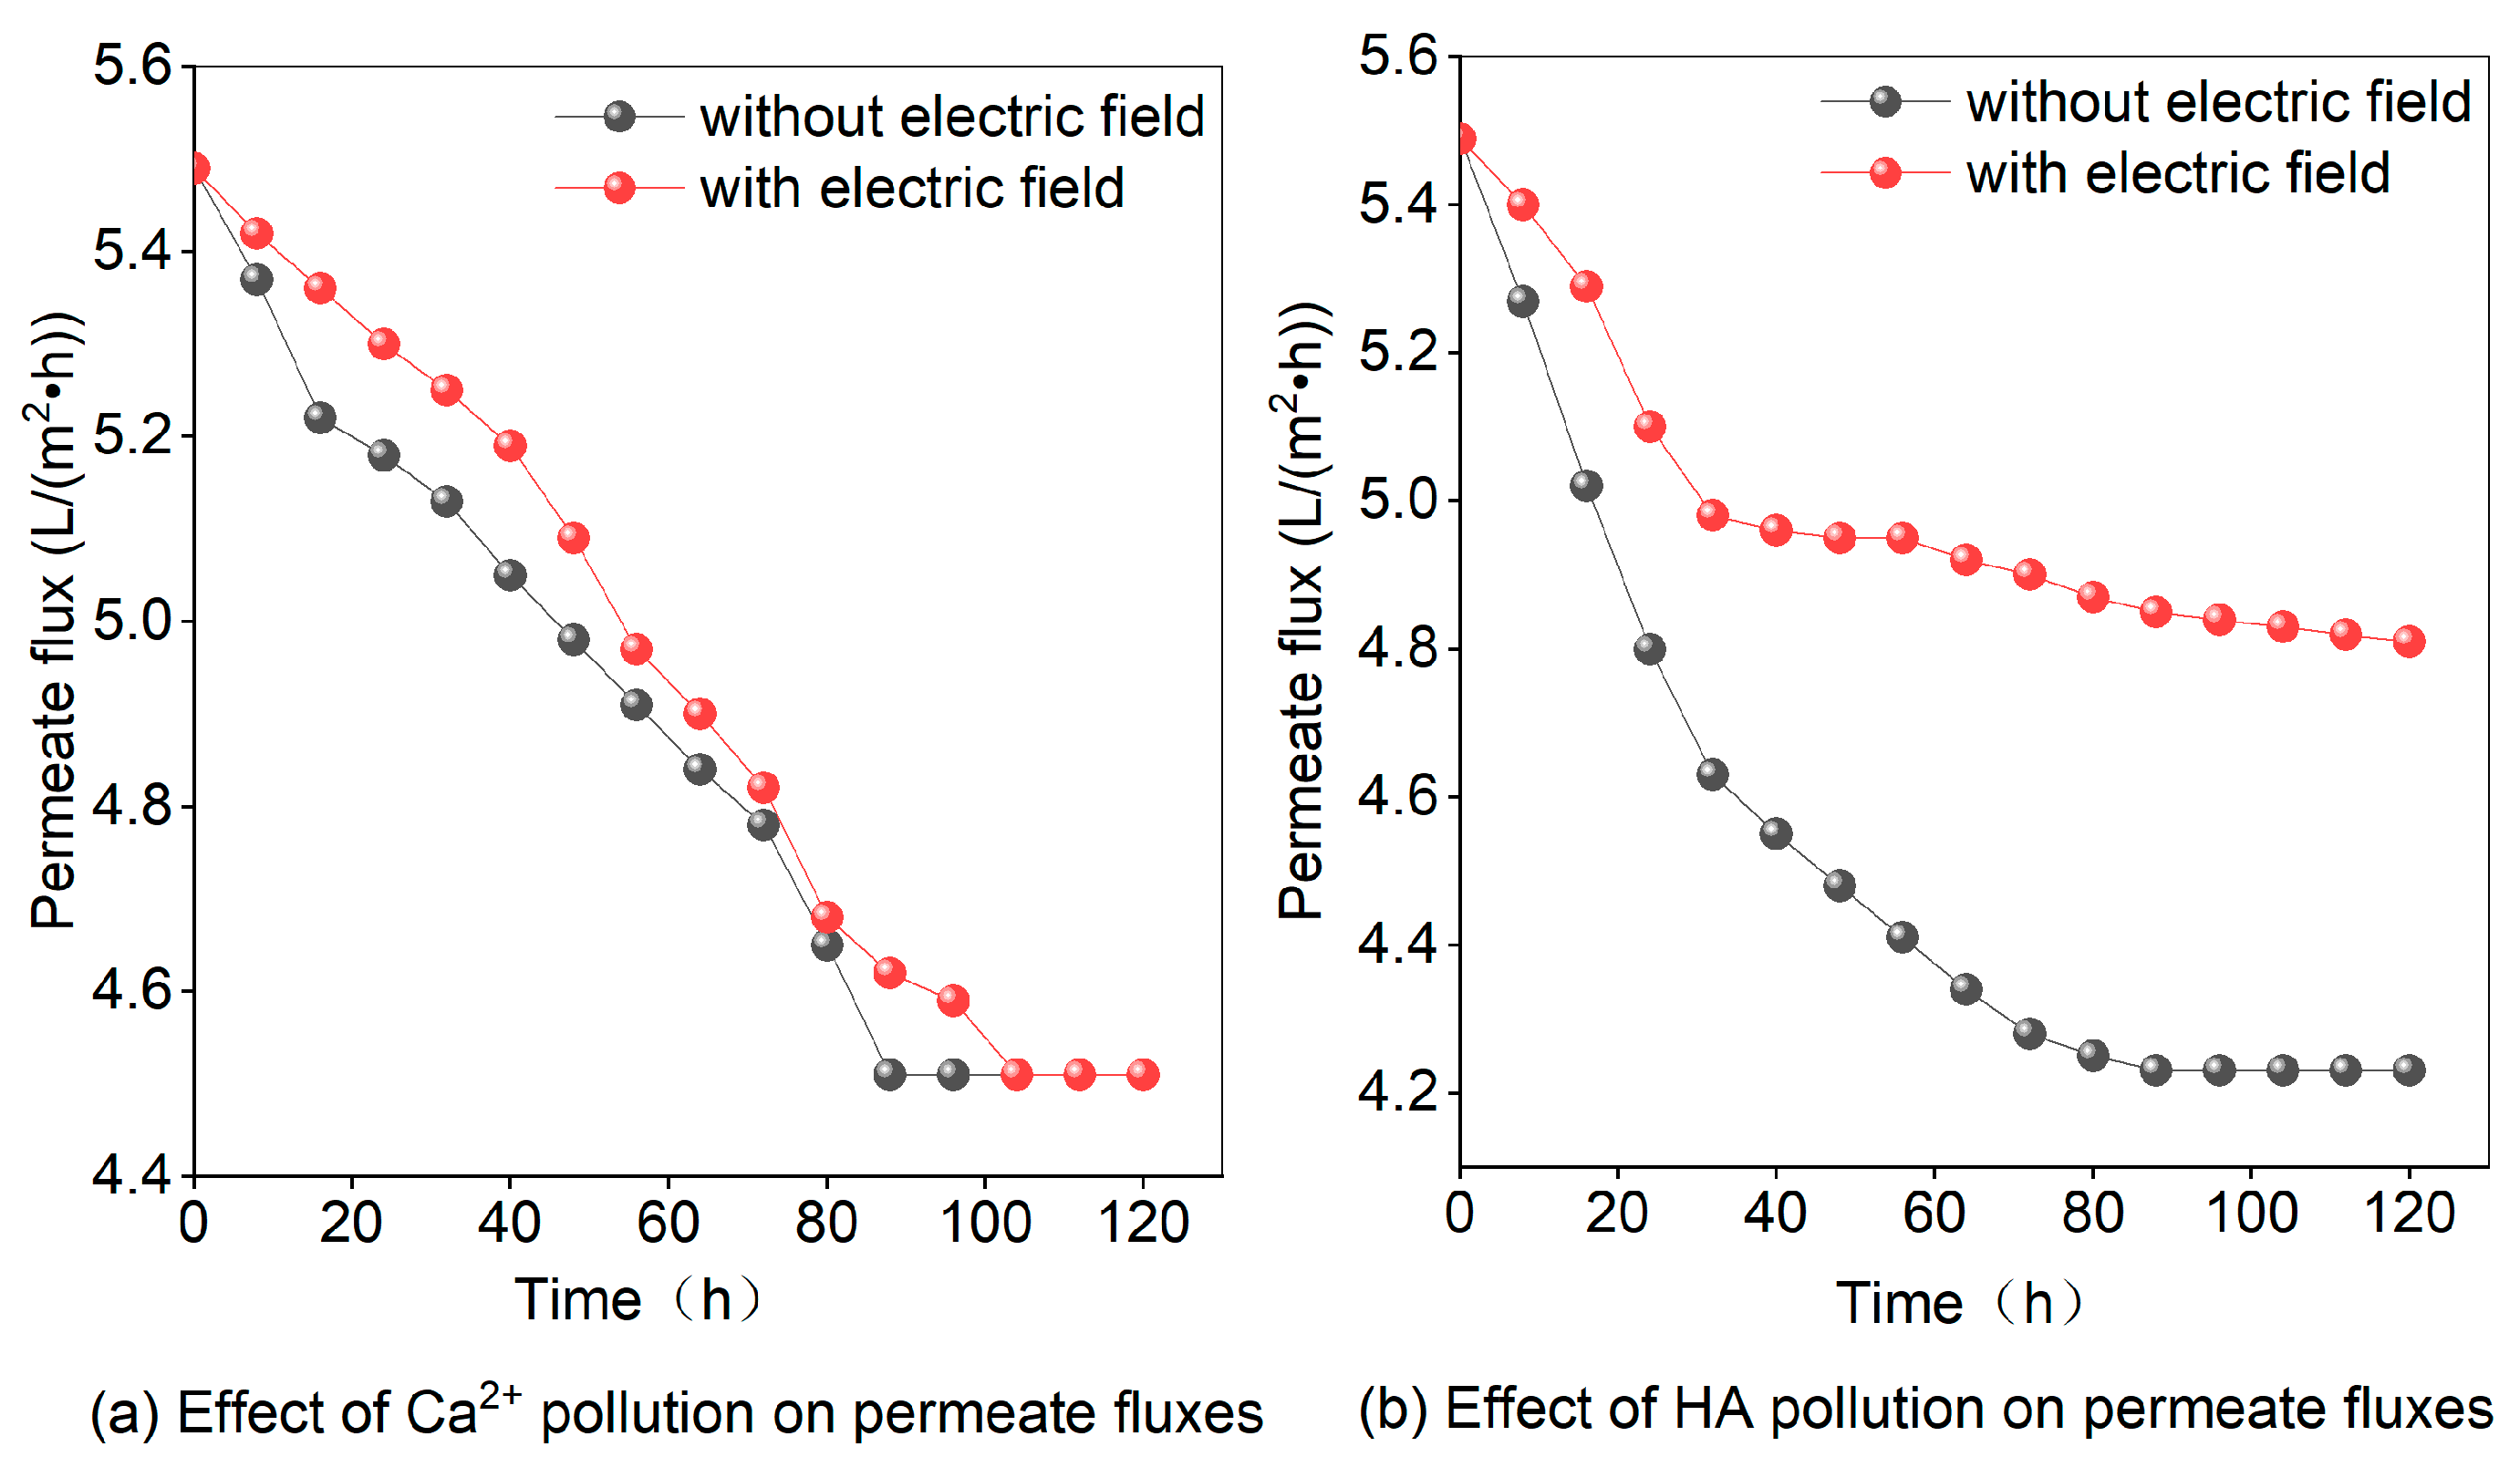
3.3. Effect of Ca2+ or HA on MFRO Permeate Flux under Electric Field Conditions
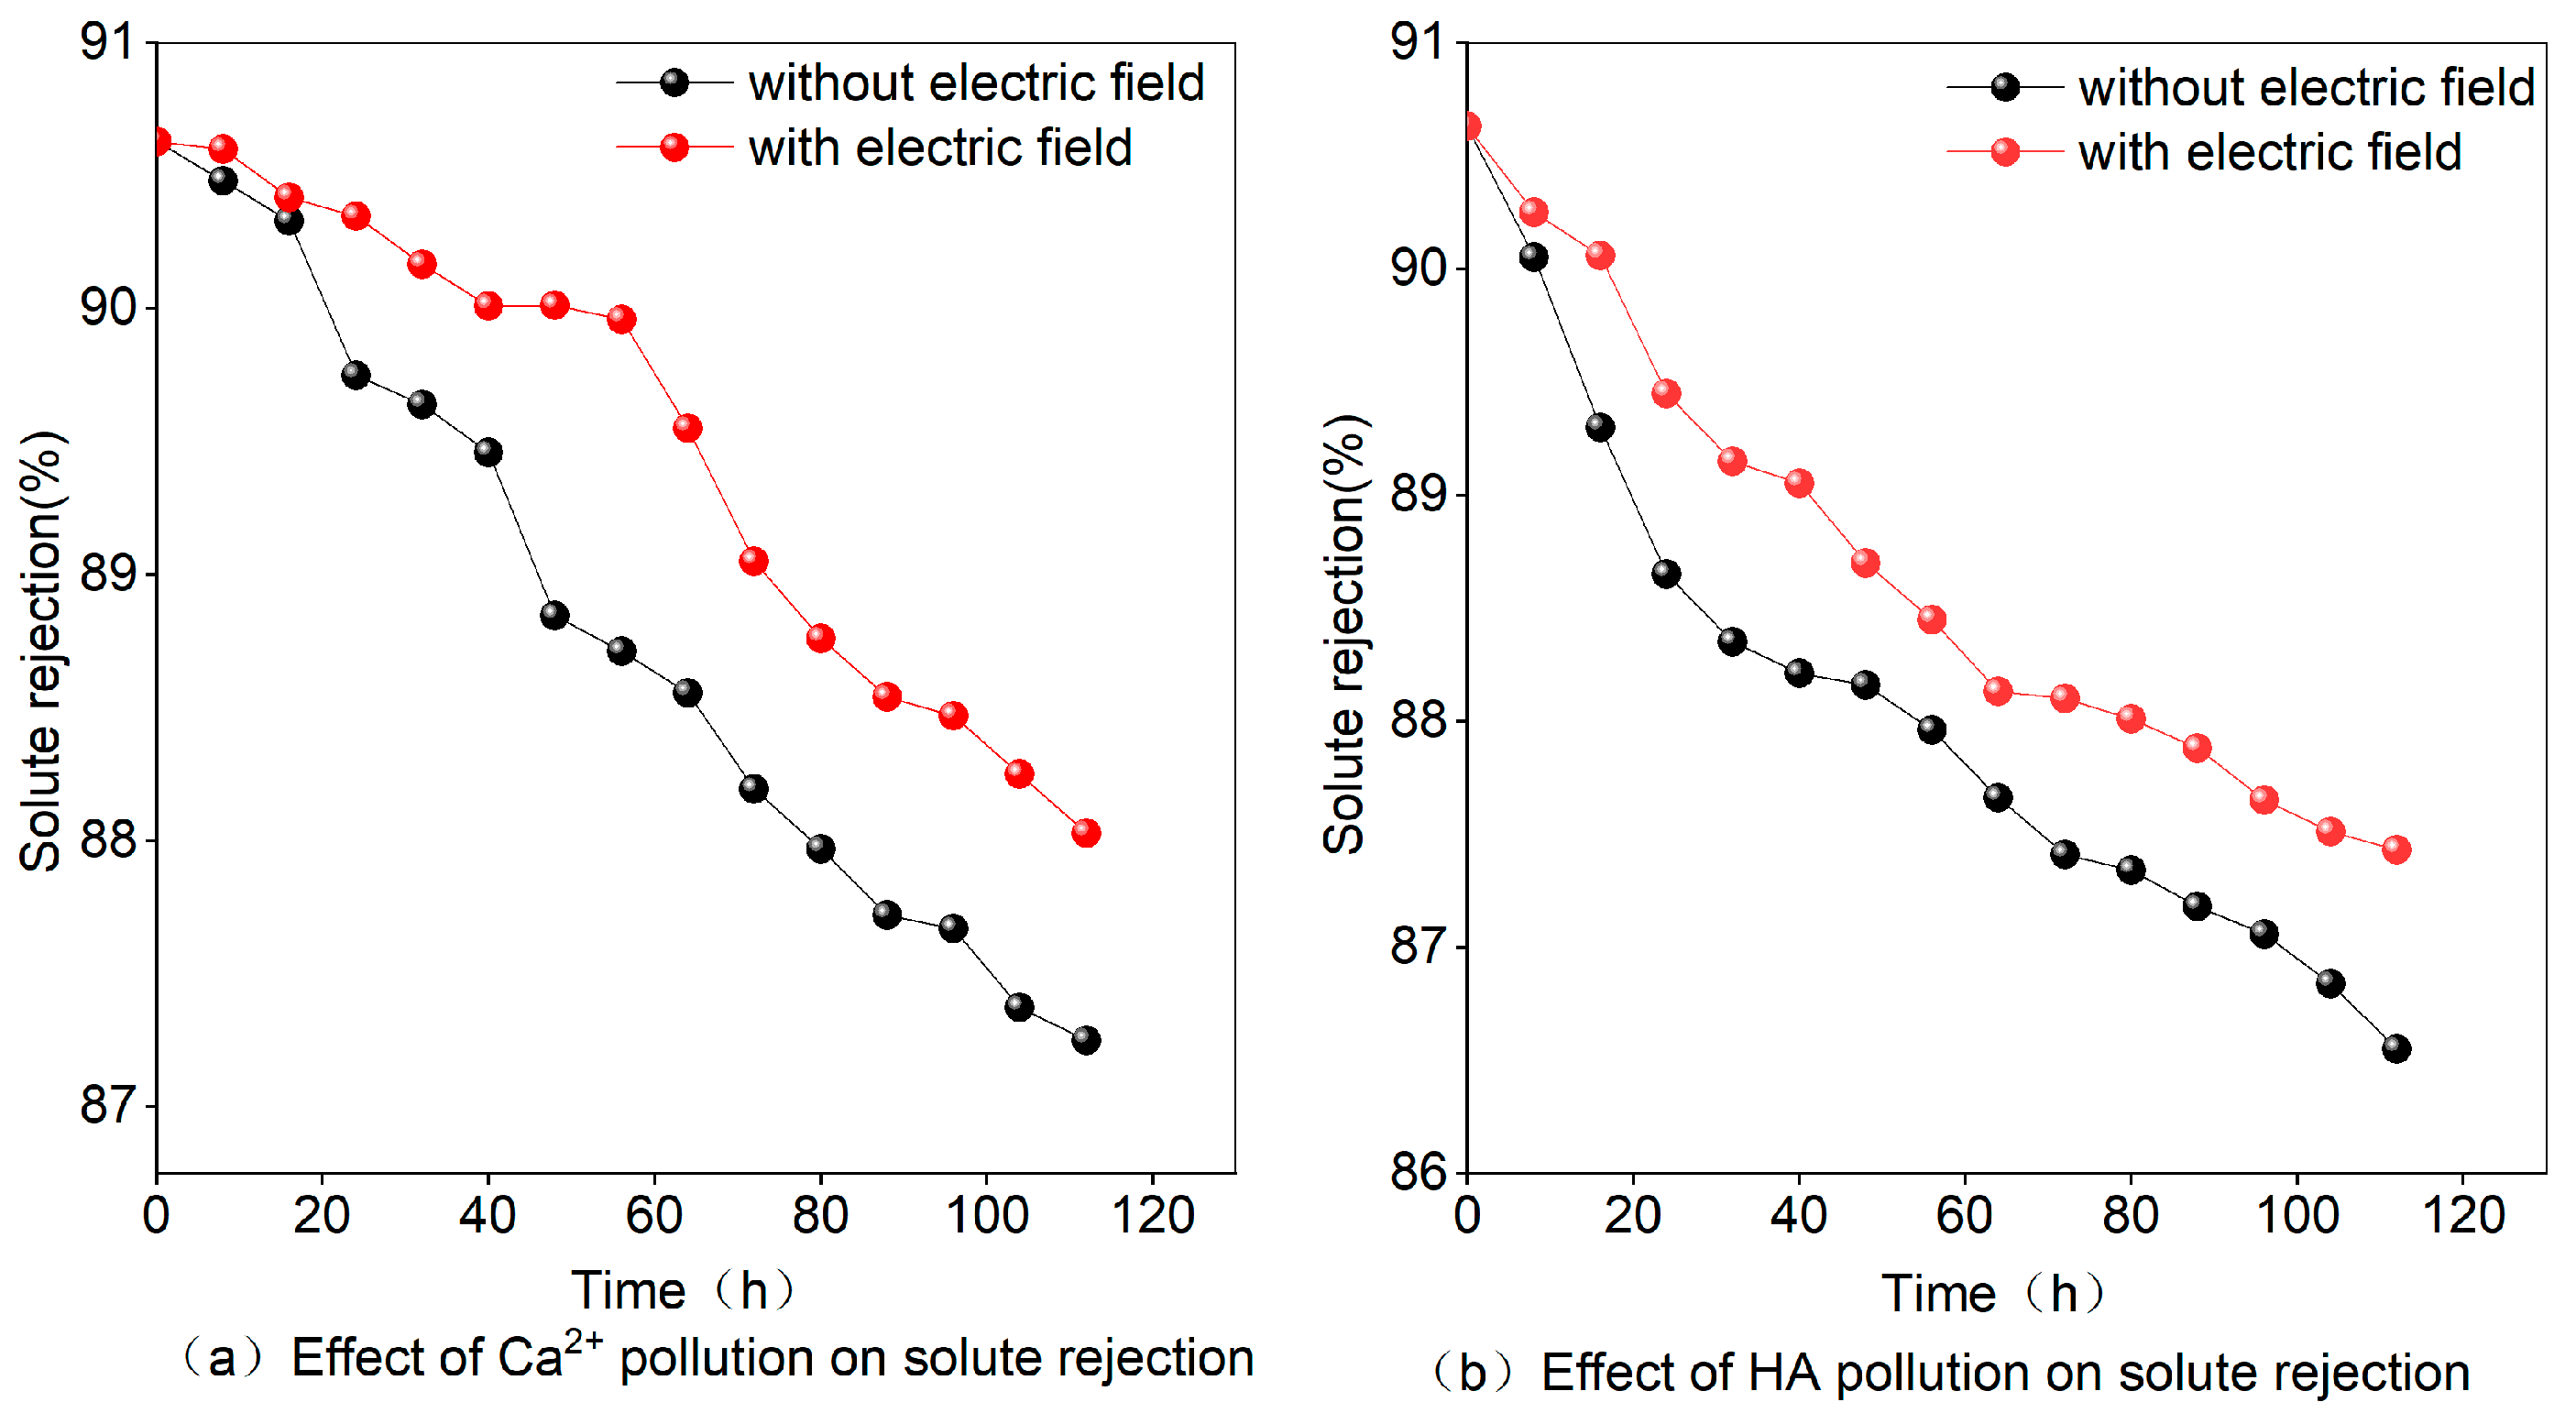
3.4. Effect of Ca2+ or HA on MFRO Solute Rejection under Electric Field Conditions
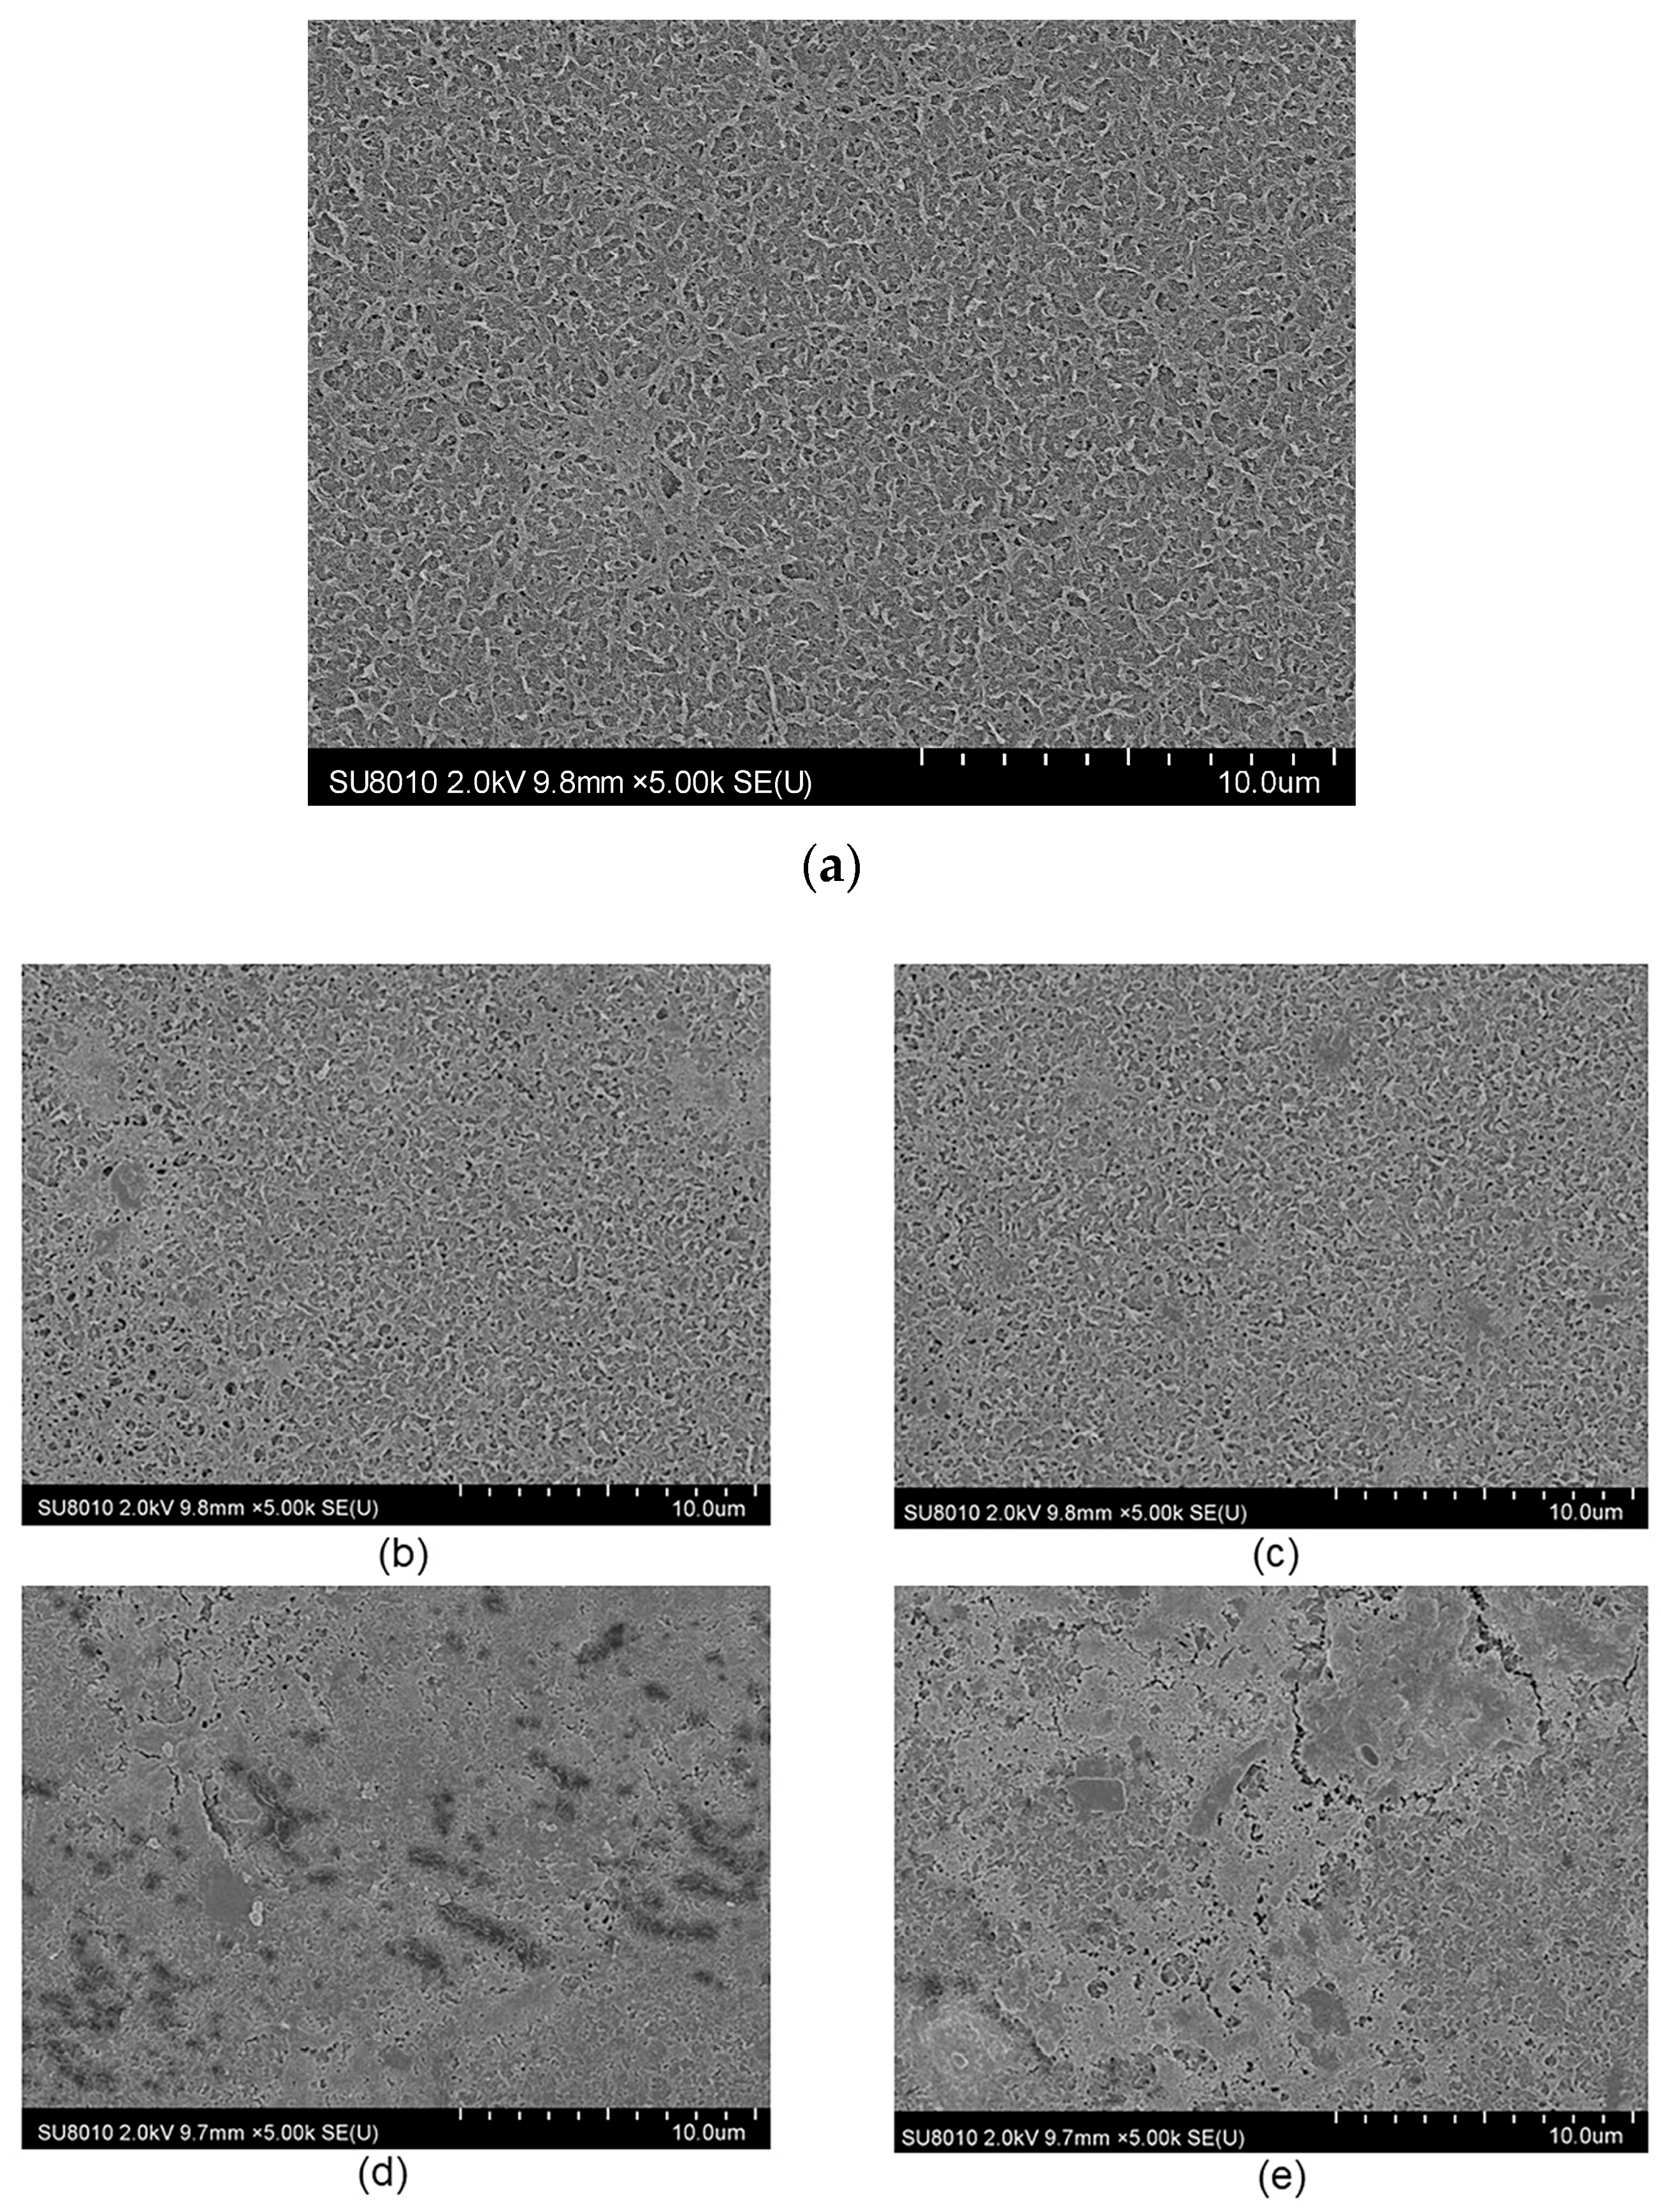
3.5. Membrane Fouling Characterization
4. Conclusions
Author Contributions
Funding
Institutional Review Board Statement
Informed Consent Statement
Data Availability Statement
Acknowledgments
Conflicts of Interest
References
- Skuse, C.; Gallego-Schmid, A.; Azapagic, A.; Gorgojo, P. Can emerging membrane-based desalination technologies replace reverse osmosis? Desalination 2021, 500, 114844. [Google Scholar] [CrossRef]
- Feria-Díaz, J.J.; Correa-Mahecha, F.; López-Méndez, M.C.; Rodríguez-Miranda, J.P.; Barrera-Rojas, J. Recent desalination technologies by hybridization and integration with reverse osmosis: A review. Water 2021, 13, 1369. [Google Scholar] [CrossRef]
- Khuwaileh, B.A.; Alzaabi, F.E.; Almomani, B.; Ali, M. Technology options and cost estimates of nuclear powered desalination in the United Arab Emirates. J. Nucl. Sci. Technol. 2023, 60, 223–237. [Google Scholar] [CrossRef]
- Elsaid, K.; Kamil, M.; Sayed, E.T.; Abdelkareem, M.A.; Wilberforce, T.; Olabi, A. Environmental impact of desalination technologies: A review. Sci. Total Environ. 2020, 748, 141528. [Google Scholar] [CrossRef]
- Kim, J.; Park, K.; Yang, D.R.; Hong, S. A comprehensive review of energy consumption of seawater reverse osmosis desalination plants. Appl. Energy 2019, 254, 113652. [Google Scholar] [CrossRef]
- Curto, D.; Franzitta, V.; Guercio, A. A review of the water desalination technologies. Appl. Sci. 2021, 11, 670. [Google Scholar] [CrossRef]
- Kurihara, M. Current Status and Future Trend of Dominant Commercial Reverse Osmosis Membranes. Membranes 2021, 11, 906. [Google Scholar] [CrossRef]
- Lin, S.; Zhao, H.; Zhu, L.; He, T.; Chen, S.; Gao, C.; Zhang, L. Seawater desalination technology and engineering in China: A review. Desalination 2021, 498, 114728. [Google Scholar] [CrossRef]
- Walschot, M.; Luis, P.; Liégeois, M. The challenges of reverse osmosis desalination: Solutions in Jordan. Water Int. 2020, 45, 112–124. [Google Scholar] [CrossRef]
- Trishitman, D.; Cassano, A.; Basile, A.; Rastogi, N.K. Reverse Osmosis for Industrial Wastewater Treatment. In Current Trends and Future Developments on (Bio-) Membranes; Elsevier: Amsterdam, The Netherlands, 2020; pp. 207–228. [Google Scholar]
- Wenten, I.G. Reverse osmosis applications: Prospect and challenges. Desalination 2016, 391, 112–125. [Google Scholar] [CrossRef]
- Jiang, W.; Xu, X.; Lin, L.; Wang, H.; Shaw, R.; Lucero, D.; Xu, P. A pilot study of an electromagnetic field for control of reverse osmosis membrane fouling and scaling during brackish groundwater desalination. Water 2019, 11, 1015. [Google Scholar] [CrossRef]
- Goh, P.S.; Zulhairun, A.K.; Ismail, A.F.; Hilal, N. Contemporary antibiofouling modifications of reverse osmosis desalination membrane: A review. Desalination 2019, 468, 114072. [Google Scholar] [CrossRef]
- Matin, A.; Laoui, T.; Falath, W.; Farooque, M. Fouling control in reverse osmosis for water desalination & reuse: Current practices & emerging environment-friendly technologies. Sci. Total Environ. 2021, 765, 142721. [Google Scholar] [PubMed]
- Li, Z.H.; Ni, G.W.; Wang, J.L.; Zhou, L.; Yang, Q.; Li, P.Z.; Bi, X.J. Fouling characteristic of reverse osmosis membrane for reclaimed water treatment operating under cold winter condition. Desalination 2023, 549, 116309. [Google Scholar] [CrossRef]
- Yokoyama, F.; Nakajima, M.; Ichikawa, S. Analysis of Calcium Sulfate Scaling Phenomena on Reverse Osmosis Membranes by Scaling-Based Flux Model. Membranes 2022, 12, 894. [Google Scholar] [CrossRef]
- Tong, T.; Wallace, A.F.; Zhao, S.; Wang, Z. Mineral scaling in membrane desalination: Mechanisms, mitigation strategies, and feasibility of scaling-resistant membranes. J. Membr. Sci. 2019, 579, 52–69. [Google Scholar] [CrossRef]
- Chiao, Y.H.; Nakagawa, K.; Matsuba, M.; Okamoto, M.; Shintani, T.; Sasaki, Y.; Matsuyama, H. Comparison of Fouling Behavior in Cellulose Triacetate Membranes Applied in Forward and Reverse Osmosis. Ind. Eng. Chem. Res. 2022, 61, 15345–15354. [Google Scholar] [CrossRef]
- Ruiz-García, A.; Nuez, I.; Carrascosa-Chisvert, M.D.; Santana, J.J. Simulations of BWRO systems under different feedwater characteristics. Analysis of operation windows and optimal operating points. Desalination 2020, 491, 114582. [Google Scholar] [CrossRef]
- Pearson, J.L.; Michael, P.R.; Ghaffour, N.; Missimer, T.M. Economics and energy consumption of brackish water reverse osmosis desalination: Innovations and impacts of feedwater quality. Membranes 2021, 11, 616. [Google Scholar] [CrossRef]
- Xiong, J.; Hou, Y.; Wang, J.; Liu, Z.; Qu, Y.; Li, Z.; Wang, X. The rejection of perfluoroalkyl substances by nanofiltration and reverse osmosis: Influencing factors and combination processes. Environ. Sci. Water Res. Technol. 2021, 7, 1928–1943. [Google Scholar] [CrossRef]
- Jiang, S.; Li, Y.; Ladewig, B.P. A review of reverse osmosis membrane fouling and control strategies. Sci. Total Environ. 2017, 595, 567–583. [Google Scholar] [CrossRef] [PubMed]
- Li, C.; Sun, W.; Lu, Z.; Ao, X.; Li, S. Ceramic nanocomposite membranes and membrane fouling: A review. Water Res. 2020, 175, 115674. [Google Scholar] [CrossRef] [PubMed]
- Younas, H.; Shao, J.; He, Y.; Fatima, G.; Jaffar, S.T.A.; Afridi, Z.U.R. Fouling-free ultrafiltration for humic acid removal. RSC Adv. 2018, 8, 24961–24969. [Google Scholar] [CrossRef] [PubMed]
- Li, C.; Guo, X.; Wang, X.; Fan, S.; Zhou, Q.; Shao, H.; Huang, J. Membrane fouling mitigation by coupling applied electric field in membrane system: Configuration, mechanism and performance. Electrochim. Acta 2018, 287, 124–134. [Google Scholar] [CrossRef]
- Du, Z.; Ji, M.; Li, R. Effects of different Ca2+ behavior patterns in the electric field on membrane fouling formation and removal of trace organic compounds. J. Environ. Sci. 2022, 111, 292–300. [Google Scholar] [CrossRef] [PubMed]
- Yin, X.; Li, X.; Hua, Z.; Ren, Y. The growth process of the cake layer and membrane fouling alleviation mechanism in a MBR assisted with the self-generated electric field. Water Res. 2020, 171, 115452. [Google Scholar] [CrossRef] [PubMed]
- Hu, C.; Li, M.; Sun, J.; Liu, R.; Liu, H.; Qu, J. NOM fouling resistance in response to electric field during electro-ultrafiltration: Significance of molecular polarity and weight. J. Colloid Interface Sci. 2019, 539, 11–18. [Google Scholar] [CrossRef]
- Xu, M.; Zhao, P.; Tang, C.Y.; Yi, X.; Wang, X. Preparation of electrically enhanced forward osmosis (FO) membrane by two-dimensional MXenes for organic fouling mitigation. Chin. Chem. Lett. 2022, 33, 3818–3822. [Google Scholar] [CrossRef]
- Munshi, F.M.; Hwang, J.H.; Park, J.; Sadmani, A.; Khan, M.A.; Jeon, B.H.; Lee, W.H. Electric field forward osmosis (EFFO) fouling mitigation in algae harvesting. Sep. Purif. Technol. 2023, 327, 124868. [Google Scholar] [CrossRef]
- Cao, S.; Wang, Y.; Zhang, Y.; Wang, G.; Su, T. Inhibition of membrane fouling by frequency agility electric field in desalination. J. Environ. Chem. Eng. 2023, 11, 110740. [Google Scholar] [CrossRef]
- Penteado de Almeida, J.; Stoll, Z.; Xu, P. An Alternating, Current-Induced Electromagnetic Field for Membrane Fouling and Scaling Control during Desalination of Secondary Effluent from Municipal Wastewater. Water 2023, 15, 2234. [Google Scholar] [CrossRef]
- Baek, Y.; Yoon, H.; Shim, S.; Choi, J.; Yoon, J. Electroconductive feed spacer as a tool for biofouling control in a membrane system for water treatment. Environ. Sci. Technol. Lett. 2014, 1, 179–184. [Google Scholar] [CrossRef]
- Paz-García, J.M.; Johannesson, B.; Ottosen, L.M.; Alshawabkeh, A.N.; Ribeiro, A.B.; Rodríguez-Maroto, J.M. Modeling of electrokinetic desalination of bricks. Electrochim. Acta 2012, 86, 213–222. [Google Scholar] [CrossRef]
- Asif, M.B.; Maqbool, T.; Zhang, Z. Electrochemical membrane bioreactors: State-of-the-art and future prospects. Sci. Total Environ. 2020, 741, 140233. [Google Scholar] [CrossRef]
- Jagannadh, S.N.; Muralidhara, H.S. Electrokinetics methods to control membrane fouling. Ind. Eng. Chem. Res. 1996, 35, 1133–1140. [Google Scholar] [CrossRef]
- Sarkar, B.; Pal, S.; Ghosh, T.B.; De, S.; DasGupta, S. A study of electric field enhanced ultrafiltration of synthetic fruit juice and optical quantification of gel deposition. J. Membr. Sci. 2008, 311, 112–120. [Google Scholar] [CrossRef]
- Karabelas, A.J.; Koutsou, C.P.; Kostoglou, M.; Sioutopoulos, D.C. Analysis of specific energy consumption in reverse osmosis desalination processes. Desalination 2018, 431, 15–21. [Google Scholar] [CrossRef]
- Mazlan, N.M.; Peshev, D.; Livingston, A.G. Energy consumption for desalination—A comparison of forward osmosis with reverse osmosis, and the potential for perfect membranes. Desalination 2016, 377, 138–151. [Google Scholar] [CrossRef]
- Qasim, M.; Badrelzaman, M.; Darwish, N.N.; Darwish, N.A.; Hilal, N. Reverse osmosis desalination: A state-of-the-art review. Desalination 2019, 459, 59–104. [Google Scholar] [CrossRef]
- Avraham, N.; Dosoretz, C.; Semiat, R. Osmotic backwash process in RO membranes. Desalination 2006, 199, 387–389. [Google Scholar] [CrossRef]
- Du, Z.; Ji, M.; Li, R. Enhancement of membrane fouling mitigation and trace organic compounds removal by electric field in a microfiltration reactor treating secondary effluent of a municipal wastewater treatment plant. Sci. Total Environ. 2022, 806, 151212. [Google Scholar] [CrossRef]


| No. | Feedwater Total Dissolved Solids (TDS) (mg/L) | Operating Pressure (MPa) | Sampling Methods |
|---|---|---|---|
| NaCl | |||
| 1 | 1000 | 0.36, 0.45, 0.5, 0.6 | Samples were taken at 15-min intervals, with each sample taken three times in parallel. |
| 2 | 2000 | ||
| 3 | 3000 |
| No. | Feedwater TDS (mg/L) | Operating Voltage (V) | Operating Pressure (MPa) | Sampling Methods |
|---|---|---|---|---|
| NaCl | ||||
| 1 | 1000 | 0, 5, 10,15, 20, 25 | 0.5 | Samples were taken at 15-min intervals, with each sample taken three times in parallel. |
| 2 | 2000 | |||
| 3 | 3000 |
| No. | Feedwater TDS (mg/L) | Operating Voltage (V) | Operating Pressure (MPa) | Sampling Methods | ||
|---|---|---|---|---|---|---|
| NaCl | CaCl2 | HA | ||||
| 1 | 3000 | 200 | 0 | 10 | 0.5 | Samples were taken at 8-h intervals and each sample was taken three times in parallel for a total working time of 120 h. |
| 2 | 3000 | 0 | 20 | |||
| 3 | 3000 | 0 | 0 | |||
Disclaimer/Publisher’s Note: The statements, opinions and data contained in all publications are solely those of the individual author(s) and contributor(s) and not of MDPI and/or the editor(s). MDPI and/or the editor(s) disclaim responsibility for any injury to people or property resulting from any ideas, methods, instructions or products referred to in the content. |
© 2024 by the authors. Licensee MDPI, Basel, Switzerland. This article is an open access article distributed under the terms and conditions of the Creative Commons Attribution (CC BY) license (https://creativecommons.org/licenses/by/4.0/).
Share and Cite
Fu, C.; Yi, X.; Gao, Y. Effect of Electric Field on Membrane Fouling and Membrane Performance in Reverse Osmosis Treatment of Brackish Water. Appl. Sci. 2024, 14, 575. https://doi.org/10.3390/app14020575
Fu C, Yi X, Gao Y. Effect of Electric Field on Membrane Fouling and Membrane Performance in Reverse Osmosis Treatment of Brackish Water. Applied Sciences. 2024; 14(2):575. https://doi.org/10.3390/app14020575
Chicago/Turabian StyleFu, Caixia, Xuenong Yi, and Yuqiong Gao. 2024. "Effect of Electric Field on Membrane Fouling and Membrane Performance in Reverse Osmosis Treatment of Brackish Water" Applied Sciences 14, no. 2: 575. https://doi.org/10.3390/app14020575
APA StyleFu, C., Yi, X., & Gao, Y. (2024). Effect of Electric Field on Membrane Fouling and Membrane Performance in Reverse Osmosis Treatment of Brackish Water. Applied Sciences, 14(2), 575. https://doi.org/10.3390/app14020575