1. Introduction
The detection and recognition of traffic signs has the potential to significantly improve vehicular environment perception. In the context of road navigation, the ability to acquire precise, real-time traffic sign information stands as a pivotal asset.
Recent advancements in research have prominently harnessed the capabilities of deep learning techniques, with a notable emphasis on leveraging Convolutional Neural Networks (CNNs) [
1,
2]. These techniques have been adeptly applied to extract features that facilitate the tasks of detection and classification. The typical workflow involves training the network on an annotated dataset and subsequently subjecting the model to validation and testing phases specifically tailored for traffic sign detection.
Presently, two distinct strategies have emerged as prominent avenues for object detection: the region-suggestion-based strategy and the regression-based strategy. The former strategy adheres to conventional object detection paradigms, generating and categorizing region proposals. Within this category, notable methodologies include R-CNN [
3], SPP-Net [
4], Fast-RCNN [
5], Mask-RCNN [
6], and Faster-RCNN [
7]. Yang et al. [
8] introduced the AT attention network within the framework of Faster R-CNN, enabling the precise identification of regions of interest. Subsequently, the utilization of a fine region proposal network (FRPN) yielded exceptional performance with an 80.31% mAP score on the TT100K dataset [
9]. Additionally, Lu et al. [
10] pioneered the use of a visual attention model, which tactically focuses exclusively on specific regions, obviating the need to process the entire image for detection.
Noteworthy contributions also include the cascaded network approach by Zhang et al. [
11], which uses the R-ANN model for joint training and multi-scale capabilities. The concept of a pyramid network characteristic was introduced by Lin et al. [
9], adeptly addressing multi-scale object detection. This architecture comprises two principal components: a multi-scale pyramidal hierarchy drawn from CNN’s inherent structure and a top-down network structure featuring horizontal connections. By amalgamating high-level feature maps across scales, each containing semantic insights, this approach ascertains a universal feature extractor, which is a significant advancement.
Further elevating the field, Wang et al. [
12] adopted the Res2Net [
13] network architecture, serving as Faster R-CNN’s foundation. This innovation extended to the refinement of the original Non-Maximum Suppression (NMS) calculation method, utilizing both confidence and intersection over union (IOU) as evaluation criteria. The outcome was a remarkably improved bounding box generation accuracy, culminating in an impressive 87.4% average precision (AP).
In summation, recent research within the realm of traffic sign detection has been characterized by the proficient deployment of deep learning, particularly hinged upon CNNs. This approach, bolstered by an array of innovative strategies and architectures, has garnered remarkable advancements in both accuracy and efficacy across various benchmark datasets.
Building upon the insights gleaned from the aforementioned literature, in this research, we describe a novel CNN-based architecture for traffic sign detection. Our work is motivated by the aspiration to contribute to the field and expand its horizons. The central contributions of this research are articulated as follows:
- (1)
Enhanced K-means++ Anchor Frame Clustering Algorithm: We carefully re-cluster the dataset using an enhanced version of the K-means++ anchor frame clustering technique. The objective is to derive initial candidate frames that are notably more accurate, thus priming our network for improved performance.
- (2)
Refined Backbone Network Structure and H-SPPF Module: The structure of our backbone network is strategically revised to prioritize the detection of diminutive objects. Additionally, we propose a hybrid spatial pyramidal pooling H-SPPF module. This module introduces a mechanism for extracting contextual information that is richer and more nuanced, thereby elevating the model’s capacity.
- (3)
Channel Attention Mechanism Integration: We integrate the channel attention mechanism into our network’s architecture. This addition is integral to amplifying the model’s prowess in extracting pertinent features from road traffic sign objects.
This paper’s remaining content is as follows: The hybrid pyramidal pooling module’s composition is described in depth in Section II. The suggested network structure in this paper is the subject of Section III. Section IV outlines the experimental dataset as well as parameter settings and evaluation metrics. Section V gives the results of the comparison experiments and the ablation experiments. Section VI offers a summary of this paper’s algorithm as well as an outlook for subsequent work.
2. Related Work
Object detection is approached as a regression problem with bounding box and category probabilities in regression-based object detection algorithms, and representatives of regression-based object detection frameworks include SSD [
14], YOLO [
15,
16,
17] series, etc. By extracting characteristics from the network and performing detection and classification, this end-to-end object detection algorithm may significantly increase the speed of detection and provide an algorithm model with high real-time performance that is better suited for use on smart device terminals, such as in-vehicle advanced assisted driving systems [
18], driverless systems, etc. Garg et al. [
19] conducted a study investigating three algorithms—SSD [
20], Faster RCNN [
7], and YOLOv2 [
16]—on five different traffic sign object classes and evaluated the results, which demonstrated that while YOLOv2’s detection speed is three times faster than Faster RCNN, its accuracy is comparable to that of SSD and Faster RCNN. In order to enhance the network model structure of YOLOv3, Zhang et al. [
21] suggested developing a multi-scale spatial pyramid pooling employing global features and multi-scale local region features module [
22], thus enhancing the precision of small item identification [
23,
24]. In order to accommodate small objects, Wang et al. [
25] modified the scale of the original output feature map and substituted GIOU [
26] for IOU in the distance formula of the K-means clustering algorithm. This improved YOLOv4-Tiny increased the mAP in the traffic sign recognition task by 5.73% over the original algorithm. In order to obtain more picture channel characteristics, Zhang et al. [
27] created a new feature pyramid structure called BiFPN in place of FPN in YOLOv4. The experimental findings revealed that the mAP was 1.03% higher than that of the traditional YOLOv4 model. Our approach is refined using YOLOv5s to enhance the capacity to recognize small traffic sign objects and subsequently address the issue of low-accuracy small traffic sign detection in real-world settings.
3. Method
3.1. K-Means Clustering Algorithm Improvement
The initial candidate frame is obtained by clustering the COCO dataset [
28] in the YOLOv5 algorithm. The images in this dataset come from complex daily scenes and contain categories such as people, vehicles, animals, common household items, etc. The initial candidate frame obtained by clustering this dataset does not match the size and characteristics of the traffic sign dataset studied in this paper. Therefore, for the dataset obtained by augmenting the TT100K dataset [
29] used in this paper, a new clustering is needed to obtain a more accurate initial candidate frame, as shown in
Table 1. The specific steps are as follows:
First item: randomly select 1 sample object clustering center from the traffic sign dataset.
Second item: First, the distance between each sample object in the traffic sign dataset and the currently selected n (1 ≤ n ≤ K) clustering centers is calculated and expressed as D(x). The likelihood of each sample object being chosen as the subsequent cluster center is then computed. Afterwards, in the process of choosing the n + 1th cluster center, the larger the value of D(x), the higher the probability of the point being chosen as the n + 1st cluster center. (b) Lastly, the roulette wheel approach is used to choose the subsequent cluster centroid.
Iterate 2 again until K clustering centers are chosen.
The following is identical to the K-means clustering approach.
The selected TT100K traffic sign dataset is used as a benchmark for clustering the labeled dataset.
3.2. Improved Multi-Scale Feature Fusion Structure
Multi-scale feature fusion can be used to increase microscopic item detection accuracy. The feature fusion layer in the standard YOLOv5s model uses PANet [
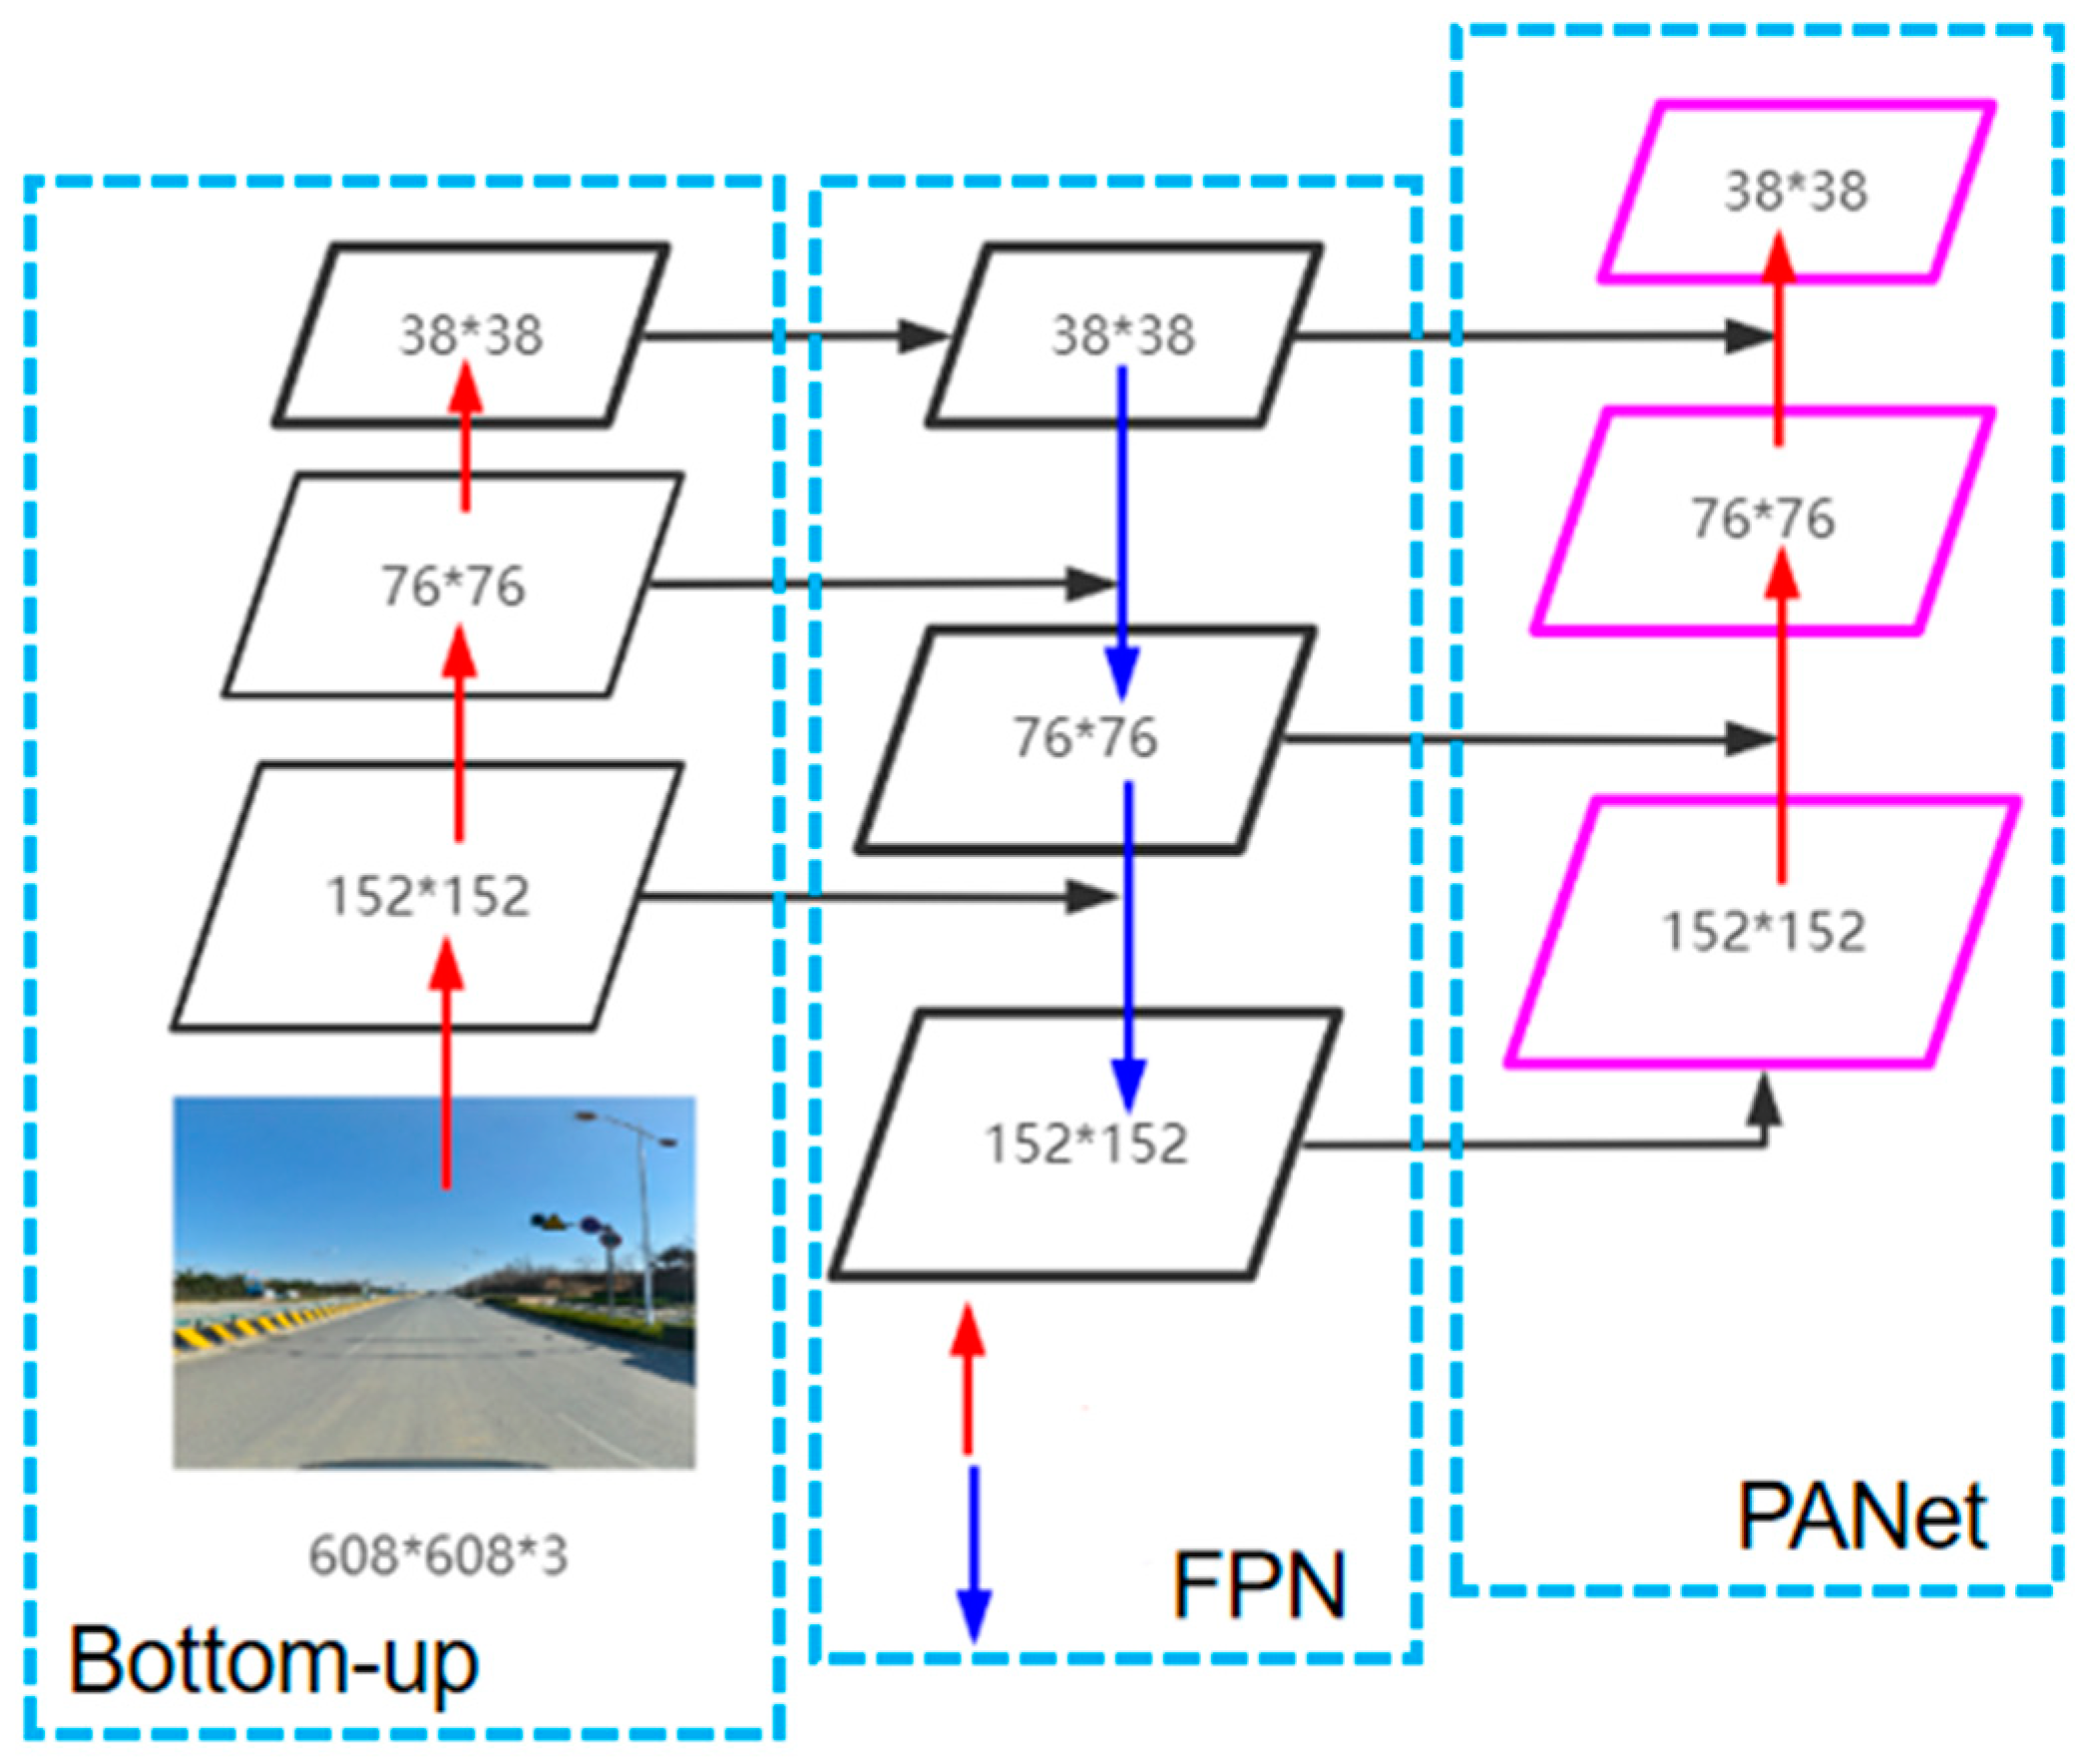
30] to improve the efficiency of information transfer from the bottom to the top layer in FPN, augmenting the whole feature pyramid layer with the precise location information in the lower layer, as well as reducing the information path’s length between features at the lower and upper layers. Generally speaking, the perceptual field is the region that is applied to the input image, and as the number of layers deepens, the perceptual field of the network progressively grows. As a result, the shallow feature map with high resolution has a smaller, richer spatial location information-rich perceptual field that is better suited for the detection of small objects, whereas the deeper feature map with low resolution has a larger and more advantageous perceptual field for the detection of large objects. Three feature maps are produced by the feature fusion in the YOLOv5 standard model, and these are utilized for the detection of large, medium, and small objects. Given that traffic sign objects are often small objects, this research improves the multi-scale feature fusion structure.
In order to enhance the model’s sensitivity to small object features without expanding its size, the bottom convolutional module, the C3 module in the backbone network, and the 19 × 19 feature fusion module in the feature fusion layer are removed initially. The 32-fold downsampling is then substituted with 16-fold downsampling, and a new feature fusion module measuring 152 × 152 is subsequently added to the feature layer.
Figure 1 illustrates the improved feature fusion structure. In order to increase the model’s capacity for small object recognition, the upgraded FPN and PANet modules work together to augment the semantic and spatial information of traffic signs.
3.3. Space Pyramid Module
The basic YOLOv5s SPPF module uses a spatial pyramid module with maximum pooling, and the extraction of global features also heavily relies on average pooling. In this research, we present the hybrid spatial pyramid pooling (H-SPPF) module, which further improves the extraction of network contextual information by fusing three distinct sizes of average pooling operations into the SPPF module. The specific structure of H-SPPF is displayed in
Figure 2.
As shown in the picture, the H-SPPF module is composed of an average pooling layer and a maximum pooling layer with a pooling kernel size of 5 × 5. This feature map is then input into three sequentially connected maximum pooling layers with a 5 × 5 pooling kernel size to generate six separate feature maps. These six generated feature maps are subsequently combined with
to complete the fusion of global and local features, resulting in a feature map with a richer perceptual field. Finally, a Conv module is used to obtain the final output
. The whole calculation process can be expressed by Equation (1).
where
denotes the result of the first Conv output,
= “Conv”(
); the symbol M() represents the largest pooling operation when using a 5 × 5 pooling kernel size; and the average pooling operation with a 5 × 5 pooling kernel size is indicated by the symbol A().
The H-SPPF module improves the network’s capacity to gather global and local features and allows it to obtain more contextual information by combining the maximum pooling layer and the average pooling layer. This further increases the network model’s accuracy.
3.4. Fusion Attention Mechanism
In order to enhance the precision of road traffic sign object detection and identification, this research presents the SE attention mechanism within the YOLOv5 base network [
31].
Figure 3 displays the SE attention mechanism’s algorithm structure. To obtain the feature map U, the input feature map X is first subjected to a convolution operation. The feature map comes next. Equation (2) illustrates how U is put through a global average pooling operation to provide the statistical data for every channel in the feature map.
where
represents the squeezing operation and
is the feature map obtained after convolution. It is further supplied into the excitation operation for the result z_c contained operation. The nonlinear activation functions and two completely connected layers make up the majority of the excitation operation, which are ReLU and Sigmoid, respectively, and the formula is shown in Equation (3).
where
represents the excitation operation,
represents the activation function of ReLU,
represents the activation function of Sigmoid, and
and
are two linear transformations. The establishment of inter-channel correlation can be accomplished by the excitation operation, and the normalized weight information vectors of different channels, denoted by s, are obtained. Finally, the relevant channel of the feature map is multiplied by the created weight feature vector s. U to give the feature map weights U to obtain the feature map that will be used as the final output to improve the identified object’s features.
In this paper, as seen in
Figure 3a,b, which depict the structures of the SEBottleNeck and C3SE modules, respectively, SE is fused into the C3 module to produce the C3SE module. Then, the SEs are fused into different positions of the network model for experimental comparison to obtain the optimal adding position, bolster the network model’s capacity to extract objects from road traffic signs, and raise the items’ detection precision.
The paper’s enhanced network model’s structural diagram, as shown in
Figure 4:
4. Experiments and Discussion
4.1. Datasets
The TT100K dataset includes more than 100 traffic sign categories, but similar tunnel signs, attention to livestock, attention to falling rocks, and other traffic signs rarely appear in the urban traffic environment; so, this paper selects the 72 categories of traffic signs that are more commonly found in the urban traffic environment for identification, which is mainly divided into the three major categories of prohibited signs, warning signs, and directional signs, and are further subdivided into the above traffic signs. For the traffic signs mentioned above, the groups are further separated, as
Figure 5 illustrates. The baseline dataset in this work is the newly obtained dataset that underwent augmentation based on the TT100K dataset. The augmented dataset is separated into training, validation, and test sets with a division ratio of 8:1:1.
4.2. Experimental Parameter Settings and Experimental Methods
In this research, we validate the efficacy of the network using ablation experiments and comparison tests on a TT100K dataset following dataset augmentation. The pertinent model parameters during training are displayed in
Table 2.
In order to assess the efficacy of the object detection model, this study chooses FPS (Frames Per Second) as the detection rate measure, which is the number of frames the model can detect in a second; precision rate P; recall rate R; and mean average precision mAP@0.5 and mAP@0.5:0.95 as the model accuracy measures.
Figure 6 illustrates how the test results are divided by the confusion matrix.
4.3. Analysis of Ablation Experiments
In this section, an ablation study will be conducted for each module proposed to be improved in this paper, and the effectiveness of the improved modules will be verified by adding and removing the corresponding modules during model training and comparing the training results.
4.3.1. Analysis of the Effectiveness of Dataset Enhancement and Expansion
Table 3 displays the experimental comparison results using the dataset expansion and enhancement method of this paper. From these results, it can be concluded that the precision rate, recall rate, and average precision of the obtained experiments have greatly improved when compared to the original dataset. This indicates the necessity and effectiveness of the dataset expansion and enhancement in this paper. Following the dataset expansion, because of the increase in the number of labels of each category, the number of samples available for the learning of the network model is also increased.
4.3.2. Enhance the Multi-Scale Feature Fusion Module’s Efficacy Analysis
The experimental comparison of the model’s performance before and after the enhanced multi-scale feature fusion method is presented in
Table 4. In
Table 4, YOLOv5s denotes the standard network model and YOLOv5s+ denotes the improved network model. The enhanced multi-scale feature fusion module strengthens the semantic and spatial information of traffic signs and enhances the model’s capacity to detect traffic signs, as shown by
Table 4’s improvements in the precision rate P, recall rate R, mAP@0.5, and mAP@0.5:0.95. Furthermore, there is very little change in FPS between the network model before and after the improvement; so, the detection rate is almost unaffected and can still maintain the same detection rate as the standard network model.
4.3.3. Improved Anchor Frame Clustering Algorithm Effectiveness Analysis
The experimental comparison findings with and without the clustering approach suggested in this paper are displayed in
Table 5. The clustering algorithm used before improvement is indicated by YOLOv5s+ in
Table 5, whereas the clustering algorithm suggested in this research is indicated by YOLOv5s+_K. From
Table 5, it can be found that using the improved clustering algorithm improves the overall detection performance. Among them, the accuracy P is improved by about 1.2%, which shows the effectiveness of the improved clustering algorithm. This is primarily because the upgraded K-means clustering method can generate more appropriate initial candidate frames for traffic signs based on the TT100K dataset, which allows the network model to extract road traffic sign information more effectively.
4.3.4. H-SPPF Module Effectiveness Analysis
Table 6 displays the outcomes of the experimental comparison of model performance before and after using the H-SPPF module. The usage of the SPPF module is shown in
Table 6 by YOLOv5s+_K, while the use of the H-SPPF module suggested in this study is indicated by YOLOv5s+_K_HSPPF. As the table illustrates, after using the H-SPPF module, the recall rate improved by 0.21% compared to that without the module, mAP@0.5 improved by 0.18%, and the remaining metrics have a minimal difference in performance from that without the module, thus confirming that the H-SPPF module proposed in this paper can improve the network’s capacity to gather both global and local features, further improving the model’s detection performance.
4.3.5. Evaluation of the Attention Mechanism Module’s Efficacy
To further verify the validity of the adding position of the attention mechanism as well as the adding method, and to obtain the optimal adding result, this paper conducts relevant experiments on the adding position of the SE attention mechanism.
Table 7 displays the comparison findings of the experiments. Among them, YOLOv5s+_K_HSPPF represents the network model after the improvement described above; Y_C3SE_B, Y_C3SE_N, and Y_C3SE_H symbolize the incorporation of the SE attention mechanism into the backbone network’s final C3 module, the C3 module of the Neck part, and the C3 module ahead of the model’s detection header, respectively, based on the improvement in the previous three subsections; and the fusion of the SE attention mechanism in the final C3 module of the backbone network and the C3 module of the Neck portion is represented by Y_SE_B_SE_N, respectively.
Indicating whether the attention mechanism module is fused in the appropriate model portion or not, “×” and “√”, respectively, denote the state of the attention mechanism module.
Table 7 illustrates that the final fusion procedure yields the best outcomes, fusing the SE attention mechanism in the backbone network and Neck part. Specifically, after fusion in the backbone network, the Neck portion, and the C3 module prior to the detecting head, the average accuracy drops rather than rises. In contrast, in this paper, the last C3 module of the backbone network and the C3 module of the neck part of the recall rate and average accuracy obtained from the mAP@0.5 trials—91.77% and 93.88%, respectively—are where the SE attention mechanism is fused (the table in black bold font reveals); both metrics are improved over the model before adding the attention mechanism, by 3.84% and 0.75%, respectively.
Therefore, the ability of the model to recognize object features can be strengthened by combining the SE attention mechanism in the Neck component and the backbone network, respectively, utilizing the channel attention. This enhances the model’s ability to extract the road traffic sign objects. Consequently, it demonstrates how the attention techniques proposed in this research can be combined to further improve the model’s performance.
4.4. Comparative Analysis of Overall Experimental Results
In this section, the effectiveness of the improvement strategy of this paper will be verified from the perspectives of both theoretical analysis and actual detection results. The standard YOLOv5s model and the model YOLOv5s+_K_HSPPF_SE proposed in this paper will be quantitatively and qualitatively analyzed.
On the augmented TT100K dataset,
Table 8 presents the comparison findings between the basic YOLOv5s model and the network model YOLOv5s+_K_HSPPF_SE suggested in this paper. From the table, the following conclusions can be summarized: the precision, recall, and average precision are all improved compared with the standard model, in which the precision is improved by 1.71%, the recall is improved by 8.09%, mAP@0.5 improved by 6.0%, and mAP@0.5:0.95 improved by 4.28%, which indicates that the improved model according to the improvement strategy of this paper has a more substantial improvement in the detection performance compared with the standard model, which also confirms the progress and efficacy of the reform plan put forward in this work. When it comes to real-time performance, there is very little difference between the enhanced model and the standard model. The enhanced model maintains a high level of real-time performance while making significant gains in detection performance, which allows it to meet the real-time requirements of the research presented in this paper.
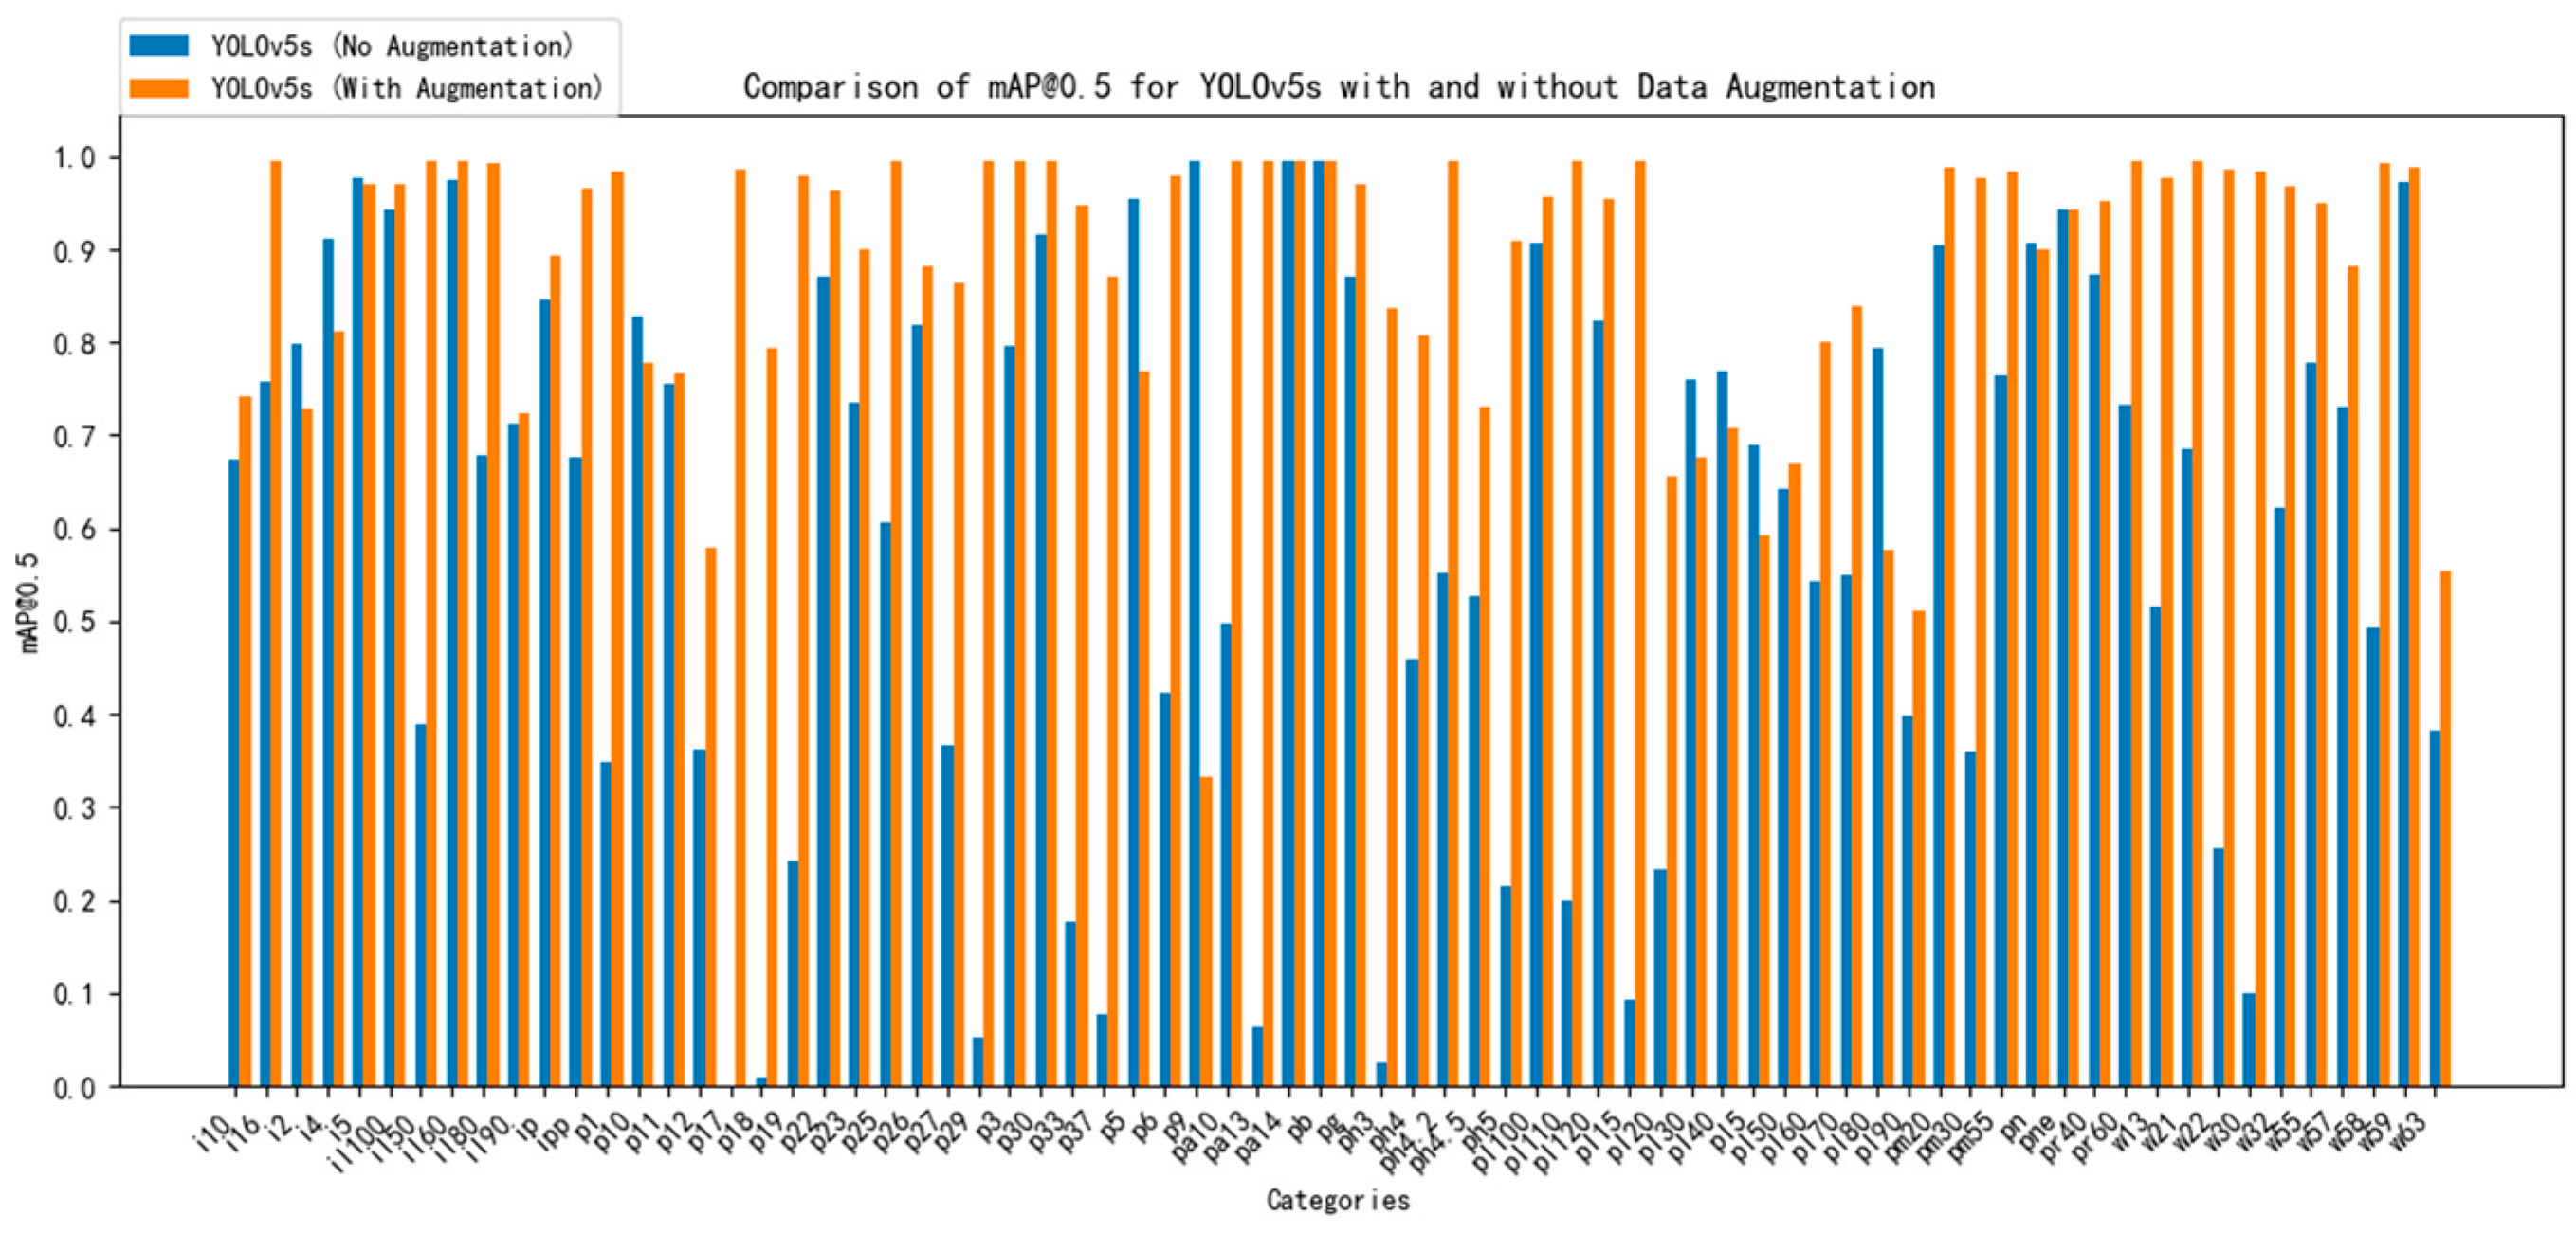
Figure 7 shows the results of the mean average precision for each traffic sign category obtained before and after the amplification of the dataset using the standard YOLOv5s model, respectively. The cyan line represents the mean average precision value of each category obtained on the unamplified dataset, and the red line represents the mean average precision value of each category obtained on the post-amplified dataset.
When the dataset is not augmented, due to the uneven distribution of instances of each category in the dataset, it leads to the traffic signs with a large number of category instances obtaining a better mean average accuracy, while the traffic signs with a small number of category instances have a lower mean average accuracy. The number of categories with mAP@0.5 values below 0.5 is as high as 25, which has a significant impact on the model’s detection accuracy.
On the other hand, on the dataset obtained by using the dataset augmentation method of this paper, each traffic sign’s category instances are distributed more evenly, which results in greater mean average precision values for each category. There was only one category with mAP@0.5 values lower than 0.5, demonstrating both the need for and the efficacy of the augmentation strategy used in this work.
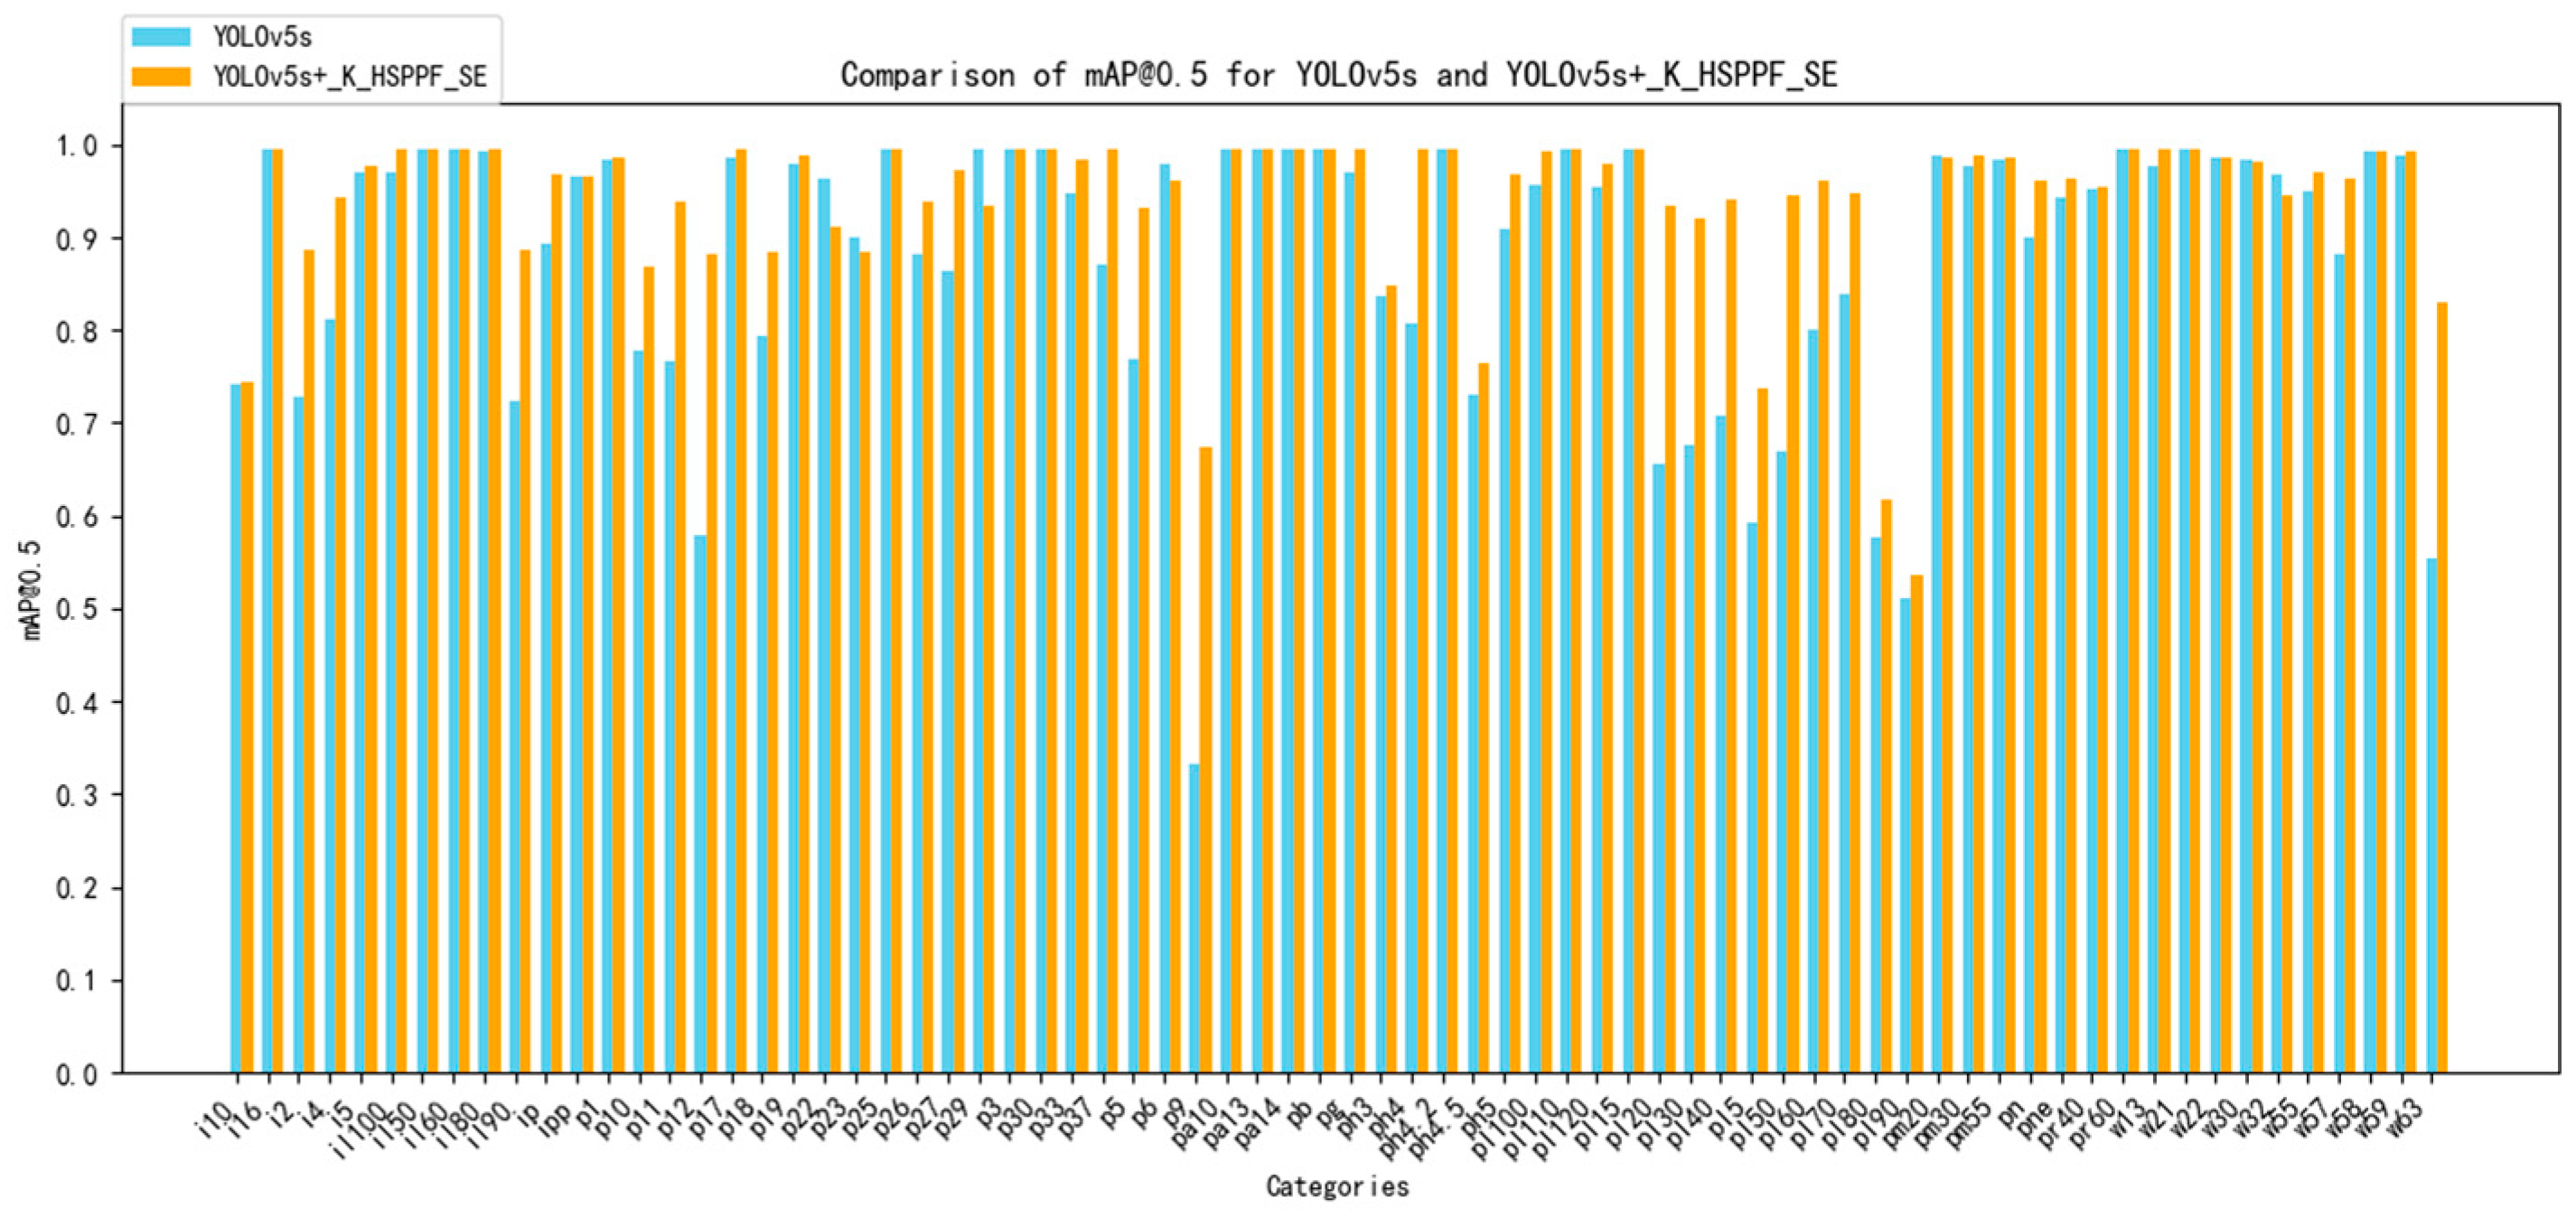
The results of the mean average precision value of detection in each category before and after the model improvement on the enhanced dataset are compared in
Figure 8. The red folded line represents the mean average accuracy of the standard YOLOv5s model in each category, and the blue folded line represents the mean average accuracy of the YOLOv5s+_K_HSPPF_SE model in this paper in each category.
Figure 8 makes it clear that, for just five of the seventy-two traffic sign categories examined in this research, the mean average accuracy attained by the YOLOv5s+_K_HSPPF_SE model is less than that of the regular YOLOv5s model, and the average accuracy of the remaining categories of traffic signs is higher than those obtained by the standard YOLOv5s model, which indicates that this article further verifies the efficacy of the improvement technique in this paper by demonstrating a good comprehension of the conventional YOLOv5s network model, which can enhance the average accuracy of most traffic sign categories.
5. Discussion
We tested the suggested approach on the TT100K dataset in the aforementioned studies. It attains an intersection over union (IoU) threshold of 0.5, an accuracy rate of 91.72%, a recall rate of 91.77%, a mean average precision(mAP) of 93.88%, and a mAP of 75.81% at a range of IoU thresholds from 0.5 to 0.95. In comparison to YOLOv5, which has 90.01% precision, 90.01% recall, 87.88% mean average precision (mAP) at 0.5 intersection over union (IoU) threshold, and 71.53% mAP for a range of IoU thresholds from 0.5 to 0.95, there is a significant increase.
Figure 9 displays the incomplete visualization results of the suggested strategy in the intelligent transportation setting.
We have shown the discrepancies between the results with a red circle in the detection results graphic. It is evident that the suggested approach performs better in tasks involving the detection of small objects and significantly enhances small object detection.
In each of the following sets of comparison graphs, the left column represents undetected images of real road scenes, the middle column represents the results of detecting images using weights derived from the standard YOLOv5s network model trained on the augmented dataset, and the right column represents the results of detecting images using weights derived from the improved network model proposed in this paper trained on the augmented dataset.
6. Conclusions
The proposed improved model’s detection skills were thoroughly assessed in this study in comparison to the baseline YOLOv5s model. Extensive experiments were carried out using real road scenes and diverse traffic sign scenarios, demonstrating the effectiveness of the enhanced model.
The outcomes demonstrate how well the upgraded network model detected small items. The introduced enhancements significantly improved the accuracy of detecting small traffic signs, as shown in
Figure 10. Additionally, the proposed model outperformed the standard YOLOv5s model under challenging conditions such as dim lighting and interference from surrounding advertisements by accurately identifying traffic signs and exhibiting robustness against interference.
Moreover, the expanded dataset helped the model become more universal. The proposed model successfully detected small traffic signs like pl80, indicating the effectiveness of the improvements made for detecting small objects. This trend continued in subsequent experiments, with the model accurately recognizing various traffic signs, even in complex scenarios.
Moreover, the improved model showcased its robustness and superior detection performance in various situations. It accurately identified traffic signs during turns, detected distant and smaller objects, and avoided misclassifications even in the presence of interference. The model’s ability to accurately detect tilted traffic signs and smaller distant signs was especially impressive, demonstrating its advanced characteristics that outperformed those of the YOLOv5s model.
In summary, the outcomes of comprehensive tests confirm that the suggested enhancements are successful. Not only does the improved model greatly increase the accuracy of small item identification, but it also demonstrates exceptional resilience in a range of difficult situations. This research builds a solid basis for future developments in practical applications, like autonomous driving and intelligent transportation systems, and adds significant insights to the field of traffic sign identification algorithms.
Author Contributions
Conceptualization, Y.C. and H.Y.; methodology, Y.C. and D.G.; software, Y.C.; validation, Y.C. and H.G.; formal analysis, Y.C.; investigation, H.Y.; data curation, Y.C. and H.Y.; writing—original draft preparation, Y.C. and H.T. All authors have read and agreed to the published version of the manuscript.
Funding
This work was supported by the National Key Research and Development Program of China under Grant 2020YFB1313400.
Institutional Review Board Statement
Not applicable.
Informed Consent Statement
Not applicable.
Data Availability Statement
The data source used in this article is TT100K (China Traffic Sign Dataset).
Conflicts of Interest
The authors declare no conflicts of interest.
References
- Liu, Z.; Qi, M.; Shen, C.; Fang, Y.; Zhao, X. Cascade saccade machine learning network with hierarchical classes for traffic sign detection. Sustain. Cities Soc. 2021, 67, 102700. [Google Scholar] [CrossRef]
- Huang, W.; Zhang, L.; Gao, W.; Min, F.; He, J. Shallow convolutional neural networks for human activity recognition using wearable sensors. IEEE Trans. Instrum. Meas. 2021, 70, 2510811. [Google Scholar] [CrossRef]
- Girshick, R.; Donahue, J.; Darrell, T.; Malik, J. Rich Feature Hierarchies for Accurate Object Detection and Semantic Segmentation. In Proceedings of the IEEE Conference on Computer Vision and Pattern Recognition, Columbus, OH, USA, 23–28 June 2014; pp. 580–587. [Google Scholar] [CrossRef]
- He, K.; Zhang, X.; Ren, S.; Sun, J. Spatial pyramid pooling in deep convolutional networks for visual recognition. IEEE Trans. Pattern Anal. Mach. Intell. 2015, 37, 1904–1916. [Google Scholar] [CrossRef]
- Girshick, R. Fast r-cnn. In Proceedings of the IEEE International Conference on Computer Vision, Santiago, Chile, 7–13 December 2015; pp. 1440–1448. [Google Scholar]
- He, K.; Gkioxari, G.; Dollár, P.; Girshick, R. Mask R-CNN. In Proceedings of the IEEE International Conference on Computer Vision, Istanbul, Turkey, 5 June 2018. [Google Scholar] [CrossRef]
- Ren, S.; He, K.; Girshick, R.; Sun, J. Faster R-CNN: Towards Real-Time Object Detection with Region Proposal Networks. IEEE Trans. Pattern Anal. Mach. Intell. 2017, 39, 1137–1149. [Google Scholar] [CrossRef]
- Yang, T.; Long, X.; Sangaiah, A.K.; Zheng, Z.; Tong, C. Deep detection network for real-life traffic sign in vehicular networks. Comput. Netw. 2018, 136, 95–104. [Google Scholar] [CrossRef]
- Lin, T.Y.; Dollár, P.; Girshick, R.; He, K.; Hariharan, B.; Belongie, S. Feature Pyramid Networks for Object Detection. In Proceedings of the IEEE Conference on Computer Vision and Pattern Recognition, Honolulu, HI, USA, 21–26 July 2017. [Google Scholar] [CrossRef]
- Lu, Y.; Lu, J.; Zhang, S.; Hall, P. Traffic signal detection and classification in street views using an attention model. Comput. Vis. Media 2018, 4, 253–266. [Google Scholar] [CrossRef]
- Zhang, J.; Xie, Z.; Sun, J.; Zou, X.; Wang, J. A Cascaded R-CNN With Multiscale Attention and Imbalanced Samples for Traffic Sign Detection. IEEE Access 2020, 8, 29742–29754. [Google Scholar] [CrossRef]
- Wang, F.; Li, Y.; Wei, Y.; Dong, H. Improved Faster RCNN for Traffic Sign Detection. In Proceedings of the 2020 IEEE 23rd International Conference on Intelligent Transportation Systems (ITSC), Rhodes, Greece, 20–23 September 2020. [Google Scholar]
- Gao, S.-H.; Cheng, M.-M.; Zhao, K.; Zhang, X.-Y.; Yang, M.-H.; Torr, P. Res2net: A new multi-scale backbone architecture. IEEE Trans. Pattern Anal. Mach. Intell. 2019, 43, 652–662. [Google Scholar] [CrossRef]
- Liu, W.; Anguelov, D.; Erhan, D.; Szegedy, C.; Reed, S.; Fu, C.-Y.; Berg, A.C. SSD: Single Shot MultiBox Detector. In Computer Vision—ECCV 2016; Leibe, B., Matas, J., Sebe, N., Welling, M., Eds.; Lecture Notes in Computer Science; Springer: Cham, Switzerland, 2016; Volume 9905. [Google Scholar]
- Redmon, J.; Divvala, S.; Girshick, R.; Farhadi, A. You Only Look Once: Unified, Real-Time Object Detection. In Proceedings of the 2016 IEEE Conference on Computer Vision and Pattern Recognition, Las Vegas, NV, USA, 27–30 June 2016. [Google Scholar]
- Redmon, J.; Farhadi, A. YOLO9000: Better, Faster, Stronger. In Proceedings of the IEEE Conference on Computer Vision & Pattern Recognition, Honolulu, HI, USA, 21–26 July 2017; pp. 6517–6525. [Google Scholar]
- Wang, C.-Y.; Bochkovskiy, A.; Liao, H.-Y.M. YOLOv7: Trainable Bag-of-freebies sets new state-of-the-art for real-time object detectors. In Proceedings of the 2023 IEEE/CVF Conference on Computer Vision and Pattern Recognition (CVPR), Vancouver, BC, Canada, 17–24 June 2023; pp. 7464–7475. [Google Scholar]
- Wang, J.; Chen, Y.; Dong, Z.; Gao, M. Improved YOLOv5 network for real-time multi-scale traffic sign detection. Neural Comput. Appl. 2023, 35, 7853–7865. [Google Scholar] [CrossRef]
- Garg, P.; Chowdhury, D.R.; More, V.N. Traffic Sign Recognition and Classification Using YOLOv2, Faster RCNN and SSD. In Proceedings of the 2019 10th International Conference on Computing, Communication and Networking Technologies (ICCCNT), Kanpur, India, 6–8 July 2019; pp. 1–5. [Google Scholar]
- Ahmad, T.; Chen, X.; Saqlain, A.S.; Ma, Y. EDF-SSD: An Improved Feature Fused SSD for Object Detection. In Proceedings of the 2021 IEEE 6th International Conference on Cloud Computing and Big Data Analytics (ICCCBDA), Chengdu, China, 24–26 April 2021. [Google Scholar] [CrossRef]
- Zhang, H.; Qin, L.; Li, J.; Guo, Y.; Zhou, Y.; Zhang, J.; Xu, Z. Real-Time Detection Method for Small Traffic Signs Based on Yolov3. IEEE Access 2020, 8, 64145–64156. [Google Scholar] [CrossRef]
- Redmon, J.; Farhadi, A. Yolov3: An incremental improvement. arXiv 2018, arXiv:1804.02767. [Google Scholar]
- Cui, L.; Lv, P.; Jiang, X.; Gao, Z.; Zhou, B.; Zhang, L.; Shao, L.; Xu, M. Context-aware block net for small object detection. IEEE Trans. Cybern. 2020, 52, 2300–2313. [Google Scholar] [CrossRef] [PubMed]
- Cui, L.; Ma, R.; Lv, P.; Jiang, X.; Gao, Z.; Zhou, B.; Xu, M. MDSSD: Multi-scale deconvolutional single shot detector for small objects. arXiv 2018, arXiv:1805.07009. [Google Scholar] [CrossRef]
- Wang, L.; Zhou, K.; Chu, A.; Wang, G.; Wang, L. An Improved Light-Weight Traffic Sign Recognition Algorithm Based on YOLOv4-Tiny. IEEE Access 2021, 9, 124963–124971. [Google Scholar] [CrossRef]
- Rezatofighi, H.; Tsoi, N.; Gwak, J.; Sadeghian, A.; Reid, I.; Savarese, S. Generalized intersection over union: A metric and a loss for bounding box regression. In Proceedings of the 2019 IEEE/CVF Conference on Computer Vision and Pattern Recognition (CVPR), Long Beach, CA, USA, 15–20 June 2019; pp. 658–666. [Google Scholar]
- Gan, Z.; Wenju, L.; Wanghui, C.; Pan, S. Traffic sign recognition based on improved YOLOv4. In Proceedings of the 2021 6th International Conference on Intelligent Informatics and Biomedical Sciences (ICIIBMS), Oita, Japan, 25–27 November 2021; pp. 51–54. [Google Scholar]
- Lin, T.-Y.; Maire, M.; Belongie, S.; Hays, J.; Perona, P.; Ramanan, D.; Dollár, P.; Zitnick, C.L. Microsoft coco: Common objects in context. arXiv 2014, arXiv:1405.0312. [Google Scholar]
- Zhu, Z.; Liang, D.; Zhang, S.; Huang, X.; Li, B.; Hu, S. Traffic-sign detection and classification in the wild. In Proceedings of the IEEE Conference on Computer Vision and Pattern Recognition, Las Vegas, NV, USA, 27–30 June 2016; pp. 2110–2118. [Google Scholar]
- Liu, S.; Qi, L.; Qin, H.; Shi, J.; Jia, J. Path aggregation network for instance segmentation. In Proceedings of the IEEE Conference on Computer Vision and Pattern Recognition, Salt Lake City, UT, USA, 18–23 June 2018; pp. 8759–8768. [Google Scholar]
- Hu, J.; Shen, L.; Sun, G. Squeeze-and-Excitation Networks. In Proceedings of the 2018 IEEE/CVF Conference on Computer Vision and Pattern Recognition (CVPR), Salt Lake City, UT, USA, 18–23 June 2018. [Google Scholar]
Figure 1.
Improved multi-scale feature fusion structure (The bottom convolution module, the C3 module in the backbone network, and the 19 × 19 feature fusion module in the feature fusion layer are deleted. The 32× downsampling is then replaced with 16× downsampling, and a new feature fusion module measuring 152 × 152 is subsequently added to the feature layer.).
Figure 2.
Diagram of the H-SPPF module structure (The H-SPPF module, based on the SPPF module, integrates three average pooling operations of different sizes to further enhance the ability to extract network context information. Through this method, richer global features and local features can be obtained that improve the network’s ability to pay attention to small target features.).
Figure 3.
SE module structure schematic diagram. (a) SEBottleNeck module structure; (b) C3SE module structure.
Figure 3.
SE module structure schematic diagram. (a) SEBottleNeck module structure; (b) C3SE module structure.
Figure 4.
Structure of the improved network model. (Taking the structures of the SEBottleNeck and C3SE modules, shown in
Figure 3a,b, SE is fused into the C3 module to produce the C3SE module. These are put into the positions shown in the figure, respectively, and SPPF is replaced with H-SPPF.).
Figure 4.
Structure of the improved network model. (Taking the structures of the SEBottleNeck and C3SE modules, shown in
Figure 3a,b, SE is fused into the C3 module to produce the C3SE module. These are put into the positions shown in the figure, respectively, and SPPF is replaced with H-SPPF.).
Figure 5.
The 72 different kinds of traffic signs our paper examined.
Figure 5.
The 72 different kinds of traffic signs our paper examined.
Figure 6.
Confusion matrix.
Figure 6.
Confusion matrix.
Figure 7.
Statistics of the mean average precision results of each category before and after amplification of the dataset.
Figure 7.
Statistics of the mean average precision results of each category before and after amplification of the dataset.
Figure 8.
Statistics of mean average precision results of each category before and after improvement.
Figure 8.
Statistics of mean average precision results of each category before and after improvement.
Figure 9.
Comparison of actual road scene. The results of detecting images using weights derived from the standard YOLOv5s network model trained on the augmented dataset are displayed in the middle column, undetected images of actual road scenes are displayed in the left column, and the results of detecting images using weights derived from the improved network model proposed in this paper trained on the augmented dataset are displayed in the right column.
Figure 10.
Comparison of images collected from real vehicles. The left column represents the results of the standard YOLOv5s network model image, and the outcomes of the enhanced network model suggested in this article are shown in the right column.
Figure 10.
Comparison of images collected from real vehicles. The left column represents the results of the standard YOLOv5s network model image, and the outcomes of the enhanced network model suggested in this article are shown in the right column.
Table 1.
Size of the anchor frame following clustering.
Table 1.
Size of the anchor frame following clustering.
| Feature Map Size | Feel the Wild-Size | Anchor Frame Size |
|---|
| 38 × 38 | large | (23,24), (31,31), (44,47) |
| 76 × 76 | middle | (10, 12), (14,15), (17,20) |
| 152 × 152 | small | (4, 4), (5,6), (8,8) |
Table 2.
Training parameter setting.
Table 2.
Training parameter setting.
| Parameter Name | Corresponding Value(s) |
|---|
| Image-size | 640 |
| batch-size | 8 |
| epochs | 150 |
| Weight-decay | 0.0005 |
Table 3.
Experiments conducted before and after dataset augmentation and expansion are compared.
Table 3.
Experiments conducted before and after dataset augmentation and expansion are compared.
| Datasets | P (%) | R (%) | mAP@0.5 (%) | mAP@0.5:0.95 (%) | FPS (Hz) |
|---|
| Data amplification | 66.24 | 54.11 | 60.12 | 47.32 | 106 |
| After data amplification | 90.01 | 83.68 | 87.88 | 71.53 | 100 |
Table 4.
Experiments conducted before and after the multi-scale feature fusion module was improved are compared.
Table 4.
Experiments conducted before and after the multi-scale feature fusion module was improved are compared.
| Model | P (%) | R (%) | mAP@0.5 (%) | mAP@0.5:0.95 (%) | FPS (Hz) |
|---|
| YOLOv5s | 90.01 | 83.68 | 87.88 | 71.53 | 100 |
| YOLOv5s+ | 91.43 | 87.6 | 92.65 | 75.25 | 97 |
Table 5.
Comparison of experiments before and after improving the clustering algorithm.
Table 5.
Comparison of experiments before and after improving the clustering algorithm.
| Model | P (%) | R (%) | mAP@0.5 (%) | mAP@0.5:0.95 (%) | FPS (Hz) |
|---|
| YOLOv5s+ | 91.43 | 87.6 | 92.65 | 75.25 | 97 |
| YOLOv5s+_K | 92.71 | 87.72 | 92.95 | 75.32 | 97 |
Table 6.
Experimental comparison before and after the addition of the H-SPPF module.
Table 6.
Experimental comparison before and after the addition of the H-SPPF module.
| Model | P (%) | R (%) | mAP@0.5 (%) | mAP@0.5:0.95 (%) | FPS (Hz) |
|---|
| YOLOv5s+ | 92.71 | 87.72 | 92.95 | 75.32 | 97 |
| YOLOv5s+_K | 92.69 | 87.93 | 93.13 | 75.29 | 96 |
Table 7.
Comparing the effects of adding the module for the attention mechanism at various locations.
Table 7.
Comparing the effects of adding the module for the attention mechanism at various locations.
| Model | Backbone | Neck | Head | P (%) | R (%) | mAP@0.5 (%) |
|---|
| YOLOv5s+_K_HSPPF | × | × | × | 92.69 | 87.93 | 93.13 |
| Y_C3SE_B | √ | × | × | 91.75 | 88.19 | 92.39 |
| Y_C3SE_N | × | √ | × | 92.53 | 87.52 | 92.18 |
| Y_C3SE_H | × | × | √ | 91.56 | 88.26 | 92.33 |
| Y_SE_B_SE_N | √ | √ | × | 91.72 | 91.77 | 93.88 |
Table 8.
Results of the standard model experiments and the improvement technique suggested in this research are compared.
Table 8.
Results of the standard model experiments and the improvement technique suggested in this research are compared.
| Model | P (%) | R (%) | mAP@0.5 (%) | mAP@0.5:0.95 (%) | FPS (Hz) |
|---|
| YOLOv5s | 90.01 | 83.68 | 87.88 | 71.53 | 100 |
| YOLOv5s+_K_HSPPF_SE | 91.72 | 91.77 | 93.88 | 75.81 | 99 |
| Disclaimer/Publisher’s Note: The statements, opinions and data contained in all publications are solely those of the individual author(s) and contributor(s) and not of MDPI and/or the editor(s). MDPI and/or the editor(s) disclaim responsibility for any injury to people or property resulting from any ideas, methods, instructions or products referred to in the content. |
© 2024 by the authors. Licensee MDPI, Basel, Switzerland. This article is an open access article distributed under the terms and conditions of the Creative Commons Attribution (CC BY) license (https://creativecommons.org/licenses/by/4.0/).


