Abstract
The seasonal variation of Baltic sprat chemical composition leads to a change in smoked fish texture and color, which may pose challenges for industrial processing. This research aimed to evaluate the dependence of smoked sprat texture and color on the catching season and pre-treatment applied before the smoking of fish, following one year of frozen storage. Various proportions of sodium chloride (NaCl), calcium chloride (CaCl2), and acetic acid were used in the solution for fish pre-treatment. The introduction of salts during the pre-treatment process for late-season fish has been found to enhance the texture of the smoked product. The color components of the lightness (L*) and redness (a*) measured on the smoked fish surface remained consistent throughout the catching season, whereas the yellowness (b*) showed a tendency to decrease towards the end of the season. Moreover, when acetic acid was applied to late-season fish, the yellowness of the smoked sprat surface increased compared to that of the sample without this pre-treatment. These findings suggest that the choice of pre-treatment methods can significantly improve the texture and color attributes of the smoked sprat, which is crucial for maintaining quality standards, especially in the context of industrial processing.
1. Introduction
Baltic sprat (Sprattus sprattus balticus) is a fast-growing, short-lived fish from the Clupeidae family, typically reaching a size of 10–16 cm [1]. It is recognized as a valuable source of proteins and lipids [2]. The spawning season in the Baltic Sea generally spans from March until June, depending on the weather conditions [1]. The catching season, geographical location, fish size, weight, and age affect the chemical composition of sprat [3]. The protein content remains relatively stable throughout the catching period. However, Usydus et al. [4] documented a substantial variation in the lipid content, ranging from 5.10% during the spawning season to 15.46% in the fish-feeding season. Timberg et al. [5] identified a strong negative correlation between the water and lipid contents in Baltic sprat. This variance in the chemical composition may lead to changes in sensory attributes, resulting in a higher sensory quality of autumn fish having the highest lipid content compared to fish caught in other seasons (winter and spring).
Following catching, fish undergo fast freezing as a preservation method to maintain their quality throughout the supply chain, extending their shelf-life up to 12 months. This practice ensures a continuous supply during the non-catching season. Freezing effectively slows or stops biological, chemical, and physical changes in fish. However, enzymatic activity linked to lipid oxidation can lead to the degradation of food quality attributes such as color, taste, and texture. Additionally, the freezing and thawing process introduces structural damage from ice crystals with potential impacts on the ultimate quality of the final product [6]. The freezing process can induce the denaturation and aggregation of proteins, diminishing their extractability. This, in turn, may contribute to muscle toughening and a decrease in the water-holding capacity [7].
Baltic sprats have widely been used to produce various nutritionally valuable products including smoked, salted, marinated, and canned sprats. Traditionally, the preservation of fish and the enhancement of their sensory attributes have been achieved through salting and smoking [8]. However, the predominant methods for fish preservation are canning and freezing [9]. In the Baltic and Eastern European countries, canned smoked sprats in oil are known as a local delicacy. Furthermore, innovative products have emerged from smoked sprat, such as dried smoked sprat snacks, marinated smoked sprat preserves, and smoked sprat pate. During the smoking processes, the increased temperature leads to protein denaturation, potentially resulting in a softer texture, particularly in spring, when fish contain a higher water content. The varied lipid content may lead to differences in the water distribution. Therefore, to ensure an acceptable texture in smoked sprats, raw fish should possess sufficient firmness, influenced by such factors as the fat and moisture content, pH, storage time, and processing methods.
The ionic strength and pH play crucial roles in the water-binding ability of muscle proteins; the addition of a low amount of salt (1–2%) can enhance the water-holding capacity. A 2–5% NaCl brine causes myosin to swell strongly, leading to firmer binding in tissues [7]. After salting and smoking, the structural properties of the fish are altered, and shrinkage of the muscle fibers occurs [10].
The salting and smoking processes contribute to a reduction in the lightness value L*, attributed to water loss and protein degradation [2]. While no studies on factors affecting the smoked sprat color were found, Babikova et al. [2] reported that marinated sprats were lighter, with a decreased redness compared to that of thawed sprats used as raw material. This phenomenon was linked to the effects of acids, as reported by Chow et al. [11], which influenced discoloration and increased the autooxidation of myoglobin in the fish tissue. The brining before marination decreased yellowness, which subsequently increased in the marination process, possibly due to freezing affecting protein solubility, lipid oxidation, and pigments in fish [2].
To our knowledge, the application of the fish pre-treatment in a solution containing sodium chloride (NaCl), calcium chloride (CaCl2), and acetic acid before sprat smoking has not been published. Thus, this research aimed to evaluate the dependence of the texture and color of smoked sprat on the season and pre-treatment applied before the smoking of fish, following one year of frozen storage.
2. Materials and Methods
2.1. Raw Materials
Fish caught in the Baltic Sea West of Gotland (FAO27. III. d. 28. 2) at the beginning (September/October), middle (November/December), and end (March/April) of the catching season, using OTM (otter trawl methods), freshness, and the size category A (EC Regulation No 2406/96, 2005), was used in the study. Sprats were frozen in 10 kg blocks using shock freezing until the temperature in the center of the fish block reached −16 to −18 °C. Frozen sprats were packed in polyethylene bags, placed in cardboard boxes, and delivered to the company freezer. Frozen sprats were stored at −18 ± 2 °C and relative air humidity 75 ± 5% for one year (Figure 1). After one year of storage, the sprats were thawed using the water–steam spray system until the temperature inside the block reached 0 °C, within 30 to 40 min. Three independent batches were made for each pre-treatment type and subsequent smoking.
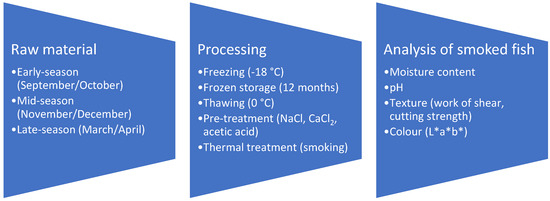
Figure 1.
Experimental procedure for sprat quality evaluation depending on the season and pre-treatment material used.
The following ingredients were used for the fish pre-treatment: acetic acid (E260) purchased from a supplier company “Safrans” (Riga, Latvia), fine NaCl salt “Ekstra” (Mozirsol, Belarus), and granulated calcium chloride anhydrous CaCl2 (Lachner, Brno, Czech Republic).
2.2. Fish Sample Pre-treatment and Smoking
First, the pre-treatment solutions (Table 1) were made according to the concentrations developed and described by Puke et al. [12]. Pre-treatment materials were selected after the literature study and preliminary testing, aiming for texture and color improvement while maintaining an acceptable sensory quality.

Table 1.
The composition of the solution used for defrosted sprat pre-treatment [12].
Thawed fish were soaked for 30 min in a pre-treatment solution containing the ingredients specified in Table 1. After pre-treatment, the fish were dried in a tunnel for 20 to 25 min and then hot-smoked in a commercial smoking chamber (Rauch Spectrum, Rheinmünster, Germany) with an automatic control system using beech wood chips. The main processing parameters were selected as follows: drying for 35–40 min at 45 to 60 °C, cooking for 10–12 min at 60 to 73–75 °C, steaming for 2–5 min at 75–77 °C, smoking for 10–15 min at 77 to 80 °C, and cooling for 5–10 min until 72 °C. Three batches (200 g each) of smoked fish were made per pre-treatment type.
2.3. Determination of Raw Sprat Moisture, Protein, and Fat Content
Moisture analyses were performed using the standard method ISO 1442:1997. Briefly, a homogenized sample was combined with pre-heated sand and dried until a constant weight in the Memmert oven (Memmert, Buechenach, Germany).
The protein content was determined in triplicate by the Kjeldahl method ISO 5983-2:2009, using 2 g of the sample with a Kjeltec 2300 automatic analyzer (Foss Analytical, Höganäs, Sweden). The nitrogen conversion factor of 6.25 was used to calculate the percentage of protein.
The fat content of the raw fish was measured in triplicate by Soxhlet extraction on an SOXTEC AVANTI 2050 instrument (Foss Analytical, Höganäs, Sweden) using petroleum ether, according to ISO 1443:1973.
2.4. Determination of the Moisture, pH, Color, and Texture of Smoked Sprats
The determination of the smoked sprat moisture content followed the standard ISO 1442:1997 procedure. The pH of smoked sprats was analyzed using 1 g of blended fish and 9 g of distilled water, mixed, and tested immediately. The determination of pH was carried out in triplicate per sample using a calibrated JENWAY 3520 digital pH-meter (Jenway, EU).
Color analyses were performed using a ColorTec-PCM colorimeter (Accuracy Microsensors Inc., Vernon Hills, IL, USA) with a CIE Lab color space system, where L* shows the lightness (L* = 0 black; L* = 100 white), a* shows the redness (−a* green, +a* red), and b* shows the yellowness (−b* blue, +b* yellow). Fish were placed on the wooden cutting board and covered with polyethylene film. The color was measured on the surface of the whole smoked sprat in 10 different surface locations. No more than two measurements were made per fish. Software Color Tec—Color Sowf QCW was used for the data collection.
The smoked sprat texture was analyzed by the texture analyzer TA.HD.Plus (Stable Microsystems, Godalming, UK) with the blade set knife Warner-Bratzler (speed 2 mm/s for a 10 mm distance) at room temperature. Separated smoked sprat fillets without bone were used to obtain two parameters for the texture: the work of shear (N/mm) and cutting strength (Ns/mm). The width of each fillet was measured before the test. At least seven measurements were made per sample.
2.5. Statistical Analyses
Mean values with standard deviations (±SD) were calculated using MS Office Excel 2016 (Microsoft, Redmond, WA, USA) software. Statistical analyses were conducted using IBM SPSS Statistics, Version 28.0.1.1.(15) (SPSS Inc., Chicago, IL, USA) software with one-way ANOVA, followed by a Post Hoc Tukey test, and reported at a significance level of p < 0.05, p < 0.01, and p < 0.001.
3. Results and Discussion
The chemical composition of the fresh sprat varied during the season (Table 2). The protein content remained stable throughout the catching season. The fat content was 36% lower, while the moisture content increased significantly in late-season fish in comparison to early-season fish. The results are consistent with those reported earlier by Usydus et al. [4] and Timberg et al. [5], who also revealed a higher water content and lower fat content in late-season sprats.
Table 2.
The chemical composition of fresh Baltic sprat during the catching season.
3.1. The Moisture Content and pH of Smoked Sprats
The moisture content in the smoked sprat was not affected by the season (Table 3), indicating that more moisture was lost from mid- and late-season fish during the smoking process. The highest moisture content was detected in the control samples, irrespective of the season. Pre-treatment with salt and/or acid reduced the smoked sprat moisture content, especially in late-season fish.
Table 3.
The moisture content of smoked sprat, depending on the season and pre-treatment.
Sprats subjected to pre-treatment with the solutions containing CaCl2 exhibited a decreased moisture content in comparison to the other samples. According to Zhang et al. [13] this could be attributed to the formation of protein–protein linkages upon the addition of calcium ions, leading to the creation of rough protein aggregates and subsequently reducing the water binding capacity.
The pH of the smoked sprat was reduced after the application of any pre-treatment material selected compared to the control sample without pre-treatment (Table 4).
Table 4.
The pH of smoked sprat, depending on the catching season and pre-treatment applied.
The application of both calcium chloride and acetic acid caused a bigger change in the pH of smoked sprat compared to the application of sodium chloride solely. Similar results were revealed by Horita et al. [14], indicating that the pH of frankfurter sausages with dicationic salts added decreased. In the current study, the pH of the sprats remained above the isoelectric point of the myofibrillar protein, which is pH 5.3. The pH is an important factor influencing the water-binding capacity of muscle proteins [7].
3.2. Smoked Sprat Texture
Figure 2 shows the textural properties of smoked sprat depending on the catching season. Both variables of the texture, the work of shear and the cutting strength, tended to reduce throughout the season for the sample without any pre-treatment (control). This is in agreement with the sensory evaluation of steamed Baltic sprat completed by Timberg et al. [5], who also reported the hardest texture for fish caught in autumn. The reduction in hardness could be attributed to the increased moisture and reduced fat content in fish used for smoked sprat production. Thus, in the early season (autumn), the fresh sprat moisture content was 62.4% (Table 2), whereas it increased to 70.2% in the late season (spring). A negative correlation was observed between the water and fat contents. Texture softening in a fish from the late season may affect the appearance of smoked sprat, making it unacceptable for further processing in canned produce, fish pate, or fish snacks.
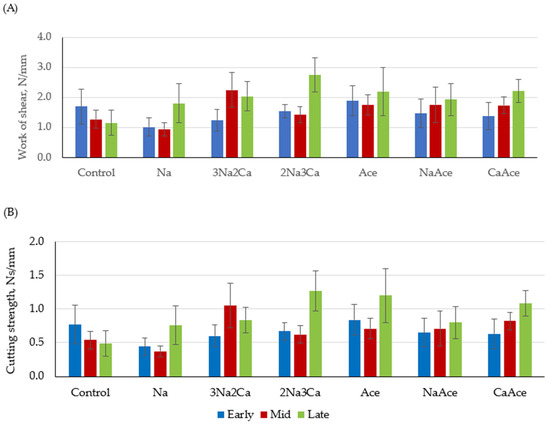
Figure 2.
Texture of smoked sprat depending on the season and pre-treatment: (A) work of shear; (B) cutting strength. Average values (n = 21) with the standard deviation. For sample abbreviations, see Table 1.
Pre-treatment did not show a significant effect on the early-season fish texture (Table 5), possibly due to the higher fat content and lower water content, which resulted in the slower migration of the pre-treatment agent in the fish tissue. According to Martinez et al. [15], lipids in fatty fish present a physical barrier to salt transport due to fat hydrophobicity.
Table 5.
The significance of the season and pre-treatment effect on the smoked sprat texture.
The hardness of smoked mid- or late-season fish increased when acetic acid was applied either alone or combined with sodium or calcium salt. Babikova et al. [2] also described the hardness increase in Irish sprat after marination, attributing an increase to the protein denaturation, which may result in decreased water adsorption. Kołakowski and Bednarczyk [16] reported a reduced elasticity of Baltic herring with an increased acid concentration in the range of 1–5%. In our study, the texture analysis of sprat indicated a weak negative correlation between the cutting strength and smoked fish pH (−0.488), which is in agreement with Babikova et al. [2], who revealed that the hardest texture for Irish sprat was observed at the lowest pH.
The use of salts for fish pre-treatment before smoking did not significantly affect the texture of early- or mid-season sprat, whereas the application of salts in the pre-treatment of late-season fish significantly increased both the work of shear and cutting strength, indicating a harder texture. The seasonal effect may be ascribed to the higher water content (Table 2) in late-season fish and differences in the water distribution within tissue, which may vary significantly [10]. A higher water content facilitates salt migration. The role of sodium chloride in the texture formation of muscle foods is well established. According to the systematic review performed by Gomes et al. [17], salt plays an essential role in texture by aiding the solubilization of protein, triggering protein extraction, and enhancing the water-holding capacity. Salt prompts structural alterations via electrostatic interactions among muscle proteins and sodium as well as chloride ions. These interactions lead to the swelling of myofibrils, the depolymerization of myofilaments, and the dissociation of the actomyosin complex [18]. In turn, the introduction of CaCl2 may cause a transformation in the myosin structure, transitioning it from an α-helix to β-turn and β-sheet configuration [19]. Upon heating, the myosin structure unfolds, and calcium ions interact with the active groups on myosin, creating salt bridges. Subsequently, myosin aggregates and forms a gel network structure.
Additionally, the freezing and thawing cycle applied to samples with a higher water content may cause greater ice crystal damage and also the denaturation and aggregation of the myofibrillar proteins, leading to a loss of the water holding capacity [8,20]. Freezing and thawing may damage the protein’s native structure, making it susceptible to further reactions [21]. The greater shear force for salted fish was observed by many other authors [8,22,23], who attributed an increase in hardness to an increased salt content in fish muscle, causing protein aggregation and degradation.
3.3. Smoked Sprat Color
In the smoking process, fish undergo a process of thermal treatment and drying, leading to non-enzymatic browning reactions, contributing to the color of the final product. The smoked sprat color components in the CIE Lab system of the lightness (L*) and the redness (a*) were stable through the catching season, whereas the yellowness (b*) tended to decrease towards the end of the catching season (Figure 3), possibly due to the reduced fat content.
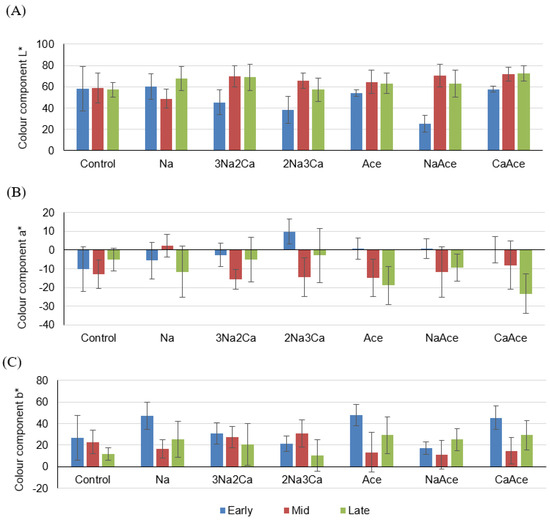
Figure 3.
Color of smoked sprat depending on the season and pre-treatment: (A) color component L* black–white; (B) color component a* green–red; (C) color component b* blue–yellow. Average values (n = 30) with standard deviation. For sample abbreviations, see Table 1.
Pre-treatment only affected the lightness of the early-season fish samples (Table 6). It did not affect the lightness of the pre-treated samples in the mid- or late-season. Treatment with acetic acid combined either with sodium salt or calcium salt made the sprat surface darker. A moderate negative correlation existed between the fat content and L* value (lightness) for smoked sprat (r = −0.646). A weak positive correlation was found between the fat content and color component a* (redness) and the fat content and color component b* (yellowness).
Table 6.
The significance of the season and pre-treatment effect on the smoked sprat color.
The most important values are color component L* because it shows the lightness of the sample and yellowness (b*), which appears as a golden skin color. The smoked sprat produced from early-season fish after one year of frozen storage, irrespective of the treatment method, was redder and less yellow. The reduced yellowness in the late-season sprat may be observed due to the lower content of carotenoid astaxanthin, a fat-soluble pigment [24]. Acetic acid possibly acts as a solvent, releasing pigment and improving the yellowness of smoked fish skin. However, the color was pre-treatment material-dependent. The application of the pre-treatment with acetic acid for late-season sprat allowed for increasing the surface yellowness compared to the sample without pre-treatment.
Some authors have reported that acidic conditions greatly affect discoloration, due to the autooxidation of myoglobin [25]. According to Babikova et al. [2], freezing may not only transform the protein and lipid fraction in fish, but it can affect pigments as well. The smoking step can cause carbonyl-amino reactions of Maillard browning and the denaturation of astaxanthins from alterations in the protein composition in salmon [26]. The color changes occur on the fish surface, especially because of salt and acid migration inside fish tissue. Some substances present in smoke react with compounds present in the fish’s outer layer, creating specific smoked fish sensory attributes such as color, taste, and texture.
In further studies, the sensory quality of products produced from pre-treated smoked sprat should be evaluated. From the current study, the pre-treatment of defrosted sprat in a solution with sodium chloride combined with calcium chloride would be used to improve the texture of smoked Baltic sprats.
4. Conclusions
The use of pre-treatment enhanced the texture and color of smoked Baltic sprats produced from late-season frozen fish after one year of storage. The texture of the control sample without the pre-treatment exhibited variations based on the catching season, with the softest texture observed in the late-season catch. An improvement in the late-season fish texture can be reached by introducing pre-treatment with a combination of sodium and calcium chlorides, which significantly increased both the work of shear and cutting strength, resulting in a significantly firmer texture. The color components of smoked sprats, evaluated in the CIE Lab system (lightness (L*) and redness (a*)), remained consistent across the catching season. However, yellowness (b*) of smoked sprat surface displayed a tendency to decrease in the late-season fish. Furthermore, the application of pre-treatment with acetic acid for late-season sprats led to an increased surface yellowness compared to the sample without pre-treatment. This finding underscores the nuanced impact of pre-treatment methods on both the texture and color attributes of smoked sprats, offering valuable insights for optimizing product quality in the context of processing late-season catches.
Author Contributions
Conceptualization, S.P.; methodology, S.P. and R.G.; validation, S.P.; formal analysis, S.P.; investigation, S.P.; data curation, S.P.; data analysis, O.D.; writing—original draft preparation, S.P.; writing—review and editing, S.P., O.D., and R.G.; visualization, R.G.; supervision, R.G. All authors have read and agreed to the published version of the manuscript.
Funding
This work was supported by the program “Strengthening research capacity in the Latvia University of Life Sciences and Technologies” project Z43.
Institutional Review Board Statement
Not applicable.
Informed Consent Statement
Not applicable.
Data Availability Statement
The data are included in the article.
Conflicts of Interest
The authors declare no conflicts of interest.
References
- Döring, J.; Hauss, H.; Haslob, H. Spatial and Seasonal Variability in Reproductive Investment of Baltic Sprat. Fish. Res. 2018, 204, 49–60. [Google Scholar] [CrossRef]
- Babikova, J.; Hoeche, U.; Boyd, J.; Noci, F. Nutritional, Physical, Microbiological, and Sensory Properties of Marinated Irish Sprat. Int. J. Gastron. Food Sci. 2020, 22, 100277. [Google Scholar] [CrossRef]
- Moore, C.; Lynch, D.; Clarke, M.; Officer, R.; Mills, J.; Louis-Defour, J.; Brophy, D. Age Verification of North Atlantic Sprat. Fish. Res. 2019, 213, 144–150. [Google Scholar] [CrossRef]
- Usydus, Z.; Szlifder-Richert, J.; Adamczyk, M. Variations in Proximate Composition and Fatty Acid Profiles of Baltic Sprat (Sprattus Sprattus Balticus). Food Chem. 2012, 130, 97–103. [Google Scholar] [CrossRef]
- Timberg, L.; Koppel, K.; Kuldjärv, R.; Paalme, T. Sensory and Chemical Properties of Baltic Sprat (Sprattus Sprattus Balticus) and Baltic Herring (Clupea Harengus Membras) in Different Catching Seass. Agron. Res. 2011, 9, 489–494. [Google Scholar]
- Dawson, P.; Al-Jeddawi, W.; Remington, N. Effect of Freezing on the Shelf Life of Salmon. Int. J. Food Sci. 2018, 2018, 1686121. [Google Scholar] [CrossRef] [PubMed]
- Sigurgisladottir, S.; Sigurdardottir, M.S.; Torrissen, O.; Vallet, J.L.; Hafsteinsson, H. Effects of Different Salting and Smoking Processes on the Microstructure, the Texture and Yield of Atlantic Salmon (Salmo salar) Fillets. Food Res. Int. 2000, 33, 847–855. [Google Scholar] [CrossRef]
- Ruiz-Alonso, S.A.; Girón-Hernández, L.J.; López-Vargas, J.H.; Muñoz-Ramírez, A.P.; Simal-Gandara, J. Optimizing Salting and Smoking Conditions for the Production and Preservation of Smoked-Flavoured Tilapia Fillets. LWT Food Sci. Technol. 2021, 138, 110733. [Google Scholar] [CrossRef]
- Timberg, L. Spice-Cured Sprats Ripening, Sensory Parameters Development, and Quality Indicators. Ph.D. Thesis, Tallinn University of Technology, Tallinn, Estonia, 2012. [Google Scholar]
- Løje, H.; Jensen, K.N.; Hyldig, G.; Nielsen, H.H.; Nielsen, J. Changes in Liquid-Holding Capacity, Water Distribution and Microstructure during Chill Storage of Smoked Salmon. J. Sci. Food Agric. 2007, 87, 2684–2691. [Google Scholar] [CrossRef]
- Chow, C.-J.; Yang, J.-I.; Lee, P.-F.; Ochiai, Y. Effects of Acid and Alkaline Pretreatment on the Discoloration Rates of Dark Muscle and Myoglobin Extract of Skinned Tilapia Fillet during Iced Storage. Fish. Sci. 2009, 75, 1481–1488. [Google Scholar] [CrossRef]
- Pūķe, S.; Galoburda, R.; Straumīte, E. Effect of Pre-Treatment on the Quality of Smoked Baltic Sprats. Proc. Latv. Acad. Sci. Sect. B Nat. Exact Appl. Sci. 2022, 76, 69–75. [Google Scholar] [CrossRef]
- Zhang, J.; Jiang, L.; Yang, J.; Chen, X.; Shen, M.; Yu, Q.; Chen, Y.; Xie, J. Effect of Calcium Chloride on Heat-Induced Mesona Chinensis Polysaccharide-Whey Protein Isolation Gels: Gel Properties and Interactions. LWT Food Sci. Technol. 2022, 155, 112907. [Google Scholar] [CrossRef]
- Horita, C.N.; Messias, V.C.; Morgano, M.A.; Hayakawa, F.M.; Pollonio, M.A.R. Textural, Microstructural and Sensory Properties of Reduced Sodium Frankfurter Sausages Containing Mechanically Deboned Poultry Meat and Blends of Chloride Salts. Food Res. Int. 2014, 66, 29–35. [Google Scholar] [CrossRef]
- Martinez, O.; Salmerón, J.; Guillén, M.D.; Pin, C.; Casas, C. Physicochemical, Sensorial and Textural Characteristics of Liquid-Smoked Salmon (Salmo salar) as Affected by Salting Treatment and Sugar Addition. Int. J. Food Sci. Technol. 2012, 47, 1086–1096. [Google Scholar] [CrossRef]
- Kołakowski, E.; Bednarczyk, B. Physical and Sensory Changes in Headed and Gutted Baltic Herring during Immersed Salting in Brine with the Addition of Acetic Acid. Part 1. Weight Losses, Color and Flesh and Its Sensory Properties. Electron. J. Pol. Agric. Univ. 2003, 5, 9. [Google Scholar]
- Gomes, M.d.S.A.; Kato, L.S.; de Carvalho, A.P.A.; de Almeida, A.E.C.C.; Conte-Junior, C.A. Sodium Replacement on Fish Meat Products—A Systematic Review of Microbiological, Physicochemical and Sensory Effects. Trends Food Sci. Technol. 2021, 118, 639–657. [Google Scholar] [CrossRef]
- Totosaus, A.; Pérez-Chabela, M.L. Textural Properties and Microstructure of Low-Fat and Sodium-Reduced Meat Batters Formulated with Gellan Gum and Dicationic Salts. LWT Food Sci. Technol. 2009, 42, 563–569. [Google Scholar] [CrossRef]
- Hu, Y.; Zhang, M.; Zhao, Y.; Gao, X.; You, J.; Yin, T.; Xiong, S.; Liu, R. Effects of Different Calcium Salts on the Physicochemical Properties of Sliver Carp Myosin. Food Biosci. 2022, 47, 101518. [Google Scholar] [CrossRef]
- Martinez, O.; Salmerón, J.; Guillén, M.D.; Casas, C. Effect of Freezing on the Physicochemical, Textural and Sensorial Characteristics of Salmon (Salmo salar) Smoked with a Liquid Smoke Flavouring. LWT Food Sci. Technol. 2010, 43, 910–918. [Google Scholar] [CrossRef]
- Timberg, L.; Koppel, K.; Kuldjärv, R.; Paalme, T. Ripening and Sensory Properties of Spice-Cured Sprats and Sensory Properties Development. J. Aquat. Food Prod. Technol. 2014, 23, 129–145. [Google Scholar] [CrossRef]
- Gallart-Jornet, L.; Barat, J.M.; Rustad, T.; Erikson, U.; Escriche, I.; Fito, P. Influence of Brine Concentration on Atlantic Salmon Fillet Salting. J. Food Eng. 2007, 80, 267–275. [Google Scholar] [CrossRef]
- Bjørnevik, M.; Cardinal, M.; Vallet, J.L.; Nicolaisen, O.; Arnarson, G.Ö. Effect of Salting and Cold-Smoking Procedures on Atlantic Salmon Originating from Pre-or Post Rigor Filleted Raw Material. Based on the Measurement of Physiochemical Characteristics. LWT Food Sci. Technol. 2018, 91, 431–438. [Google Scholar] [CrossRef]
- Nie, X.P.; Zie, J.; Häubner, N.; Tallmark, B.; Snoeijs, P. Why Baltic Herring and Sprat Are Weak Conduits for Astaxanthin from Zooplankton to Piscivorous Fish. Limnol. Oceanogr. 2011, 56, 1155–1167. [Google Scholar] [CrossRef]
- Šimat, V.; Mićunović, A.; Bogdanović, T.; Listeš, I.; Generalić Mekinić, I.; Hamed, I.; Skroza, D. The Impact of Lemon Juice on the Marination of Anchovy (Engraulis encrasicolus): Chemical, Microbiological and Sensory Changes. Ital. J. Food Sci. 2019, 31, 604–617. [Google Scholar] [CrossRef]
- Chan, S.S.; Roth, B.; Skare, M.; Hernar, M.; Jessen, F.; Løvdal, T.; Jakobsen, A.N.; Lerfall, J. Effect of Chilling Technologies on Water Holding Properties and Other Quality Parameters throughout the Whole Value Chain: From Whole Fish to Cold-Smoked Fillets of Atlantic Salmon (Salmo salar). Aquaculture 2020, 526, 735381. [Google Scholar] [CrossRef]


Disclaimer/Publisher’s Note: The statements, opinions and data contained in all publications are solely those of the individual author(s) and contributor(s) and not of MDPI and/or the editor(s). MDPI and/or the editor(s) disclaim responsibility for any injury to people or property resulting from any ideas, methods, instructions or products referred to in the content. |
© 2024 by the authors. Licensee MDPI, Basel, Switzerland. This article is an open access article distributed under the terms and conditions of the Creative Commons Attribution (CC BY) license (https://creativecommons.org/licenses/by/4.0/).