Article

Research on the Evolution Network Model of the Landslide Disaster Chain: A Case Study of the Baige Landslide

1
School of Resources and Safety Engineering, Central South University, Changsha 410083, China
2
Research Center for Mining Engineering and Technology in Cold Regions, Central South University, Changsha 410083, China
*
Author to whom correspondence should be addressed.
Appl. Sci. 2024, 14(2), 499; https://doi.org/10.3390/app14020499
Submission received: 14 October 2023 / Revised: 11 November 2023 / Accepted: 3 January 2024 / Published: 5 January 2024
(This article belongs to the Special Issue Novel Technology in Landslide Monitoring and Risk Assessment)

Abstract

:
In the context of Western China’s unique geography, recurrent landslide disasters pose substantial threats to both resident safety and economic stability. The escalating frequency of these incidents emphasizes the critical need for innovative disaster research, particularly focused on the concept of a disaster chain. This research aims to enhance disaster preparedness and management strategies with the ultimate goal of minimizing losses. On the basis of predecessors, this study changes the previous analysis forms of single or partial disaster events, innovatively collects all secondary disaster events derived from the landslide disaster chain, and builds an evolutionary network model. In concrete terms, our study concentrates on the Baige landslide within the Qinghai-Tibet Plateau, pinpointing sub-hazard events as crucial disaster nodes within the landslide. By establishing directed connections, we have developed a comprehensive landslide disaster chain evolution network model firmly grounded in the principles of disaster chain dynamics and complex network theory. This model encompasses 31 distinct disaster nodes and 77 connecting edges. To assess the inherent risks in the landslide catastrophe chain, we conducted a thorough analysis considering node access degree and clustering coefficients. Critical nodes driving economic losses, such as floods, debris flows, secondary landslides, and downstream water damage, were identified. Additionally, we isolated vulnerable connections within the evolving network, evaluating the susceptibility of each edge. Our research underscores the significance of proactive measures, including pre-disaster monitoring, early warning systems, and timely post-disaster information dissemination. Implementing these actions can play a pivotal role in mitigating the impact of landslide disasters, preserving lives and sustaining regional prosperity.

1. Introduction

A landslide is a natural phenomenon induced by seismic movement, groundwater action, precipitation, river scouring, and anthropogenic activity that causes the rock mass and soil on the slope to slide along the weak surface or weak zone under the effect of gravity [1]. China’s landscape is complicated and diversified, with mountains covering two-thirds of the total land area. The landscape is mountainous in the west and flat in the east. Landslide catastrophes are common in China’s western area due to unique geographical characteristics [2,3,4], resulting in significant loss of life and economic damage, along with long-term and far-reaching societal consequences. Following the 2008 Wenchuan earthquake, which triggered the Daguangbao-Hongdongzigou huge landslide [5,6,7], a 6.8-magnitude earthquake on 5 September 2022 in Luding County, Ganzi Prefecture, Sichuan Province, generated multiple landslides. According to data released by the Institute of Mountain Hazards and Environment, CAS, as of 7 September, there were 704 landslides covering an area of 2.5 square kilometers, which accounted for approximately 5% of the survey area, and 67 landslides with a projected area exceeding 10,000 square meters, making up 10% of the total number of landslides. The spatial and temporal distribution of disasters was uneven, with frequent disasters in summer and autumn and heavy disasters in central and western China.
Economic losses caused by earthquakes are the highest among geological catastrophes, with landslides raking second. Large-scale landslides, in particular, account for a significant portion and are prominent research subjects in the field of geological disasters worldwide due to their extensive scale, high destructiveness, and complex causes [8,9,10,11]. Entire slopes of soil mass can transform into debris flows that block rivers, resulting in landslides blocking rivers, which, in turn, lead to the formation of successive barrier lakes, floods, and swellings [12,13] This poses a significant threat to residential areas, farmland, highways, and other infrastructure.
Many researchers have investigated the landslide-induced disaster chain generated by dam-breaking landslides in recent years, concentrating primarily on three aspects: (1) Reversing the dynamic process of a historical landslide and examining its progression. (2) Exploring the life cycle of large landslides and the dam break time of barrier lakes, as well as the triggering effects of geology, climatic, and other factors [14,15]. (3) Demonstrating the catastrophe mechanism through numerical modeling of the barrier lake flood disaster chain induced by a landslide [16,17]. However, most of the current research on the landslide barrier lake burst flood disaster chain is quantitative and focuses on individual steps. Ouyang et al. [18] carried out a quantitative investigation on the dynamic features of landslides under varying pore pressure by simulating the movement process of the Guangming Xincun landslide in Shenzhen. Using discrete element modeling, Zhao et al. [19] investigated the effect of river valley morphology on the formation of landslide blockage. Amicarelli et al. [20] developed a three-phase mixing model that simultaneously represents three phases in their study of the barrier lake breach flood catastrophe chain. Transport properties of downstream riverbed materials with floods were investigated using a dam breach erosion modeling test. There are now a few multi-stage overall research studies including the catastrophe chain. Liu and He [21] established a systemic model for studying mountain landslide barriers and lake flood disaster chains, utilizing it to simulate the disaster process of the Yigong landslide barriers and lake flood disaster chain in Tibet. The Baige Landslide in Changdu, Tibet, is one of China’s recent large-scale landslides [22], resulting in direct economic losses exceeding CNY 14 billion and sparking a wide range of social communication impacts. Subsequent monitoring findings indicate that the residual body of the landslide is still experiencing minor-scale movement, raising concerns about the possibility of a large-scale landslide and river obstruction [23]. Consequently, numerous domestic scholars have undertaken numerical simulations and qualitative evaluations of its stability and the likelihood of landslide recurrence [24,25,26,27,28,29].
The depiction of network patterns and topological structures in complex real-world systems has increasingly become a mainstream approach for gaining a comprehensive understanding of various phenomena, especially in the context of complex networks. This trend has been driven by the widespread application of network science in real-world scenarios. Milgram, a Harvard psychology professor, conducted a chain letter experiment in 1967 [30]. Following this, in 1998, American academics Watts and Strogatz introduced the small-world network model, often referred to as the WS model. Watts and Newman later proposed the NW model for microscopic world scenarios, which simplifies the construction of isolated nodes [31,32]. Building upon these foundations, BARABASI and his student ALBERT introduced the BA model, a scale-free network model of complex networks [33]. These three models are widely used in power systems [34], urban transportation [35,36], biology [37,38], traditional industry [39], finance [40], logistics [41], and other fields as classic models of complex networks. Vulnerability, as one of the key characteristics of complex networks, is frequently utilized in conjunction with node importance to evaluate the sensitivity of network disaster risk [42]. This approach aids in identifying critical factors and weak links within the disaster evolution process, playing a pivotal role in disaster prevention and control strategies.
Currently, China has made some progress in the study of landslides in the western regions. However, field studies in this area remain limited due to the challenges posed by harsh environmental conditions, such as extreme cold, high altitude, and traffic and transportation constraints [43]. Furthermore, research on the subsequent chain disaster risk assessment is still underdeveloped. From the literature output, the focus of our country is gradually shifting from dealing with a single disaster to a multi-disaster comprehensive assessment, but there is a lack of complete disaster chain risk assessment studies through examples. There is limited research on landslide hazard chain modeling and risk assessment based on complex network theory at home and abroad.
The research objective of this paper is as follows: by analyzing the occurrence process and results of the two disasters of the Baige landslide, the types of secondary disasters caused by landslides are identified, the evolution model of landslide disaster chain network is built accordingly, and the vulnerable links in the network are identified so as to provide reference for prevention and control of similar disaster chains. This paper draws inspiration from supply chain, accident chain, and existing disaster chain risk assessment models. Initially, the research investigates the evolution form and characteristics of landslide disaster chains. Subsequently, it identifies 31 disaster event nodes within the landslide disaster chain and constructs a network model for the evolution of landslide disasters. This model employs disaster events as nodes and event development relationships as connecting edges, focusing on the two landslides that occurred in Baige in 2018 [44]. The paper conducts a quantitative assessment of the importance of nodes and the vulnerability of connecting edges within the evolution network of the landslide disaster chain. This analysis helps identify the weak links within the landslide disaster chain, providing a solid theoretical foundation for the prevention and control of such disasters [36,45].

2. Overview of the Study Area

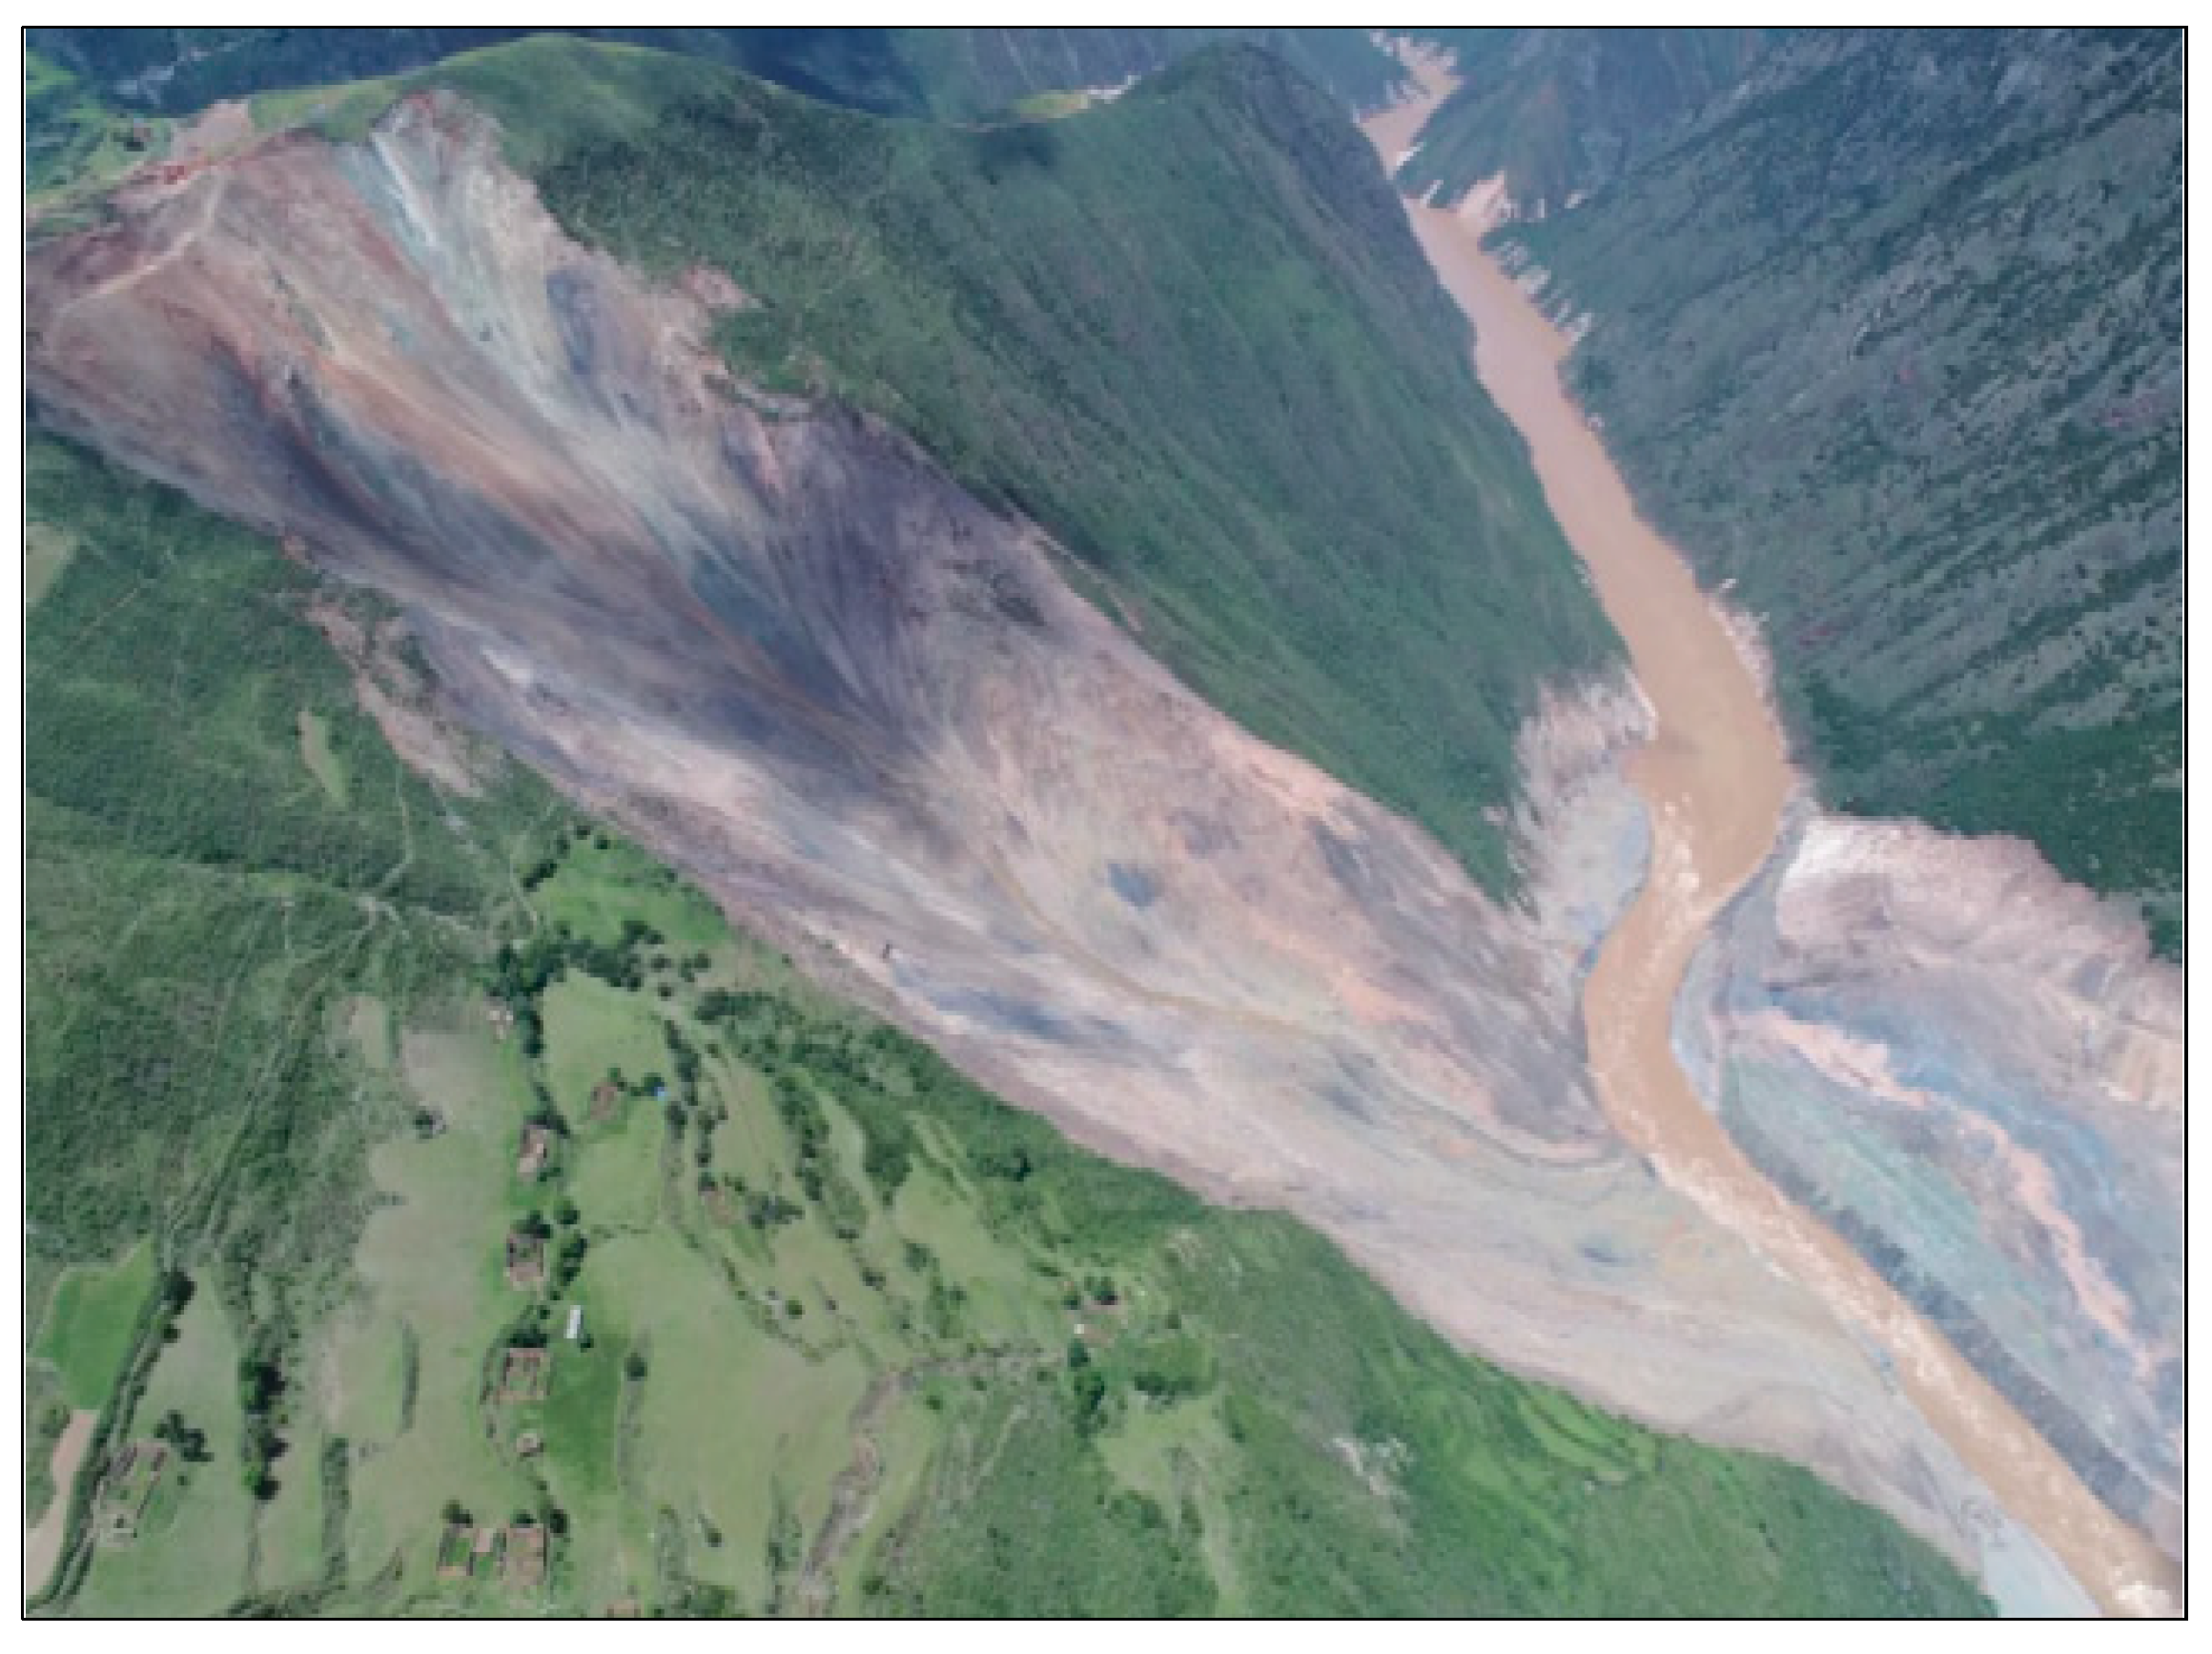
2.1. Geological Conditions and Representativeness of the Baige Landslide

The Baige landslide is situated within Baige Village, Boluo Township, Jiangda County, Tibet Autonomous Region, at geographical coordinates of E 98°42′14.1″ and N 31°04′53.21″. This location is positioned on the right bank of the Jinsha River, characterized by its presence within the Alpine and Canyon zones. As elevation increases, a noticeable decline in temperature occurs (Figure 1). The region experiences a distinct rainy season, with a concentration of summer rainfall. The average annual precipitation is about 650 mm. The maximum annual rainfall is about 1070 mm, and the maximum daily rainfall is about 40 mm. Jiangda County has an average altitude of about 3800 m, and the terrain is high in the west and low in the east, with an overall slope from southwest to northeast. There are many mountains and rivers in the area. The terrain is high, and the river valleys are developed and deep, showing a “V” shape. It is an example of a tectonic mountain and valley landform. The relative height difference between mountains and valleys is wide, up to 3100 m.
This paper takes the Baige landslide in the Jinsha River as an example to construct the evolution network of the landslide disaster chain in the west of China for the following reasons [46]: (1) The Baige landslide occurred within the Jinsha River suture zone, characterized by a complex lithology and structure, making it a quintessential example of a landslide disaster caused by mixed structural rocks on the Qinghai-Tibet Plateau. (2) Different from landslides triggered by rainfall or earthquakes, the Baige landslide system was naturally induced, providing valuable insights into the natural evolution process of landform and river valleys in western China. (3) The Baige landslide exhibited distinctive features of high speed and collision accumulation, which are common traits in the context of western China’s geological dynamics. (4) The disaster chain effect stemming from the Baige landslide was particularly pronounced. Both landslides led to the inundation of villages and towns, destruction of bridges, and various other related sub-disaster events, encompassing a wide range of consequences associated with the landslide.

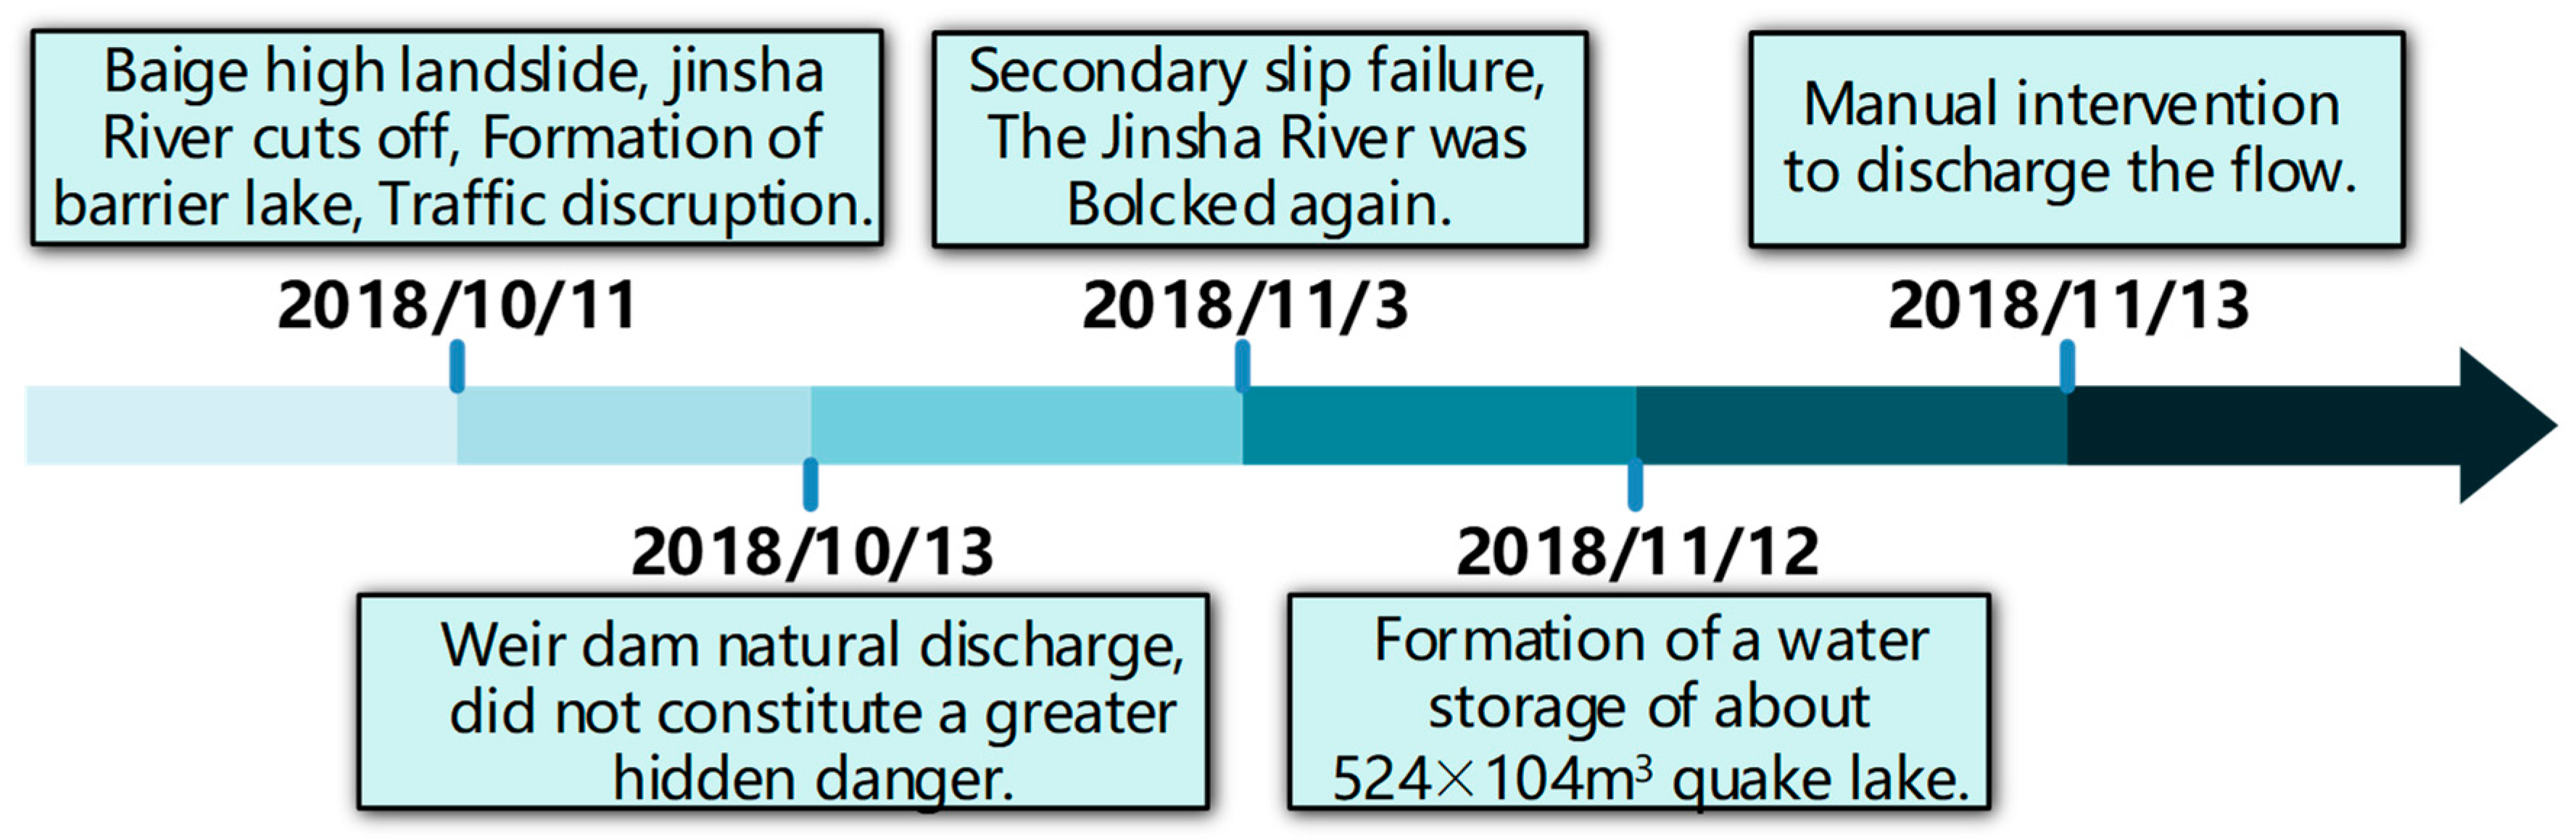
2.2. Development History of Twice Baige Landslides

On 11 October 2018, and again on 3 November 2018, Baige village experienced two significant landslides in less than a month, both of which were of extraordinary magnitude. The Jinsha River was intercepted by the landslide that washed down, causing serious river blocking disasters [29,47]. Figure 2 illustrates the chronological development of these two landslide disasters. According to the seismic wave inversion results, the Baige “10·10” landslide occurred at precisely 22:05:36 on 10 October, with a landslide volume of approximately 1870 × 104 m3. This landslide formed a large area of accumulation; the landslide dam was about 1.2 km along the river and finally broke on 13 October. Under the influence of the development of the crack area left by the “10·10” landslide, the debris of the “11·3” landslide was basically deposited in the spillway after the landslide dam burst of “10·10” under the action of gravity and at the same time aroused high-speed water flow.
In March 2019, a team of geological experts carried out geological exploration work on the Baige landslide. Subsequently, in early June, they initiated clearing of the back side of the landslide and the barrier dam, thereby mitigating the immediate risk of another landslide blocking event. Figure 3 depicts the current status of the Baige landslide after partial clearance. It is important to note that there remains a potential risk of debris reformation and partial collapse following the clearance efforts.

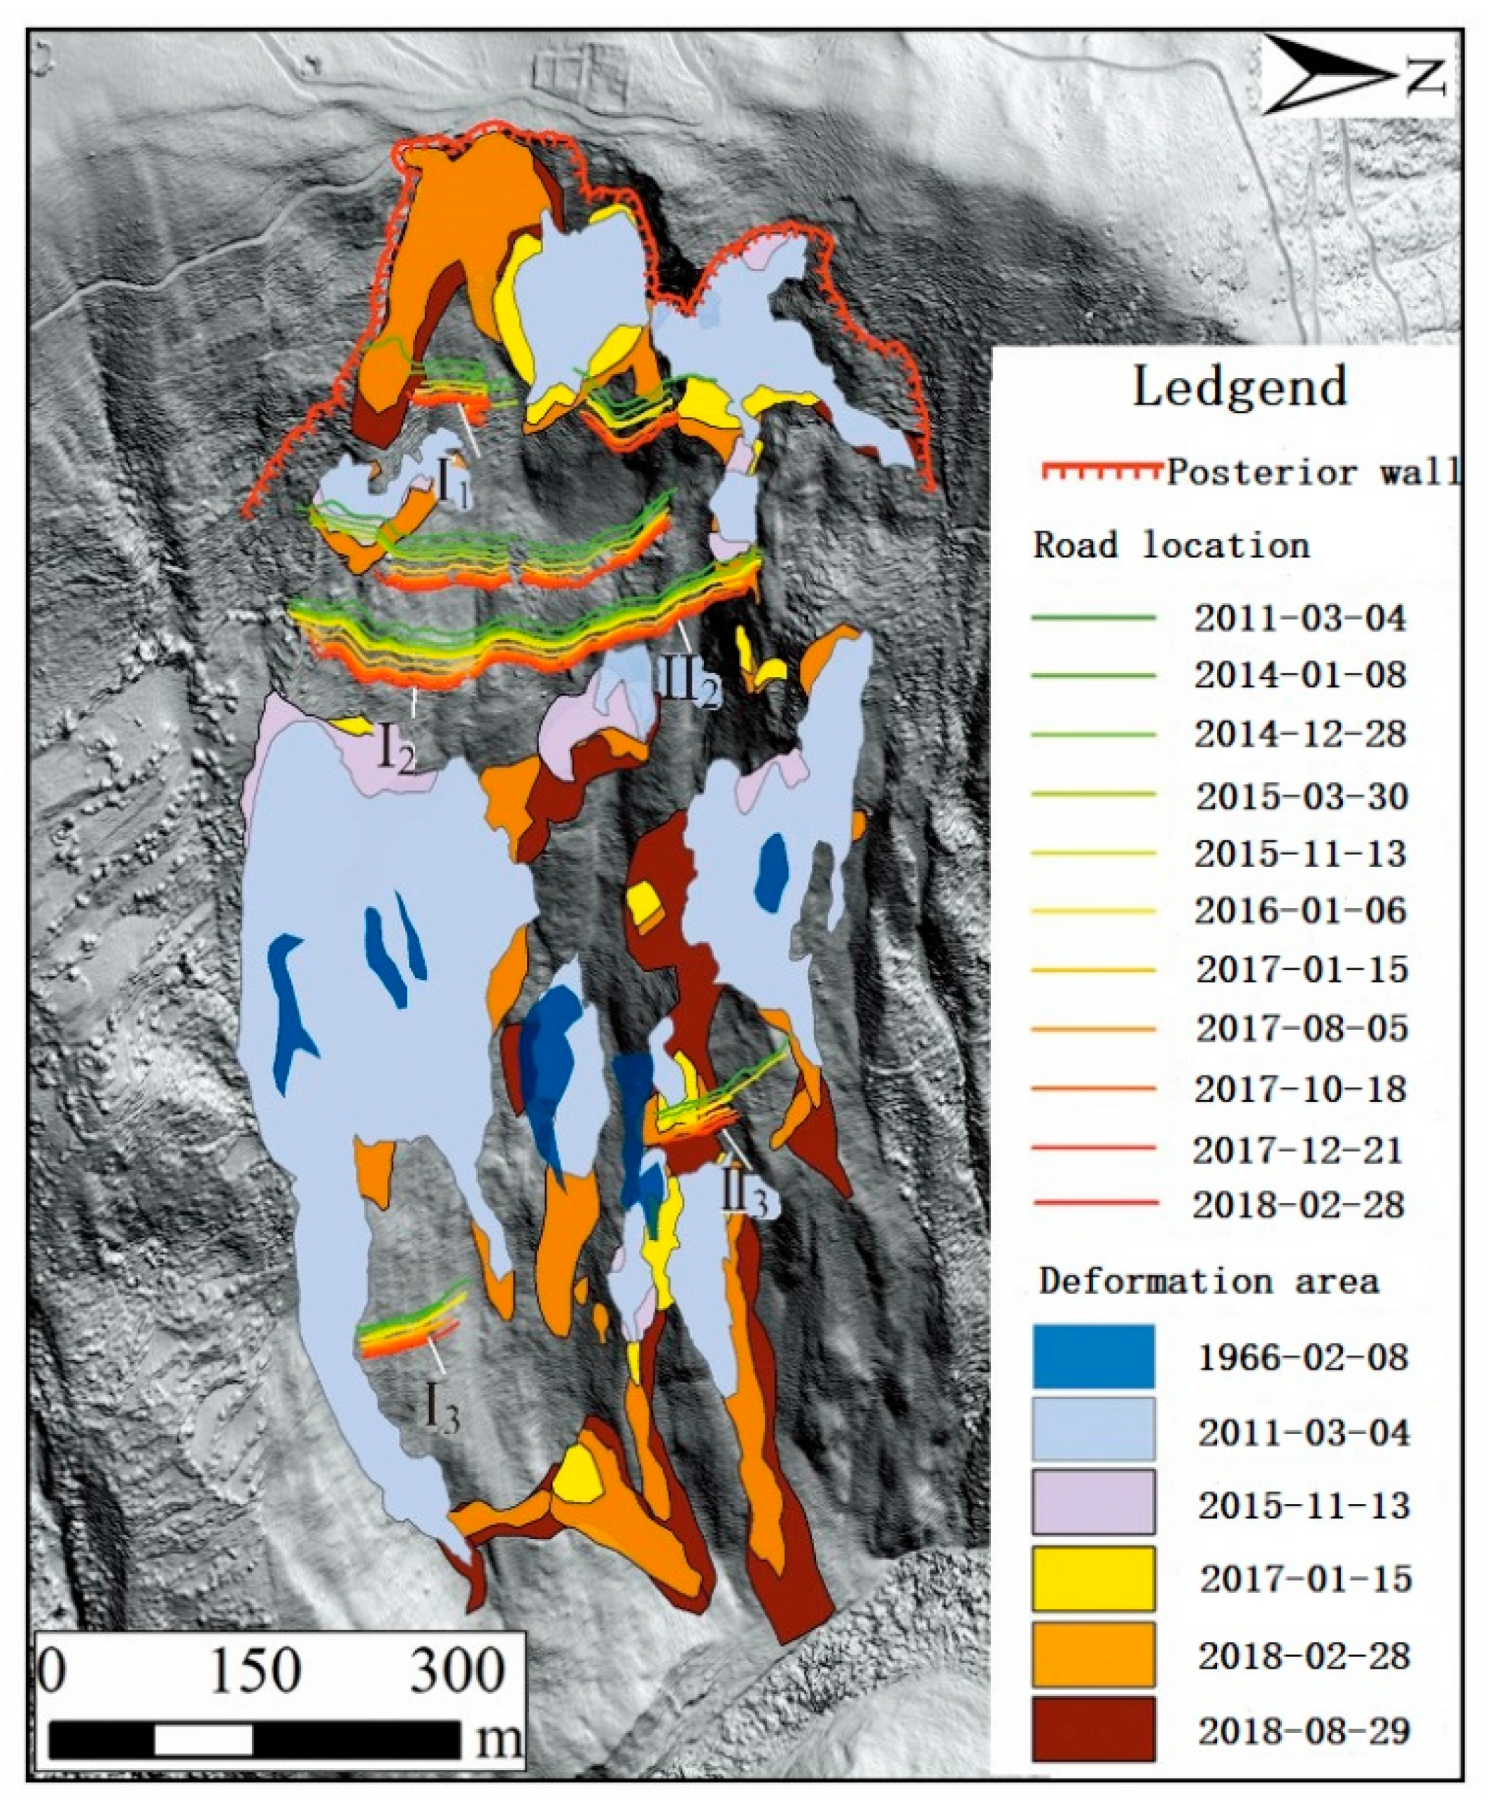
2.3. Historical Deformation of the Baige Landslide

The interpretation of landslide deformation phases through the analysis of satellite photos has become increasingly clear and visually intuitive thanks to advancements in remote sensing technology. The preparation process of landslide deformation is categorized into five distinct stages, as derived from the analysis of 15 historical images of the Baige slip area collected by Li Weile [48]. These stages include the stable stage, obvious deformation stage, the uniform deformation stage, the accelerated deformation stage, and the secondary accelerated deformation stage. Table 1 displays the deformation characteristics for each step.
Simultaneously, Li Weile identified the path on the landslide through satellite, interpreted the road on the image by remote sensing, compared and analyzed the road positions in different periods, and calculated the displacement of the landslide surface, as shown in Figure 4 [47].

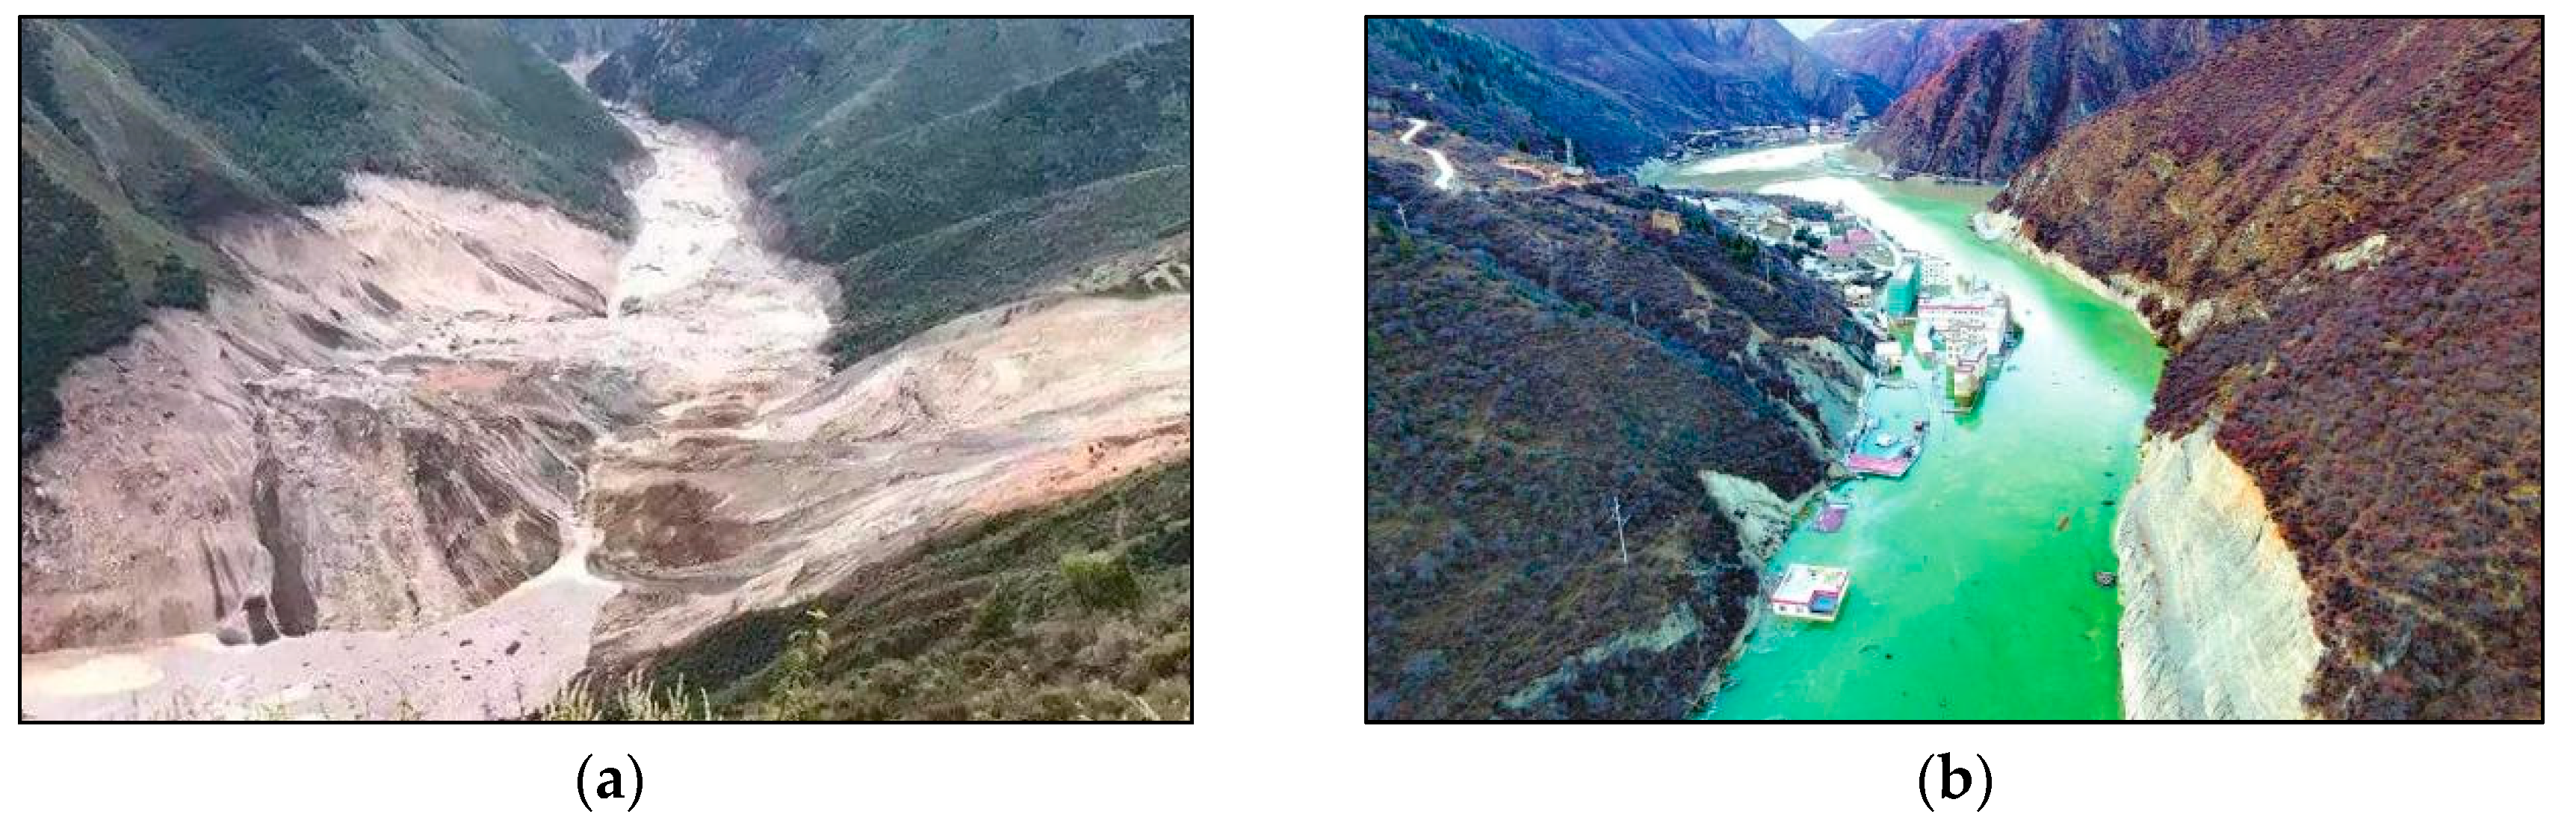
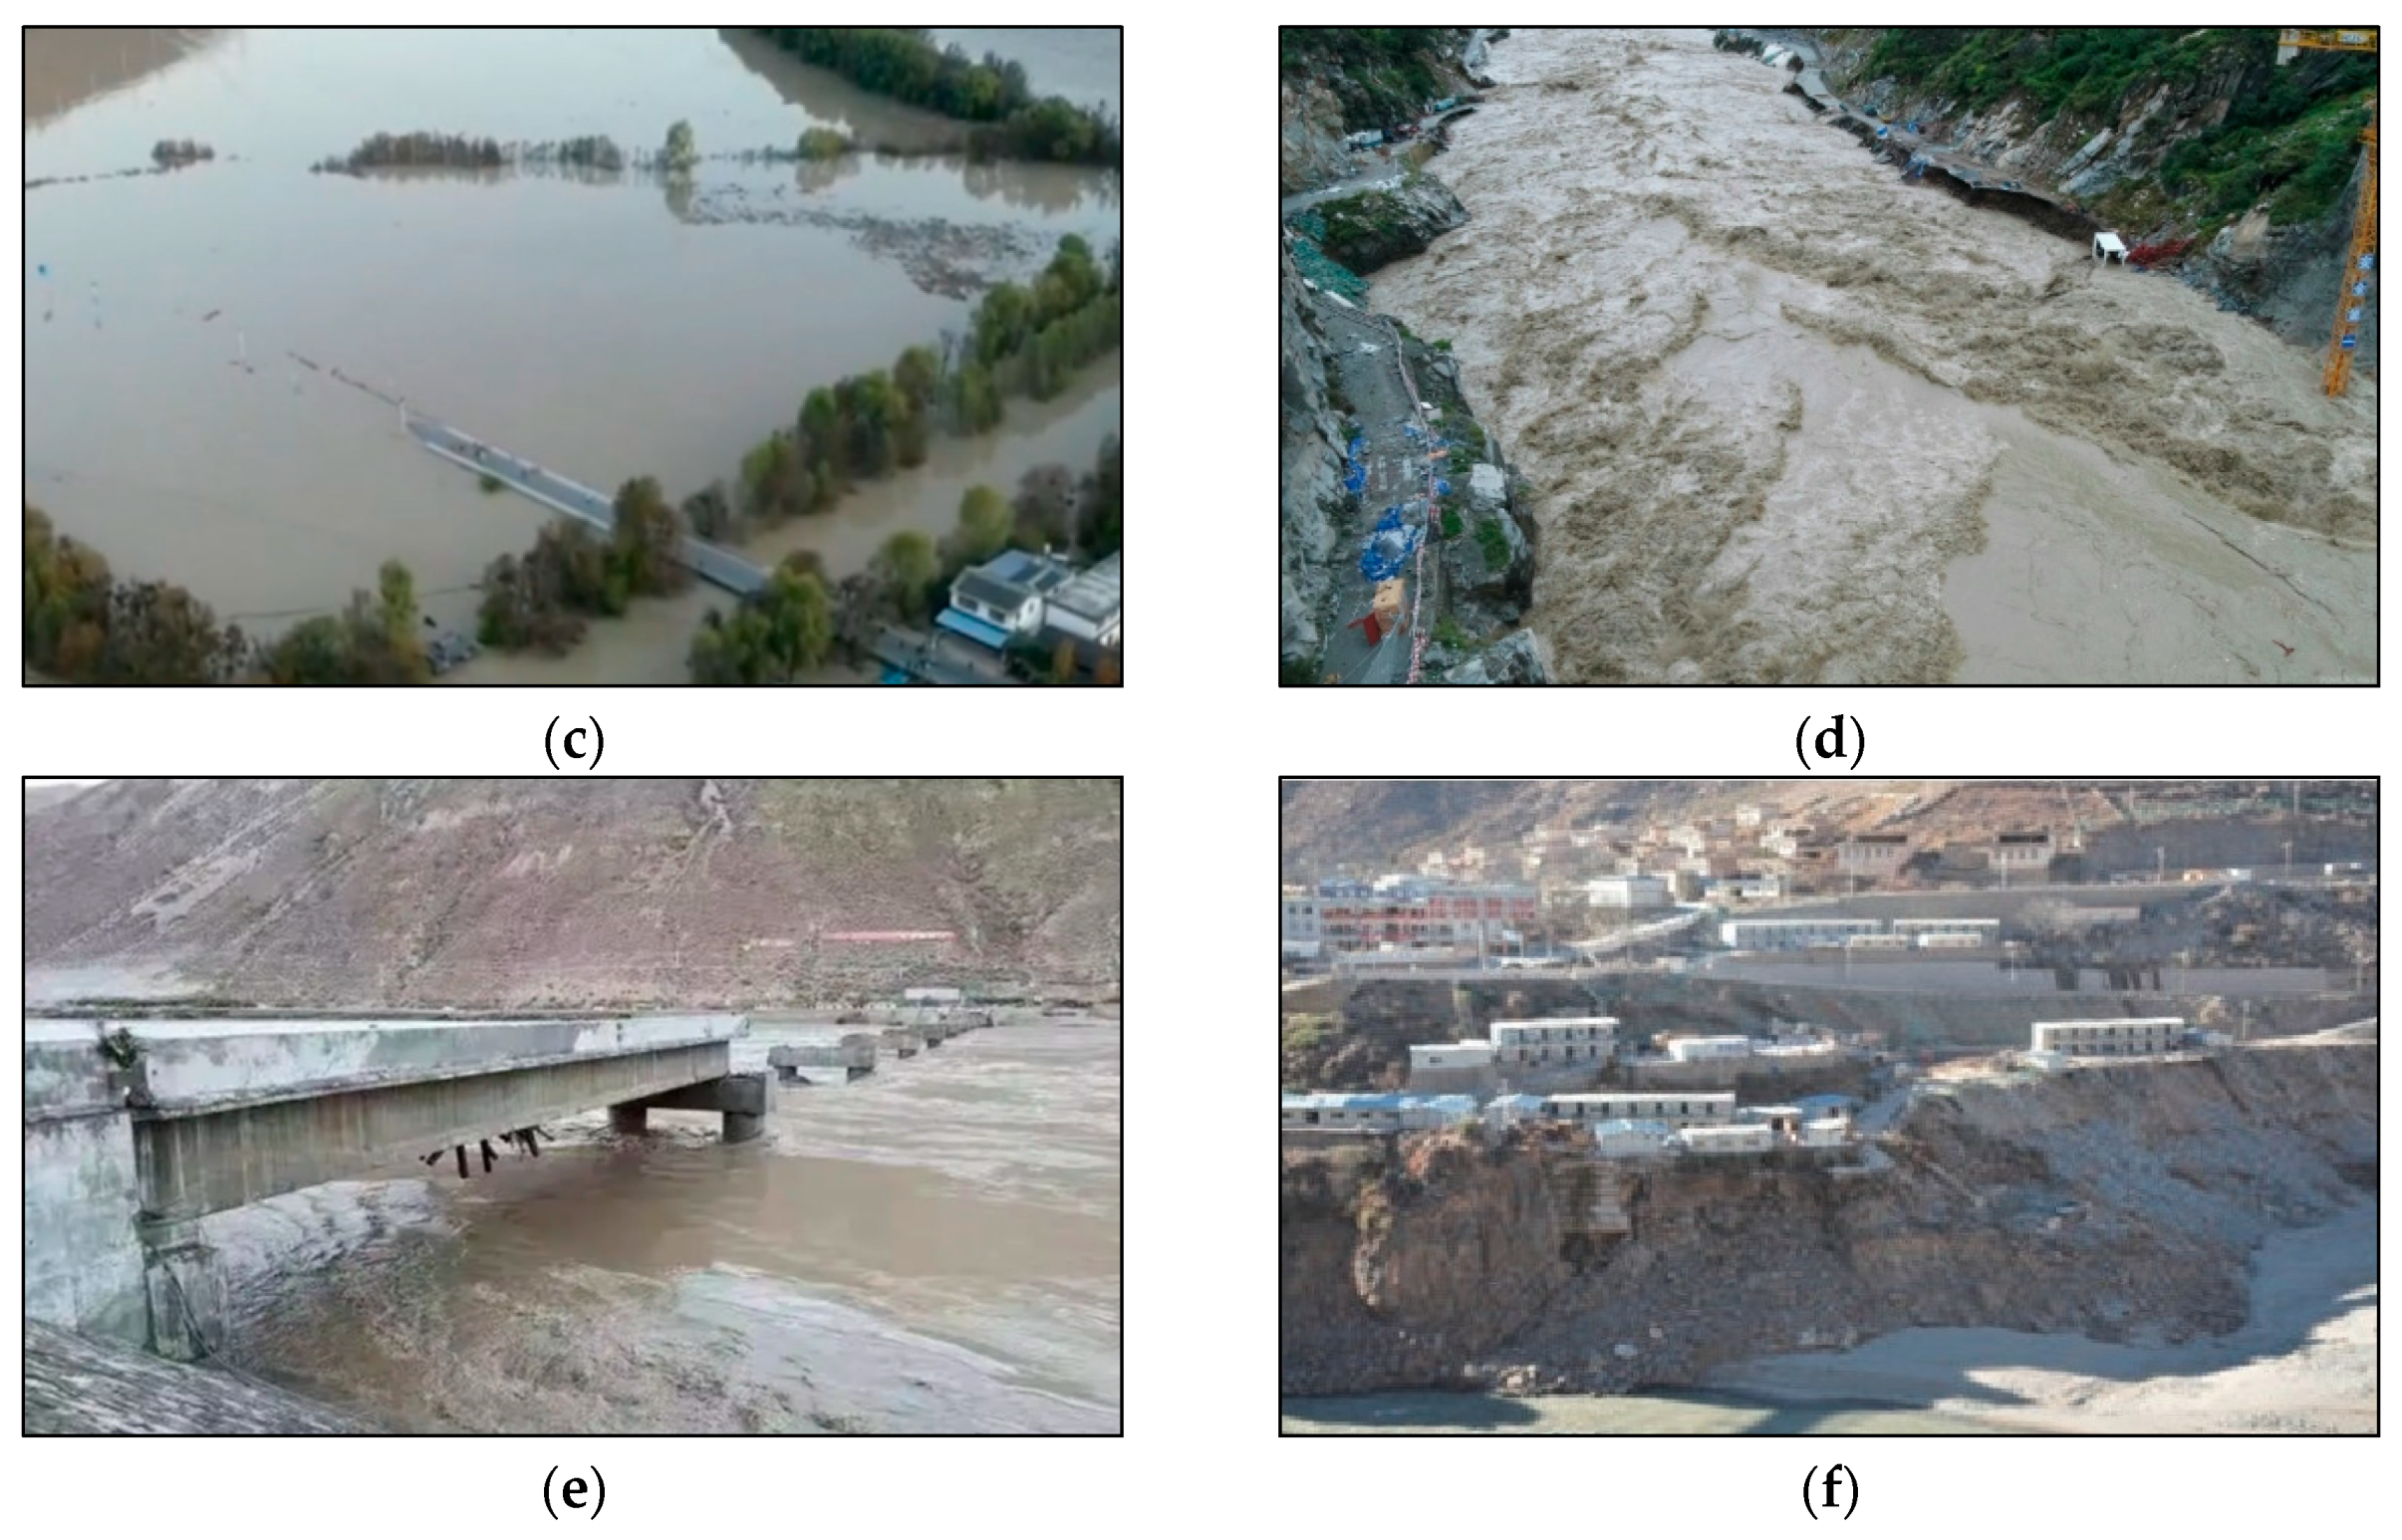
2.4. Summary of Damage Caused by the Baige Landslide

On the Jinsha River in Baige, two consecutive landslides occurred. The landslide created a massive barrier lake and obstructed the river. The deluge that resulted from the rupture had a large transmission distance, a tremendous impact, and a heavy flow. Fortunately, there was no reported casualties, but the flood inundated numerous towns and villages., causing significant damage to bridges, water facilities, and roads along the route [50]. Figure 5 shows some of the consequences of this landslide. The landslide had a profound impact on the region, affecting approximately 102,000 people in Tibet, Sichuan, and Yunnan. It resulted in the collapse of over 3400 houses and caused a total direct economic loss exceeding CNY 14 billion.

3. Research Method and Data

3.1. Research Method

In short, a complex network is a highly complex network. As a new discipline, it has played a great role in practical network design and control and has provided important theoretical support for the development of high-tech industries. In the field of complex networks, there are three representative network models: (1) Small-world network model. Based on the characteristics of small world and aggregation in real networks, WATTS proposed the WS network model (Newman and Watts, 1999). By connecting every edge in the regular network to a new node with a certain random probability, a small-world network between the regular network and the random network was constructed. (2) Scale-free network model. BARABASI and ALBERT proposed a scale-free network model based on the discovery that all node degree distributions in real complex networks obey power law distribution [33]. By studying a small number of hub nodes, it helps to understand the overall structure and behavior of the network. (3) Multi-layer network model. The multi-layer network model is a kind of higher-order network, which retains the concept of layers in addition to nodes and edges. Compared with the traditional network model, the multi-layer network can more accurately describe the multiple transfer relations and complex nonlinear relations between nodes and can analyze data from more dimensions so that the structural characteristics and dynamic processes in the system can be fully displayed.
In this paper, the second network model is mainly adopted, which takes disaster events as the node and the triggering relationship between disasters as the edge to carry out network abstraction and constructs a complex network model with a disaster evolution network as the carrier.

3.2. Data Source

Through the research in papers, news reports, and related books [51] on the Baige landslide, disaster events covered by the Baige landslide disaster chain network were identified.

4. Characterization of the Evolution of the Landslide Disaster Chain

4.1. Chain Evolution Stage of the Landslide Disaster

Both single-disaster and disaster systems exhibit a phased chain evolution, which is often classified as early gestation, mid-submergence, and late-initiation depending on the temporal alterations of the disaster [51]. The initial incubation stage, characterized by the absence of significant or exceedingly weak damaging effects, encompasses a substantial portion, roughly 70%, of the entire catastrophic period. Following this, the median latent stage, in which a considerable quantity of energy is accumulated or stored to generate the potential destructive capability, lasts just approximately 25% of the time. Finally, the late-induced stage, in which potential energy is released, has a short duration but a high intensity, lasting no more than 5% of the total catastrophic chain cycle.
According to the sliding characteristics of the Baige landslide, the evolution of the landslide chain can be categorized into three distinct stages:
(1) Early Gestation (–1996)
The Qinghai-Tibet Plateau, positioned at the confluence of the Eurasian and Indian Ocean plates, experiences continuous elevation due to crustal dynamics. As a result of the geological process, surface and internal cracks emerge within the slopes. At the same time, the Jinsha River erodes the slope’s base, increasing the sliding traction force and causing slow, permanent deformation of the surrounding slope. At this moment, the features of the landslide mass are unclear, the landslide mass’s border is uncertain, and there has been no substantial change on the macro scale. As a result, determining whether sliding is occurring based on landslide mass deformation is impossible. Instead, judgment is generally based on the historical landslide occurrence and the region’s landform.
(2) Medium-term slip (1996–2015)
Over time, due to prolonged rainfall, wind erosion, freezing and thawing, and earthquakes, the potential sliding surface of the Baige landslide progressively develops creep deformation. The slope begins to slide initially, with transverse stress fractures tens of meters long forming at the back edge. Subsequently, it enters the stage of constant velocity sliding. The landslide’s general contour was macroscopic, and mirror sliding, scratches, and other phenomena were observed on the sliding surface. The development process took a long period, and the moving slope exhibited an increasing uniform displacement trend.
(3) Late instability (2015–2018)
During this stage, the rate of deformation on the Baige landslide slope continues to escalate. The deformation curve becomes steeper as the landslide approaches, signifying an accelerated deformation phase. The sliding surface becomes fully connected, the sliding force of the rock and soil mass intensifies, and the central collapse deformation becomes more pronounced. This stage is shorter in duration compared to the previous two phases and is often accompanied by phenomena such as acoustic emissions and abnormalities in groundwater levels.

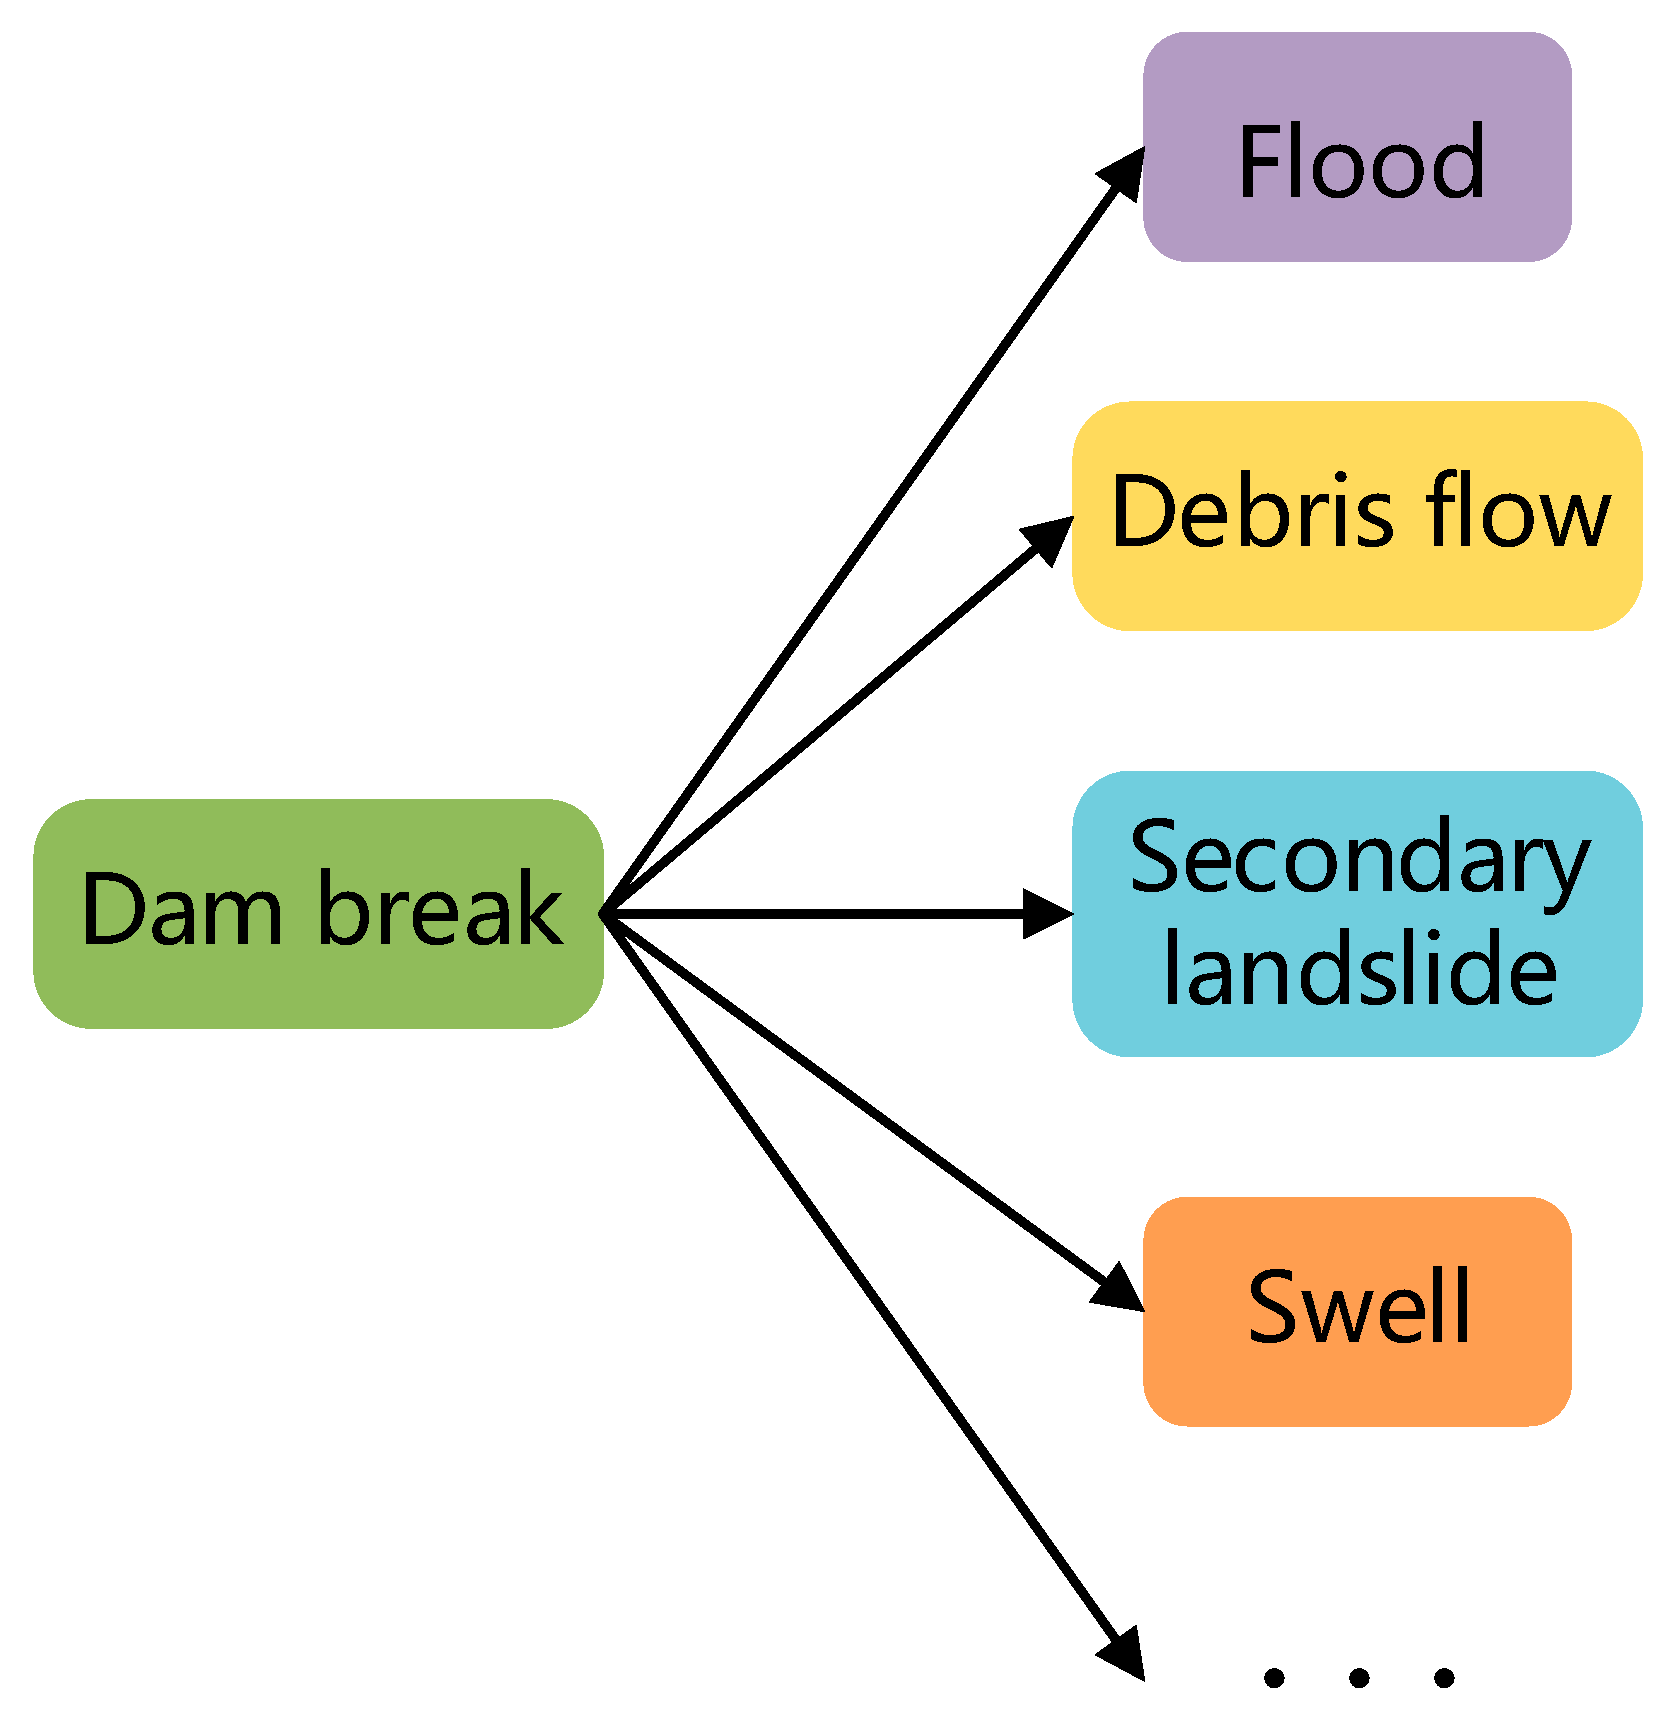
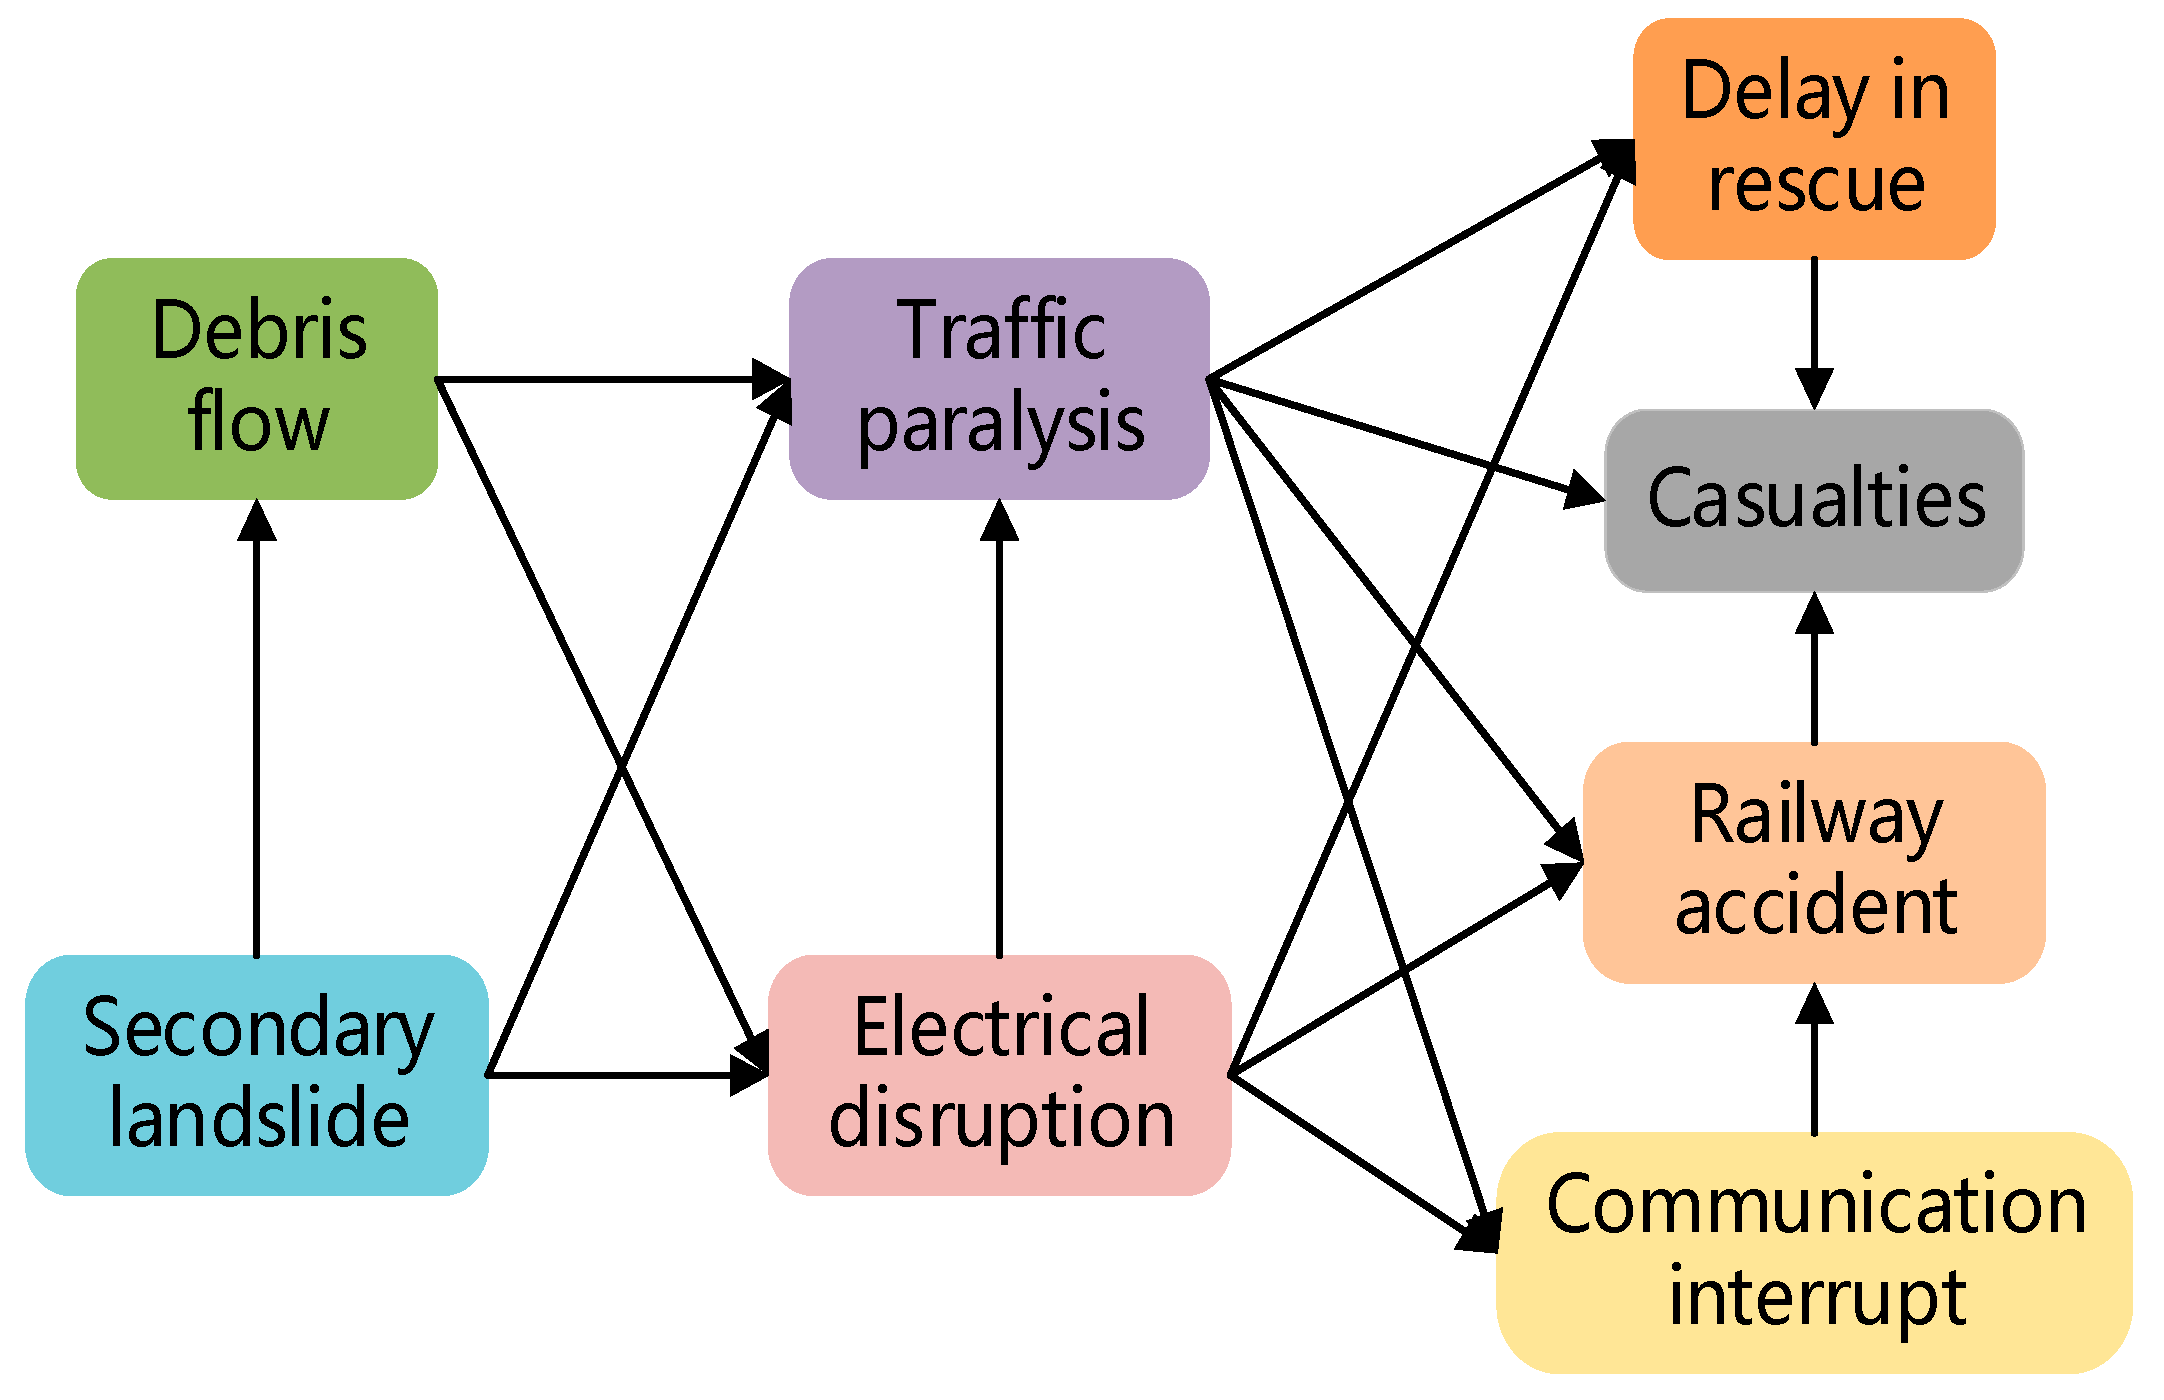
4.2. Types of Landslide Disaster Chain Evolution

Multiple secondary disasters have been created as a result of landslide catastrophes, producing a chain-type evolution network comprising several disasters. Xiao [51] classified various disaster chain developments into a chain-type disaster chain, a dispersed disaster chain, a centralized disaster chain, a shuttle-type disaster chain, and a network-type catastrophe chain. The Baige landslide disaster chain is made of cascade, dispersed, focused, and shuttle catastrophe chains, according to a review of historical landslide incidents on the Qinghai-Tibet Plateau.
(1) Cascade disaster chain
A cascading catastrophe chain is a sort of unidirectional continuation of the evolution of a single hazard type that produces other types of danger during the evolution of the hazard. As illustrated in Figure 6, following the Baige landslide, the landslide mass carried dirt and stones into the Jinsha River channel, leading to the obstruction and diversion of the river channel and the formation of a barrier lake. This, in turn, resulted in a downstream flood disaster when the lake water breached its barriers. The preceding tragedy is the beginning point for the following disaster in a cycle of cascading disasters. Controlling the emergence of the aforementioned disaster or cutting off the link between the two disasters might help to avoid the development of subsequent disasters.
(2) Dispersed disaster chain
A dispersed disaster chain represents a type of disaster chain evolution in which hazards branch into various sub-hazards that extend outward like veins. As shown in Figure 7, the release of water from the dammed lake reservoir occurred after the obstruction of the Jinsha River channel, giving rise to floods, debris flows, secondary landslides, and surges. In a dispersed disaster chain, source hazards can lead to multiple forms of hazard concurrency, and by controlling the originating hazard from occurring or cutting of the connecting edges, subsequent hazards will not occur.
(3) Centralized disaster chain.
Concerning the manifestation of the evolutionary network, the focused disaster chain and the dispersed disaster chain exhibit a reciprocal relationship, branching into numerous secondary disasters during their evolution into a comprehensive and highly destructive disaster format. As shown in Figure 8, after the Baige landslide, secondary disasters such as mudslides, rock flows, and floods continue to induce secondary disasters, resulting in damage to power facilities, shipping accidents, animal husbandry, and business stoppages. This series of disaster events has jointly evolved into economic loss events. In the concentrated disaster chain, a single control of a disaster event or connecting edge cannot prevent the occurrence of subsequent disaster events. Given the challenge of entirely averting the emergence of all disaster elements, it is often necessary in practice to manage the consequences of each disaster event to mitigate the extent of harm.
(4) Shuttle disaster chain
The shuttle-type disaster chain is distinguished by the mutual interweaving, intersection, and transition of multiple disaster types during its evolution, while still preserving the cumulative trend of multiple disaster species. As shown in Figure 9, the rupture of the barrier lake dam triggered a secondary landslide disaster, which, in turn, triggered a debris flow. Both of those events could lead to transportation gridlock and power disruptions, jointly triggering a series of disasters such as delayed rescue, railway accidents, and communication accidents, forming a potential risk of casualties. The form of a shuttle disaster chain is intricate, with multiple disasters frequently occurring in tandem, influencing, intersecting, and interpenetrating each other.

4.3. Characteristics of the Landslide Disaster Chain

(1) The landslide disaster chain encompasses a broad time scale. Influenced by the development stage’s characteristics, the early stages of Baige landslide mass development remain concealed, and the period proceeding the landslide occurrence is tens of times longer than the late landslide outbreak. In addition, the time from dammed river course to dam lake after different landslides to dam-break flood outbreak is uncertain, ranging from several hours to several months. Relatively speaking, the total duration of the outburst flood of the barrier lake formed by the Baige landslide is relatively short.
(2) The landslide disaster chain exerts a wide-ranging spatial impact. Given the substantial gravitational potential energy and kinetic energy of the Baige landslide, its impact range is wide and the disaster consequences are serious. After the landslide disaster, the residential houses, buildings, and roads along the line will not be spared, and the subsequent influence will reach several kilometers.
(3) The evolution of the landslide disaster chain is intricate and unpredictable. Impacted by the diversity of other types of disasters triggered by landslides, the Baige landslide disaster chain encompasses numerous interconnected disaster types, exhibiting complex evolutionary directions and severe disaster outcomes.

5. Study on the Evolution Network Model of the Landslide Disaster Chain

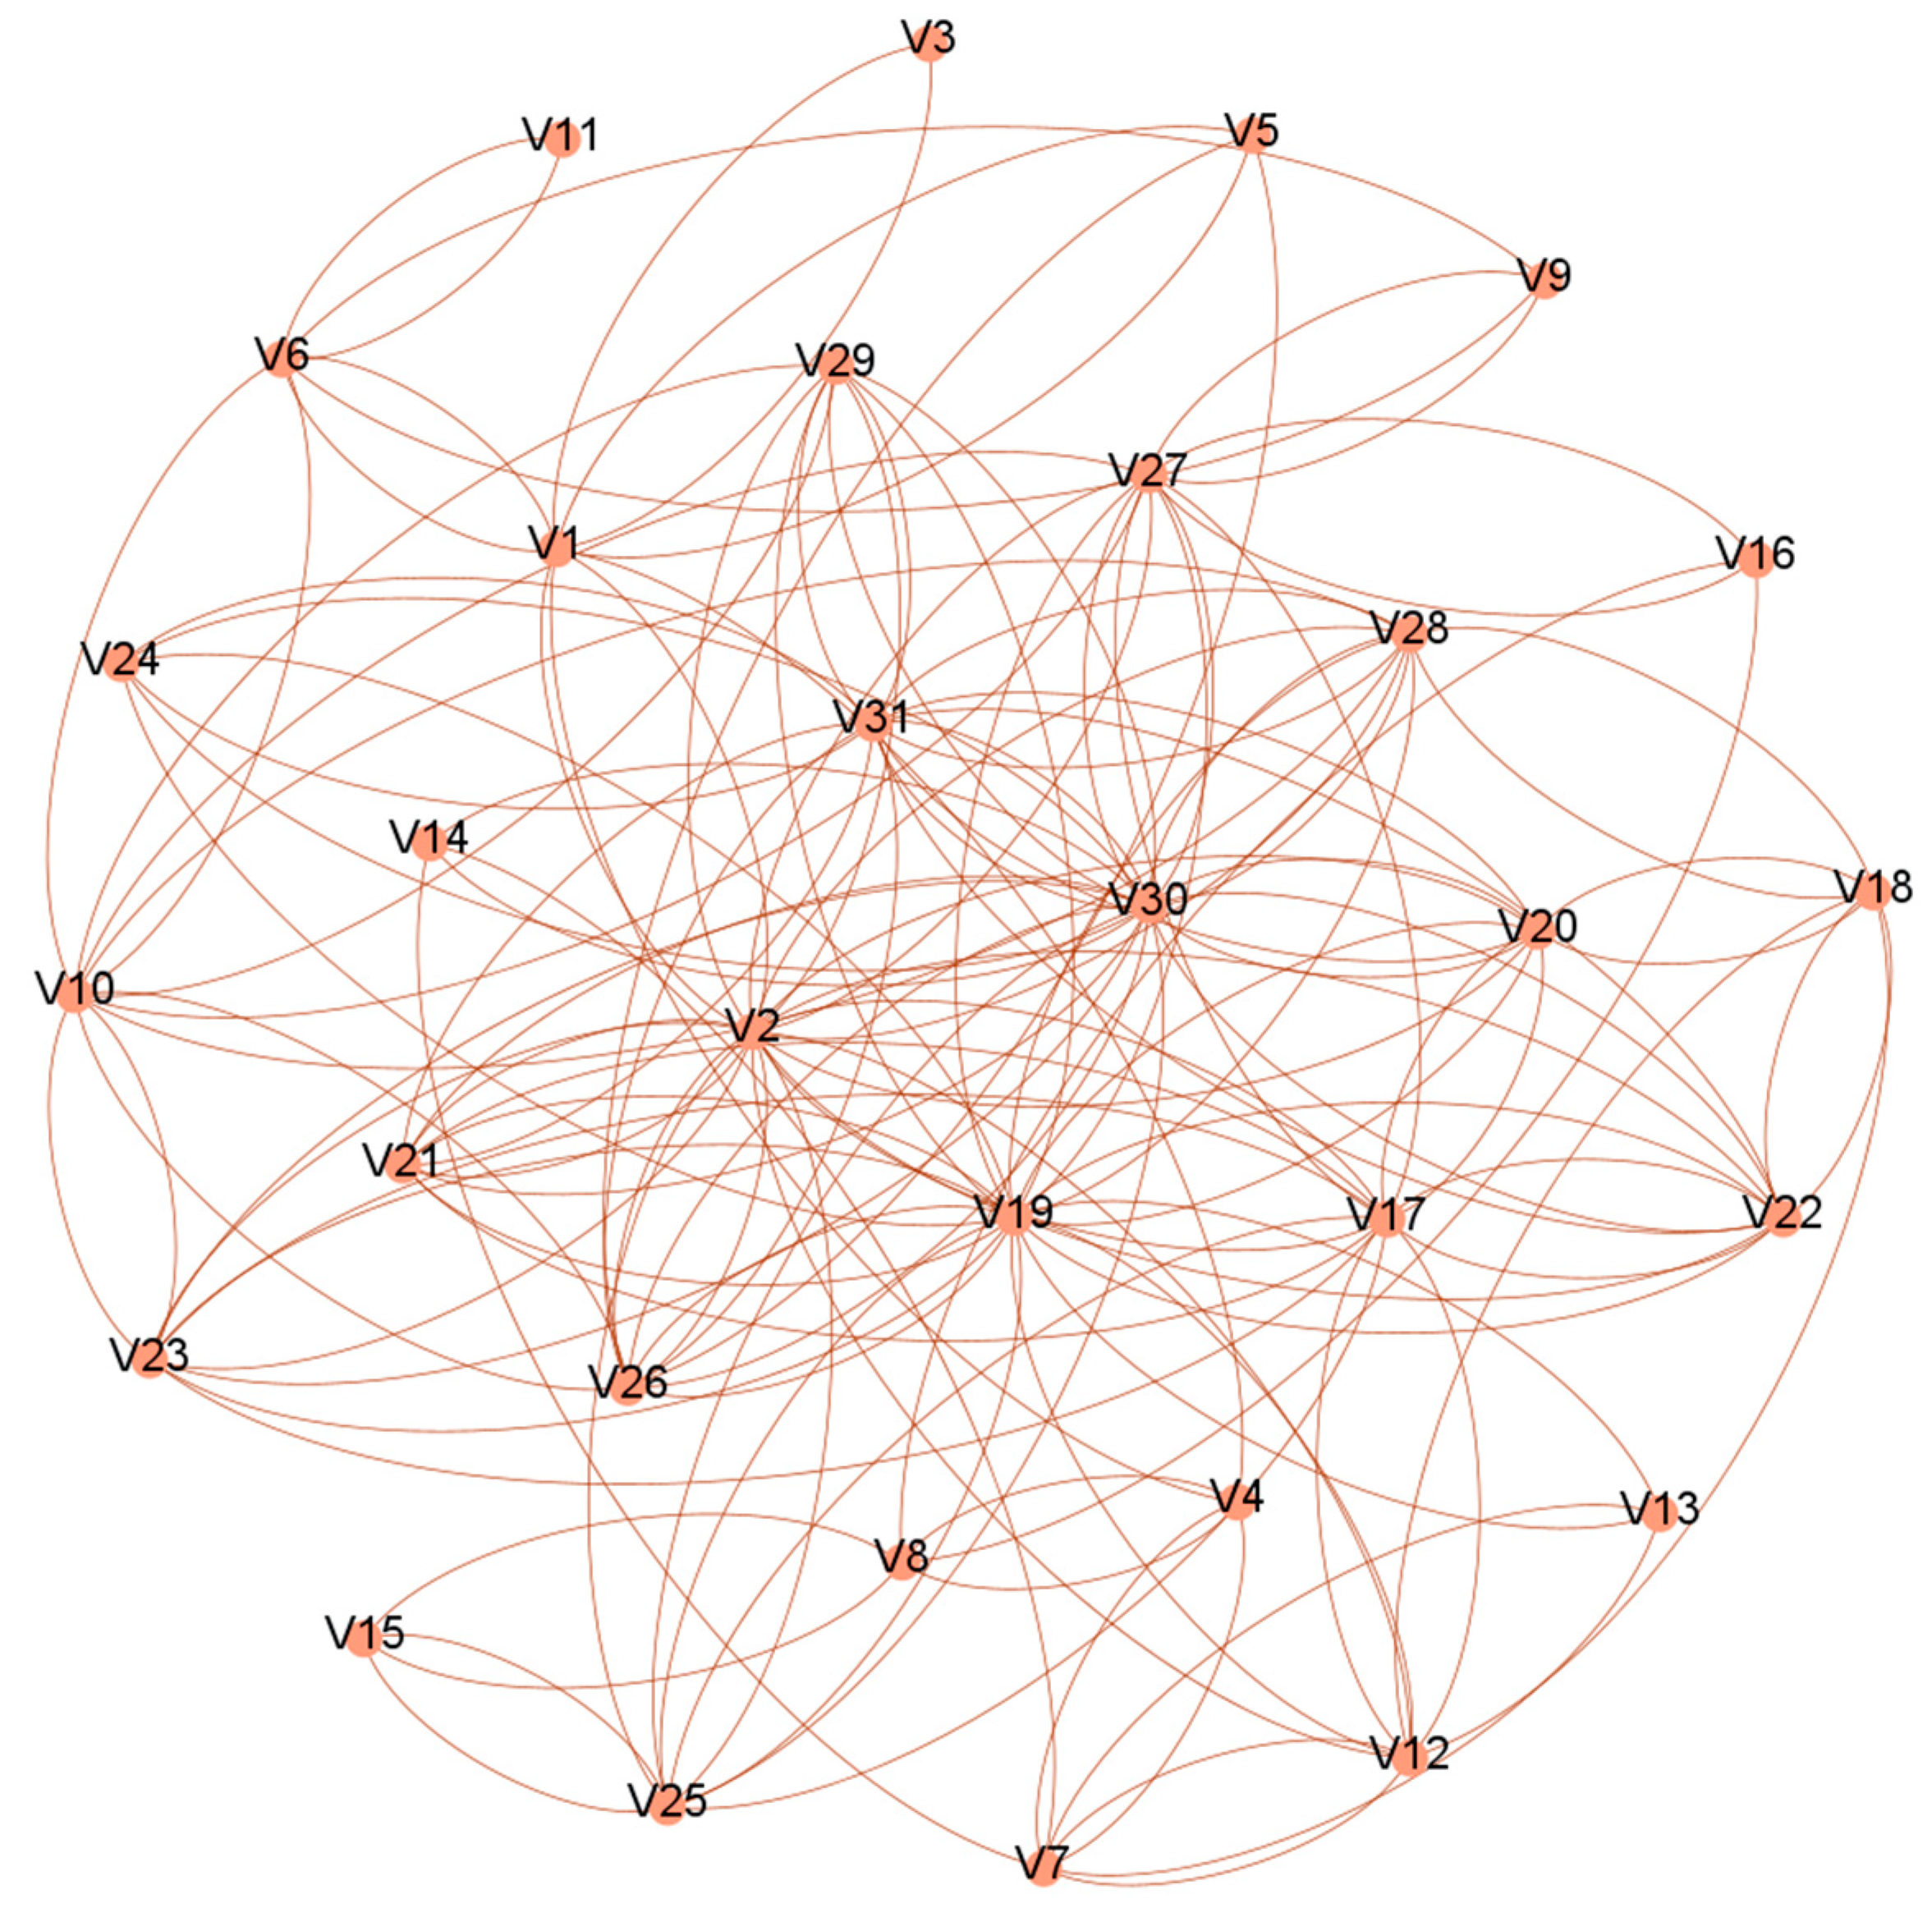
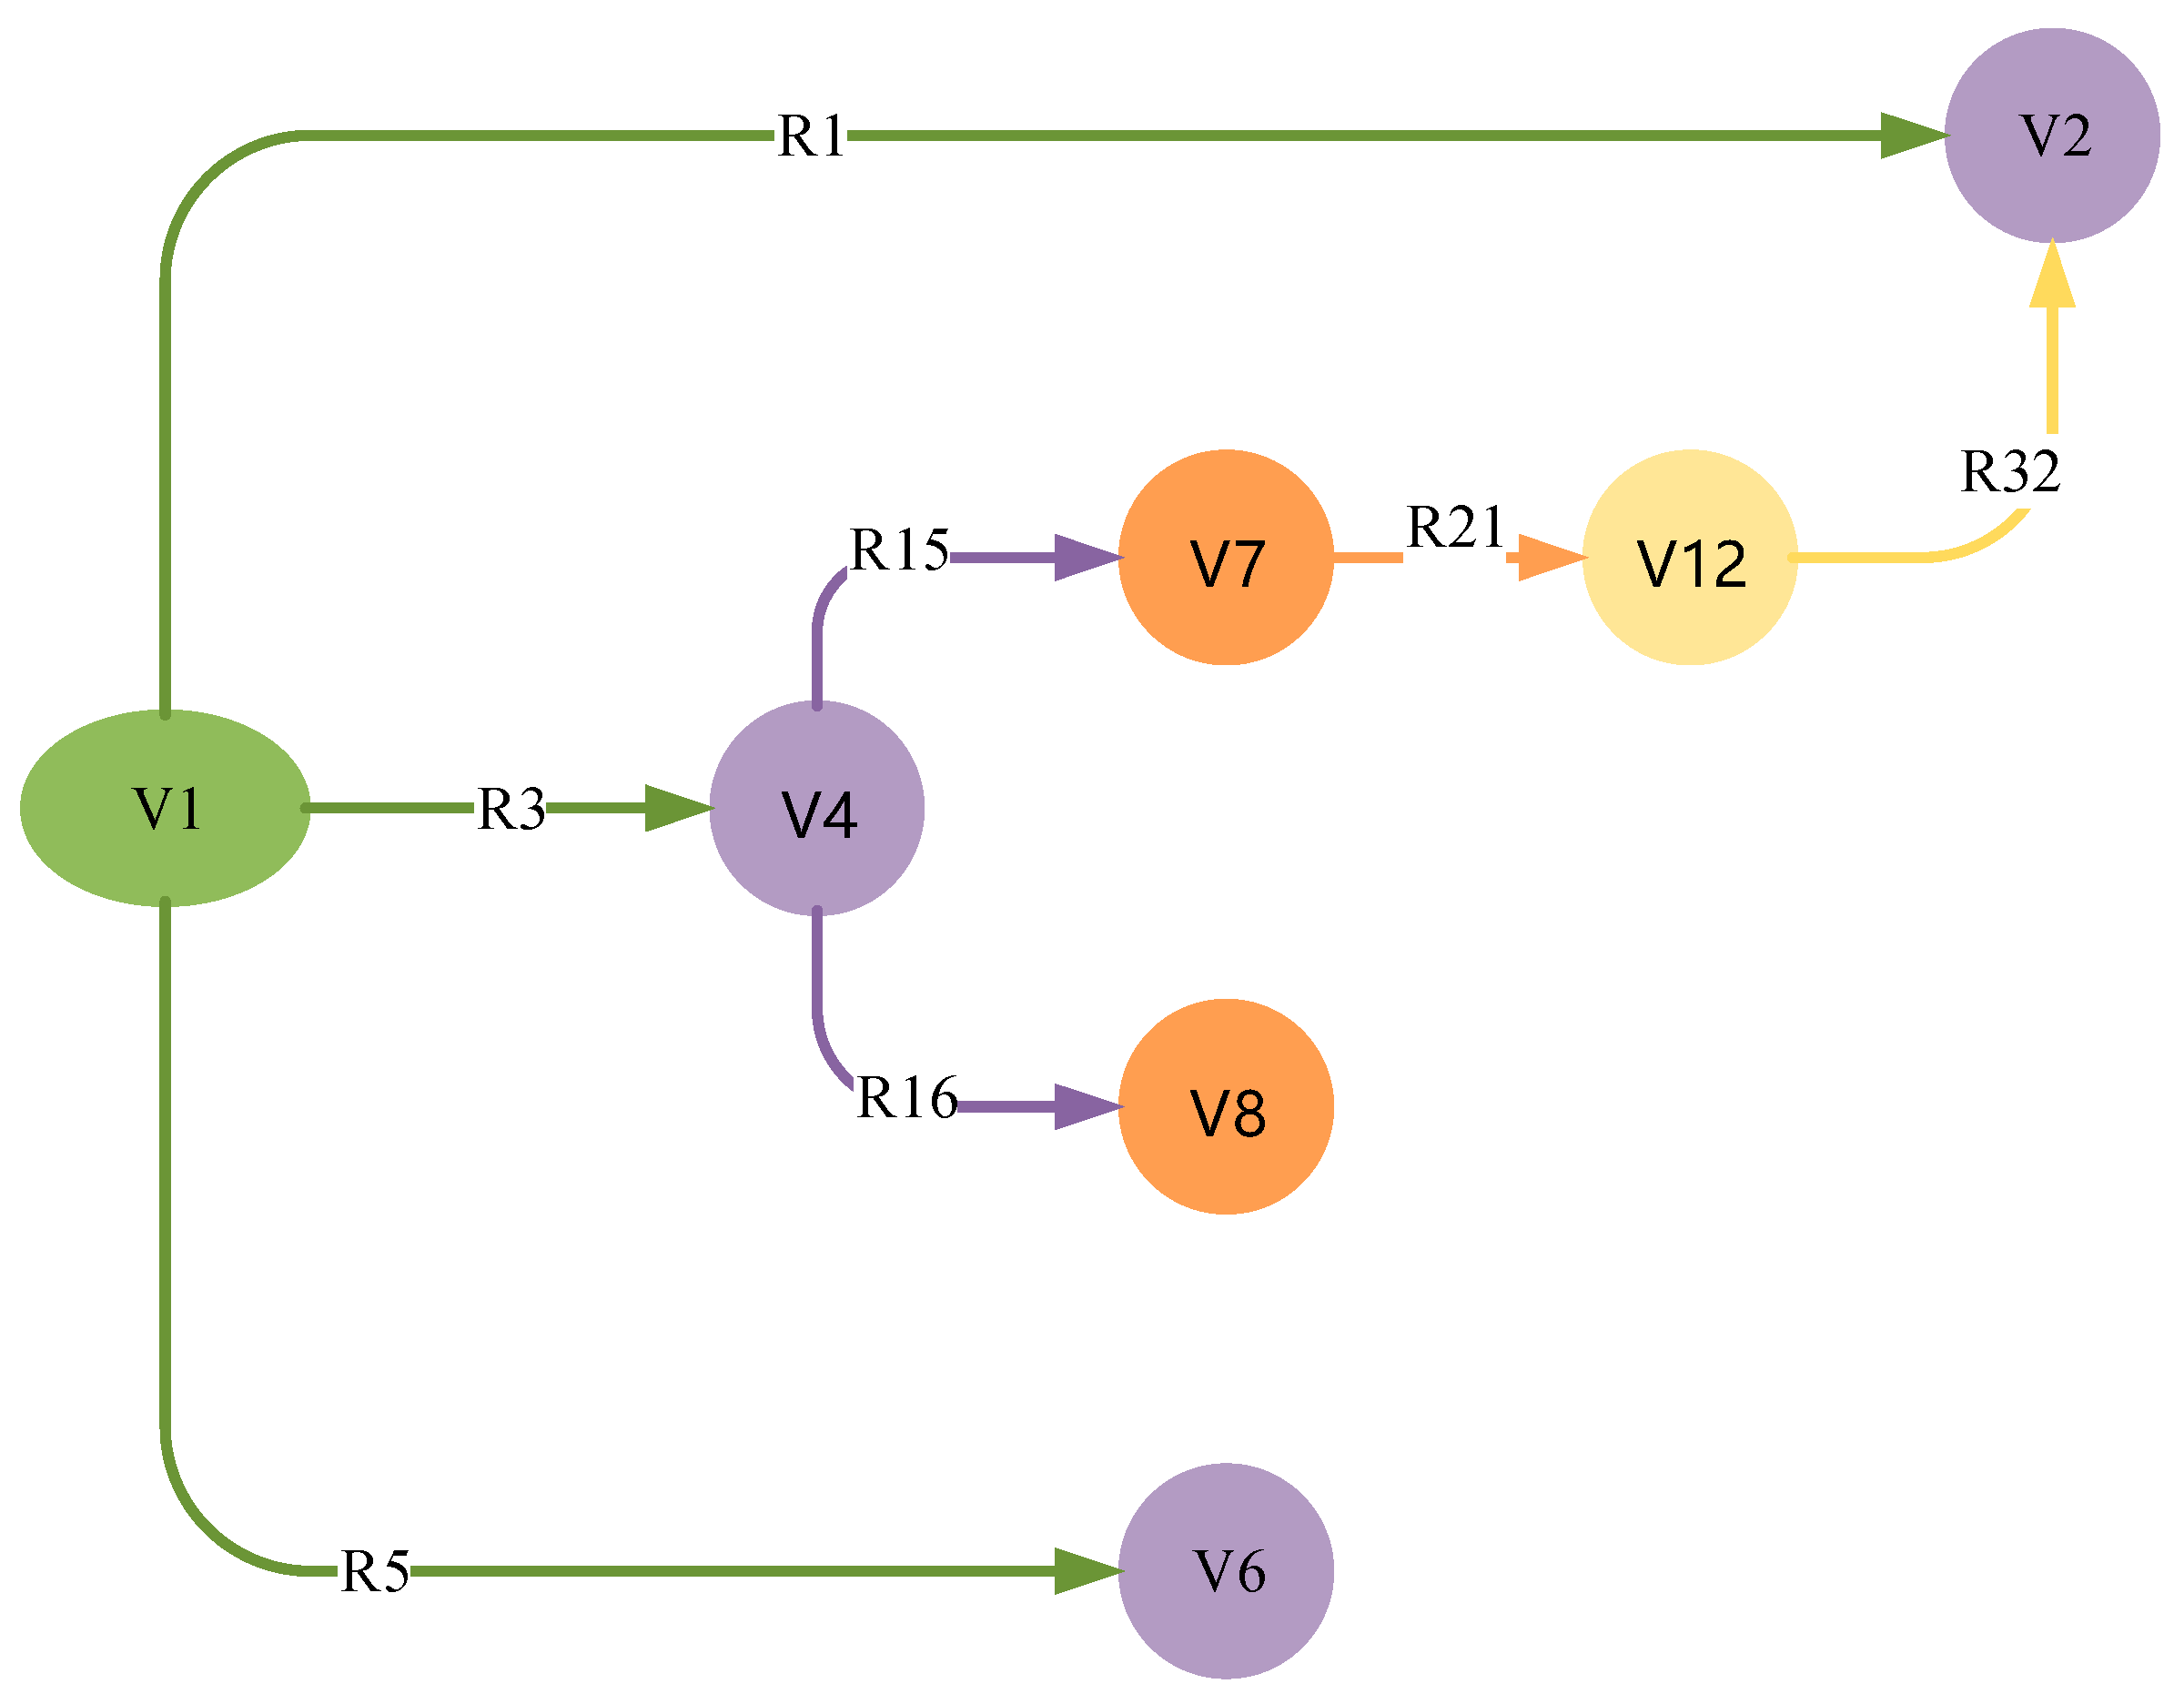
5.1. Construction of a Landslide Disaster Chain Evolution Network Model

The evolution network structure of the landslide disaster chain is intricate, encompassing a variety of causal relationships, including one cause and one effect, one cause and multiple effects, and one effect and multiple causes [52]. Through an analysis of the chain’s evolutionary stages and the types of the Baige landslide on the Jinsha River, we have identified 31 disaster elements that are part of the landslide disaster chain (Table 2).
A complex network structure composed of multiple nodes and directional connecting edges is selected as a research tool, and the relationship between a disaster event and each disaster event is abstracted into the points and edges of the network, that is, 31 nodes represent 31 landslide disaster crisis elements, 77 directional connecting edges represent the development relationship between crisis elements, and directional arrows represent the disaster evolution direction. Therefore, an undirected disaster network, that is, a landslide disaster chain evolution network model, is constructed, as shown in Figure 10. A node in the network represents a disaster event, and the loss caused by the disaster is measured by the degree of the node. The degree of the node reflects the impact of the disaster event, including the loss of the disaster and the relationship between the disaster and other disasters.
The adjacency matrix is a representation of connections between vertices, and it serves as a two-dimensional array for storing the connecting edges between vertices. This matrix allows for the rapid identification of connection relationships between two nodes, simplifying the calculation of each node’s degree. It can be divided into directed adjacency and undirected adjacency by analyzing the disaster events included in the disaster chain of the evolutionary network model and the connection between events and extracting the 31 × 31 “node connecting edge” adjacency matrix (Figure 11). The rows and columns of the matrix correspond to 31 disaster nodes (V1 to V31), and the adjacency matrix clearly illustrates the undirected relationship between the 31 hazard events. If there is a triggering relationship between disaster event Vi and disaster event Vj, the corresponding matrix unit is 1. If there is no triggering relationship between disaster event Vi and disaster event Vj, the corresponding matrix unit is 0.
Gephi, a complex network analysis software based on JVM (Java Virtual Machine), is primarily designed for dynamic display and hierarchical graph visualization of various networks and complex systems. It excels in efficiently handling large networks with numerous nodes and connecting edges. By utilizing Gephi software to process the extracted adjacency matrix, the complex network topology of the landslide disaster chain is obtained [53], as illustrated in Figure 12.

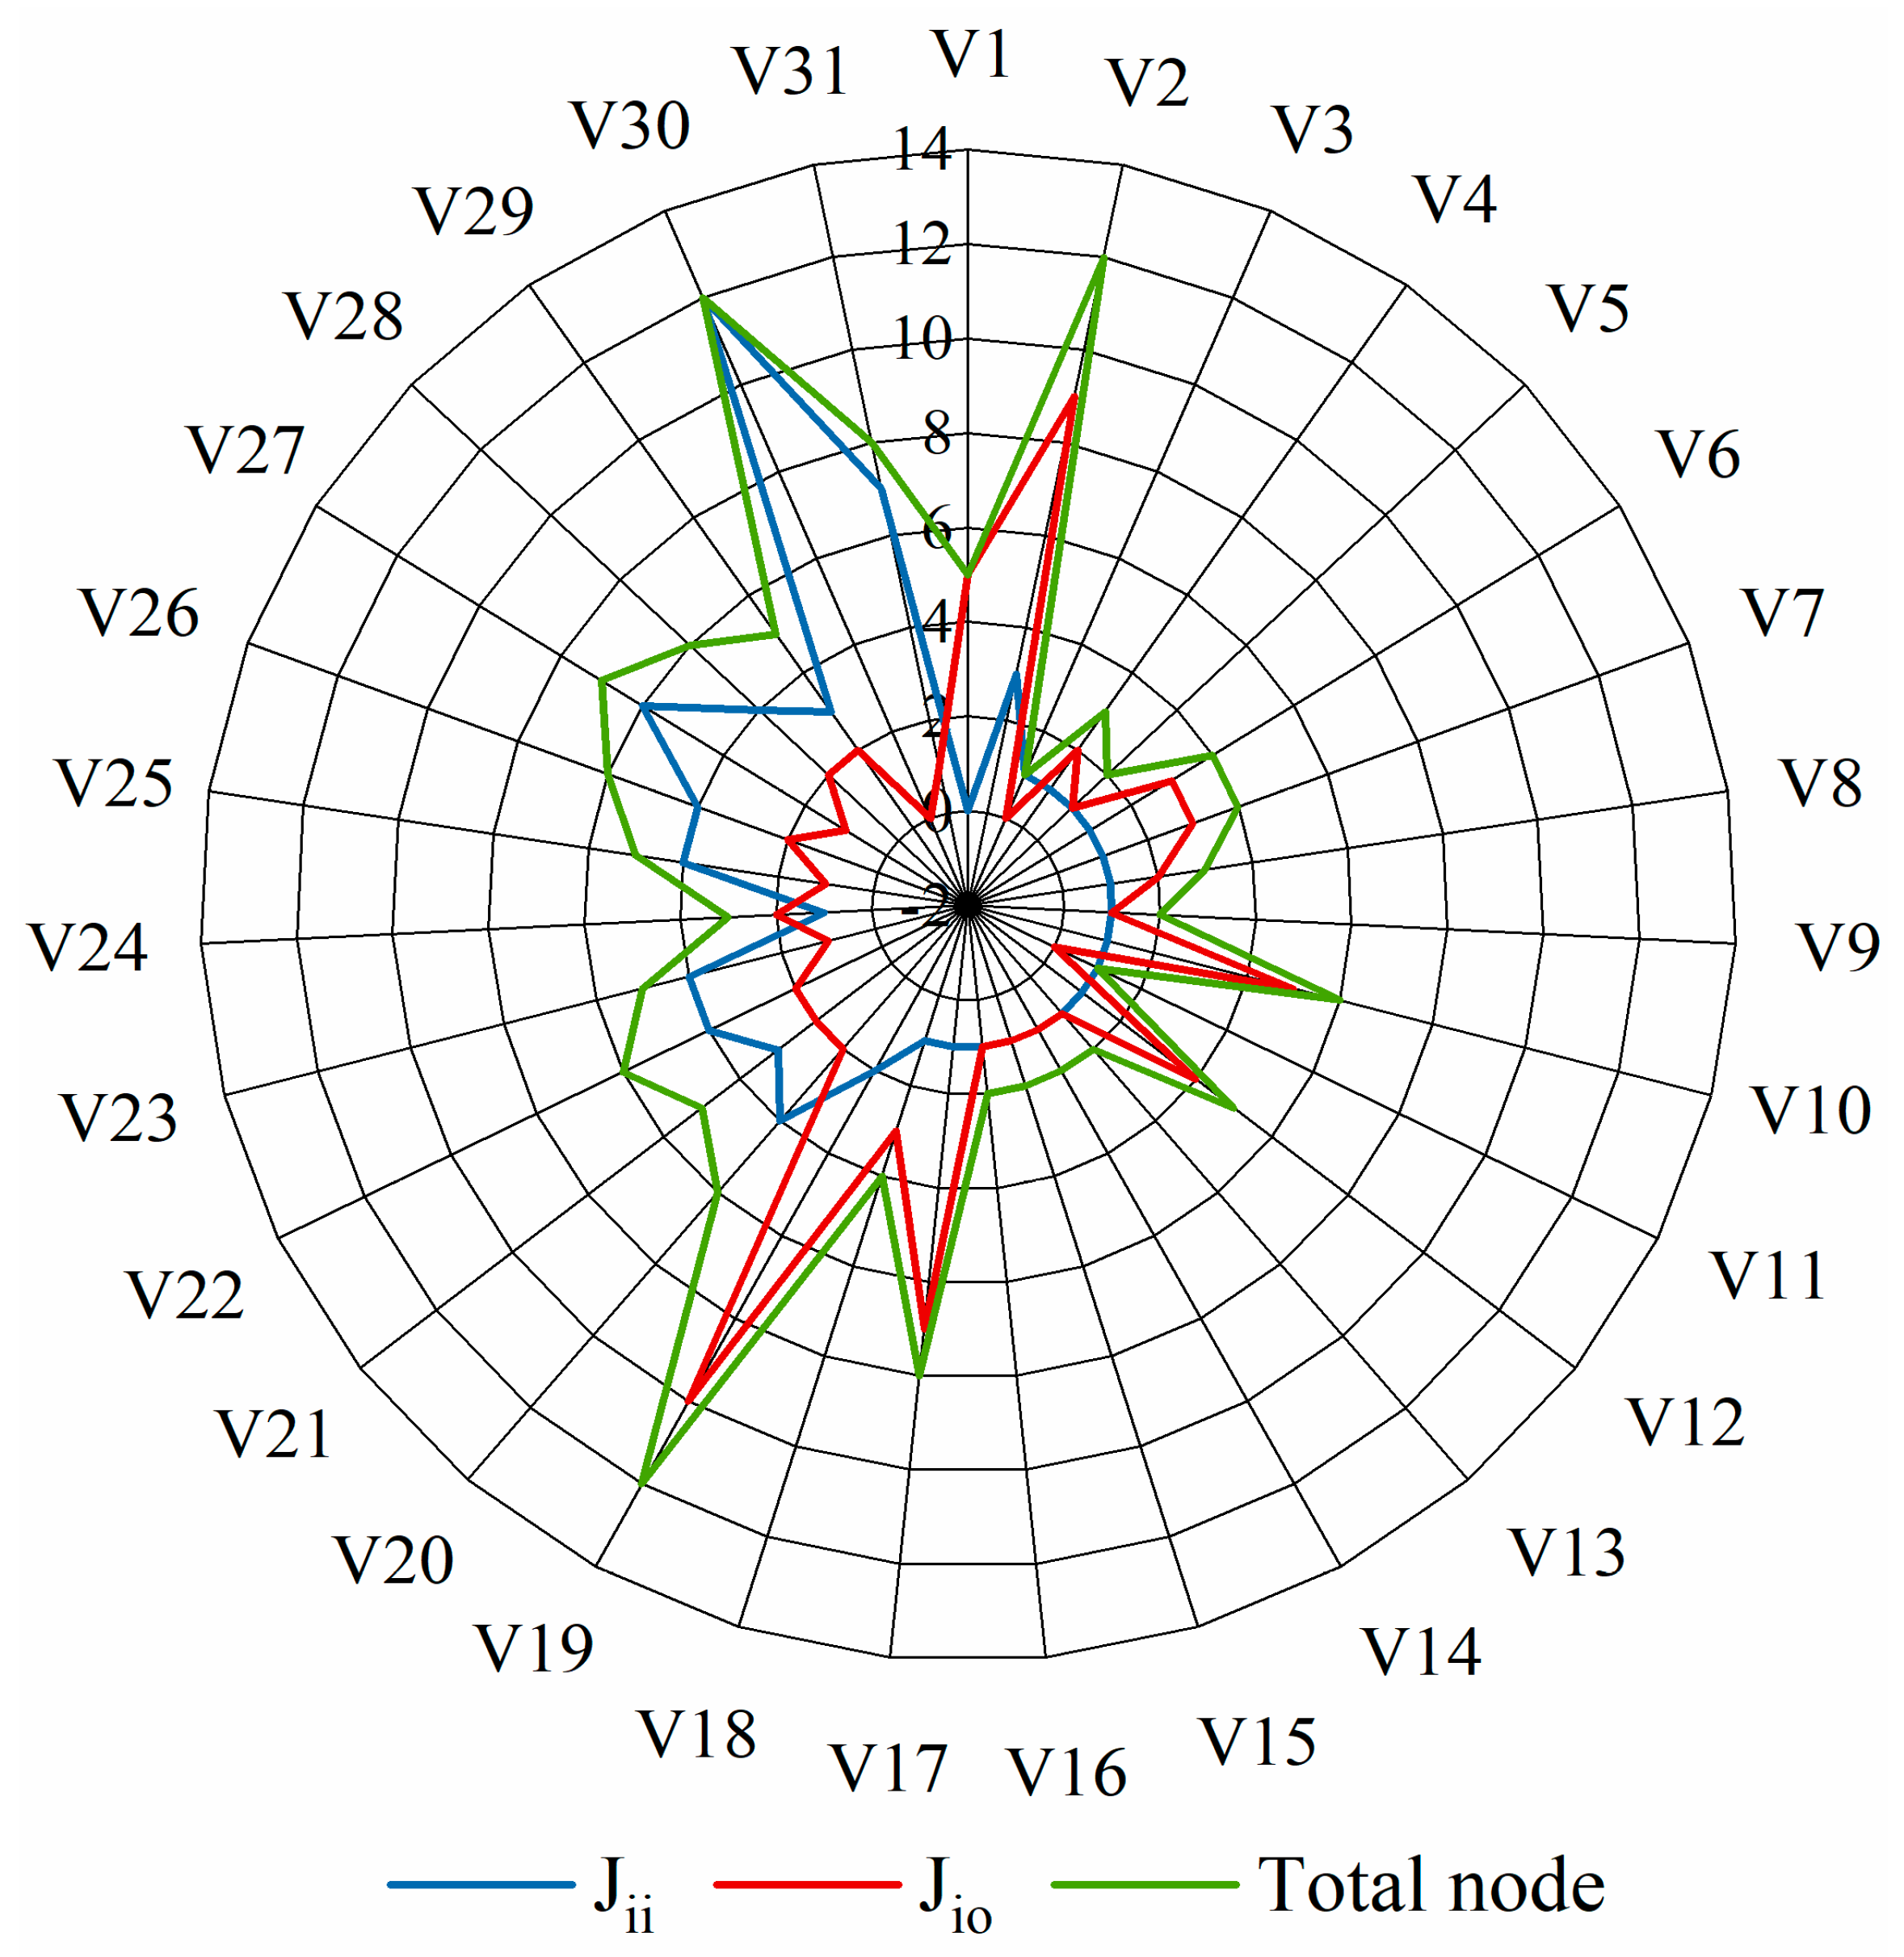
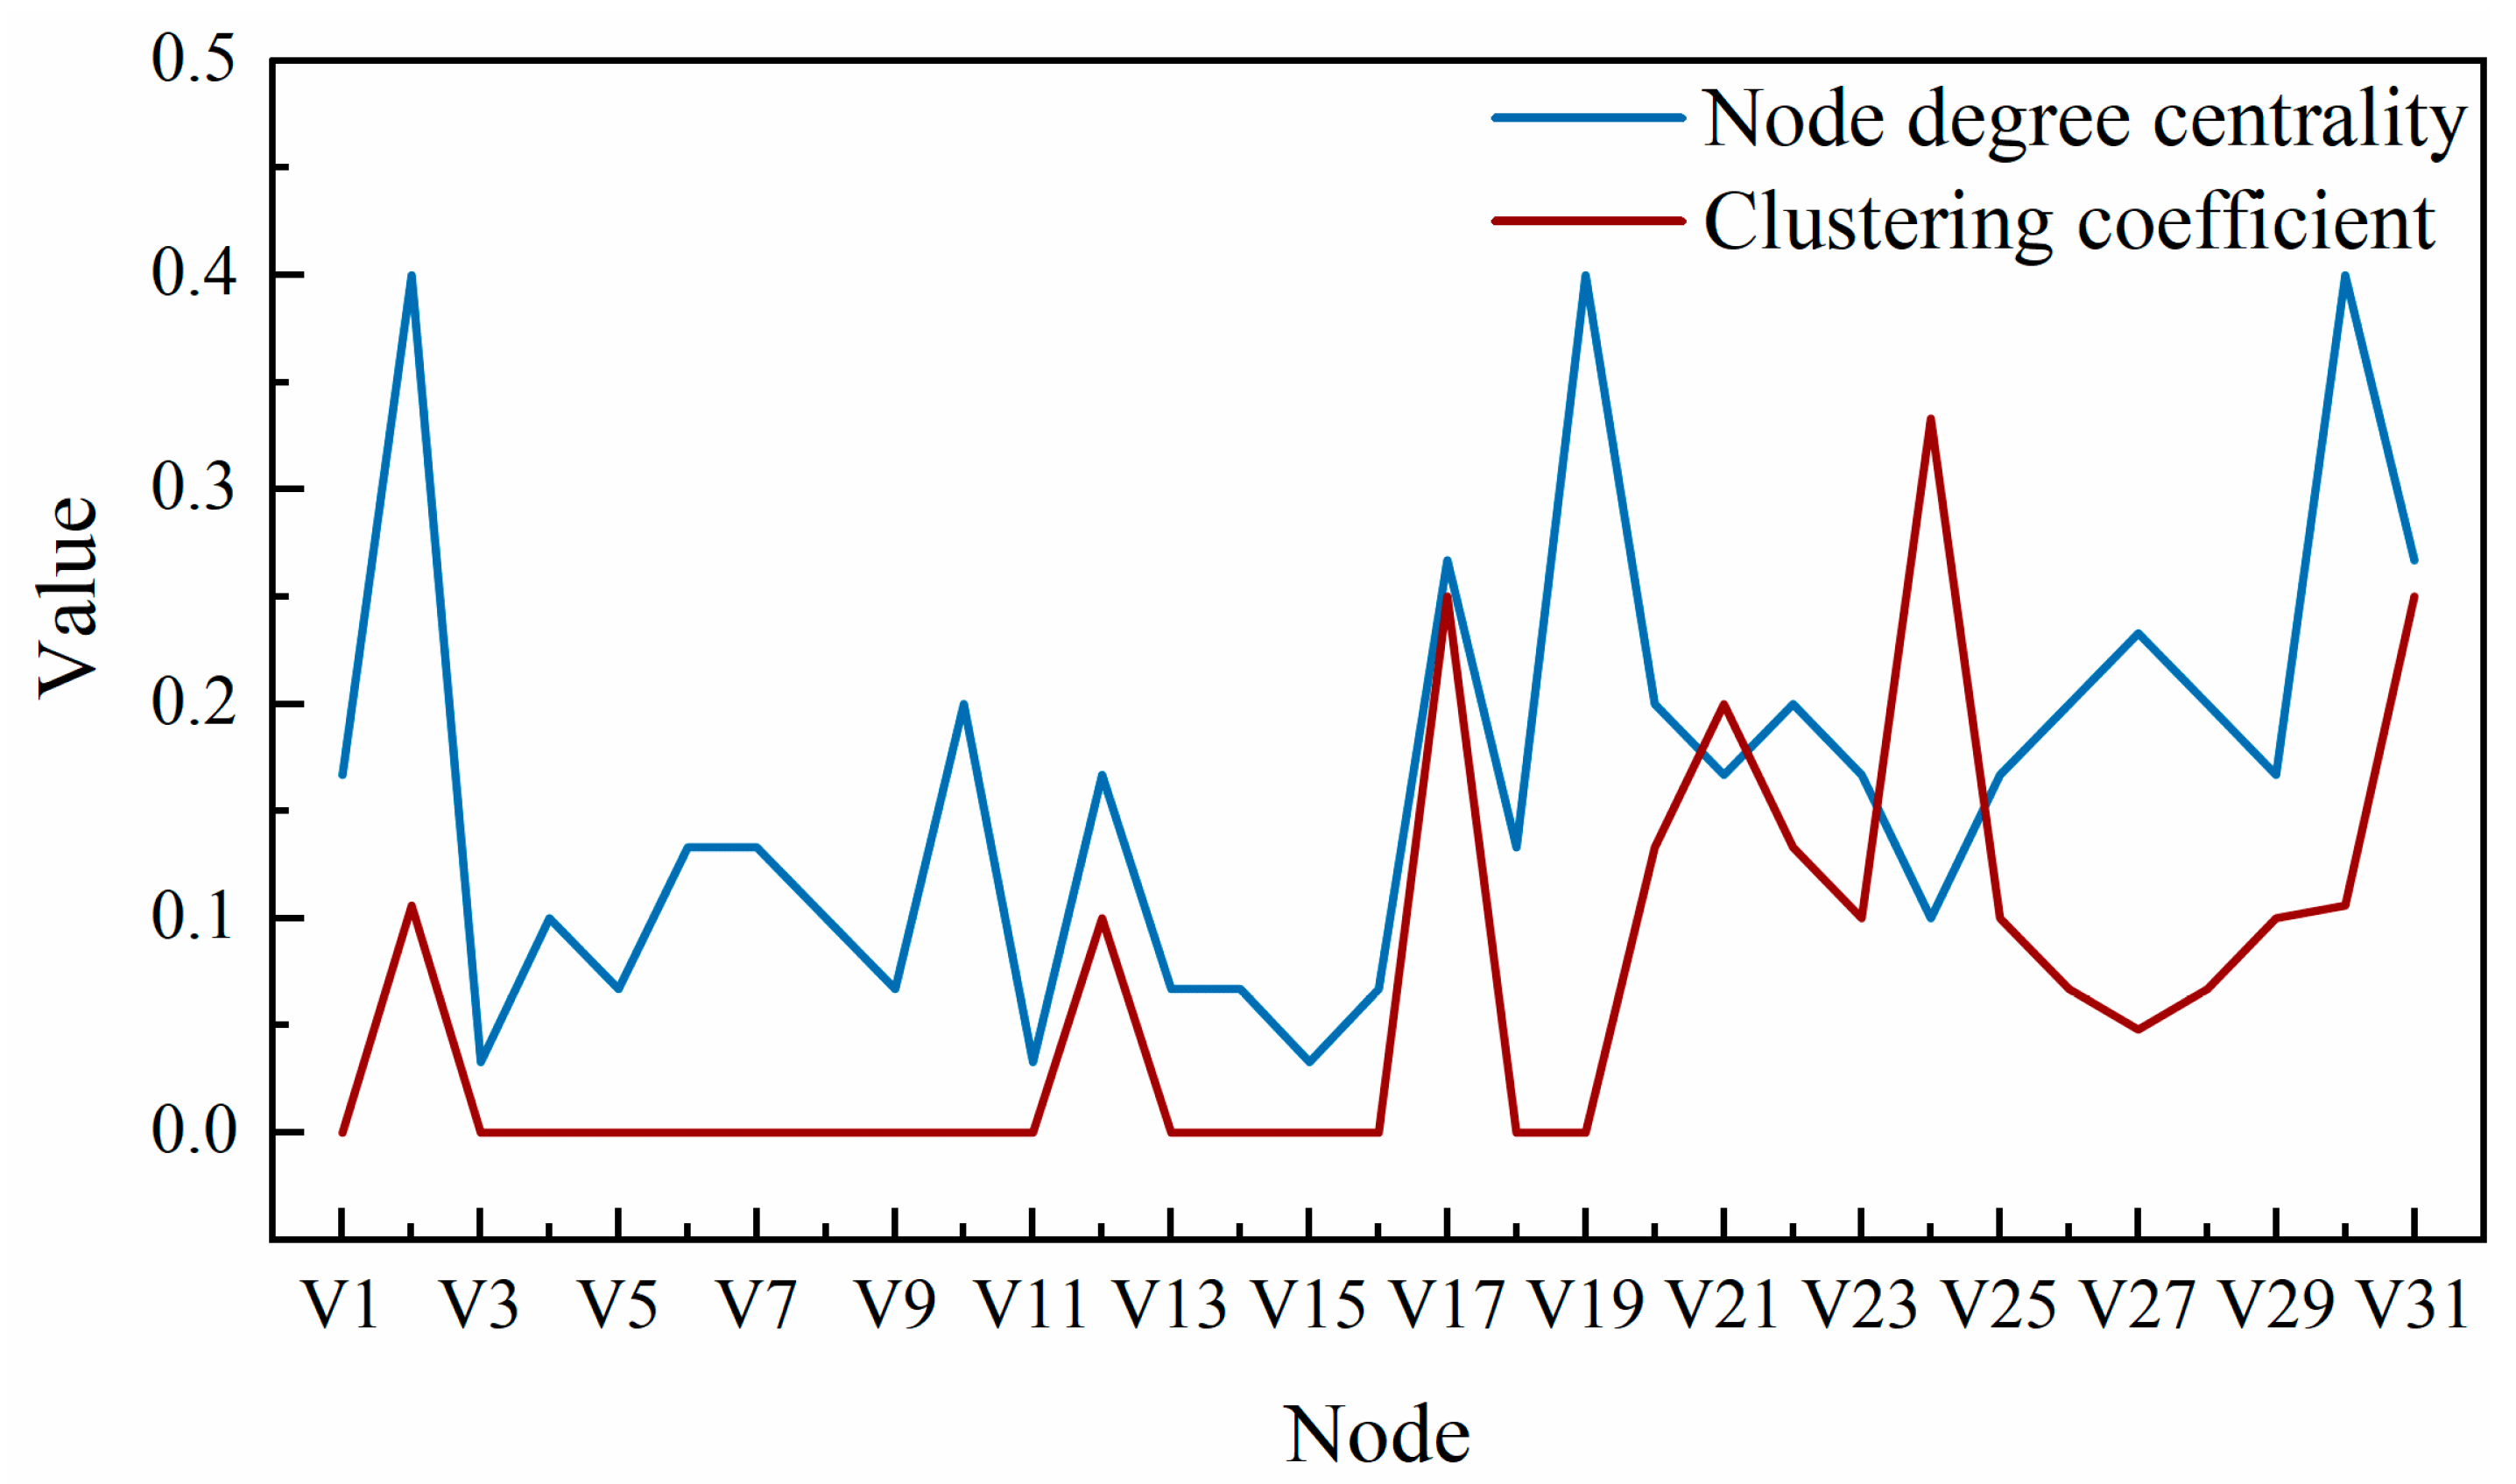
5.2. Analysis on the Importance of Nodes in the Landslide Disaster Chain Network Model

(1) Node degree Ji
In the evolutionary network model of the disaster chain, the node degree consists of both the node entry degree Jii and the node exit degree Jio. The node entry degree represents the count of prior crisis events that can initiate the current catastrophe. A higher r entry degree implies that more disaster elements can trigger the disaster event, increasing the event’s likelihood. The node exit degree signifies the number of subsequent disaster events that can be induced by the current disaster event. A higher exit degree results in a wider range of subsequent disasters stemming from the initial catastrophe and more severe disaster consequences [54,55].
J i = i = 1 , i j N A i j
Aij—Number of connecting edges between nodes Vi and Vj;
N—Total number of nodes in the disaster chain network.
(2) Node degree centrality Ci
This indicator represents the ratio of the actual number of disaster events connected to the current node to the maximum number of possible connections. It reflects the importance and influence of the current disaster events within the disaster chain network.
C i = K i N 1
Ki—Number of nodes associated with node Vi;
N—Total number of nodes in the disaster chain network.
(3) Clustering coefficient Gi
This indicator represents the ratio of the actual number of connections between hazardous events at neighboring nodes of the current hazard Vi to the maximum possible number of connections. It can reflect the tightness of connection between hazards in the hazard chain.
G i = 2 S i n ( n 1 )
Si—The actual number of connected edges between n adjacent nodes of node Vi;
n—Number of nodes with adjacent edges to node Vi.
In addition, the disaster chain evolution network clustering coefficient is
G = 1 N i = 1 N G i .
A higher G value indicates a better overall concentration of the disaster chain evolution network [56].
The node degree correlation calculations were performed for the landslide disaster chain evolution network model in Figure 10 using Formulas (1)–(4), This yielded the node degree and clustering coefficient for each disaster event, as shown in Figure 13 and Figure 14.
According to Figure 13 and Figure 14, the following information can be known:
(1) In the evolution process of a landslide disaster chain, flood, debris flow, secondary landslide, downstream flood, and other disaster events exhibit a high incidence. This suggests that these disasters have a profound impact on subsequent events and are more likely to trigger subsequent multi-disaster events. High casualty rates, economic losses, and animal husbandry injuries indicate that other disasters may also lead to varying degrees of casualties and economic losses. Examining the network’s overall connectivity, dam break, road damage, and damage to power facilities, among other intermediate disaster events, have node degrees exceeding 5. This implies that these disaster nodes wield significant influence in the disaster chain network and are closely related to other disaster events. They represent important factors contributing to economic losses in the landslide disaster chain.
(2) Within the evolutionary network of landslide hazard chains, 15 disaster events have clustering coefficients greater than 0, representing 48.4% of the total number of hazardous events. Among these, plague or infectious disease, casualties, secondary landslides, and damage to power facilities have higher clustering coefficients, indicating closer linkages compared to others. However, none of them are clustered to a high degree. The clustering coefficient G = 0.061 was calculated for this hazard chain network diagram, suggesting that numerous factors contribute to eventual economic losses and human casualties throughout the landslide disaster chain risk evolution process. Still, there is no significant mutual influence relationship between most risk events. Instead, a “single node—single node” transmission relationship is prominent, signifying that the final hazard can be effectively controlled by merely severing the transmission between nodes.
(3) By calculating the node entry and exit degrees of the landslide disaster chain evolution network, we can identify key nodes. In actual disaster prevention and reduction efforts, we should prioritize eliminating these nodes to disrupt the network. For example, we can proactively identify dangerous landslides in advance, take engineering measures to protect the slope, and organize residents in hazardous areas to evacuate. In daily work, hydrological and meteorological forecasts shall be strengthened. Danger zoning shall be carried out in advance in the areas prone to debris flow, and disaster avoidance routes shall be set. Dangerous investigations shall be carried out around roads and farmland, and fences shall be set up to intercept the sliding objects so as to ensure smooth traffic flow in critical sections and avoid the blockage of follow-up rescue routes.

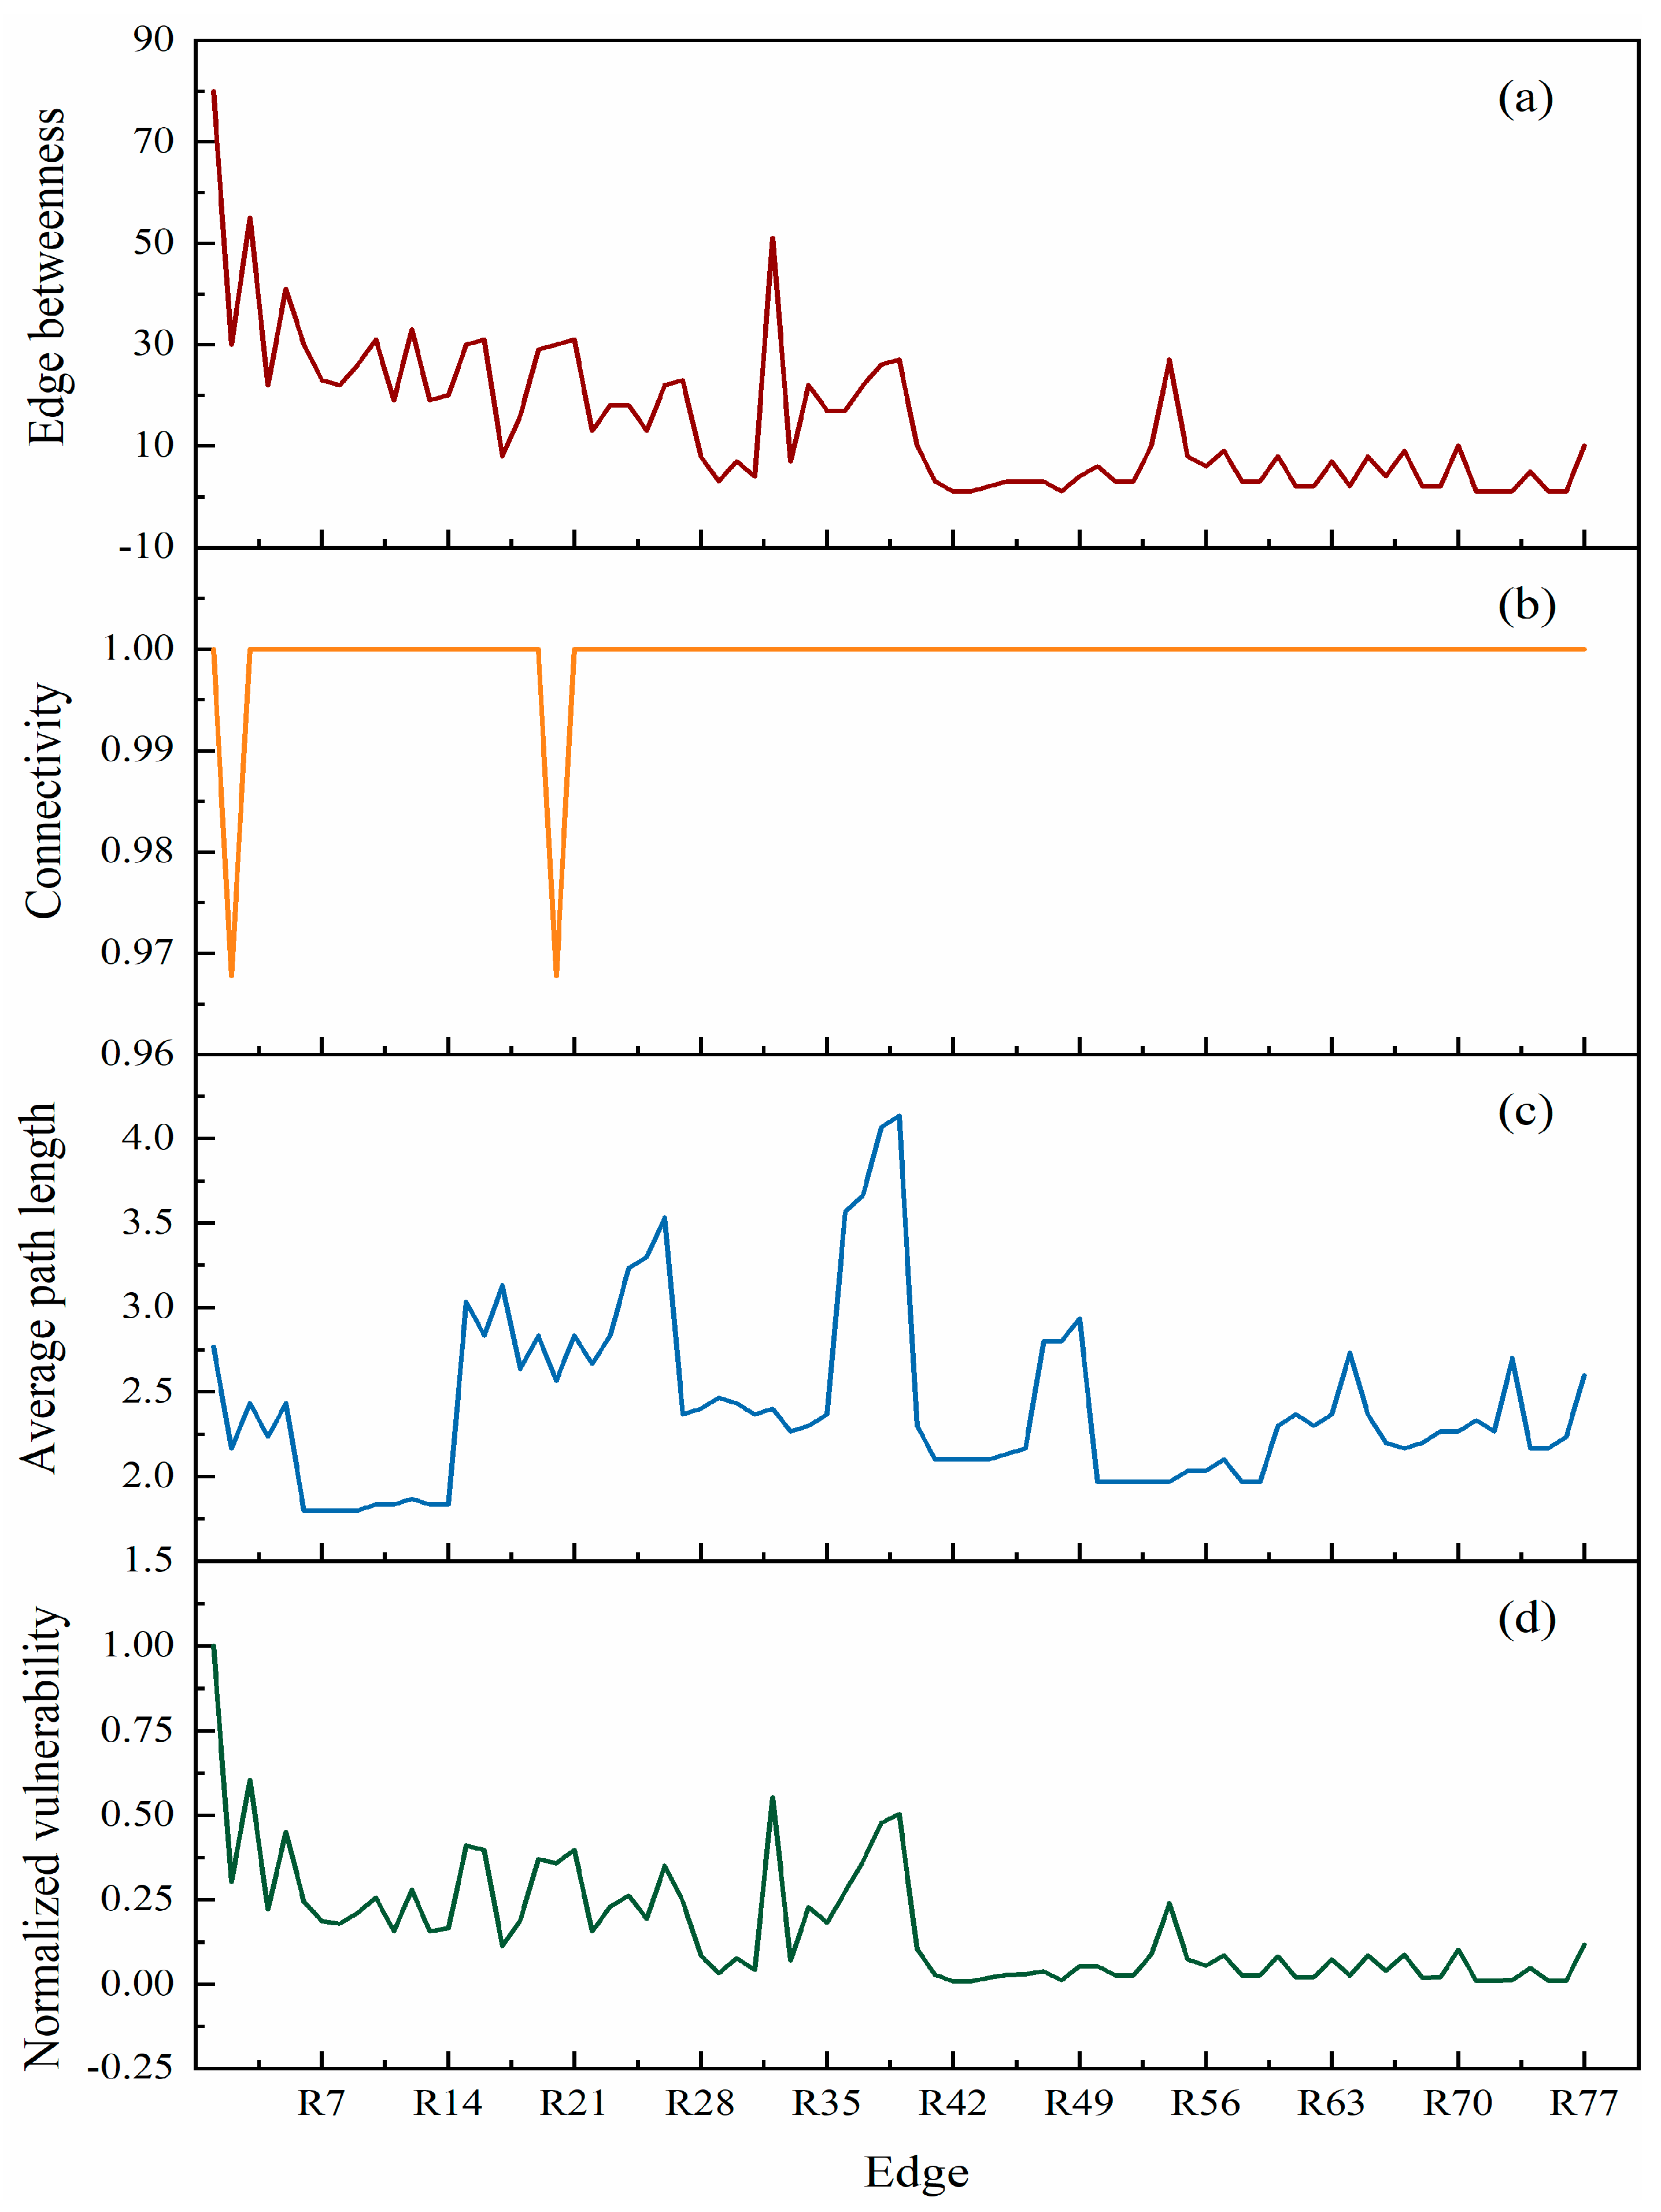
5.3. Vulnerability Analysis of Connected Edges of the Landslide Disaster Chain Network Model

(1) Edge betweenness B
Edge betweenness represents the count of shortest paths passing through an edge within a disaster chain network. It signifies the number of impacts from connected edges in the disaster chain network. A higher value indicates a more substantial influence of the edge on the structural resilience of the network [57,58].
B = i , j N U i j ( m )
Uij(m)—The number of paths between node Vi and node Vj passing through the connecting edge m.
(2) Connectivity H
Connectivity represents the proportion of nodes that a given node can connect to out of the total number of nodes. In the evolutionary network of the landslide disaster chain, removing one of the connecting edges reduces connectivity, causing certain hazardous events in the original disaster chain network to no longer occur, thereby decreasing systemic risk.
H = N i N
Ni—The number of nodes that can be connected from node Vi;
N—The total number of nodes in the disaster chain network.
(3) Average path length L
The average path length represents the distance from the current disaster event to other disaster events, offering insights into the speed of disaster evolution within the disaster chain network. When a connected edge is removed, if the network’s average path length becomes longer, it indicates the greater significance of that edge.
L = 2 N ( N 1 ) i , j N D i j
Dij—The number of connecting edges in the shortest path between nodes Vi and Vj;
N—Total number of nodes in the disaster chain network.
(4) Vulnerability of connecting edges W
The vulnerability of a connected edge pertains to the consequences of removing it from a disaster chain network and evaluating its influence on the overall network damage. This indicator serves as a comprehensive measure that effectively illustrates the network’s reliance on each connecting edge.
W i , j ϵ N   = B i j · L i j H i j
Bij—The edge betweenness number of hazards connecting edge ij;
Lij and Hij, respectively, represent the average path length and connectivity of the network after removing the connecting edge ij.
Through MATLAB programming, calculations were performed for the edge intermediary number, connectivity, average path length, and vulnerability of the connecting edges within the landslide disaster chain evolution network model. In the landslide hazard chain model, the boundary interface number reflects the influence of the connecting edge of two disasters in the whole network. Connectivity can be used to study the spread and flow of disaster information in the network so as to predict the spread speed and scope and provide a basis for disaster control and management. The average path length reflects the average distance between any two disaster events and is obtained by calculating the shortest path length of all node pairs in the network and taking the average value. Subsequently, the vulnerability was normalized, resulting in a value denoted as Wr, ranging from 0 to 1. The computed results for these various indicators are presented in Table 3.
According to the above analysis of the vulnerability of an edge in the network, we know that the greater the vulnerability of a certain side, the more vulnerable the edge. As can be seen from Formula (8), the vulnerability of an edge in the network is related to the interface number, connectivity, and average path length of the edge. From the above table, it can be seen that the value and vulnerability of each individual index (the number of edge interfaces, the connectivity degree, and the average path length) do not show a single corresponding co-increase or co-decrease relationship. For example, the vulnerability value of each edge in the network does not increase or decrease monotonically at the same time when combined with the number of edges, the connectivity degree, or the average disaster path length. In other words, it is necessary to combine these indicators to carry out a scientific and comprehensive analysis of the vulnerability of the edge. Among the five parameters, four parameters, including the edge intermediate number, connectivity, average path length, and normalized vulnerability, are selected as a line graph, and the results are shown in Figure 15.
Based on the findings presented in Table 3 and Figure 15, the following observations were made:
(1) The connecting edges R1, R3, and R5 exhibit significant edge betweenness values, measuring 80, 55, and 51, respectively. This suggests that these three edges have a substantial impact on the landslide disaster chain network. Conversely, connected edges like R42, R43, and R48 have an edge betweenness of 1, indicating t their limited influence on the overall network.
(2) The network’s connectivity remains high (0.97) when either R2 or R20 is removed, while the removal of other edges maintains a connectivity of 1. This indicates that the presence of the remaining 75 edges strengthens the resilience of the disaster chain network. The hazard associated with R2 and R20 in the evolution of the landslide disaster chain network exceeds that of the other 75 connecting edges. These two edges form isolated chain structures with no other derived connecting edges.
(3) When the connecting edge R39, R38, or R37 are removed, the average path length of the network increases to 4.13, 4.07, and 3.67, respectively. This suggests that cutting off these three edges can effectively slow down the chain reaction caused by disaster events, reduce the likelihood of subsequent disaster, and provide additional time for rescue and disaster mitigation efforts. Conversely, removing R6, R7, R8, or R9 result in the smallest average path length (1.80), indicating that the presence of these four edges has minimal impact on the landslide disaster chain.
(4) The edge R1 is identified as the most vulnerable, followed by R3, R32, R39, R38, R5, R15, R16, and R21, which also exhibit significant vulnerability. In contrast, R42 and R43 are considered the least vulnerable edges. Notably, R1, R3, R5, R15, R16, R21, and R32 can form a small disaster chain with centralized evolution (Figure 16). Consequently, this small disaster chain represents a vulnerable link within the landslide disaster chain network. It is important to note that the edges with high vulnerability can be categorized into two groups. The first group comprises edges concentrated at the beginning of the disaster chain, such as R1 and R3. The second group consists of edges concentrated at the incoming edges connected to the central nodes of the disaster chain, exemplified by R32, R39, and R38. These edges share the common characteristic of being associated with numerous nodes, and disrupting these edges can significantly impede the entire disaster chain network, thereby delaying or preventing the occurrence of multiple disaster nodes within the network.
In light of the vulnerable links within the western landslide disaster chain evolution network, timely disaster prevention actions can significantly reduce the overall risk associated with this network.
(1) High-precision remote sensing technology offers the potential to monitor mountain slope deformations before a landslide disaster occurs (V1). This proactive approach allows for early risk identification, in conjunction with expert evaluations, enabling the implementation of necessary technical measures to mitigate the risk.
(2) In the aftermath of a landslide catastrophe (V1), strategically placing barriers in high-risk and critical sections can intercept the downhill movement of landslide debris, reducing the subsequent destructive force of both the landslide (V1) and debris flow (V2). Concurrently, the establishment of drainage routes is essential to ensure the timely removal of landslide fluid, preventing river blockages (V4).
(3) To avert a flood disaster stemming from the dam failure (V12) of a barrier lake (V7), advance deployment of specialists for hazard assessments and the execution of measures, such as excavating drainage channels, is imperative. Alongside risk mitigation, dynamic monitoring, immediate control of on-site personnel, and the development of emergency plans for downstream high-risk areas are equally crucial.
(4) Post-incident, the swift transmission of disaster information aids in the execution of emergency repair work and the evacuation of individuals in vulnerable locations. Therefore, the western mountainous regions should expand their dynamic disaster monitoring capabilities, establish disaster prediction sites, and continually enhance contemporary disaster prevention and control information efforts.

6. Discussion

This study, centered on the Baige landslide, conducts a comprehensive review of two significant landslide events that occurred in 2018. It entails the collection of historical deformation data and secondary disaster events, culminating in the creation of an evolutionary network model for landslide disaster chains, employing principles from both disaster chain and complex network theory. This model is further analyzed using MATLAB and Gephi software, enabling an assessment of node importance and joint edge vulnerability. The results identify flood, debris flow, (secondary) landslides, and downstream water damage as key control nodes within the model, with vulnerable edges including land-slide–debris flow, landslide–river blocking, dam break–debris flow, among others. In order to effectively reduce the impact of secondary disasters caused by floods, it is necessary to strengthen the construction of flood disaster monitoring, river management, and the construction of water conservancy projects and early warning systems, as well as the construction of effective drainage systems.
Compared to conventional research that primarily focuses on single disaster types, this study represents an exploratory endeavor. Previous studies focused more on the formation mechanism and numerical simulation of a disaster, and a few people have carried out disaster inversion and risk assessment on the single-line disaster chain of landslides, debris flow, and barrier lakes. Few studies have explored the sequential relationship between all disaster events and the evolution of a disaster chain network for specific landslide disasters. In this paper, a chain network model of landslide disaster is established to identify the types of secondary disasters caused by the two landslides in Baige, which is expected to provide valuable insights for the prevention and management of landslide disasters in mountainous areas and provide a decision-making basis for putting forward targeted chain breaking schemes and control measures.

7. Conclusions

China’s mountainous regions, particularly in the western mountainous areas, feature complex terrain, geology, and geomorphology. This complexity contributes to landslide disasters and their associated secondary consequences, posing risks to the safety of residents and causing significant damage to local housing, transportation facilities, and infrastructure. In light of existing research on landslide disasters, this paper constructs a complex network model suitable for landslide disaster chains by drawing insights from accident chain literature and conducting relevant analyses. The specific tasks undertaken are as follows:
(1) Identification of Main Nodes and Chain Evolution in Landslide Hazard Chains: This paper examines the 2018 Jinsha River Baige landslide and considers other landslide cases in western China. It identifies the key nodes and relationships that govern the evolution of landslide hazard chains in this region. A network model is established to visualize this evolution.
(2) Risk Analysis of Landslide Hazard Evolution: Leveraging node access degrees and clustering coefficients, this study conducts a risk analysis of the landslide hazard evolution process. It identifies critical nodes in the model with higher impact, linked to economic losses resulting from floods, debris flows, secondary landslides, and downstream water damage. The network’s clustering coefficient (G = 0.061) suggests that throughout the entire landslide hazard chain’s risk evolution process, the “single node-single node” transmission relationship is significant. This implies that the final hazard can be effectively controlled by merely disrupting transmission between nodes.
(3) Edge Vulnerability Analysis and Chain Mitigation: Through an examination of the vulnerability of connected edges within the landslide hazard chain model, the study pinpoints edges most vulnerable to disruption. This includes connections such as landslide–debris flow, landslide–blocked river, dam failure–debris flow, and others. The identification of these vulnerable edges facilitates the extraction of smaller hazard chains from the broader network. This, in turn, informs the development of chain-breaking mitigation measures, such as pre-hazard monitoring and early warning systems, post-hazard interception strategies, and timely disaster information dissemination. These measures collectively contribute to a reduction in overall risk.
Through this study, we found that there remain certain issues to address in subsequent research. Firstly, considering the inherent complexity of the disaster system, there is room for improvement in the comprehensiveness and accuracy of the constructed models. Since the types of secondary disasters resulting from landslides and their severity, as well as their interrelationships, may vary between regions, the constructed landslide disaster chain may not be universally comprehensive and accurate. Secondly, the assignment of weights to connecting edges and the selection of an appropriate calculation method warrant consideration. These factors are closely linked to the accuracy of identifying the shortest path. Given the incomplete and sometimes insufficient accuracy of the acquired disaster-related data, the selection of the most suitable weights should fully account for the degree of correlation between parent and child nodes.

Author Contributions

Each author has contributed to this study. F.G. provided the research idea and plan. X.G. conducted the investigation, data curation, writing—original draft, and provided the funding acquisition. C.Y. assisted data curation and writing—review and editing. J.L. provided the funding acquisition. All authors have read and agreed to the published version of the manuscript.

Funding

This work was supported by the Fundamental Research Funds for the Central Universities of Central South University, China, (Grant No. 2022ZZTS0514) and the National Key Research and Development Program of China (Grant No. 2021YFC3090401).

Data Availability Statement

The raw data supporting the conclusions of this article will be made available by the authors on request.

Conflicts of Interest

The authors declare that they have no known competing financial interests or personal relationships that could have appeared to influence the work reported in this paper.

Abbreviations

VariablesMeaning
JiNode degree
CiNode degree centrality
GiClustering coefficient
GNetwork clustering coefficient
BEdge betweenness
HConnectivity
LAverage path length
WVulnerability of connecting edges

References

  1. Feng, M. The Theoretical and Applied Study on Topological Characteristics of Complex Networks; School of Computer Science: Chengdu, China, 2018. (In Chinese) [Google Scholar]
  2. Shang, Y.; Yang, Z.; Li, L.; Liu, D.; Liao, Q.; Wang, Y. A super-large landslide in Tibet in 2000: Background, occurrence, disaster, and origin. Geomorphology 2003, 54, 225–243. [Google Scholar] [CrossRef]
  3. Huang, R. Some catastrophic landslides since the twentieth century in the southwest of China. Landslides 2009, 6, 69–81. [Google Scholar]
  4. Chen, X.; Zhou, Q.; Ran, H.; Dong, R. Earthquake-triggered landslides in southwest China. Nat. Hazards Earth Syst. Sci. 2012, 12, 351–363. [Google Scholar] [CrossRef]
  5. Zhu, L.; Pei, X.; Cui, S.; Wang, S.; Zhang, X.; Liang, Y. On the initiation mechanism of the Daguangbao landslide triggered by the 2008 Wenchuan (Ms 7.9) earthquake. Soil Dyn. Earthq. Eng. 2020, 137, 106272. [Google Scholar]
  6. He, M.; Sousa, L.R.E.; Muller, A.; Vargas, E.; Sousa, R.L.; Oliveira, C.S.; Gong, W. Numerical and safety considerations about the Daguangbao landslide induced by the 2008 Wenchuan earthquake. J. Rock Mech. Geotech. Eng. 2019, 11, 1019–1035. [Google Scholar] [CrossRef]
  7. Yin, Y.; Wang, M.; Li, B.; Feng, Z. Dynamic response characteristics of Daguangbao landslide triggered by Wenchuan earthquake. Chin. J. Rock Mech. Eng. 2012, 31, 1969–1982. (In Chinese) [Google Scholar]
  8. Akgun, A.; Kmcal, C.; Pradhan, B. Application of remote sensing data and GIS for landslide risk assessment as an environmental threat to Izmir city (west Turkey). Environ. Monit. Assess. 2012, 184, 5453–5470. [Google Scholar] [CrossRef]
  9. Yao, X.; Tham, L.G.; Dai, F. Landslide susceptibility mapping based on support vector machine: A case study on natural slopes of Hong Kong, China. Geomorphology 2008, 101, 572–582. [Google Scholar] [CrossRef]
  10. Hasekiogullari, G.D.; Ercanoglu, M. A new approach to use AHP in landslide susceptibility mapping: A case study at Yenice (Karabuk, NW Turkey). Nat. Hazards 2012, 63, 1157–1179. [Google Scholar] [CrossRef]
  11. Mondal, S.; Maiti, R. Landslide susceptibility analysis of Shiv-Khola watershed, Darjiling: A remote sensing & GIS based analytical hierarchy process (AHP). J. Indian Soc. Remote Sens. 2012, 40, 483–496. [Google Scholar]
  12. Yin, Y.; Wang, W.; Zhang, N.; Yan, J.; Wei, Y. The June 2017 Maoxian landslide: Geological disaster in an earthquake area after the Wenchuan Ms 8.0 earthquake. Sci. China-Technol. Sci. 2017, 60, 1762–1766. [Google Scholar]
  13. Chen, H.; Ruan, H.; Chen, J.; Li, X.; Yu, Y. Review of Investigations on hazard Chains Triggered by River-Blocking Debris Flows and Dam-Break Floods. Front. Earth Sci. 2022, 10, 830044. [Google Scholar] [CrossRef]
  14. Dortch, J.M.; Owen, L.A.; Haneberg, W.C.; Caffee, M.W.; Dietsch, C.; Kamp, U. Nature and timing of large landslides in the Himalaya and Transhimalaya of northern India. Quat. Sci. Rev. 2009, 28, 1037–1054. [Google Scholar] [CrossRef]
  15. Guo, X.; Lai, Z.; Sun, Z.; Li, X.; Yang, T. Luminescence dating of Suozi landslide in the Upper Yellow River of the Qinghai-Tibetan Plateau, China. Quat. Int. 2014, 349, 159–166. [Google Scholar] [CrossRef]
  16. Zhou, J.; Xu, F.; Yang, X.; Yang, Y.; Lu, P. Comprehensive analyses of the initiation and landslide-generated wave processes of the 24 June 2015 Hongyanzi landslide at the Three Gorges Reservoir, China. Landslides 2016, 13, 589–601. [Google Scholar] [CrossRef]
  17. Liu, W.; Ju, N.; Zhang, Z.; Chen, Z.; He, S. Simulating the process of the Jinshajiang landslide-caused disaster chain in October 2018. Bull. Eng. Geol. Environ. 2020, 79, 2189–2199. [Google Scholar] [CrossRef]
  18. Ouyang, C.; Zhou, K.; Xu, Q.; Yin, J.; Peng, D.; Wang, D.; Li, W. Dynamic analysis and numerical modeling of the 2015 catastrophic landslide of the construction waste landfill at Guangming, Shenzhen, China. Landslides 2017, 14, 705–718. [Google Scholar] [CrossRef]
  19. Zhao, G.; Jiang, Y.; Qiao, J.; Yang, Z.; Ding, P. Numerical and experimental study on the formation mode of a landslide dam and its influence on dam breaching. Bull. Eng. Geol. Environ. 2019, 78, 2519–2533. [Google Scholar] [CrossRef]
  20. Amicarelli, A.; Kocak, B.; Sibilla, S.; Grabe, J. A 3D smoothed particle hydrodynamics model for erosional dam-break floods. Int. J. Comput. Fluid Dyn. 2017, 31, 413–434. [Google Scholar] [CrossRef]
  21. Liu, W.; He, S. Dynamic simulation of a mountain disaster chain: Landslides, barrier lakes, and outburst floods. Nat. Hazards 2016, 90, 757–775. [Google Scholar] [CrossRef]
  22. Du, Z.; Zhong, Q.; Mei, S.; Shan, Y. Risk assessment of dammed lakes in China based on Bayesian network. Nat. Hazards 2022, 115, 129–161. [Google Scholar] [CrossRef]
  23. Fei, C.; Sai, W.; Gao, Y.; Zhao, S.; Li, Z.; Ba, R.; Yang, Z.; Deng, J. Evolution of the cracking zones at the site of the Baige landslides and their future development. Adv. Eng. Sci. 2020, 52, 71–78. (In Chinese) [Google Scholar]
  24. Zhou, L.; Fan, X.; Xu, Q.; Yang, F.; Guo, C. Numerical simulation and hazard predication on movement process characteristics of Baige landslide in Jinsha river. J. Eng. Geol. 2019, 27, 1395–1404. (In Chinese) [Google Scholar]
  25. Zhao, C.; Jiang, L.; Li, X.; Luo, S.; Li, J. Sliding Features of “10.11” Large-Scale Landslide in Jinsha River Based on DEM. J. Shenyang Univ. 2019, 31, 324–330. (In Chinese) [Google Scholar]
  26. Peng, S.; Xu, Q.; Zheng, G.; Li, H.; Chen, D.; Du, P. Recognition and analysis of deposit body grain of Baige landslide-debris flow. Water Resour. Hydropower Eng. 2020, 51, 144–154. (In Chinese) [Google Scholar]
  27. Wang, L.; Duan, Q.; Liu, L.; Cai, S.; Sun, P. Analysis of key engineering measures for barrier lakes: Taking the “11.03” Baige Barrier Lake in 2018 as an example. J. Water Resour. Water Eng. 2020, 31, 135–141. (In Chinese) [Google Scholar]
  28. Meng, T.; Xu, X.; Liu, H. Landslide risk assessment in high altitude areas based onslope unit optimization: Taking the Baige landslide in Jinsha River as an example. J. Henan Polytech. Univ. 2021, 40, 65–73. (In Chinese) [Google Scholar]
  29. Fan, X.; Yang, F.; Subramanian, S.S.; Xu, Q.; Feng, Z.; Mavrouli, O.; Peng, M.; Ouyang, C.; Jansen, J.D.; Huang, R. Prediction of a multi-hazard chain by an integrated numerical simulation approach: The Baige landslide, Jinsha River, China. Landslides 2019, 17, 147–164. [Google Scholar] [CrossRef]
  30. Travers, J.; Milgram, S. The small world problem. Psychol. Today 1967, 1, 61–67. [Google Scholar]
  31. Watts, D.; Strogatz, S. Collective dynamics of ‘small-world’ networks. Nature 1998, 393, 440. [Google Scholar] [CrossRef]
  32. Newman, M.; Watts, D. Renormalization group analysis of the small-world network model. Phys. Lett. A 1999, 263, 341–346. [Google Scholar] [CrossRef]
  33. Barabási, A.; Albert, R. Emergence of scaling in random networks. Science 1999, 286, 509–512. [Google Scholar] [CrossRef] [PubMed]
  34. Yao, Y.; Jiang, L.; Xiao, H.; Deng, B.; Zhang, M.; Zhang, Y.; Yang, H.; Lyu, J. Restart-up Performance of a CFB Boiler after a Sudden Power Failure Accident. J. Therm. Sci. 2022, 31, 830–839. [Google Scholar] [CrossRef]
  35. Chen, H.; Zhang, L.; Ran, L. Vulnerability modeling and assessment in urban transit systems considering disaster chains: A weighted complex network approach. Int. J. Disaster Risk Reduct. 2021, 54, 102033. [Google Scholar] [CrossRef]
  36. Sugishita, K.; Asakura, Y. Vulnerability studies in the fields of transportation and complex networks: A citation network analysis. Public Transp. 2020, 13, 1–34. [Google Scholar] [CrossRef]
  37. Zhang, Z.; Yao, H.; Feng, B.; Peng, X.; Ding, C. The Biological Application of Synchronization Ability of Different Complex Network Structures. Adv. Mater. Res. 2014, 846–847, 1252. [Google Scholar]
  38. Wu, L.; Li, M.; Wang, J.; Wu, F. Controllability and its applications to biological networks. J. Comput. Sci. Technol. 2019, 34, 16–34. [Google Scholar] [CrossRef]
  39. Liu, X. Application of the complex network in traditional industry. In Proceedings of the 5th International Conference on Intelligent Systems Design and Engineering Applications (ISDEA), Zhangjiajie, China, 15–16 June 2014; pp. 230–233. [Google Scholar]
  40. Liu, C.; Arunkumar, N. Risk prediction and evaluation of transnational transmission of financial crisis based on complex network. Clust. Comput.-J. Netw. Softw. Tools Appl. 2019, 22, S4307–S4313. [Google Scholar]
  41. Wu, Y.; Ma, H. Logistics network nodes importance analysis based on the complex network theory. In Proceedings of the 2nd International Conference on Measurement, Instrumentation and Automation (ICMIA 2013), Guilin, China, 23–24 April 2013; Volume 2013, p. 2410. [Google Scholar]
  42. Mattsson, L.G.; Jenelius, E. Vulnerability and resilience of transport systems–A discussion of recent research. Transp. Res. Part A-Policy Pract. 2015, 81, 16–34. [Google Scholar]
  43. Du, G. Development Characteristics and Hazard Assessment of Landslide in the Eastern Himalayan Syntaxis Region of Tibetan Plateau; Chinese Academy of Geological Sciences: Beijing, China, 2017. (In Chinese) [Google Scholar]
  44. Wang, X.; Che, G. Complex networks: Small-world, scale-free and beyond. IEEE Circuits Syst. 2003, 3, 6–20. [Google Scholar] [CrossRef]
  45. Deng, J.; Chen, F.; Zhao, S.; Zhang, X. Disaster Investigation of Baige Landslide; Science Press: Beijing, China, 2021. (In Chinese) [Google Scholar]
  46. Deng, J.; Dai, F.; Wen, B.; Yao, X. Investigation on the catastrophic mechanism and risk control measures of major landslides in Tibetan Plateau. Adv. Eng. Sci. 2019, 51, 1–8. (In Chinese) [Google Scholar]
  47. Li, J.; Cao, Z.; Cui, Y.; Fan, X.; Yang, W.; Huang, W.; Borthwick, A. Hydro-sediment-morpho dynamic processes of the Baige landslide-induced barrier Lake, Jinsha River, China. J. Hydrol. 2021, 596, 126134. [Google Scholar] [CrossRef]
  48. Li, W.; Xu, Q.; Lu, H.; Dong, X.; Zhu, Y. Tracking the deformation history of large-scale rocky landslides and its enlightenment. Geomat. Inf. Sci. Wuhan Univ. 2019, 44, 1043–1053. (In Chinese) [Google Scholar]
  49. Huang, N.; Shen, Z.; Long, S.; Wu, M.C.; Shih, H.H.; Zheng, Q.; Yen, N.-C.; Tung, C.C.; Liu, H.H. The empirical mode decomposition and the Hilbert spectrum for nonlinear and nonstationary time series analysis. Proc. A 1998, 454, 903–995. [Google Scholar]
  50. Zhang, X.; Xue, R.; Wang, M.; Yu, Z.; Li, B.; Wang, B. Field Investigation and Analysis on Flood Disasters due to Baige Landslide Dam Break in Jinsha River. Adv. Eng. Sci. 2020, 52, 89–100. (In Chinese) [Google Scholar]
  51. Xiao, S. Catastrophe Chain Evolution Tracking Technique; Science Press: Beijing, China, 2011. (In Chinese) [Google Scholar]
  52. Gao, F.; Tan, X. Evolution model and risk analysis of urban haze disaster chain. Sci. Technol. Rev. 2018, 36, 73–81. [Google Scholar]
  53. Meng, Y.; Tian, X.; Li, Z.; Zhou, W.; Zhou, Z.; Zhong, M. Comparison analysis on complex topological network models of urban rail transit: A case study of Shenzhen Metro in China. Phys. A-Stat. Mech. ITS Appl. 2020, 559, 125031. [Google Scholar]
  54. Guo, C.; Chen, H.; Wang, G.; Liu, S. Node importance ranking based on complex network. J. Inf. Eng. Univ. 2021, 22, 313–320+358. (In Chinese) [Google Scholar]
  55. Chen, C.; Sun, F.; Zhao, D. Risk analysis of urban infrastructure facilities accident evolution under rainstorm disaster. J. Catastrophology 2022, 37, 12–16+28. [Google Scholar]
  56. Luo, J.; Lin, X.; Mu, F.; Li, H.; Zhang, L. Static risk analysis on rainstorm-agricultural disaster chain in mountainous areas based on complex network. China Saf. Sci. J. 2020, 30, 163–170. (In Chinese) [Google Scholar]
  57. Wang, Y. Research on the Key Issues of Quantitative Representation of Urban Rail Transit Disaster Chain Network; Beijing Jiaotong University: Beijing, China, 2017. (In Chinese) [Google Scholar]
  58. Li, H.; Wang, Z.; Yang, Q.; Zhang, Y.; Ouyang, Z. Evolutionary model and risk analysis of metro disaster chain under complex network. China Saf. Sci. J. 2021, 31, 141–147. (In Chinese) [Google Scholar]
Figure 1. Location diagram of Baige landslide.
Applsci 14 00499 g001
Figure 2. Timeline of the Baige landslide.
Applsci 14 00499 g002
Figure 3. The Baige landslide after partial clearing [46].
Applsci 14 00499 g003
Figure 4. Road deformation and deformation map for the Baige landslide from 2011 to 28 February 2018 [47].
Applsci 14 00499 g004
Figure 5. Typical disasters caused by the Baige landslide. (a) River blockage. (b) Burst flood. (c) Submerged farmland. (d) Washed the road. (e) Bridge washout. (f) Damaged hydropower station [50].
Applsci 14 00499 g005aApplsci 14 00499 g005b
Figure 6. Cascading landslide disaster chain.
Applsci 14 00499 g006
Figure 7. Dispersed landslide disaster chain.
Applsci 14 00499 g007
Figure 8. Centralized landslide disaster chain.
Applsci 14 00499 g008
Figure 9. Shuttle landslide disaster chain.
Applsci 14 00499 g009
Figure 10. Evolution network model of the landslide disaster chain. (Note: Due to the prompt evacuation of personnel, no casualties resulted on Baige slope. However, given that other landslides could potentially result in casualties, the dotted line is employed to denote the connecting line of events related to casualties in the model).
Applsci 14 00499 g010
Figure 11. Adjacency matrix of disaster events in a landslide disaster chain.
Applsci 14 00499 g011
Figure 12. Complex network topology of the landslide disaster chain.
Applsci 14 00499 g012
Figure 13. Degree of landslide disaster events.
Applsci 14 00499 g013
Figure 14. Node degree centrality and cluster coefficient of landslide disaster events.
Applsci 14 00499 g014
Figure 15. Parameters at the connecting edge of the landslide disaster chain evolution network. (a) Edge betweenness. (b) Connectivity. (c) Average path length. (d) Normalized vulnerability.
Applsci 14 00499 g015
Figure 16. Vulnerable links in the landslide disaster chain evolution network.
Applsci 14 00499 g016
Table 1. Division of historical development stages of the Baige landslide.
TimeDeformation StageStage Characteristics
–1996Stable stateThere is no obvious deformation on the slope surface [49].
1996–2011Obvious deformationThe shallow soil mass in the main sliding area is subject to creep deformation, local collapse, settlement grooves at the top of the trailing edge, and obviously discontinuous tension cracks.
2011–2015Uniform deformationSettlement deformation and collapse deformation are the main ones. The tension cracks at the back edge are basically connected. The rear edge of the main sliding area creeps and slips downward, forming a platform sill at the back. The tension cracks at the back edge gradually expand and connect, and the collapse deformation areas are further developed.
2015–2017Accelerated deformationCollapse deformation intensifies, and all deformation areas are connected and merged. The tension crack at the rear edge of the landslide is deepened and widened under the effect of rainfall, the tension crack surface is continuously penetrated downward, and the front slope of the main sliding area swells, causing the front edge terrain to become steeper and the sliding force of some rock and soil mass to increase, aggravating the collapse deformation in the middle of the landslide.
2017–2018/2019Secondary accelerated deformationDeformation areas are basically merged. The landslide deformation tends to be whole, and the landslide enters a sliding state.
Table 2. Risk evolution disaster events of landslide disaster chain.
NodeDisaster EventNodeDisaster EventNodeDisaster Event
V1LandslideV12Dam breakV23Farmland destruction
V2Debris flowV13OverflowV24Plague/infectious disease
V3MicroseismV14Bank collapseV25Industrial/enterprise shutdown
V4Blocking the riverV15Water supply accidentV26Shipping accident
V5Beach riskV16Crop yield reductionV27Livestock industry suffers
V6SwellV17Secondary landslideV28Bridge washout
V7Barrier lakeV18BackwaterV29Destroy water conservancy facilities
V8CutoffV19floodV30Economic loss
V9Washed vegetationV20Road damageV31Casualties
V10Downstream water hazardV21Electrical disruption
V11Damaged soil surfaceV22House destruction
Table 3. Vulnerability of connection edge of evolution network of landslide disaster chain.
RiBi−jHi−jLi−jWi−jWrRiBi−jHi−jLi−jWi−jWr
R1(V1-V2)8012.77221.331.00R40(V17-V2)1012.3023.000.10
R2(V1-V3)300.972.1767.170.30R41(V17-V20)312.106.300.03
R3(V1-V4)5512.43133.830.60R42(V17-V21)112.102.100.01
R4(V1-V5)2212.2349.130.22R43(V17-V22)112.102.100.01
R5(V1-V6)4112.4399.770.45R44(V17-V23)212.104.200.02
R6(V2-V20)3011.8054.000.24R45(V17-V25)312.136.400.03
R7(V2-V21)2311.8041.400.19R46(V17-V27)312.176.500.03
R8(V2-V22)2211.8039.600.18R47(V18-V20)312.808.400.04
R9(V2-V23)2611.8046.800.21R48(V18-V22)112.802.800.01
R10(V2-V25)3111.8356.830.26R49(V18-V28)412.9311.730.05
R11(V2-V26)1911.8334.830.16R50(V19-V20)611.9711.800.05
R12(V2-V27)3311.8761.600.28R51(V19-V21)311.975.900.03
R13(V2-V28)1911.8334.830.16R52(V19-V22)311.975.900.03
R14(V2-V29)2011.8336.670.17R53(V19-V23)1011.9719.670.09
R15(V4-V7)3013.0391.000.41R54(V19-V24)2711.9753.100.24
R16(V4-V8)3112.8387.830.40R55(V19-V25)812.0316.270.07
R17(V5-V26)813.1325.070.11R56(V19-V26)612.0312.200.06
R18(V6-V9)1612.6342.130.19R57(V19-V27)912.1018.900.09
R19(V6-V10)2912.8382.170.37R58(V19-V28)311.975.900.03
R20(V6-V11)300.972.5779.570.36R59(V19-V29)311.975.900.03
R21(V7-V12)3112.8387.830.40R60(V20-V30)812.3018.400.08
R22(V7-V13)1312.6734.670.16R61(V21-V30)212.374.730.02
R23(V7-V14)1812.8351.000.23R62(V22-V30)212.734.600.02
R24(V8-V15)1813.2358.200.26R63(V23-V30)712.3716.570.07
R25(V8-V16)1313.3042.900.19R64(V24-V30)212.205.470.02
R26(V9-V27)2213.5377.730.35R65(V25-V30)812.1718.930.09
R27(V10-V23)2312.3754.430.25R66(V26-V30)412.208.800.04
R28(V10-V26)812.4019.200.09R67(V27-V30)912.1719.500.09
R29(V10-V27)312.477.400.03R68(V28-V30)212.204.400.02
R30(V10-V28)712.4317.030.08R69(V29-V30)212.274.530.02
R31(V10-V29)412.379.470.04R70(V20-V31)1012.2722.670.10
R32(V12-V2)5112.40122.400.55R71(V21-V31)112.332.330.01
R33(V12-V17)712.2715.870.07R72(V22-V31)112.272.270.01
R34(V12-V18)2212.3050.600.23R73(V24-V31)112.702.700.01
R35(V12-V19)1712.3740.230.18R74(V26-V31)512.1710.830.05
R36(V13-V19)1713.5760.630.27R75(V28-V31)112.172.170.01
R37(V14-V30)2213.6780.670.36R76(V29-V31)112.232.230.01
R38(V15-V25)2614.07105.730.48R77(V31-V30)1012.6026.000.12
R39(V16-V27)2714.13111.600.50
Disclaimer/Publisher’s Note: The statements, opinions and data contained in all publications are solely those of the individual author(s) and contributor(s) and not of MDPI and/or the editor(s). MDPI and/or the editor(s) disclaim responsibility for any injury to people or property resulting from any ideas, methods, instructions or products referred to in the content.

