Identifying High-Risk Patterns in Single-Vehicle, Single-Occupant Road Traffic Accidents: A Novel Pattern Recognition Approach
Abstract
1. Introduction
1.1. Relevance and Problem Statement
1.2. Literature Review
1.3. Research Question and Scope
2. Methods
2.1. Data Preparation for Pattern Recognition
2.2. Accident-Related Variables
- Casualties: minor injury, severe injury, death at accident site, death within 30 days,
- Severe casualties: severe injury, death at accident site, death within 30 days.
2.3. Descriptive Analyses
- is the binomial coefficient, calculated as ,
- is the binomial coefficient for the second row,
- is the binomial coefficient for the total table, where .
2.4. Binomial Logistic Regression
- is the probability of the outcome being severe casualty,
- is the probability of the outcome being a non-severe casualty,
- is the log-odds of the outcome occurring (severe casualties),
- is the intercept term, representing the log-odds of severe casualties when all predictors are zero,
- are coefficients associated with each accident-related predictor variable, . These coefficients indicate the strength and direction of the relationship between each variable and the likelihood of severe casualties.
2.5. PATTERMAX Method
- is the number of entries in the dataset ,
- is the number of binary variables in each entry,
- represents the i-th entry in the dataset ,
- is the position in the entry where the is checked,
- is an indicator function that returns 1 if the substring exactly matches from position to , and 0 otherwise.
2.6. Blackpattern Impact Analysis
- represents the logistic regression coefficient for each variable in the ,
- is the frequency of the ,
- is the phi coefficient, which measures the strength of the association between the and the outcome,
- is the -value from Fisher’s exact test, indicating the statistical significance of the association between the and the outcome.
3. Results
3.1. Descriptive Analyses Results
3.2. Logistic Regression Analysis Results
3.3. PATTERMAX Method Results
3.4. Blackpattern Impact Analysis Results
4. Discussion
5. Conclusions
Author Contributions
Funding
Institutional Review Board Statement
Informed Consent Statement
Data Availability Statement
Conflicts of Interest
Appendix A. Descriptive Analysis Results
| Variable | Casualties n | Severe Casualties n | P (X ∩ SC) % | Fisher’s Exact Test p | Phi Coefficient ϕ | MCV n | |
|---|---|---|---|---|---|---|---|
| Sex | Male | 11,576 | 2458 | 12.11% | 0.000 | 0.133 | 817 |
| Female | 8706 | 972 | 4.79% | 0.000 | −0.133 | 1.132 | |
| Unknown sex | 11 | 1 | - | - | - | - | |
| Age class | 16 to 18 years | 1465 | 162 | 0.80% | 0.000 | −0.044 | 171 |
| 19 to 24 years | 6547 | 806 | 3.97% | 0.000 | −0.085 | 1.132 | |
| 25 to 34 years | 4323 | 697 | 3.43% | 0.120 | −0.011 | 830 | |
| 35 to 44 years | 2488 | 468 | 2.31% | 0.008 | 0.019 | 432 | |
| 45 to 54 years | 2180 | 476 | 2.35% | 0.000 | 0.046 | 382 | |
| 55 to 64 years | 1404 | 323 | 1.59% | 0.000 | 0.044 | 212 | |
| 64 and older | 1878 | 499 | 2.46% | 0.000 | 0.082 | 303 | |
| Unknown age class | 8 | - | - | - | - | - | |
| * DL | No driving licence | 356 | 94 | 0.46% | 0.020 | 0.034 | 15 |
| Probationary driving licence | 2805 | 303 | 1.49% | 0.000 | −0.065 | 391 | |
| Impairment | Alcohol | 2858 | 481 | 2.37% | 0.934 | −0.001 | 246 |
| Distraction | 2369 | 431 | 2.12% | 0.079 | 0.012 | 93 | |
| Fatigue | 1518 | 317 | 1.56% | 0.000 | 0.030 | 134 | |
| Health | 432 | 91 | 0.45% | 0.021 | 0.016 | 38 | |
| Drugs | 66 | 15 | 0.07% | 0.247 | 0.009 | 3 | |
| Medicines | 50 | 10 | 0.05% | 0.570 | 0.004 | 2 | |
| Excitation | 7 | 2 | 0.01% | 0.337 | 0.006 | 1 | |
| Driving manoeuvres | Speeding | 3608 | 579 | 2.85% | 0.136 | −0.011 | 131 |
| Skidding | 1823 | 239 | 1.18% | 0.000 | −0.032 | 80 | |
| Hitting an obstacle next to road | 1512 | 280 | 1.38% | 0.086 | 0.012 | 35 | |
| Hitting the guardrail | 1378 | 181 | 0.89% | 0.000 | −0.027 | 37 | |
| Hitting a tree | 1217 | 318 | 1.57% | 0.000 | 0.062 | 23 | |
| Misconduct by pedestrians | 503 | 79 | 0.39% | 0.505 | −0.005 | 12 | |
| Hit and run | 371 | 53 | 0.26% | 0.186 | −0.010 | 22 | |
| Sudden braking | 149 | 11 | 0.05% | 0.002 | −0.022 | 9 | |
| Overtaking | 147 | 26 | 0.13% | 0.834 | 0.002 | 8 | |
| Cutting curves | 128 | 27 | 0.13% | 0.194 | 0.009 | 4 | |
| Hitting an obstacle on the road | 117 | 6 | 0.03% | 0.001 | −0.024 | 7 | |
| Changing lanes | 58 | 9 | 0.04% | 1.000 | −0.002 | 3 | |
| Inadequate safety distance | 38 | 7 | 0.03% | 0.828 | 0.002 | 1 | |
| Reverse driving | 26 | 6 | 0.03% | 0.429 | 0.006 | 2 | |
| Phoning | 25 | 7 | 0.03% | 0.175 | 0.010 | 1 | |
| Turning around | 22 | 4 | 0.02% | 0.780 | 0.001 | 3 | |
| Fall from the vehicle | 22 | 11 | 0.05% | 0.000 | 0.029 | 2 | |
| Getting in lane | 18 | 4 | 0.02% | 0.529 | 0.004 | 1 | |
| Disregarding driving direction | 16 | 2 | 0.01% | 1.000 | −0.003 | 1 | |
| Priority violation | 15 | 4 | 0.02% | 0.302 | 0.007 | 1 | |
| Driving towards left-hand side of road | 9 | 3 | 0.01% | 0.184 | 0.009 | 1 | |
| Forbidden overtaking | 8 | 2 | 0.01% | 0.630 | 0.004 | 1 | |
| Hitting a moving vehicle | 8 | 0 | 0.00% | 0.367 | −0.009 | 2 | |
| Disregarding driving ban | 5 | 2 | 0.01% | 0.201 | 0.010 | 1 | |
| Driving in parallel | 5 | 1 | 0.00% | 1.000 | 0.604 | 1 | |
| Opening the vehicle door | 5 | 2 | 0.01% | 0.201 | 0.010 | 1 | |
| Hitting a stationary vehicle | 3 | 0 | 0.00% | 1.000 | −0.005 | 1 | |
| Wrong-way driver | 1 | 0 | 0.00% | 1.000 | −0.003 | 1 | |
| Disregarding red light | 1 | 0 | 0.00% | 1.000 | −0.003 | 1 | |
| Dangerous stopping and parking | 0 | 0 | - | - | - | - | |
| Disregarding turning ban | 0 | 0 | - | - | - | - | |
| Missing indication of direction change | 0 | 0 | - | - | - | - | |
| Driving against one-way | 0 | 0 | - | - | - | - | |
| ** ST | Driving without mandatory light | 0 | 0 | - | - | - | - |
| No safety belt applied | 1401 | 699 | 3.44% | 0.000 | 0.240 | 60 |
| Variable | Casualties n | Severe Casualties n | P (X ∩ SC) % | Fisher’s Exact Test p | Phi Coefficient ϕ | MCV n | |
|---|---|---|---|---|---|---|---|
| Engine power (kW) | 0–24 kW | 11 | 3 | 0.01% | 0.411 | 0.006 | 2 |
| 24–90 kW | 15,412 | 2.393 | 11.79% | 0.000 | −0.066 | 975 | |
| 90–110 | 1928 | 413 | 2.04% | 0.000 | 0.039 | 201 | |
| 110+ | 1947 | 448 | 2.21% | 0.000 | 0.053 | 256 | |
| Kilometrage (km) | 0 to 15.000 | 156 | 24 | 0.12% | 0.662 | −0.004 | 13 |
| 15.000 to 75.000 | 605 | 89 | 0.44% | 0.154 | −0.010 | 51 | |
| 75.000 to 100.000 | 387 | 70 | 0.34% | 0.541 | .004 | 33 | |
| 100.000 to 150.000 | 663 | 104 | 0.51% | 0.428 | −0.006 | 44 | |
| 150.000 to 200.000 | 942 | 176 | 0.87% | 0.141 | 0.010 | 56 | |
| Vehicle colour | Beige | 18 | 3 | 0.01% | 1.000 | 0.000 | 5 |
| Blue | 3166 | 478 | 2.36% | 0.003 | −0.021 | 868 | |
| Brown | 193 | 35 | 0.17% | 0.637 | 0.003 | 52 | |
| Bronze | 1 | 0 | 0.00% | 1.000 | −0.003 | 1 | |
| Dark | 30 | 6 | 0.03% | 0.626 | 0.003 | 6 | |
| Yellow | 129 | 18 | 0.09% | 0.408 | −0.006 | 37 | |
| Gold | 18 | 3 | 0.01% | 1.000 | 0.000 | 5 | |
| Grey | 2702 | 462 | 2.28% | 0.784 | 0.002 | 770 | |
| Green | 1219 | 262 | 1.29% | 0.000 | 0.031 | 281 | |
| Bright | 8 | 2 | 0.01% | 0.630 | 0.004 | 2 | |
| Orange | 130 | 24 | 0.12% | 0.647 | 0.003 | 41 | |
| Red | 2272 | 381 | 1.88% | 0.857 | −0.001 | 602 | |
| Black | 3981 | 652 | 3.21% | 0.334 | −0.007 | 958 | |
| Silver | 716 | 136 | 0.67% | 0.127 | 0.011 | 146 | |
| Purple | 49 | 8 | 0.04% | 1.000 | −0.001 | 11 | |
| White | 1907 | 323 | 1.59% | 0.977 | 0.000 | 497 | |
| Others | 1 | 1 | 0.00% | 0.169 | 0.016 | 1 | |
| Vehicle safety | Insufficient vehicle security | 16 | 6 | 0.03% | 0.040 | 0.015 | 2 |
| Insufficient load securing | 6 | 0 | 0.00% | 0.598 | −0.008 | 1 | |
| Technical defects | 102 | 15 | 0.07% | 0.682 | −0.004 | 6 | |
| Vehicle fire | 18 | 11 | 0.05% | 0.000 | 0.035 | 1 | |
| Airbag not deployed | 8.138 | 819 | 4.04% | 0.000 | −0.149 | 975 |
| Variable | Casualties n | Severe Casualties n | P (X ∩ SC) % | Fisher’s Exact Test p | Phi Coefficient ϕ | MCV n | |
|---|---|---|---|---|---|---|---|
| Speed limit (km/h) | Driving ban | 2270 | 380 | 1.87% | 0.833 | −0.002 | 350 |
| 5 | 1 | 1 | 0.00% | 0.169 | 0.016 | 1 | |
| 10 | 1 | 0 | 0.00% | 1.000 | −0.003 | 1 | |
| 20 | 2 | 0 | 0.00% | 1.000 | −0.004 | 1 | |
| 30 | 173 | 33 | 0.16% | 0.479 | 0.005 | 13 | |
| 40 | 40 | 8 | 0.04% | 0.533 | 0.004 | 6 | |
| 50 | 505 | 71 | 0.35% | 0.095 | −0.012 | 56 | |
| 60 | 334 | 55 | 0.27% | 0.877 | −0.002 | 43 | |
| 70 | 1421 | 218 | 1.07% | 0.108 | −0.011 | 321 | |
| 80 | 1231 | 192 | 0.95% | 0.225 | −0.009 | 222 | |
| 90 | 3 | 0 | 0.00% | 1.000 | −0.005 | 1 | |
| 100 | 12,292 | 2148 | 10.58% | 0.008 | 0.019 | 2.232 | |
| 110 | 35 | 4 | 0.02% | 0.502 | −0.006 | 10 | |
| 120 | 2 | 0 | 0.00% | 1.000 | −0.004 | 1 | |
| 130 | 1983 | 321 | 1.58% | 0.377 | −0.006 | 488 | |
| Road type | Highway | 2593 | 417 | 2.05% | 0.239 | −0.008 | 488 |
| Expressway | 595 | 80 | 0.39% | 0.024 | −0.016 | 82 | |
| Country road | 14,457 | 2416 | 11.91% | 0.247 | −0.008 | 2.232 | |
| Other roads | 2220 | 463 | 2.28% | 0.000 | 0.037 | 248 | |
| Intersection | 439 | 62 | 0.31% | 0.125 | −0.011 | 62 | |
| Roundabout | 68 | 16 | 0.08% | 0.146 | 0.010 | 11 | |
| Road characteristics | Deceleration lane | 10 | 2 | 0.01% | 0.681 | 0.002 | 1 |
| Acceleration lane | 3 | 1 | 0.00% | 0.426 | 0.005 | 1 | |
| One-way | 144 | 33 | 0.16% | 0.054 | 0.014 | 26 | |
| Construction site | 157 | 21 | 0.10% | 0.286 | −0.008 | 10 | |
| Cycle path | 4 | 0 | 0.00% | 1.000 | −0.006 | 1 | |
| Crosswalk | 3 | 0 | 0.00% | 1.000 | −0.006 | 1 | |
| Pedestrian and cycle path | 10 | 2 | 0.01% | 0.681 | 0.002 | 3 | |
| Parking lane | 7 | 0 | 0.00% | 0.610 | −0.008 | 1 | |
| Secondary lane | 5 | 1 | 0.00% | 1.000 | 0.001 | 1 | |
| Hard shoulder | 45 | 9 | 0.04% | 0.551 | 0.004 | 7 | |
| Banquet | 123 | 22 | 0.11% | 0.729 | 0.002 | 22 | |
| Straight road | 11,507 | 2095 | 10.32% | 0.000 | 0.040 | 2.232 | |
| Tunnel | 89 | 26 | 0.13% | 0.004 | 0.022 | 8 | |
| Gallery | 15 | 8 | 0.04% | 0.001 | 0.026 | 1 | |
| Rest area | 26 | 6 | 0.03% | 0.429 | 0.006 | 2 | |
| Traffic island | 81 | 18 | 0.09% | 0.233 | 0.009 | 4 | |
| Underpass | 32 | 7 | 0.03% | 0.476 | 0.005 | 3 | |
| Middle separation | 777 | 104 | 0.51% | 0.008 | −0.019 | 137 | |
| Bridge | 157 | 41 | 0.20% | 0.003 | 0.022 | 7 | |
| Curve | 8.399 | 1264 | 6.23% | 0.000 | −0.042 | 1.437 | |
| Narrow lane | 30 | 8 | 0.04% | 0.149 | 0.010 | 3 | |
| Entry or exit | 57 | 17 | 0.08% | 0.019 | 0.018 | 5 | |
| Tram or bus station | 8 | 2 | 0.01% | 0.630 | 0.004 | 1 | |
| Road condition | Dry road | 10,441 | 2126 | 10.48% | 0.000 | 0.095 | 2.232 |
| Wet road | 5705 | 872 | 4.30% | 0.000 | −0.27 | 1.225 | |
| Sand or grit on the road | 297 | 48 | 0.24% | 0.809 | −0.002 | 56 | |
| Wintry conditions | 3771 | 370 | 1.82% | 0.000 | −0.090 | 938 | |
| Other conditions (oil, soil) | 95 | 17 | 0.08% | 0.796 | 0.002 | 16 | |
| TL * | Traffic light in full operation | 29 | 2 | 0.01% | 0.213 | −0.010 | 4 |
| Variable | Casualties n | Severe Casualties n | P (X ∩ SC) % | Fisher’s Exact Test p | Phi Coefficient ϕ | MCV n | |
|---|---|---|---|---|---|---|---|
| Time | 12 a.m. to 6 a.m. | 3367 | 713 | 3.51% | 0.000 | 0.051 | 245 |
| 6 a.m. to 12 p.m. | 6283 | 889 | 4.38% | 0.000 | −0.049 | 586 | |
| 12 p.m. to 6 p.m. | 5915 | 956 | 4.71% | 0.070 | −0.013 | 578 | |
| 6 p.m. to 12 a.m. | 4728 | 873 | 4.30% | 0.001 | 0.023 | 368 | |
| WD * | Mon to Thu | 11,131 | 1788 | 8.81% | 0.000 | −0.025 | 586 |
| Fri to Sun | 9162 | 1643 | 8.10% | 0.000 | 0.025 | 430 | |
| Season | Spring | 4279 | 774 | 3.81% | 0.021 | 0.016 | 435 |
| Summer | 4821 | 896 | 4.42% | 0.000 | 0.025 | 578 | |
| Autumn | 4802 | 885 | 4.36% | 0.001 | 0.023 | 394 | |
| Winter | 6391 | 876 | 4.32% | 0.000 | −0.58 | 586 | |
| Weather condition | Clear or overcast weather | 15,541 | 2797 | 13.78% | 0.000 | 0.053 | 586 |
| Rain | 3.013 | 458 | 2.26% | 0.007 | −0.019 | 110 | |
| Hail, freezing rain | 124 | 17 | 0.08% | 0.398 | −0.007 | 12 | |
| Snow | 1913 | 175 | 0.86% | 0.000 | −0.067 | 147 | |
| Fog | 636 | 102 | 0.50% | 0.588 | −0.004 | 37 | |
| High wind | 377 | 52 | 0.26% | 0.113 | −0.011 | 17 | |
| Light condition | Daylight | 11,546 | 1790 | 8.82% | 0.000 | −0.043 | 586 |
| Dusk or dawn | 1604 | 266 | 1.31% | 0.753 | −0.003 | 111 | |
| Darkness | 6.828 | 1311 | 6.46% | 0.000 | 0.044 | 368 | |
| Artificial light | 571 | 93 | 0.46% | 0.730 | −0.003 | 15 | |
| Limited visibility | 7 | 0 | 0.00% | 0.610 | −0.008 | 1 | |
| Glare from the sun | 109 | 24 | 0.12% | 0.156 | 0.010 | 8 |
References
- Herry Consult; KFV. Unfallkostenrechnung Straße 2022 (UKR 2022). Forschungsarbeiten des österreichischen Verkehrssicherheitsfonds; Bundesministerium für Klimaschutz, Umwelt, Energie, Mobilität, Innovation und Technologie (BMK): Vienna, Austria, 2022. [Google Scholar]
- European Commission: Directorate-General for Mobility and Transport; CE Delft. Handbook on the External Costs of Transport; Version 2019–1.1; Publications Office of the European Union: Luxembourg, 2020. [Google Scholar]
- European Commission. Archive: Road Safety Statistics—Characteristics at National and Regional Level. 18 December 2019. Available online: https://ec.europa.eu/eurostat/statistics-explained/index.php?title=Road_safety_statistics__characteristics_at_national_and_regional_level&oldid=463733 (accessed on 8 August 2021).
- Bundesministerium für Inneres (BMI). Straßenverkehrstote in Österreich. 2020. Available online: https://www.bmi.gv.at/202/Verkehrsangelegenheiten/unfallstatistik_vorjahr.aspx (accessed on 7 July 2021).
- Fian, T. From Blackspots to Blackpatterns: Pattern Recognition with Road Traffic Accident Data. Ph.D. Thesis, Vienna University of Technology, Vienna, Austria, 2021. [Google Scholar] [CrossRef]
- Gutierrez-Osorio, C.; Pedraza, C.A. Modern data sources and techniques for analysis and forecast of road accidents: A review. J. Traffic Transp. Eng. 2020, 7, 432–446. [Google Scholar] [CrossRef]
- Kizito, A.; Semwanga, A.R. Modeling the complexity of road accidents prevention: A system dynamics approach. Int. J. Syst. Dyn. Appl. 2020, 9, 24–41. [Google Scholar] [CrossRef]
- Martins, M.A.; Garcez, T.V. A multidimensional and multi-period analysis of safety on roads. Accid. Anal. Prev. 2021, 162, 106401. [Google Scholar] [CrossRef] [PubMed]
- Khalsa, A. Study on road traffic accidents and prevention in India: A review. Int. J. Res. Appl. Sci. Eng. Technol. 2019, 7, 1683–1685. [Google Scholar] [CrossRef]
- Karamanlis, I.; Nikiforiadis, A.; Botzoris, G.N.; Kokkalis, A.; Basbas, S. Towards sustainable transportation: The role of black spot analysis in improving road safety. Sustainability 2023, 15, 14478. [Google Scholar] [CrossRef]
- Reeves, K.; Chandan, J.S.; Bandyopadhyay, S. Using statistical modelling to analyze risk factors for severe and fatal road traffic accidents. Int. J. Inj. Control. Saf. Promot. 2019, 26, 364–371. [Google Scholar] [CrossRef]
- Gu, C.; Xu, J.; Gao, C.; Mu, M.; E, G.; Ma, Y. Multivariate analysis of roadway multi-fatality crashes using association rules mining and rules graph structures: A case study in China. PLoS ONE 2022, 17, e0276817. [Google Scholar] [CrossRef]
- Pande, A.; Abdel-Aty, M.A. A novel approach for analyzing severe crash patterns on multilane highways. Accid. Anal. Prev. 2009, 41, 985–994. [Google Scholar] [CrossRef]
- Alin, D.; Cofarue, C.; Popesku, M.V. Investigation of single vehicle accidents severity by using a probabilistic approach. Mobil. Veh. Mech. 2023, 49, 39–53. [Google Scholar] [CrossRef]
- Cioca, L.; Ivașcu, L. Risk indicators and road accident analysis for the period 2012–2016. Sustainability 2017, 9, 1530. [Google Scholar] [CrossRef]
- Shibani, A.; Pervin, M.S.A. Analysis of traffic accident severity on Great Britain roadways and junctions. Int. J. Built Environ. Asset Manag. 2016, 2, 37–66. [Google Scholar] [CrossRef]
- Ju, Y.H.; Sohn, S.Y. Quantification method analysis of the relationship between occupant injury and environmental factors in traffic accidents. Accid. Anal. Prev. 2011, 43, 342–351. [Google Scholar] [CrossRef]
- Yaman, T.T.; Bilgiç, E.; Esen, M.F. Analysis of traffic accidents to identify factors affecting injury severity with fuzzy and crisp techniques. In Proceedings of the International Conference on Intelligent and Fuzzy Systems, Istanbul, Türkiye, 21–23 July 2020. [Google Scholar] [CrossRef]
- Yaman, T.T.; Bilgiç, E.; Esen, M.F. Analysis of traffic accidents with fuzzy and crisp data mining techniques to identify factors affecting injury severity. J. Intell. Fuzzy Syst. 2021, 42, 575–592. [Google Scholar] [CrossRef]
- Shaon, M.R.; Qin, X. Crash data-based investigation into how injury severity is affected by driver errors. Transp. Res. Rec. 2020, 2674, 452–464. [Google Scholar] [CrossRef]
- Gilani, V.; Hosseinian, S.M.; Ghasedi, M.; Nikookar, M. Data-driven urban traffic accident analysis and prediction using logit and machine learning-based pattern recognition models. Math. Probl. Eng. 2021, 2021, 9974219. [Google Scholar] [CrossRef]
- Sohn, S.Y.; Shin, H. Pattern recognition for road traffic accident severity in Korea. Ergonomics 2001, 44, 107–117. [Google Scholar] [CrossRef]
- Khyara, H.; Amine, A.; Nassih, B. Dependent and independent variables for exploratory analysis of road traffic accidents. In Proceedings of the International Conference on Industrial Engineering and Operations Management, Manila, Philippines, 6–9 May 2023. [Google Scholar] [CrossRef]
- Athiappan, K.; Karthik, C.; Rajalaskshmi, M.; Subrata, C.; Rabiei-Dastjerdi, H.; Liu, Y.; Fernández-Campusano, C.; Gheisari, M. Identifying influencing factors of road accidents in emerging road accident blackspots. Adv. Civ. Eng. 2022, 2022, 9474323. [Google Scholar] [CrossRef]
- Theofilatos, A.; Yannis, G. A review of the effect of traffic and weather characteristics on road safety. Accid. Anal. Prev. 2014, 72, 244–256. [Google Scholar] [CrossRef]
- Aziz, S.; Ram, S. A meta-analysis of the methodologies practiced worldwide for the identification of Road accident black spots. Transp. Res. Procedia 2022, 62, 790–797. [Google Scholar] [CrossRef]
- Khorasani-Zavareh, D. System versus traditional approach in road traffic injury prevention: A call for action. J. Inj. Violence Res. 2011, 3, 61. [Google Scholar] [CrossRef][Green Version]
- Rezapur-Shahkolai, F.; Afshari, M.; Doosti-Irani, A.; Bashirian, S.; Maleki, S. Interventions to prevent road traffic injuries among pedestrians: A systematic review. Int. J. Inj. Control. Saf. Promot. 2022, 29, 533–549. [Google Scholar] [CrossRef] [PubMed]
- Staton, C.A.; Vissoci, J.R.; Gong, E.; Toomey, N.; Wafula, R.B.; Abdelgadir, J.; Zhou, Y.; Liu, C.; Pei, F.; Zick, B.; et al. Road traffic injury prevention initiatives: A systematic review and metasummary of effectiveness in low and middle income countries. PLoS ONE 2016, 11, e0144971. [Google Scholar] [CrossRef]
- Gopalakrishnan, S. A public health perspective of road traffic accidents. J. Fam. Med. Prim. Care 2012, 1, 144–150. [Google Scholar] [CrossRef] [PubMed]
- KFV; FGM. Austrian Road Safety Strategy 2021–2030; Bundesministerium für Klimaschutz: Vienna, Austria, 2021. [Google Scholar]
- Cerwenka, P.; Hauger, G.; Hörl, B.; Klamer, M. Handbook of Transportation System Planning; Austrian Art and Culture Publishers: Vienna, Austria, 2007. [Google Scholar]
- European Transport Safety Council. RoadPol Operation Reveals Persistent Seatbelt Violations across Europe. 18 April 2024. Available online: https://etsc.eu/roadpol-operation-reveals-persistent-seatbelt-violations-across-europe/ (accessed on 29 September 2024).
- World Health Organization. Global Status Report on Road Safety 2018; World Health Organization: Geneva, Switzerland, 2018. [Google Scholar]
- Kargar, S.; Ansari-Moghaddam, A.; Ansarim, H. The prevalence of seat belt use among drivers and passengers: A systematic review and meta-analysis. J. Egypt Public Health Assoc. 2023, 98, 14. [Google Scholar] [CrossRef]
- Clarke, D.D.; Ward, P.; Bartle, C. Young driver accidents in the UK: The influence of age, experience, and time of day. Accid. Anal. Prev. 2006, 38, 871–878. [Google Scholar] [CrossRef]
- Williams, A.F. Teenage drivers: Patterns of risk. J. Saf. Res. 2003, 34, 5–15. [Google Scholar] [CrossRef]
- Dumbaugh, E.; Li, W. Designing for the safety of pedestrians, cyclists, and motorists in urban environments. J. Am. Plan. Assoc. 2010, 76, 283–298. [Google Scholar] [CrossRef]
- Abdel-Aty, M.; Radwan, A.E. Modeling traffic accident occurrence and involvement. Accid. Anal. Prev. 2000, 32, 633–642. [Google Scholar] [CrossRef]
- Hauer, E. Observational Before-After Studies in Road Safety: Estimating the Effect of Highway and Traffic Engineering Measures on Road Safety; Pergamon: Oxford, UK, 1997. [Google Scholar]
- Elvik, R. The Handbook of Road Safety Measures; Emerald Group Publishing Limited: Bentley, UK, 2009. [Google Scholar]
- Liu, X.; Abdel-Aty, M. Real-time crash risk prediction on arterials based on LSTM neural network model. Accid. Anal. Prev. 2019, 124, 27–37. [Google Scholar] [CrossRef]
- Meng, Z.; Zhao, S.; Chen, H.; Hu, M.; Tang, Y.; Song, Y. The vehicle testing based on digital twins theory for autonomous vehicles. IEEE J. Radio Freq. Identif. 2022, 6, 710–714. [Google Scholar] [CrossRef]
- Chen, X.; Wei, C.; Yang, Y.; Luo, L.; Biancardo, S.A.; Mei, X. Personnel trajectory extraction from port-like videos under varied rainy interferences. IEEE Trans. Intell. Transp. Syst. 2024, 25, 6567–6579. [Google Scholar] [CrossRef]
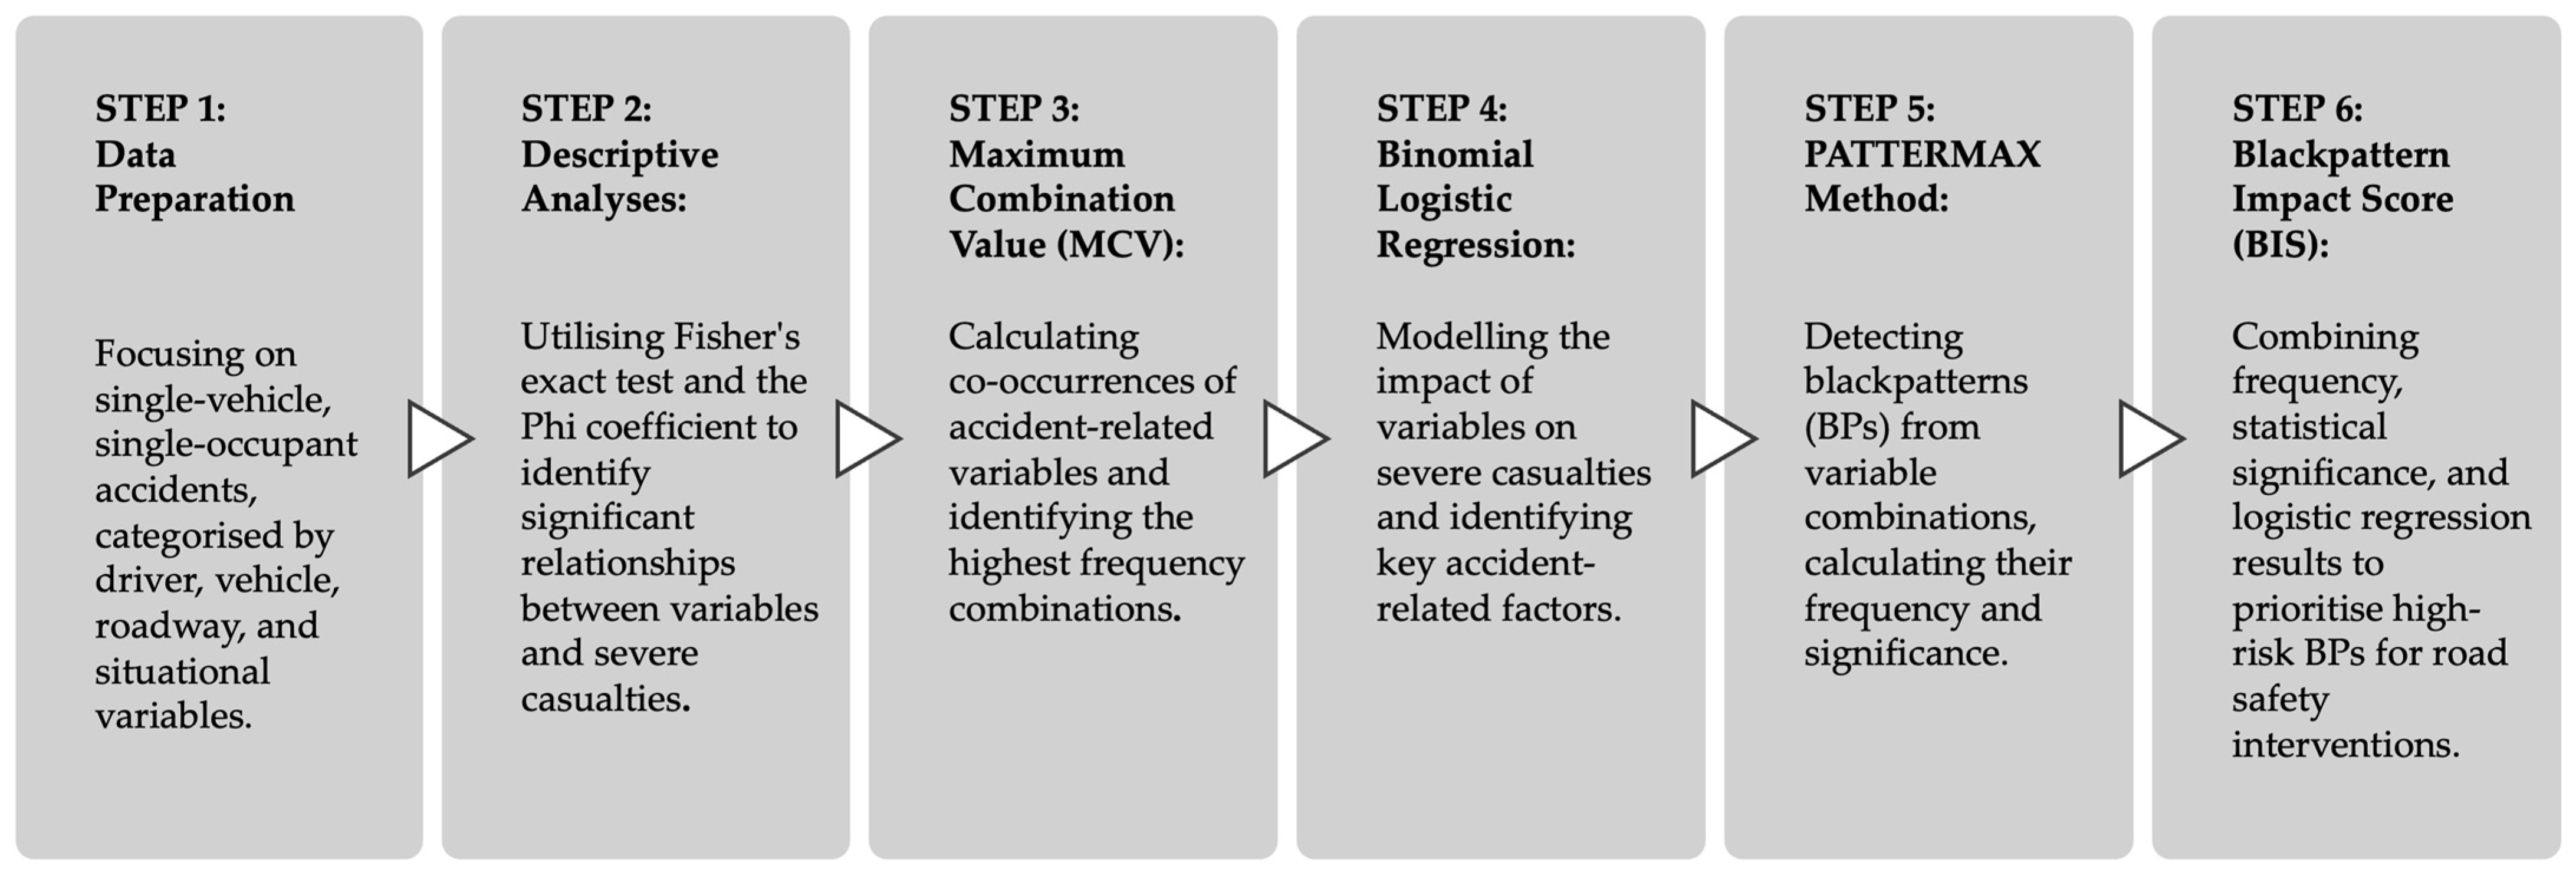
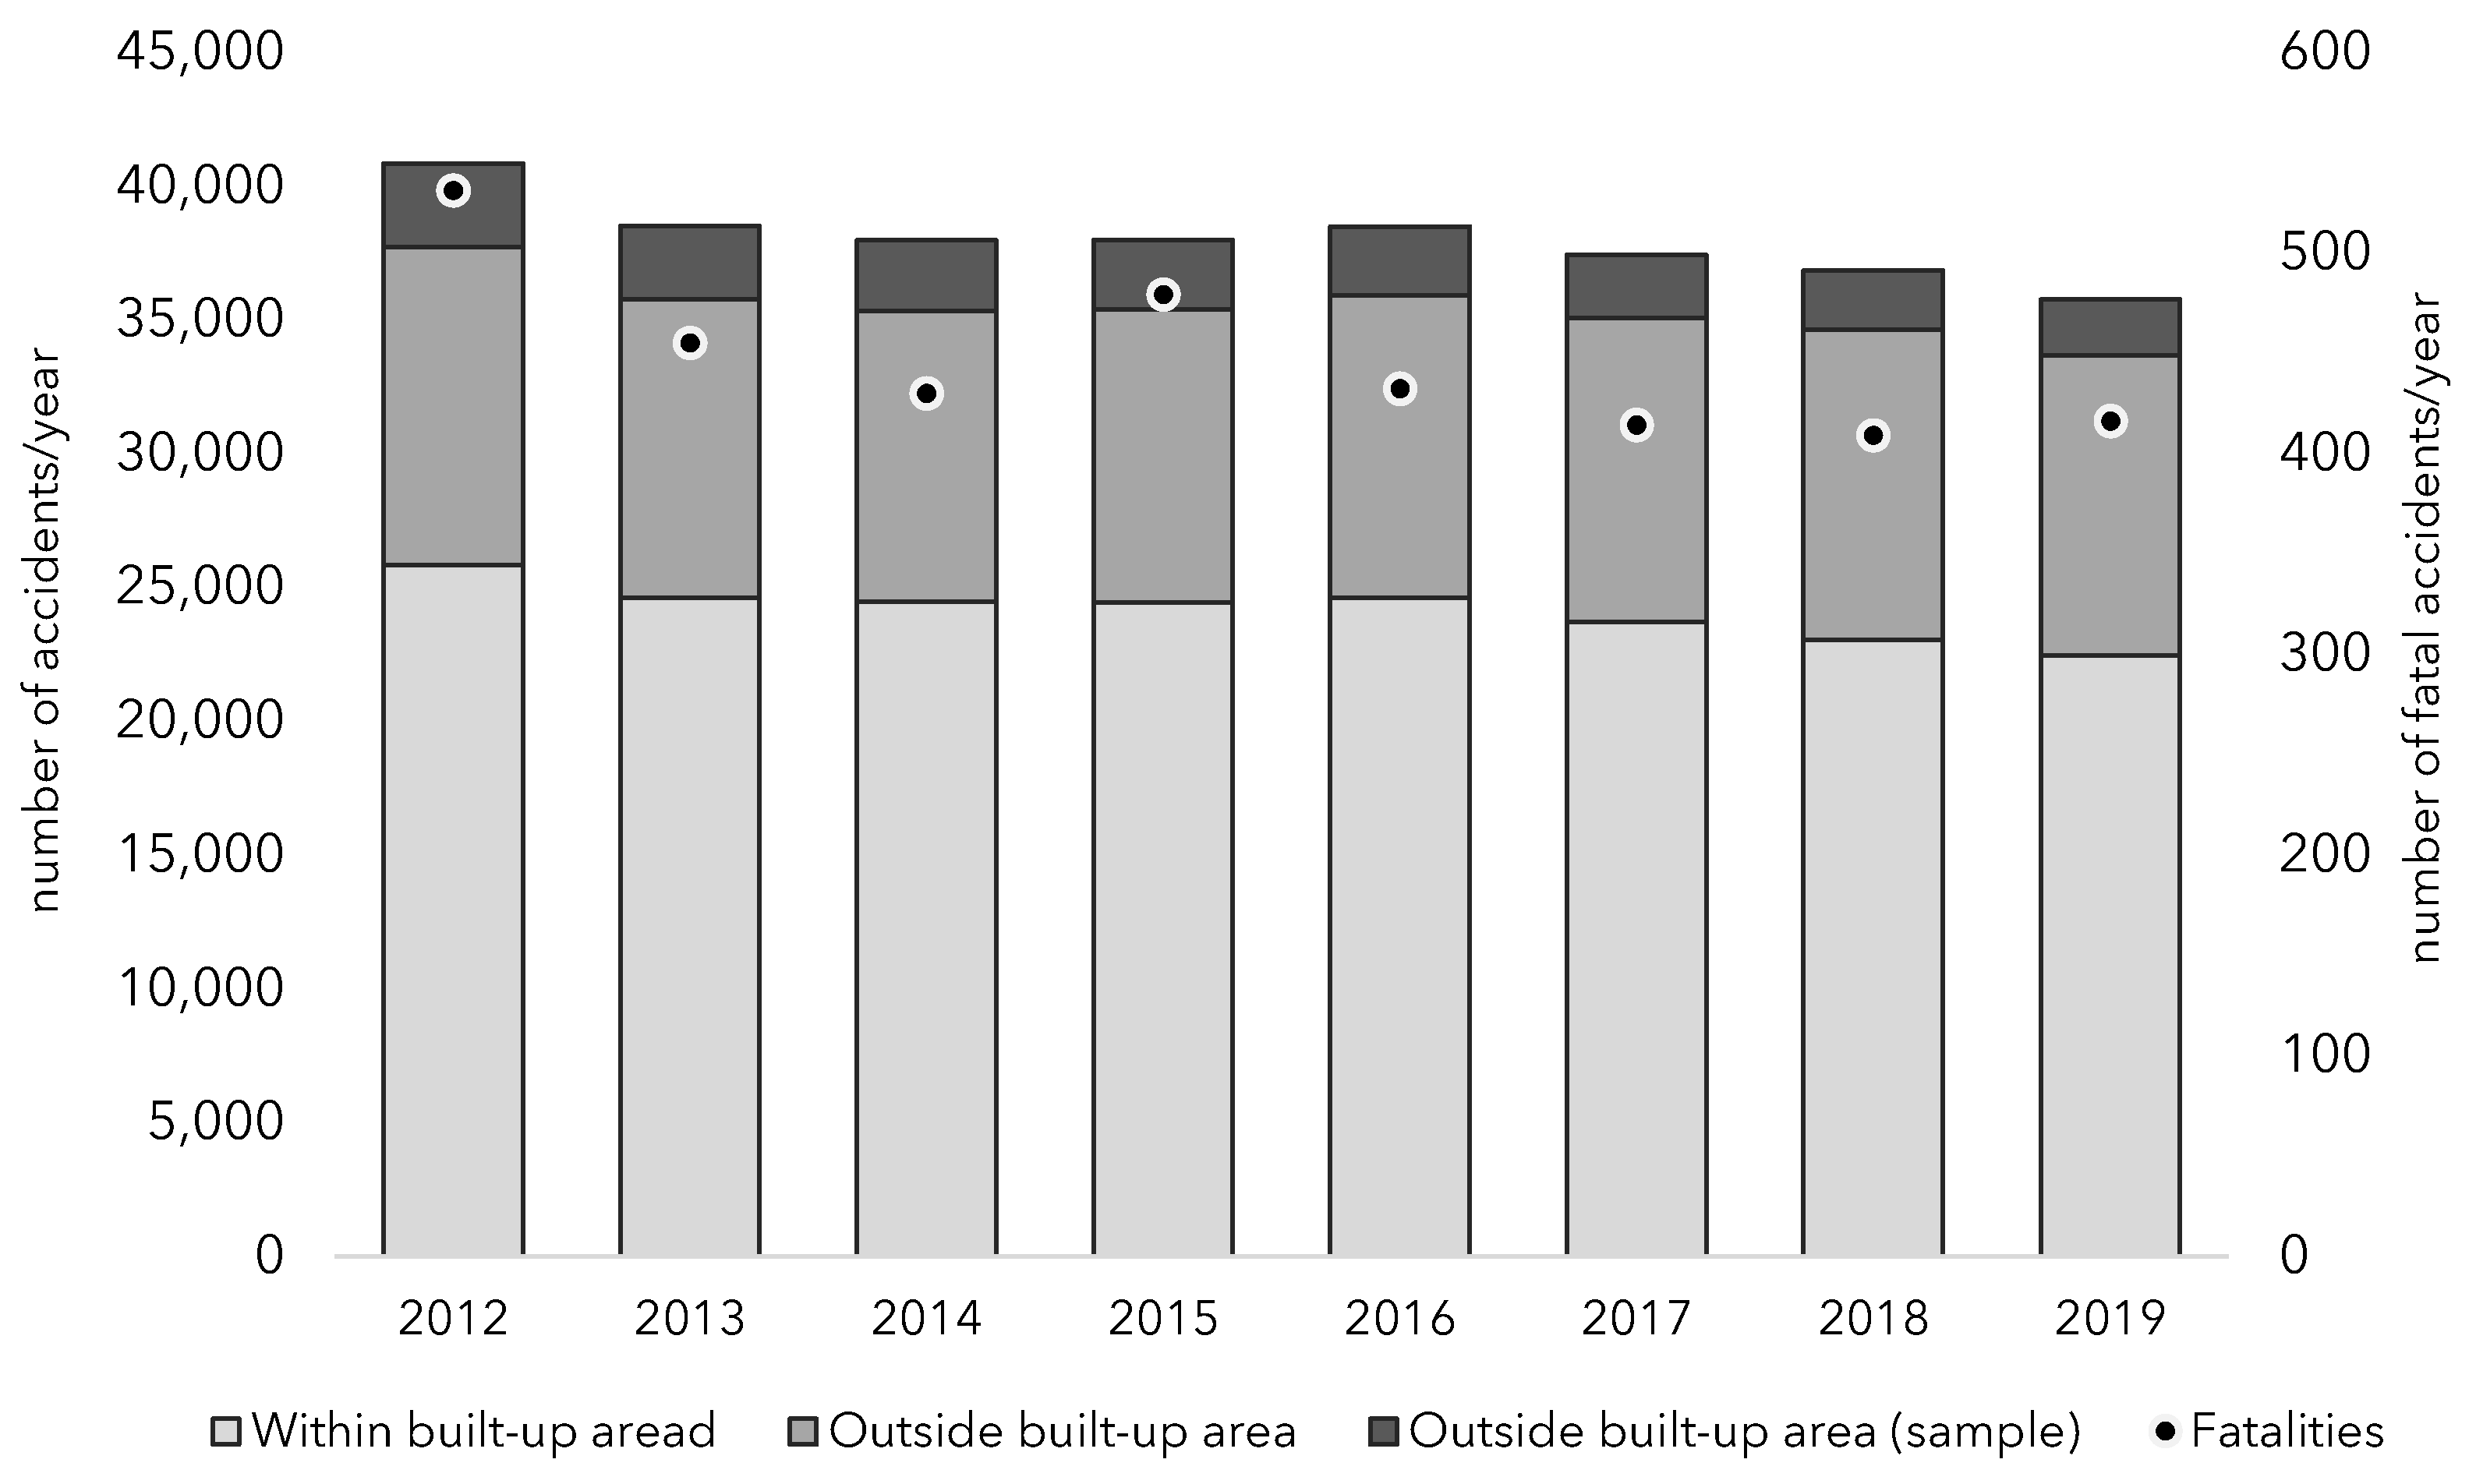
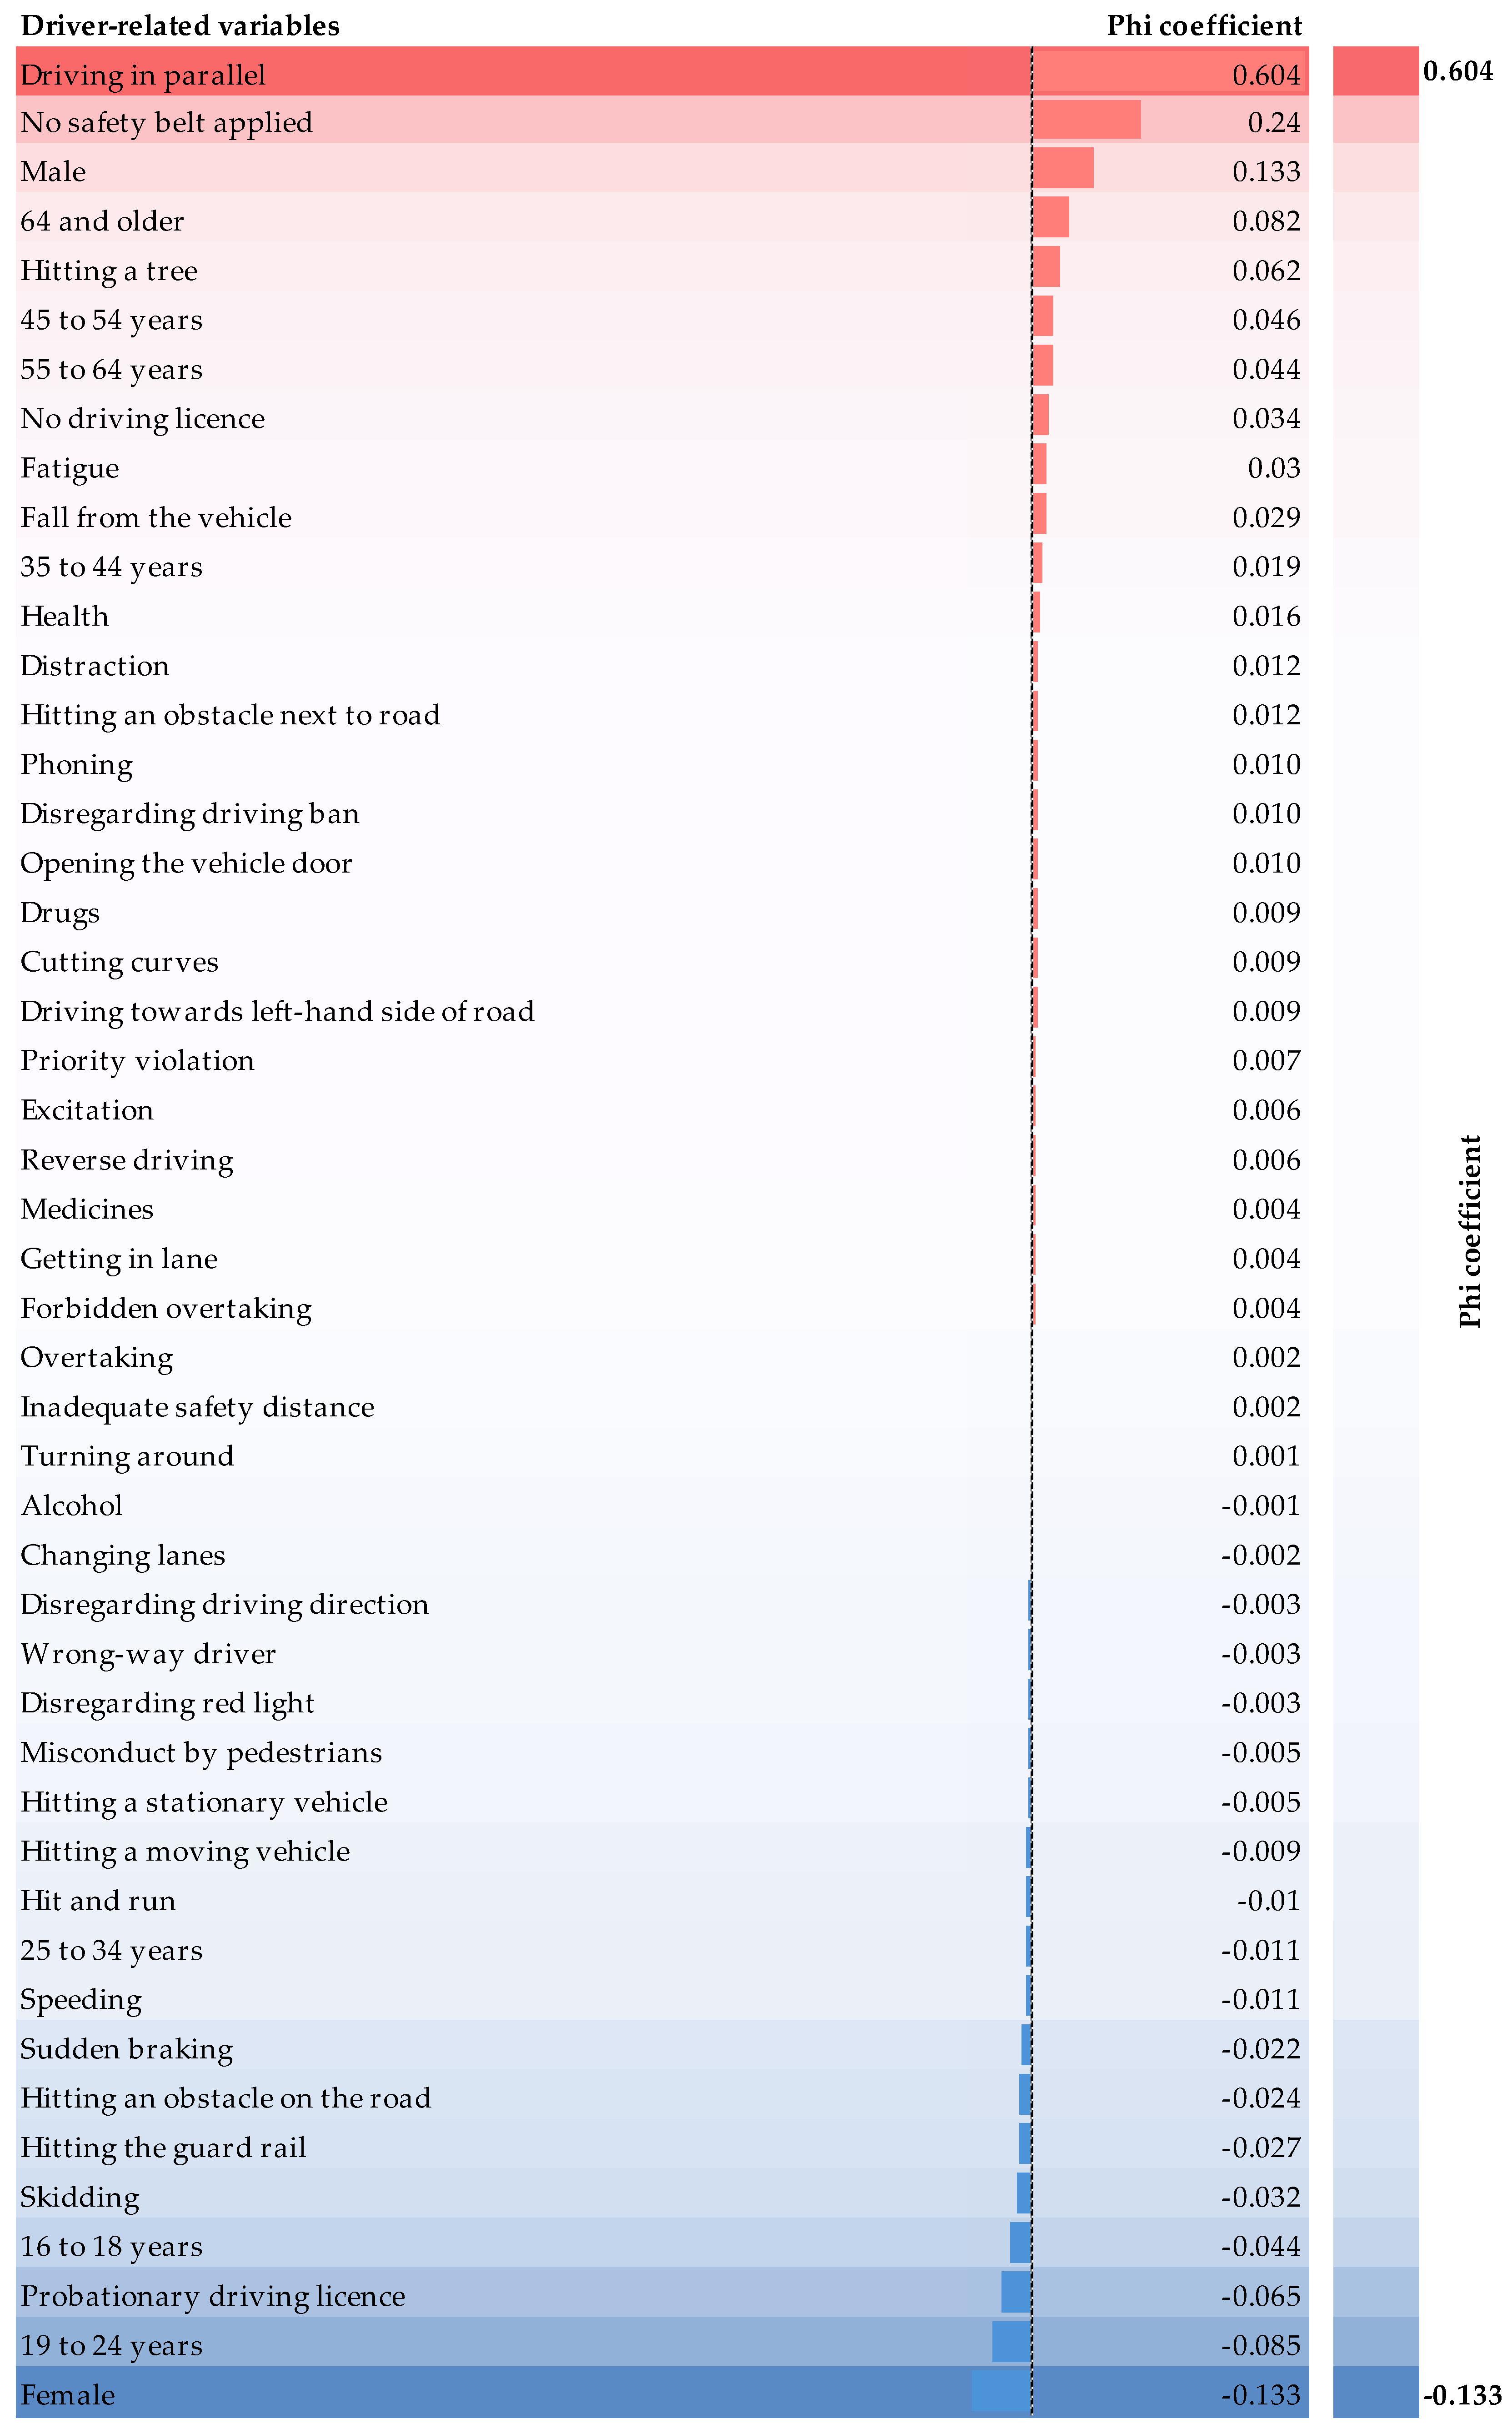
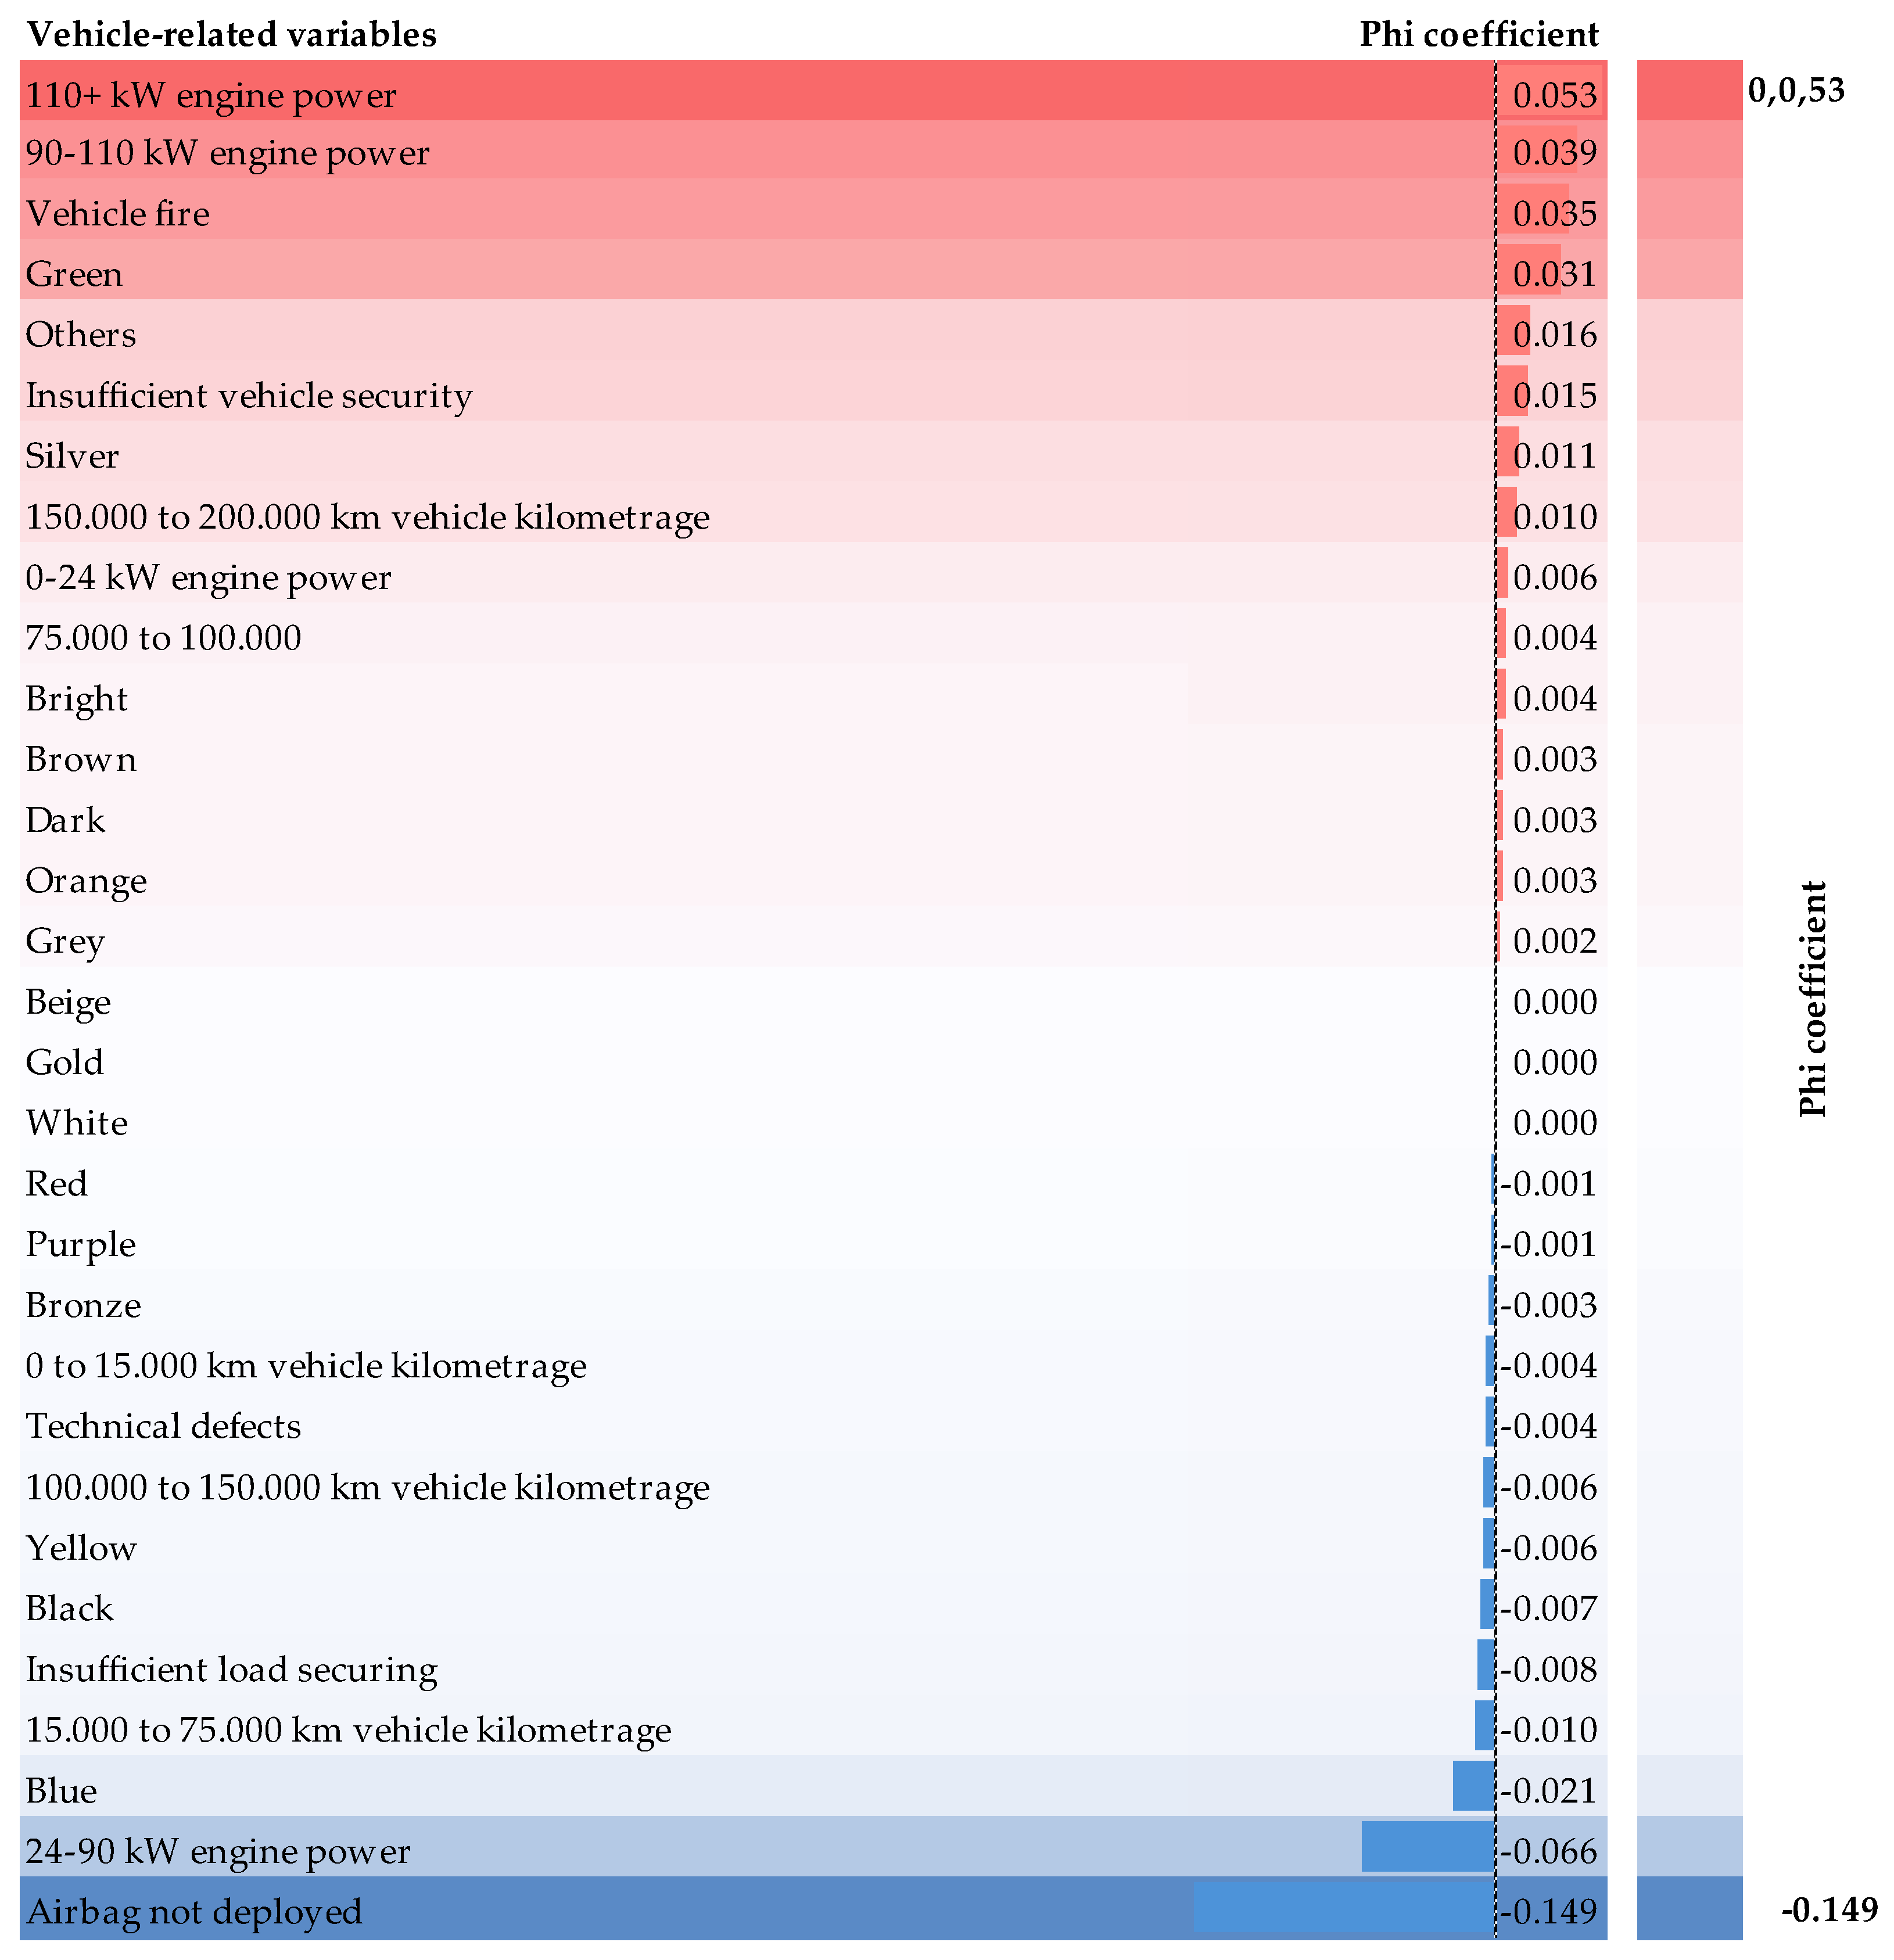
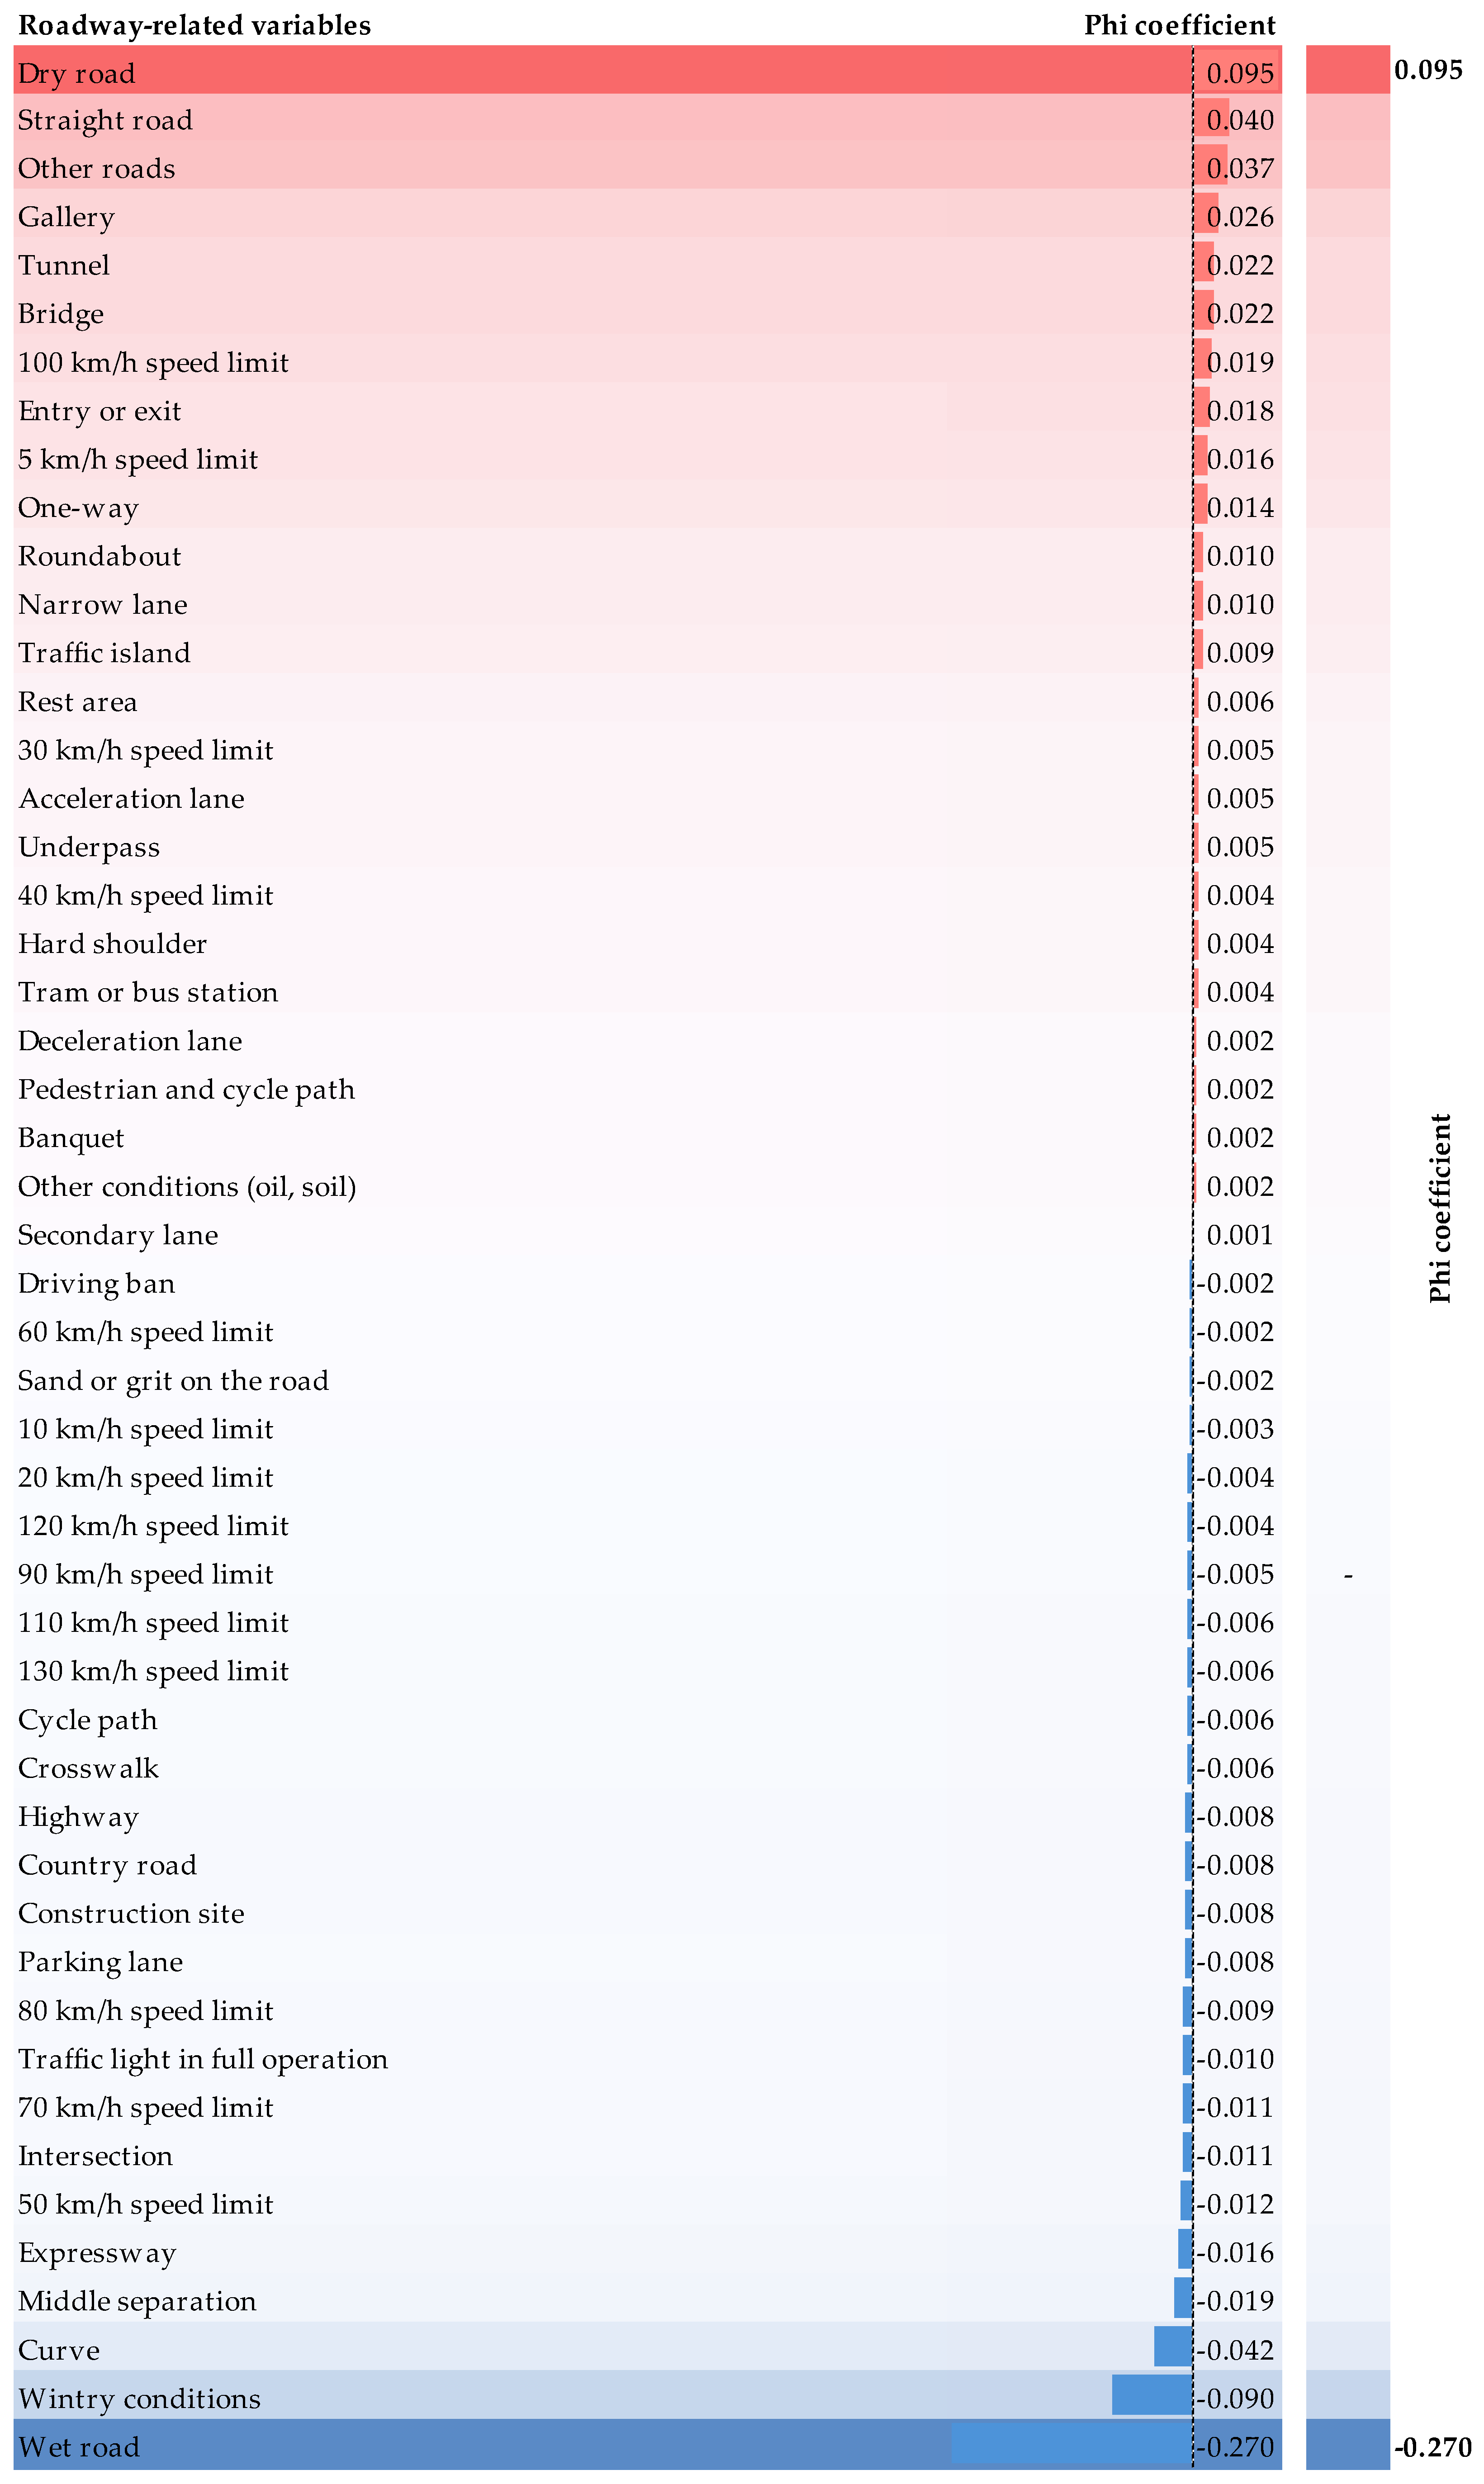
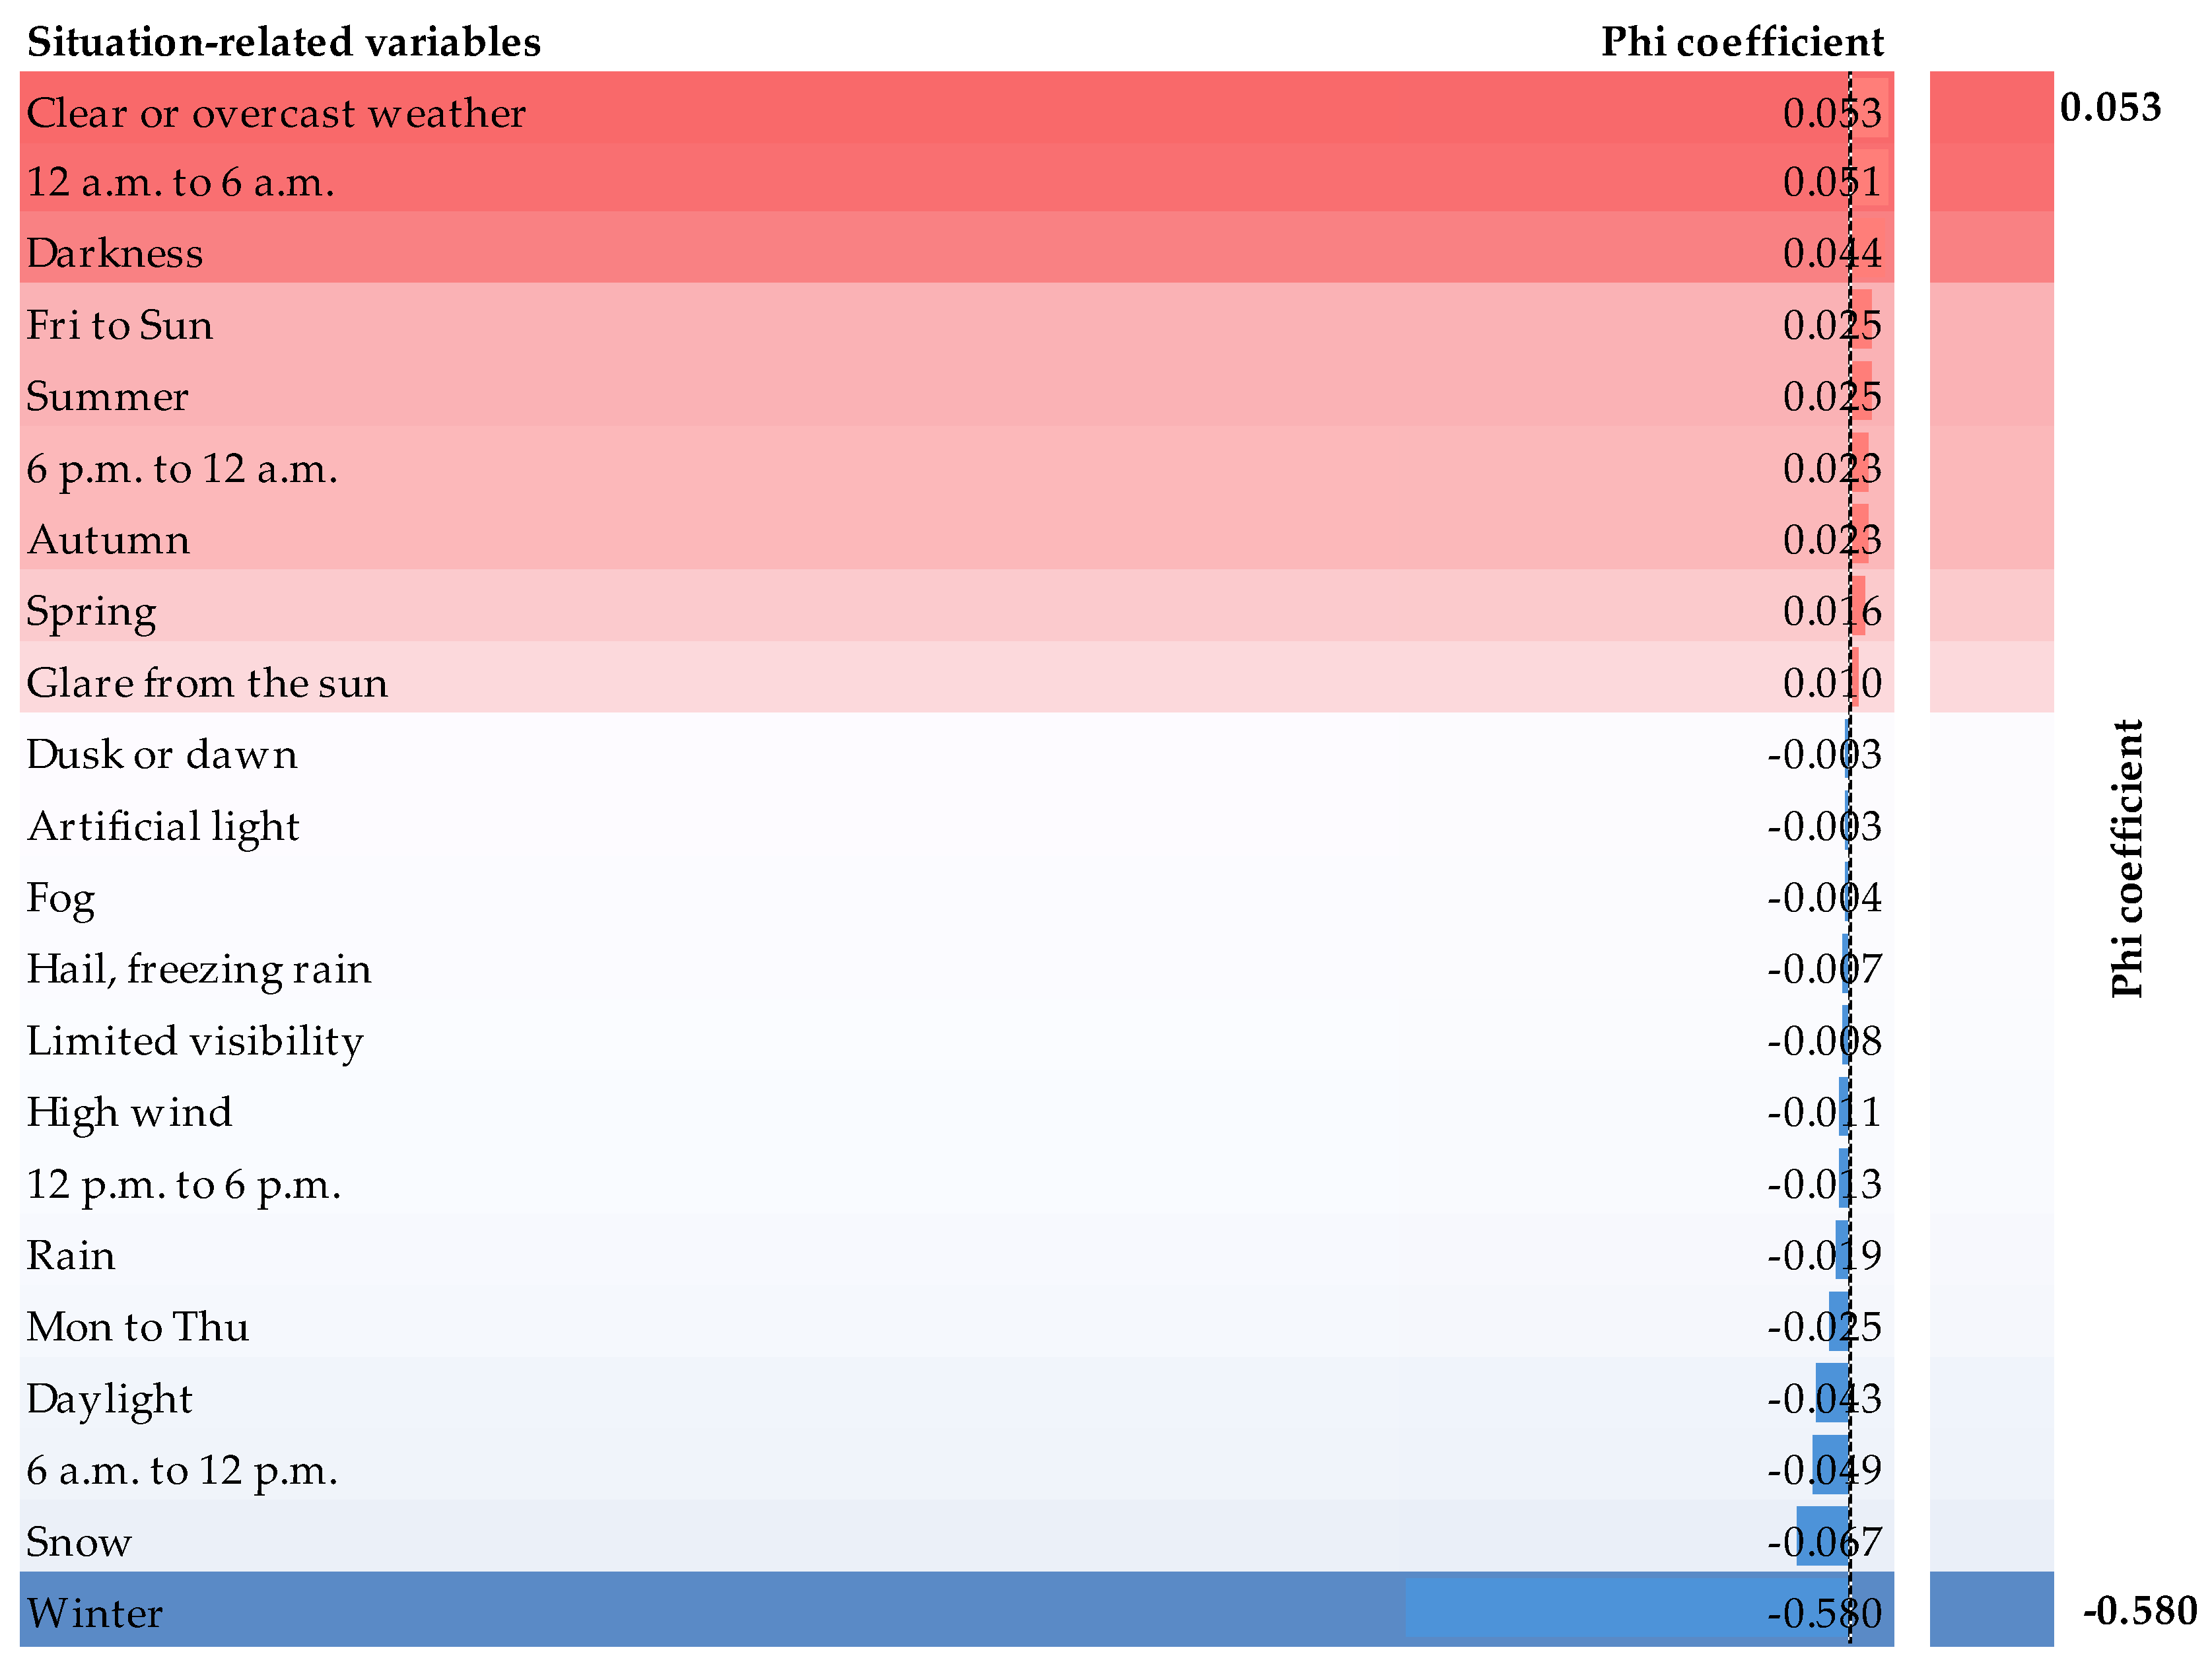
| Driver | Vehicle | Roadway | Situation |
|---|---|---|---|
|
|
|
|
| BIS Features | Description |
|---|---|
| High Frequency | Blackpatterns that occur frequently in the dataset are prioritized. |
| High Impact | Blackpatterns with variables that have a strong influence on severe casualties are emphasized. |
| Strong Association | Blackpatterns that are statistically significant in their association with severe casualties are given higher priority. |
| Variable | Regression Coefficient β | Standard Error SEM | p | exp(β) |
|---|---|---|---|---|
| No safety belt applied | 1.612 | 0.062 | 0.000 | 5.015 |
| Gallery | 1.522 | 0.589 | 0.010 | 4.583 |
| Vehicle fire | 1.394 | 0.541 | 0.010 | 4.029 |
| Hitting an obstacle on the road | 1.222 | 0.426 | 0.004 | 3.394 |
| Age class 16 to 18 | 0.840 | 0.104 | 0.000 | 2.317 |
| Airbag not deployed | 0.803 | 0.046 | 0.000 | 2.233 |
| Bridge | 0.773 | 0.197 | 0.000 | 2.166 |
| Age class 19 to 24 | 0.743 | 0.057 | 0.000 | 2.101 |
| Sudden braking | 0.693 | 0.324 | 0.032 | 2.000 |
| Alcohol | 0.650 | 0.062 | 0.000 | 1.916 |
| Hit and run | 0.552 | 0.161 | 0.001 | 1.737 |
| Tunnel | 0.515 | 0.258 | 0.046 | 1.674 |
| One-way | 0.507 | 0.219 | 0.020 | 1.660 |
| Age class 25 to 34 | 0.492 | 0.057 | 0.000 | 1.635 |
| Male driver | 0.491 | 0.045 | 0.000 | 1.634 |
| Intersection | 0.450 | 0.148 | 0.002 | 1.569 |
| Other road variables | 0.397 | 0.082 | 0.000 | 1.487 |
| Wintry conditions | 0.380 | 0.070 | 0.000 | 1.462 |
| Hitting a tree | 0.365 | 0.075 | 0.000 | 1.441 |
| Age class 35 to 44 | 0.308 | 0.065 | 0.000 | 1.361 |
| 0 a.m. to 6 a.m. | 0.307 | 0.058 | 0.000 | 1.359 |
| Vehicle colour: green | 0.275 | 0.078 | 0.000 | 1.317 |
| County road | 0.247 | 0.062 | 0.000 | 1.280 |
| Dry road | 0.232 | 0.047 | 0.000 | 1.261 |
| Curve | 0.180 | 0.043 | 0.000 | 1.198 |
| Engine power 24–90 kW | 0.175 | 0.046 | 0.000 | 1.192 |
| Probationary driving licence | 0.166 | 0.078 | 0.033 | 1.181 |
| Darkness | 0.165 | 0.049 | 0.001 | 1.180 |
| Drifting left | 0.147 | 0.041 | 0.000 | 1.158 |
| Speed limit 100 km/h | 0.114 | 0.046 | 0.013 | 1.120 |
| Hitting a guardrail | −0.313 | 0.091 | 0.001 | 0.731 |
| Speed limit 50 km/h | −0.329 | 0.144 | 0.022 | 0.719 |
| Constant | −9.285 | 0.611 | 0.000 |
| BP ID | BP Variables | Fisher’s Exact Test p | Phi Coefficient ϕ | Frequency n |
|---|---|---|---|---|
| BP1 | speed limit 130 km/h, highway, right drift, male driver | 0.001 | 0.027 | 44 |
| BP2 | speed limit 100 km/h, country road, left drift, male driver | 0.000 | 0.032 | 41 |
| BP3 | speed limit 100 km/h, country road, curve, left drift, male driver | 0.011 | 0.020 | 30 |
| BP4 | country road, right drift, female driver | 0.042 | 0.015 | 28 |
| BP5 | speed limit 100 km/h, country road, left drift, male driver, fatigue | 0.001 | 0.028 | 20 |
| BP6 | speed limit 130 km/h, highway, drifting right, male driver, fatigue | 0.040 | 0.015 | 16 |
| BP7 | speed limit 100 km/h, country road, wet road, age 25–34, right drift, male driver | 0.001 | 0.027 | 12 |
| BP8 | speed limit 100 km/h, country road, left drift, male driver, no safety belt applied | 0.000 | 0.031 | 10 |
| BP9 | speed limit 100 km/h, country road, darkness, right drift, male driver | 0.003 | 0.026 | 10 |
| B10 | speed limit 80 km/h, country road, right drift, male driver | 0.016 | 0.020 | 10 |
| BP ID | BP Frequency n | BP Fisher’s Exact Test p | BP Phi Coefficient ϕ | BP Variables and Their Regression Coefficients β | BIS | |||||
|---|---|---|---|---|---|---|---|---|---|---|
| BP1 | 44 | 0.001 | 0.027 | Speed limit 130 km/h | Highway | Right drift | Male driver | 628.4 | ||
| 0 | 0 | 0 | 0.491 | |||||||
| BP2 | 41 | 0.001 | 0.032 | Speed limit 100 km/h | Country road | Left drift | Male driver | 804.7 | ||
| 0.114 | 0.247 | 0.147 | 0.491 | |||||||
| BP3 | 30 | 0.011 | 0.020 | Speed limit 100 km/h | Country road | curve | Left drift | Male driver | 194.9 | |
| 0.114 | 0.247 | 0.180 | 0.147 | 0.491 | ||||||
| BP4 | 28 | 0.042 | 0.015 | Country road | Right drift | Female driver | 50.1 | |||
| 0.247 | 0 | 0 | ||||||||
| BP5 | 20 | 0.001 | 0.028 | Speed limit 100 km/h | Country road | Left drift | Male driver | Fatigue | 167.6 | |
| 0.114 | 0.247 | 0.147 | 0.491 | 0 | ||||||
| BP6 | 16 | 0.040 | 0.015 | Speed limit 130 km/h | Highway | Right drift | Male driver | Fatigue | 37.1 | |
| 0 | 0 | 0 | 0.491 | 0 | ||||||
| BP7 | 12 | 0.001 | 0.027 | Speed limit 100 km/h | Country road | Wet road | Age 25–34 | Right drift | Male driver | 141.8 |
| 0.114 | 0.247 | 0 | 0.492 | 0 | 0.491 | |||||
| BP8 | 10 | 0.000 | 0.031 | Speed limit 100 km/h | Country road | Left drift | Male driver | No safety belt | 982.9 | |
| 0.114 | 0.247 | 0.147 | 0.491 | 1.612 | ||||||
| BP9 | 10 | 0.003 | 0.026 | Speed limit 100 km/h | Country road | Darkness | Right drift | Male driver | 71.6 | |
| 0.114 | 0.247 | 0.165 | 0 | 0.491 | ||||||
| BP10 | 10 | 0.016 | 0.020 | Speed limit 80 km/h | Country road | Right drift | Male driver | 38.3 | ||
| 0 | 0.247 | 0 | 0.491 | |||||||
Disclaimer/Publisher’s Note: The statements, opinions and data contained in all publications are solely those of the individual author(s) and contributor(s) and not of MDPI and/or the editor(s). MDPI and/or the editor(s) disclaim responsibility for any injury to people or property resulting from any ideas, methods, instructions or products referred to in the content. |
© 2024 by the authors. Licensee MDPI, Basel, Switzerland. This article is an open access article distributed under the terms and conditions of the Creative Commons Attribution (CC BY) license (https://creativecommons.org/licenses/by/4.0/).
Share and Cite
Fian, T.; Hauger, G. Identifying High-Risk Patterns in Single-Vehicle, Single-Occupant Road Traffic Accidents: A Novel Pattern Recognition Approach. Appl. Sci. 2024, 14, 8902. https://doi.org/10.3390/app14198902
Fian T, Hauger G. Identifying High-Risk Patterns in Single-Vehicle, Single-Occupant Road Traffic Accidents: A Novel Pattern Recognition Approach. Applied Sciences. 2024; 14(19):8902. https://doi.org/10.3390/app14198902
Chicago/Turabian StyleFian, Tabea, and Georg Hauger. 2024. "Identifying High-Risk Patterns in Single-Vehicle, Single-Occupant Road Traffic Accidents: A Novel Pattern Recognition Approach" Applied Sciences 14, no. 19: 8902. https://doi.org/10.3390/app14198902
APA StyleFian, T., & Hauger, G. (2024). Identifying High-Risk Patterns in Single-Vehicle, Single-Occupant Road Traffic Accidents: A Novel Pattern Recognition Approach. Applied Sciences, 14(19), 8902. https://doi.org/10.3390/app14198902


