1. Introduction
Many people and businesses have set as their ideal goal the systematic management of an individual’s mental and physical health, and the identification of emotional states that are not directly expressed, and the provision of convenience and services accordingly. Artificial intelligence has recently attracted attention as an essential technology for realizing this ideal. The information obtained from human-like biological signals, facial expressions, voices, and behaviors can infer unexpressed health or expressions of opinion, thereby enabling an appropriate response even when people are physically challenged or unable to express their own intentions [
1]. In particular, ECG signals from a person’s heart contain high-quality information about the person which can be used to identify their health status and emotional status [
2]. In general, in order to acquire an ECG signal, a professional technique needs to be followed, attaching pads and devices to the body without movement. However, in order to analyze ECG signals in everyday environments, pads and devices that work in a contact manner are not suitable [
3]. Deep learning is a technology that classifies and predicts using high-dimensional nonlinear features extracted from large-scale data, making it suitable for radars with high-frequency bands to pass through the human body and analyze the reflected signals to acquire ECG information. In order to rebuild an ECG in a non-contact manner through radar signals, there is a limit in terms of checking changes in the signal over time. When a high-frequency radar passes or is reflected through a human body, it is received, including the activity signal information performed therein. In this case, signal-processing technologies such as noise filters and heart rate extraction are applied by checking the frequency band that includes the desired information [
4,
5]. In order to check the frequency which changes over time, a method of analyzing signals in a high-dimensional manner by converting a one-dimensional radar signal into a two-dimensional time–frequency image is also being studied. A signal transformed into a two-dimensional format can be treated as an image, enabling the use of image preprocessing techniques and learning through CNN-based models, which are capable of handling a vast amount of embedded information.
Existing models extract features from signals and transfer them to the FC layer, resulting in linear weights being applied, leading to output values. In contrast, fuzzy logic is applied to the input data using various membership functions (MFs), expressing the degree of membership for each one and generating rules based on these memberships, thereby creating linguistic rules which capture the relationships between feature channels. Although feature extraction abilities for large-scale data are somewhat lacking, this model can generate linguistic rules, enabling transparent learning and excellent processing abilities for uncertainty and ambiguous data acquired in the real world. In the case of the conventional fully connected (FC) layer, it is difficult to represent channel-specific relationships by the linear combination of high-dimensional nonlinear representations obtained from large-scale input data. As a result, the nonlinear features passing through the FC layer risk being weakened or lost, and the expressive power may decrease due to the flat combination approach. However, in the case of the ANFN layer, it usually has useful characteristics to solve these problems. This layer has the capability of handling complex nonlinear data and is advantageous for identifying relationships through clustering between input channels. Moreover, even if there is noise in the delivered feature map, it can obtain the robustness and stability of signal reconstruction.
Thus, a deep–fuzzy method is being studied, combining two different methods to simultaneously use nonlinear feature extraction capabilities for large-scale data and processing capabilities for uncertain data [
6].
In this study, we propose an improvement compared to the traditional fully connected (FC) layer—a linear classification layer commonly used in deep network models—using a fuzzy classification layer. This layer emphasizes the nonlinear features extracted by the model and enhances robustness against noise by incorporating fuzzy logic. Consequently, it becomes more effective in handling uncertain and ambiguous data and is better suited for processing nonlinear features, thereby increasing the model’s robustness to heterogeneous characteristics.
We describe, in
Section 2, the study of converting radar signals into ECGs and the study of fusing deep networks and fuzzy layers.
Section 3 describes the MODWT theory and the algorithms needed to design the output layer using fuzzy logic.
Section 4 compares general deep network performance using the MODWT layer and that of the proposed model using the fuzzy layer, and, finally,
Section 5 describes the conclusions.
2. Related Work
This section describes the deep learning techniques applied to acquire vital sign signals through existing external devices and convert them into an ECG or heart rate. The signal obtained by being reflected from the body through the radar includes information on the heart rate. It aims to import information related to the heart rate by frequency decomposition or pass through a deep network or algorithm and generate the desired ECG signal.
Sharma [
7] applied ANFN and unspecified wavelet transform to extract fetal ECGs from maternal ECGs. This technique is useful for handling nonlinear and time-series data, recording lower MSE values than discrete wavelet transforms. Cao [
8] applied a lightweight residual U-Net to pursue simple ECG measurement monitoring through a millimeter-wave (MW) radar. The experiment was carried out and verified with data measured using 10 subjects. As a result, the reconstructed ECG signal and actual signal showed a correlation coefficient of 0.8 or higher and proved the effect. Wu [
9] converted radar and ECG data obtained from 30 subjects into spectrograms through short-time Fourier transforms and then conducted signal reconstruction research with RSSRnet. As a result of verifying the performance of the signal converted through cross-channel attention in the model through the median-normalized root mean square error, a value of 0.049 was shown. Chen [
10] designed an end-to-end DNN model to rebuild a non-contact ECG signal with an MW radar system. Signal reconstruction via a deep network by extracting four-dimensional cardiac motion has a median error of 14 ms or less of the electrical event of the heart, and the results are significantly similar to real ECGs with a median Pearson correlation coefficient of 90%. Abdelmadjid [
11] reconstructed it into a deep network through signal-processing algorithms and radio frequency signals based on signals acquired in four different situations through 35 experiments. The experimental results confirmed that the dimensional transformation algorithm and the deep network are effective in transforming signals. Toda [
12] conducted a study to receive signals from outside the body with a frequency-modulated continuous wave and rebuild them into ECG signals through CNN. In six adult males without heart disease, the reconstruction performance was confirmed with signals obtained in a contactless or contact manner. Although noise was added, the signal reconstruction method using deep learning was confirmed to have good performance with a low signal-to-noise ratio. Li [
13] conducted a wavelet-scattering network–long short-term memory (WSN-LSTM) network study that enabled the measurement of the ECG signal and heart rate via FMCW radar signals using data from Physio Net. The bio signal used variational-mode extraction to extract the heart rate signal and built the heart rate signal with the learned WSN-LSTM. Afterwards, when the heart rate was estimated by fast Fourier transform, a lower error was recorded compared to the conventional method. Jang [
14]’s study aimed to achieve contactless heart monitoring through Doppler data sensors. DCG signals and deep networks were utilized to generate ECG signals containing a heart rate variability similar to ECG information, rather than diagnosing through conventional ECG alone. For data processing, they used a variational autoencoder network and found a 58% improvement in consistency.
Yamamoto [
15] proposed an ECG reconstruction model that combined CNN and LSTM to measure the heart rate in a non-contact manner through Doppler sensors. For verification, data from nine healthy subjects without heart disease were used, and the correlation coefficient between the reconstructed signal and the actual signal was 0.86, confirming a similar performance. Cerda [
16] used a deep learning method as a way to reconstruct ECG signals from photoplethysmogram signals. As a result of reconstructing the signal by applying Bi-LSTM to public data, the average correlation value confirmed a high performance above 0.8. Shyu [
17] proposed the use of the UWB radar and the first valley peak of the energy function of intrinsic mode functions and ensemble empirical mode decomposition to properly separate signals reflected from the body without being disturbed by the environment or movement. The bio-signal calculated by the above method could simultaneously acquire breathing and heart rate information and effectively separate even fine signals. Yang [
18] proposed methods based on permutation entropy and ensemble empirical mode decomposition algorithms to measure bio-signals in a non-contact manner. The proposed algorithm calculated the distance between the person and the radar through PE and decomposed the combined signal by the ensemble empirical mode decomposition algorithm into intrinsic mode functions. When breathing and heart rate signals were collected in the above manner, it was demonstrated that they could be efficiently extracted. Kim [
19] proposed a method to measure the heart rate through a frequency-modulated continuous-wave radar and lightweight deep network.
3. CNN and Bi-LSTM Model with MODWT and ANFN Layers
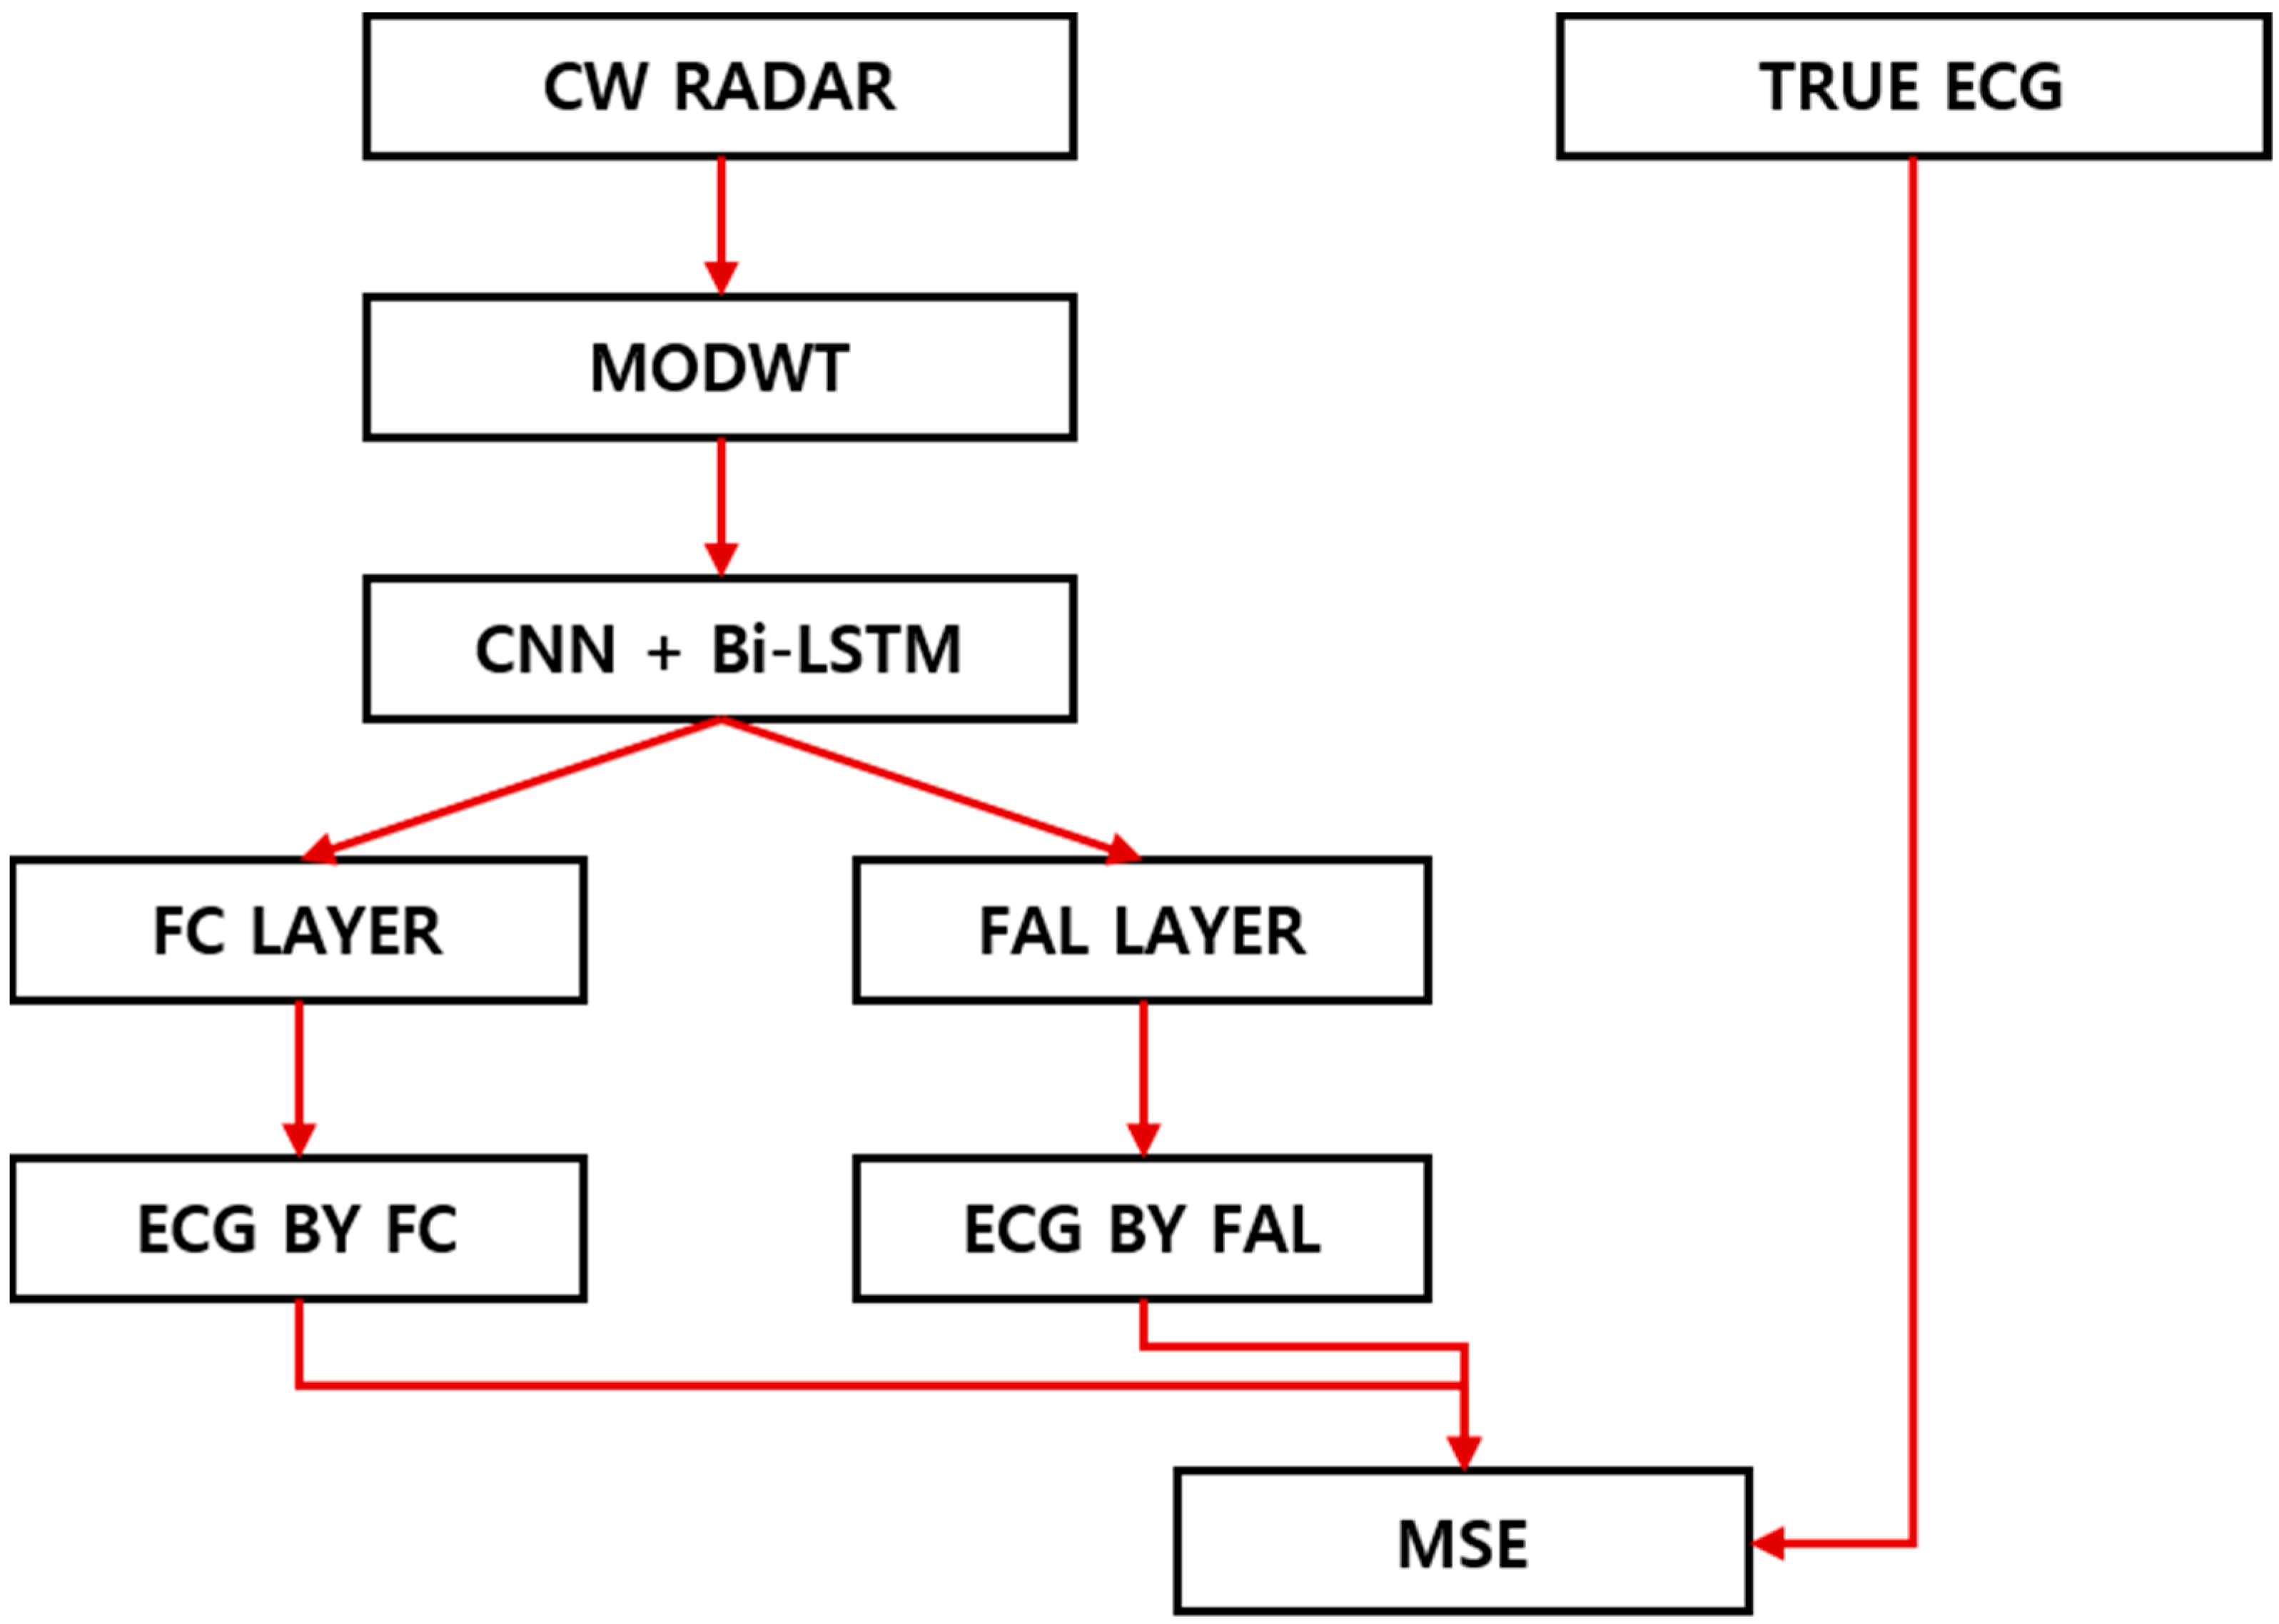
We performed the following experiments to demonstrate whether the model’s performance was sufficient to replace the fully connected (FC) layer with the adaptive neuro-fuzzy network (ANFN) layer with the nonlinear clustering treatment in the deep network generating the ECG, as shown in
Figure 1. This section addresses the algorithm of MODWT in the deep network layer and the algorithmic methodology for calculating the membership function (MF) and applying rule weights by transferring the values delivered in the intermediate layer to the ANFN layer.
In the existing FC layer, the received feature value was weighted for each channel to obtain a linear sum using the desired number of output channels. While the existing method for obtaining the desired output by applying weights to nonlinear channel information was also valid, we sought higher predictions by leveraging fuzzy layers that could handle nonlinearities more appropriately.
Figure 2 shows the proposed method for converting the CW signals obtained through radar into an ECG signal. Obtaining ECG-related information from radar signals in the time domain was insufficient. Thus, we converted them into two-dimensional image data in the time–frequency domain to extract ECG information included in the low-frequency band. Afterwards, the combined model of CNN and Bi-LSTM was employed. To generate the inference using the fuzzy concept rather than conventional linear methods of nonlinear feature channel data, we obtained reconstructed ECG signals by replacing the fully connected layer with an ANFN layer. Here, the fuzzy c-means (FCM) clustering method in the ANFN layer was used to efficiently compress a number of received channel data.
3.1. MODWT (Maximum-Overlap Discrete Wavelet Transform) Layer
The MODWT is an extended transformation of the discrete wavelet transform (DWT) that can represent data in the time domain as multi-resolution-like spectrograms, scalograms, etc. The MODWT can also be applied without limitation to the signal length, unlike DWT. By overlapping signal sampling, a high-resolution time–frequency representation can be obtained. In addition, it has a shift variance for time movement; thus, it can be used for noise removal or voice feature extraction. The MODWT can be converted through the scaling filter and the wavelet filter, as shown in Equations (1)–(4) below, depending on each scale level and the index of the filter coefficient.
The signal converted by the above method can be returned to the original signal through inverse transformation. The standard algorithm for MODWT implements direct cyclic synthesis in the time domain. The MODWT implementation in our experiment performed a circular convolution in the Fourier domain. The wavelet and scaling filter coefficients at level j were calculated by taking the inverse discrete Fourier transform (DFT) of the product of the DFTs. The DFT of the product was the DFT of the signal and the DFT of the j level wavelet or scaling filter. The MODWT has a fixed-frequency band, so it may not be sensitive to nonlinear changes in the signal. However, for ECG reconstruction, in this study, the purpose was to extract heart information in the low-frequency band. For this reason, we used the MODWT, which enabled multiple-resolution analysis and allowed the easy separation of the desired frequency band.
3.2. CNN and Bi-LSTM Model
The CNN is a technique for extracting features of image or time-series input data through a convolutional filter. As shown in Equation (5), where X is the input data, W is the filter matrix, and b is the bias value, the window filter of the set size moves to perform a convolution, and a feature map is output with channels as the number of filters. The output feature map emphasizes nonlinearity through normalization and activation functions.
We designed a hybrid convolutional autoencoder and a Bi-LSTM network to reconstruct the ECG signal. The first one-dimensional (1D) convolutional layer filtered the signal. Then, the convolutional autoencoder removed most of the high-frequency noise and captured the high-level patterns of the entire signal. Furthermore, the transposed 1D convolution layer was used to upsample 1D feature maps in the final stage of the CNN. The convolution operation downsampled the input by applying a sliding convolution filter to the input. By flattening the input and output, the convolution operation was computed by the convolution matrix and the bias vector that could be derived from the layer weights and biases. Similarly, the transposed convolution operation upsampled the input by applying a sliding convolution filter to the input.
The Bi-LSTM is a model that learns the bidirectional dependencies of time-series data, and extended features can be obtained because the LSTM is applied in both directions. As shown in Equations (6)–(11), where W indicates the input weights, R is the recurrent weight, and b is the bias, this model consists of an oblivion gate that determines whether to exclude cell information from the previous time period and an input and output gate. The role of the Bi-LSTM layer in this paper is to further refine the signal details.
The Bi-LSTM should specify the number of hidden units. Eight units are used in this paper. The number of hidden units corresponds to the amount of information that the layer maintains between each time step. The hidden state can contain information from all previous time steps, regardless of the sequence length. If the length of the hidden units is too long, the layer may overfit the training data. The hidden state does not limit the number of time steps that the layer processes in one iteration.
3.3. ANFN (Adaptive Neuro-Fuzzy Network) Layer
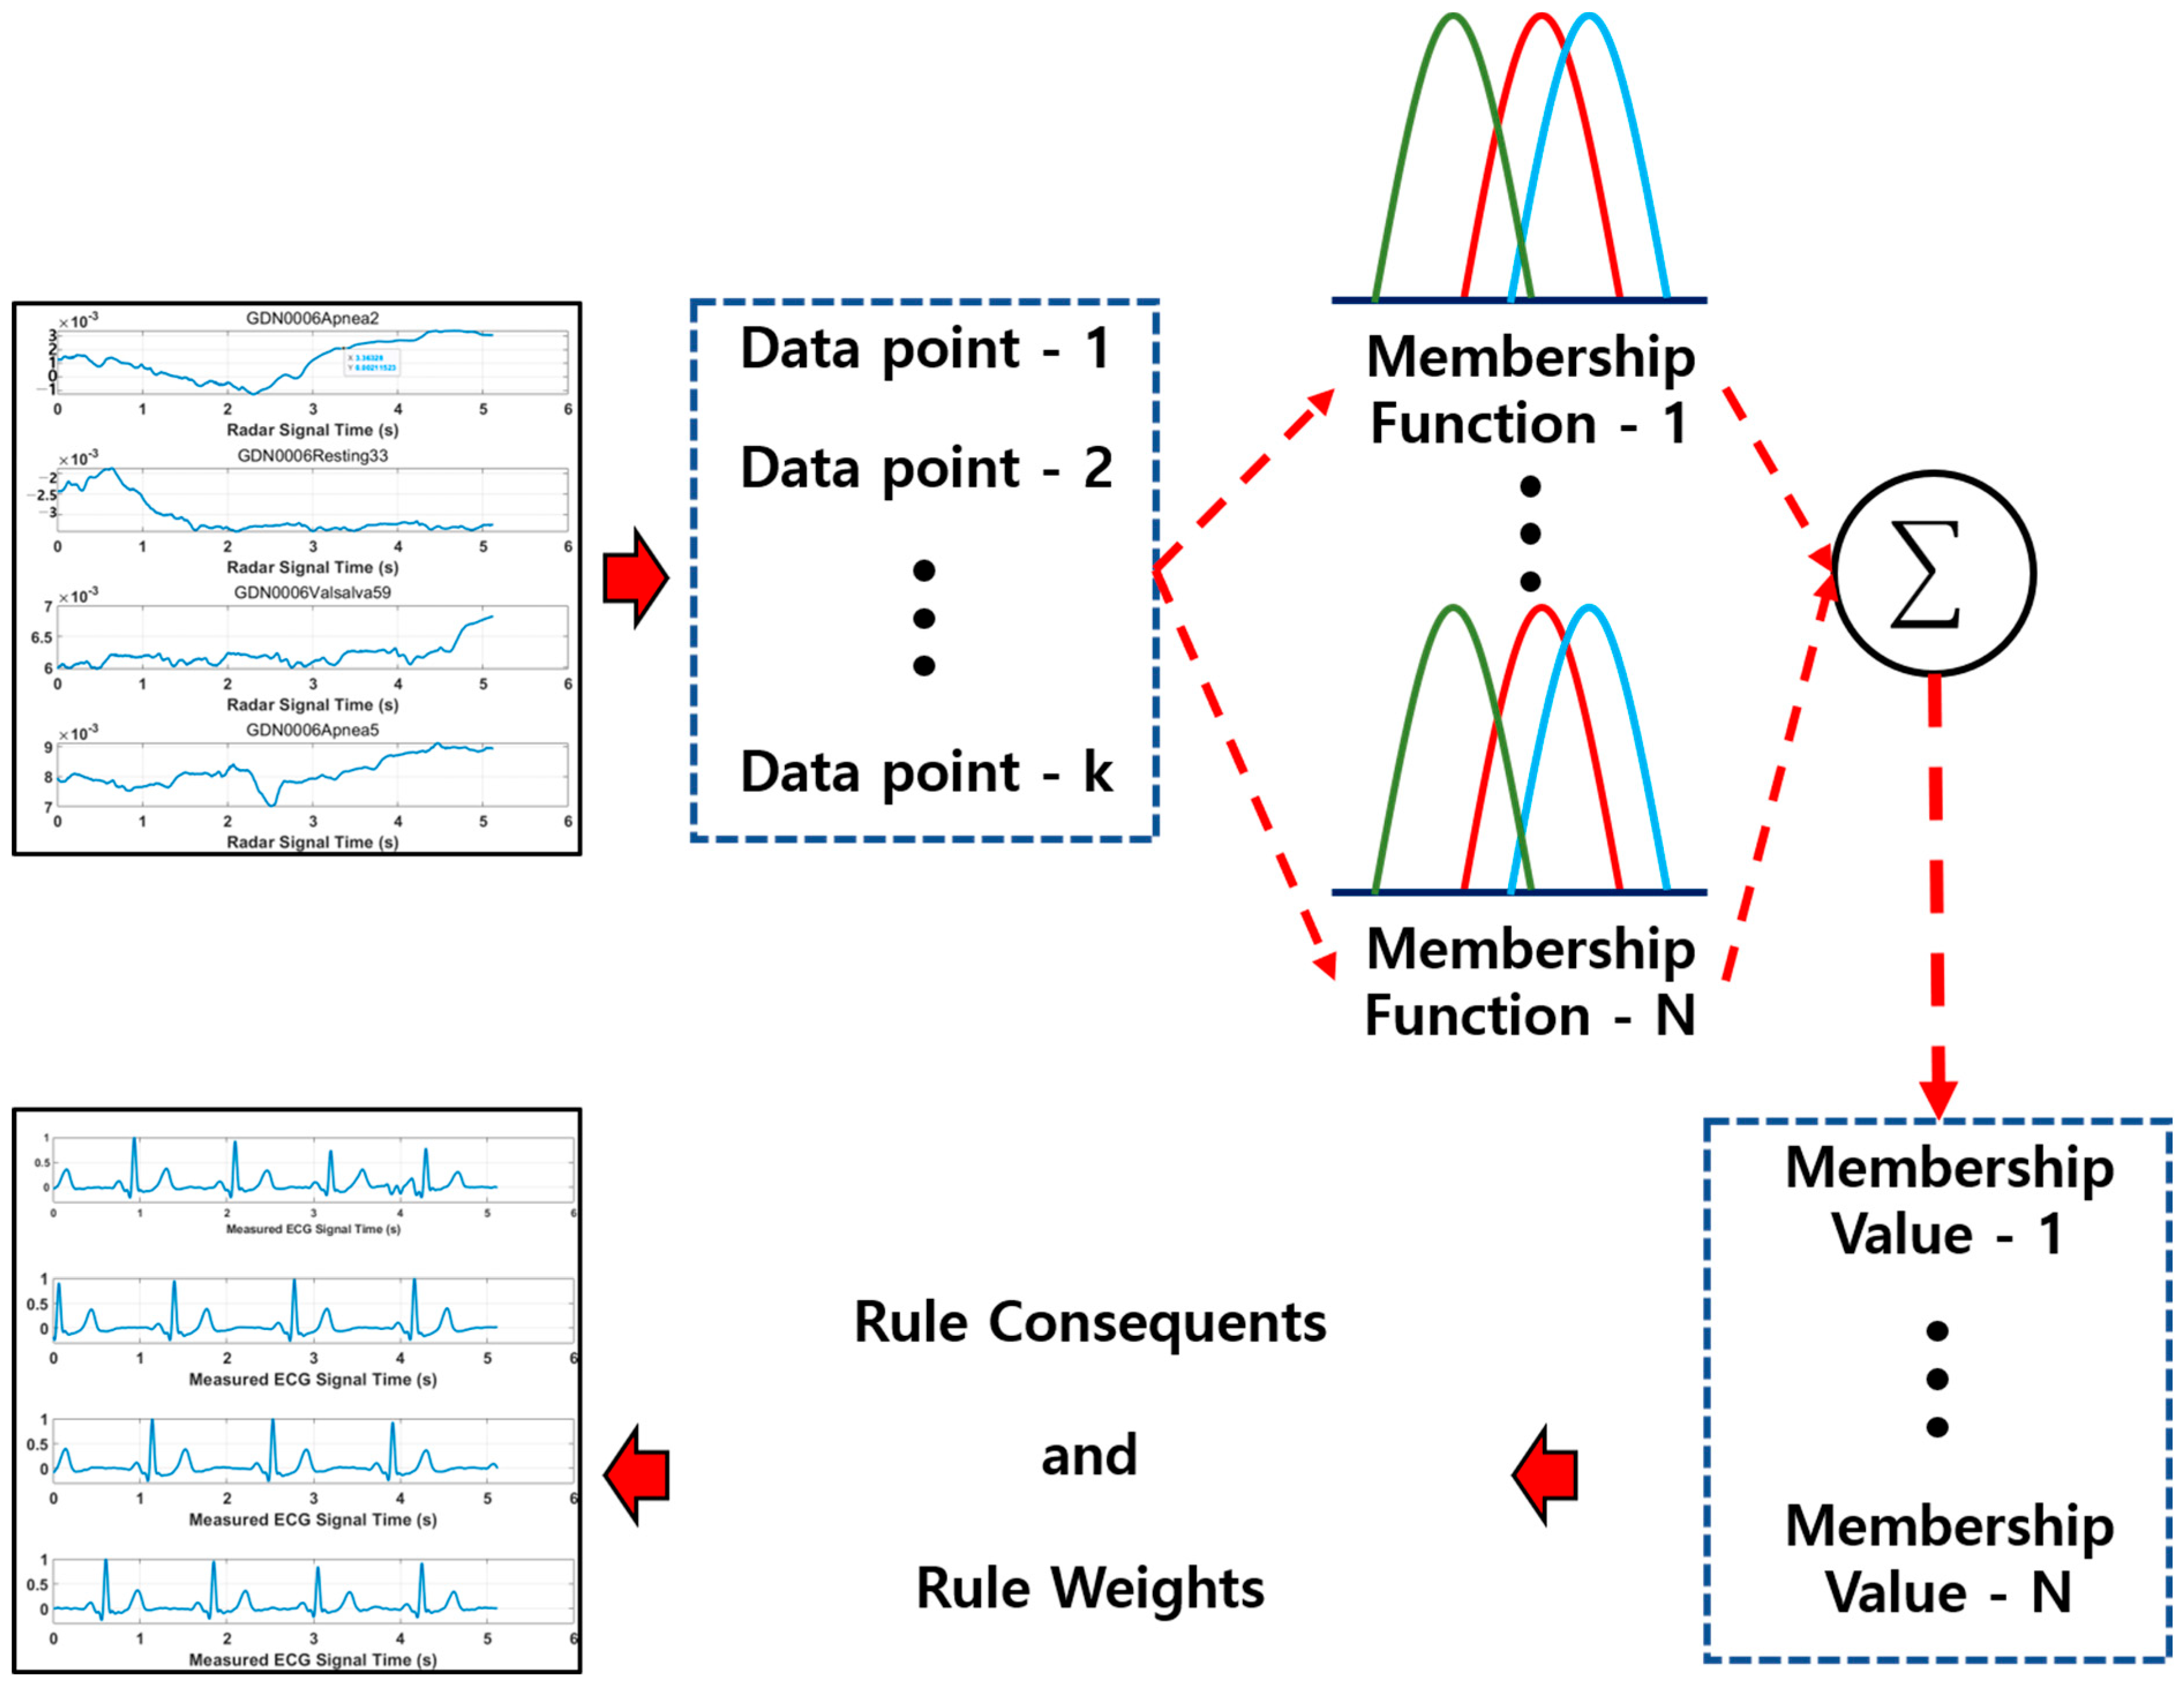
Deep learning extracts nonlinear features from large-scale input data and transforms them into high-dimensional feature channels. However, the transferred data are cumbersome to handle in general fuzziness, creating problems in the course of the dimension and increasing amount of computation. The fuzzy c-means (FCM) clustering method can be used to estimate appropriate clusters with the transferred data and compress them to the desired number of output channels. The FCM algorithm is one of various data clustering techniques, representing the degree to which a data point belongs to each cluster as a probability, and it generates a rule value by synthesizing the probability of belonging to the set clusters. As shown in
Figure 3, the clusters are generated for each input data channel using FCM clustering. The data point expresses the membership value to which it belongs to the cluster for each channel as the probability of a real number between 0 and 1. This represents to which cluster each data point belongs to more strongly. The membership values are then leveraged to generate and learn the rules through rule consequents and rule weights, and the final output is calculated. The output value calculates the loss value with the MSE (mean square error) compared to the actual ECG and updates the training parameters contained in CNN and Bi-LSTM with an ANFN layer. The pseudo-codes of the ANFN are described in Algorithm 1.
| Algorithm 1. Pseudo-code of ANFN |
- 1:
Initialization: center, sigma, ruleConsequents, ruleWeights - 2:
X = feature data propagated by the Bi-LSTM - 3:
NormalizedData = (X − min(X))/(max(X) − min(X)) - 4:
For C = 1:numClusters - 5:
sig = sigma(C,:), cnt = centers(C,:) - 6:
Distance = NormalizedData − cnt, Membership = 0 - 7:
SquaredDistance = sum(Distance), Squaredsig = sig2 - 8:
For K = 1:input_channel - 9:
Membership = Membership + exp(-SquaredDistance/(2 × Squaredsig(K))) - 10:
End - 11:
MembershipValues(k) = Membership - 12:
End - 13:
ruleOutput = MembershipValues × ruleConsequents - 14:
weightedSum = sum(ruleOutput × ruleWeights) - 15:
sumWeights = sum(ruleWeights) - 16:
finalOutput = weightedSum/sumWeights - 17:
loss = mse(finalOutput,trueSignal) - 18:
Update of weights and biases in the CNN and Bi-LSTM center, sigma, ruleConsequents, ruleWeights in the FAL
|
4. Experimental Results
In this section, we evaluate the performance of an end-to-end model designed to convert a CW (continuous-wave) radar signal recorded in a non-contact manner into an ECG through frequency decomposition and feature extraction from the public dataset. The performance of the proposed model is compared with the conventional CNN with an FC (fully connected) layer through the mean square error (MSE). The compared deep learning networks generate complex nonlinear features from the input data, and the FC layers derive the final classification results by applying weights to these features. However, this approach does not fully reflect the interaction between the feature channels, potentially overlooking important relationships, and has the disadvantage of limiting nonlinearity. Therefore, the proposed method can preserve the relationships between the input channels and improves the nonlinear data-processing power, enabling a more accurate reconstruction.
The synchronized radar ECG dataset consisted of synchronized data collected over 24 h through a CW radar and a reference device, the Task Force Monitor 3040i from CNSystems Medizintechnik GmbH (Graz, Austria) [
20]. The equipment operated at 24 GHz in the ISM band based on a six-port technology. For efficient learning, a portion of the data acquired (data from 6 subjects out of 30 healthy subjects) were used. All subjects were required to complete a questionnaire on epidemiological data such as age, sex, weight, and medical history. In addition, the condition of the subjects was briefly checked by examining their blood pressure, heart rate, and heart sounds. If all the criteria were confirmed to be positive, the subject was included in the study, and their measurements were made available. This had been based on the six-port technology but was expanded into individual components to become a portable radar system.
Figure 4 shows the CW radar signal and the corresponding ECG signal. We can recognize that it is almost impossible to identify any correlation between the CW radar signals and the corresponding reference ECG measurements.
We used an Adam optimizer and chose to shuffle the data at every epoch for 600 epochs as the training option parameters. The first convolution1dLayer was replaced by an MODWT layer. The MODWT layer was configured to have the same filter size and number of output channels to maintain the same number of learning parameters. Based on our previous observation, only components in a certain frequency range were kept. Instead of the conventional FC layer, we replaced the ANFN layer based on FCM clustering to effectively process the nonlinear characteristics and have a robust processing power for ambiguous results. Here, FCM clustering was selected for processing a high-dimensional representation. The rules were generated by the membership value of the input data point, and then the weights were obtained so that each rule could make a valid decision through the ANFN.
Figure 5 shows the membership function of each input channel. We could obtain a higher accuracy compared to conventional linear processing by learning the center value, the sigma value of each MF, and the shape through the ANFN layer.
Figure 6 shows some samples of reconstructed ECG signals and measured ECG signals. As shown in
Figure 6, it can be confirmed that the proposed method predicted the pattern of the heart rate more accurately.
Figure 7 compares the ECG signal reconstructed by the proposed model from CW radar signals recorded in a non-contact manner and the measured ECG signals. As shown in
Figure 7, the experimental results reveal that the proposed deep learning model showed a good reconstruction performance with a small loss.
To evaluate the performance of the proposed method, we used three measures: the MSE, the SNR, and the PSNR. Firstly, the MSE is the average obtained by squaring the difference between the original signal and the reconstructed signal. A lower MSE indicates a better reconstruction performance, while a higher MSE reflects a poorer performance. The SNR represents the ratio between the strength of the signal and the noise. A high SNR indicates a good quality of the reconstruction signal, while a low SNR indicates a poor quality. Finally, the PSNR calculates the peak signal-to-noise ratio between the original signal and the reconstructed signal. This ratio is often used as a quality measure between two signals: the higher the PSNR, the better the quality of the reconstructed signal.
As a result of comparing the loss values through the MSE, the conventional CNN with only the FC layer showed an average loss value of 0.0138, while the proposed model with ANFN layer recorded a lower loss value of 0.010.
Table 1 lists the performance of the previous two models and the proposed model. As listed in
Table 1, the SNR was 7.514 and the PSNR 18.909 for the signal reconstructed using the existing deep network with only the FC layer. Meanwhile, the deep network with the ANFN layer showed a better performance than the previous models, with an SNR of 9.023 and a PSNR of 20.418.
Figure 8 and
Table 1 show the MSE histograms and the performance table of the predicted ECG signals obtained using the proposed model, respectively. As shown in
Figure 8 and
Table 1, the design of the deep learning model with an FC layer exhibited a higher error distribution compared to the other methods. The model combining the MODWT and deep learning with FC layers showed the most moderate error distribution out of all three methods. Finally, the proposed model with MODWT and ANFN layers demonstrated the lowest error distribution, indicating a superior reconstruction performance with less deviation from the original signal in comparison to the previous two methods.
As a result, in order to reconstruct an ECG signal from a CW radar signal, it is essential to check changes in the frequency domain alongside conducting an analysis in the time domain. Therefore, the reconstruction performance was the lowest when the MODWT was not used. On the other hand, the existing FC method based on the MODWT was sufficiently effective. However, when the FC layer was replaced with an ANFN layer, we achieved reconstruction stability by maintaining the nonlinear characteristics seen in deep learning. Therefore, the proposed method demonstrated that a nonlinearity process through an ANFN layer was more effective than through an FC layer.


