1. Introduction
The construction of resilient cities is governed and guided by the complex discipline of urban planning (UP). With the aim to elevate the quality of life for residents, it mainly focuses on the planning, management, and physical arrangement of cities, neighborhoods, and metropolitan areas. It contributes significantly to the preservation and improvement of communities by making sure that any new construction or changes take into account their unique qualities. Depending on its application, UP can deal with a wide range of problems [
1]. Despite that, UP plays an important role in implementing climate change adaptation and mitigation techniques, such as the use of sustainable materials, the establishment of green areas, and water management, in response to the rising attention that environmental problems are receiving [
2,
3,
4]. From this point of view, innovative technologies and digital transformations are necessary to guarantee the optimization of territorial management. The most widespread technologies in this field, today, are building information modeling (BIM) and geographic information systems (GIS). As is known, BIM models provide a very rich data source for properties related to all building elements, which are unavoidable components of any construction project, while descriptive information (e.g., transportation network, resource location) is used in GIS to model temporary structure components, reduce transportation and logistics costs, and many other applications. For these and many other reasons, therefore, the need to merge these two models is growing more, and many efforts in terms of scientific research have been made in this direction [
5,
6,
7,
8,
9].
In fact, the integration between BIM and GIS makes it possible to combine geographic information with BIM models, creating an environment in which it is possible to visualize and analyze both the geographical and physical characteristics of the area under study (with particular attention to the planning phase). Furthermore, it can provide advanced geographical analysis to optimize urban planning and management of pre-existing infrastructures or evaluate the impact of infrastructures on a specific area [
10,
11,
12,
13]. In the context of UP, this connectivity can also help with maintenance planning, demand forecasting, and health monitoring of the buildings. By combining both systems, the advantages of both technologies may be further realized [
14,
15,
16,
17].
2. Background
In the literature, interoperability problems between BIM and GIS models are of particular interest, and in recent years, it has become possible to find numerous contributions focusing on applications where the connection between the two environments is necessary. Some interesting solutions have been achieved recently: Karan et al. (2016) [
18] explored an alternative method to generate a digital model of the site terrain morphology, where remote sensing data are applied in GIS studies. Isikdag et al. (2008) [
19] explored the suitability of BIM in a geospatial context to enhance data control in site selection and fire response management processes. Having a three-dimensional representation of the structure and its environs would therefore allow for managers to efficiently design a site layout and identify optimal locations for temporary structures. Irizarry and Karan (2012) [
20] presented an original approach for integrating GIS and BIM that allows for executives to examine a 3D depiction of tower cranes in their optimal positions.
As known, transferring data from BIM to GIS or vice versa poses challenges, having the necessity to consider both the format and the meaning of the data present in the two technologies. Current cutting-edge BIM (or GIS) tools facilitate data interchange between systems using a standardized data format [
21]. For this reason, to fully integrate GIS and BIM, it is necessary to provide interoperability at the semantic level and many studies are proceeding in this direction [
22]. Moreover, an additional option that is currently being investigated takes a realistic approach to overcome this constraint by using the original IFC and CityGML schemas inside a single database known as the Integrated BIM-GIS Database (BIGI-D). According to this conceptual paradigm, the phrase “integrated database” does not refer to a single, uniform database, but rather to a coherent technical environment that permits the use of data from both sources in various applications [
23].
From an exclusively visualization point of view, the problem could be tackled in a completely separate way, using virtual reality techniques that, while solving the various problems still present today in the BIM/GIS integration, remain always virtual systems with all the limitations they bring with them. In this regard, it is noted that the use of virtual/augmented/mixed reality (VR/AR/MR) apps in the context of UP offers numerous advantages and opportunities [
24,
25]. In the scientific literature, the use of these emerging technologies in UP and in the creation of so-called smart cities is widely discussed; in fact, the capabilities of VR/AR/MR are presented in facing the current challenges in the creation, modeling, and visualization of smart cities through the modeling of materials and the simulation of light in a VR environment [
26]. Such studies can aid planners, stakeholders, and communities to better understand the role of planning policies in the development of an intelligent and sustainable city, particularly in the early design phases (but also in the monitoring phases [
27]). The significant roles of tools, such as VR/AR/MR, in meeting the real-time simulation and visualization requirements for smart cities are emphasized in the literature [
28,
29,
30,
31].
Others emerging tools in the field are web-based platforms like Cesium [
32,
33]. Whether examining satellite photos, topographical data, or point cloud information, Cesium provides the performance and versatility required to handle a wide range of geospatial datasets. Moreover, users may include dynamic or real-time data (very important in the context of UP) into their applications thanks to Cesium’s flexibility and possibility to integrate several data sources and services in a unique environment. This makes it possible to create dynamic, current geospatial visualizations and simulations that are accessible and shareable across many devices. Although this technology has shown great promise, there is currently a dearth of knowledge on its integration with 3D models (BIM or restitutions from Lidar, laser scanner, or drone survey) [
34,
35]. Despite that, Cesium is another system that makes use of 4D, or three spatial dimensions plus time. It is capable of detecting moving objects, displaying environmental changes, and handling time-varying data, such as those from satellite or drone photography. The applications of this system are numerous, like tracking traffic patterns, natural disasters, and urban development.
An important field for geospatial research and visualizations is, in fact, 4D geospatial data. The significance of 4D web-based geographic information systems (WebGIS) for displaying time-varying geospatial data, for example, is discussed by Resch, B. et al. [
36], especially for educating decision-makers about coastal development. In their paper, authors draw attention to the difficulties in integrating temporal data into web-based geo-visualization tools and the necessity of a good user-friendly interface to prevent extremely abstract (aleatory) and difficult-to-understand representations. Koziateck [
37] instead concentrates on the creation of geosimulation techniques for simulating the spatiotemporal dynamics of changes in 4D vertical urban growth, demonstrating the importance of 4D geospatial data in the development and advancement of UP for sustainable cities.
In this framework, the proposed research focuses on the construction of the 3D model of a building in BIM (Autodesk Revit) starting from the initial phase of the survey and its subsequent integration into the GIS (ArcGIS) through the commercial software Autodesk Infraworks, highlighting the pros and cons of its use. Subsequently, the information available is managed through a suitable experimental app created by the authors, highlighting the advantages that it offers both to the user and to the manager. The app obviously makes it possible to solve the problem of integration exclusively from the point of view of visualization, since it is precisely a matter of virtual reality, but it has numerous advantages related to its practical use, as well as the commercial software which, while allowing for the correct visualization of the BIM element in a georeferenced environment, still does not allow for complete integration due to the loss of information during the transfer of the 3D model to the GIS environment. For this reason, a strategy, still under study, is proposed through which it is possible to use the open-source platform Cesium ion to better integrate 3D data in a multi-layer environment, to build an interactive 3D–4D geospatial map. The proposed solution consists in adding to the standard primitives present in the Cesium libraries a software module (JavaScript), suitably implemented, capable of converting the IFC file of the BIM model into a compatible file to be then displayed in CesiumJS (geospatial layer viewer). Although there may still be several problems still present today in relation to the transfer of IFC files to CityGML, the method seems to be very promising, allowing for temporal visualizations. Other examples of customizable libraries will also be proposed, such as that of deck.gl, which is newer than Cesium.
The present work, therefore, clearly aims to emphasize the innovative aspects of the integration of these two technologies, highlighting how this integration contributes to the advancement in theoretical and practical knowledge on digital twin technologies. The innovation of the system lies in showing the methodology to create a complete, free, and open-source system useful for the urban planning of sustainable cities.
3. Materials and Methods
The research activity involves the creation of a three-dimensional BIM model of a structure starting from the exterior laser scanner survey and from interior surveys (DWG plan of the building). Having completed the modeling phase of the present condition, we move on to modeling the project state, consisting of various energy efficiency and seismic improvement interventions (including the insertion of an external coat, a photovoltaic system, and renovation of the roof). In the context of urban sustainability, the main focus of this article, in fact, is to show a practical example of the requalification of a city building using innovative methodologies of GIS and BIM integration. The process of importing the three-dimensional model into a GIS environment using Autodesk Infraworks software is outlined (very useful, even if limited, for practical applications). The next step is to use Microsoft HoloLens and the Unity 3D framework to construct a virtual, augmented, and mixed reality app. The aim is to address issues arising from the conventional software usage from a virtual standpoint. Subsequently, a methodology for establishing a hybrid and experimental system is suggested. Leveraging the Cesium ion platform, this system enables the potential integration of multi-scale information from both the BIM and GIS modeling software used. This is achieved by exploiting standard libraries (present in Cesium) suitably customized in the script code with a software module implemented by the authors capable of converting the typical export format of Revit 3D models (for example, .rvt or .ifc) into a format compatible with those readable by the CesiumJS viewer (such as .xml or CityGML). Below (
Figure 1) is a graphical workflow of all the work carried out:
3.1. 3D Model of the Building
3.1.1. Exterior
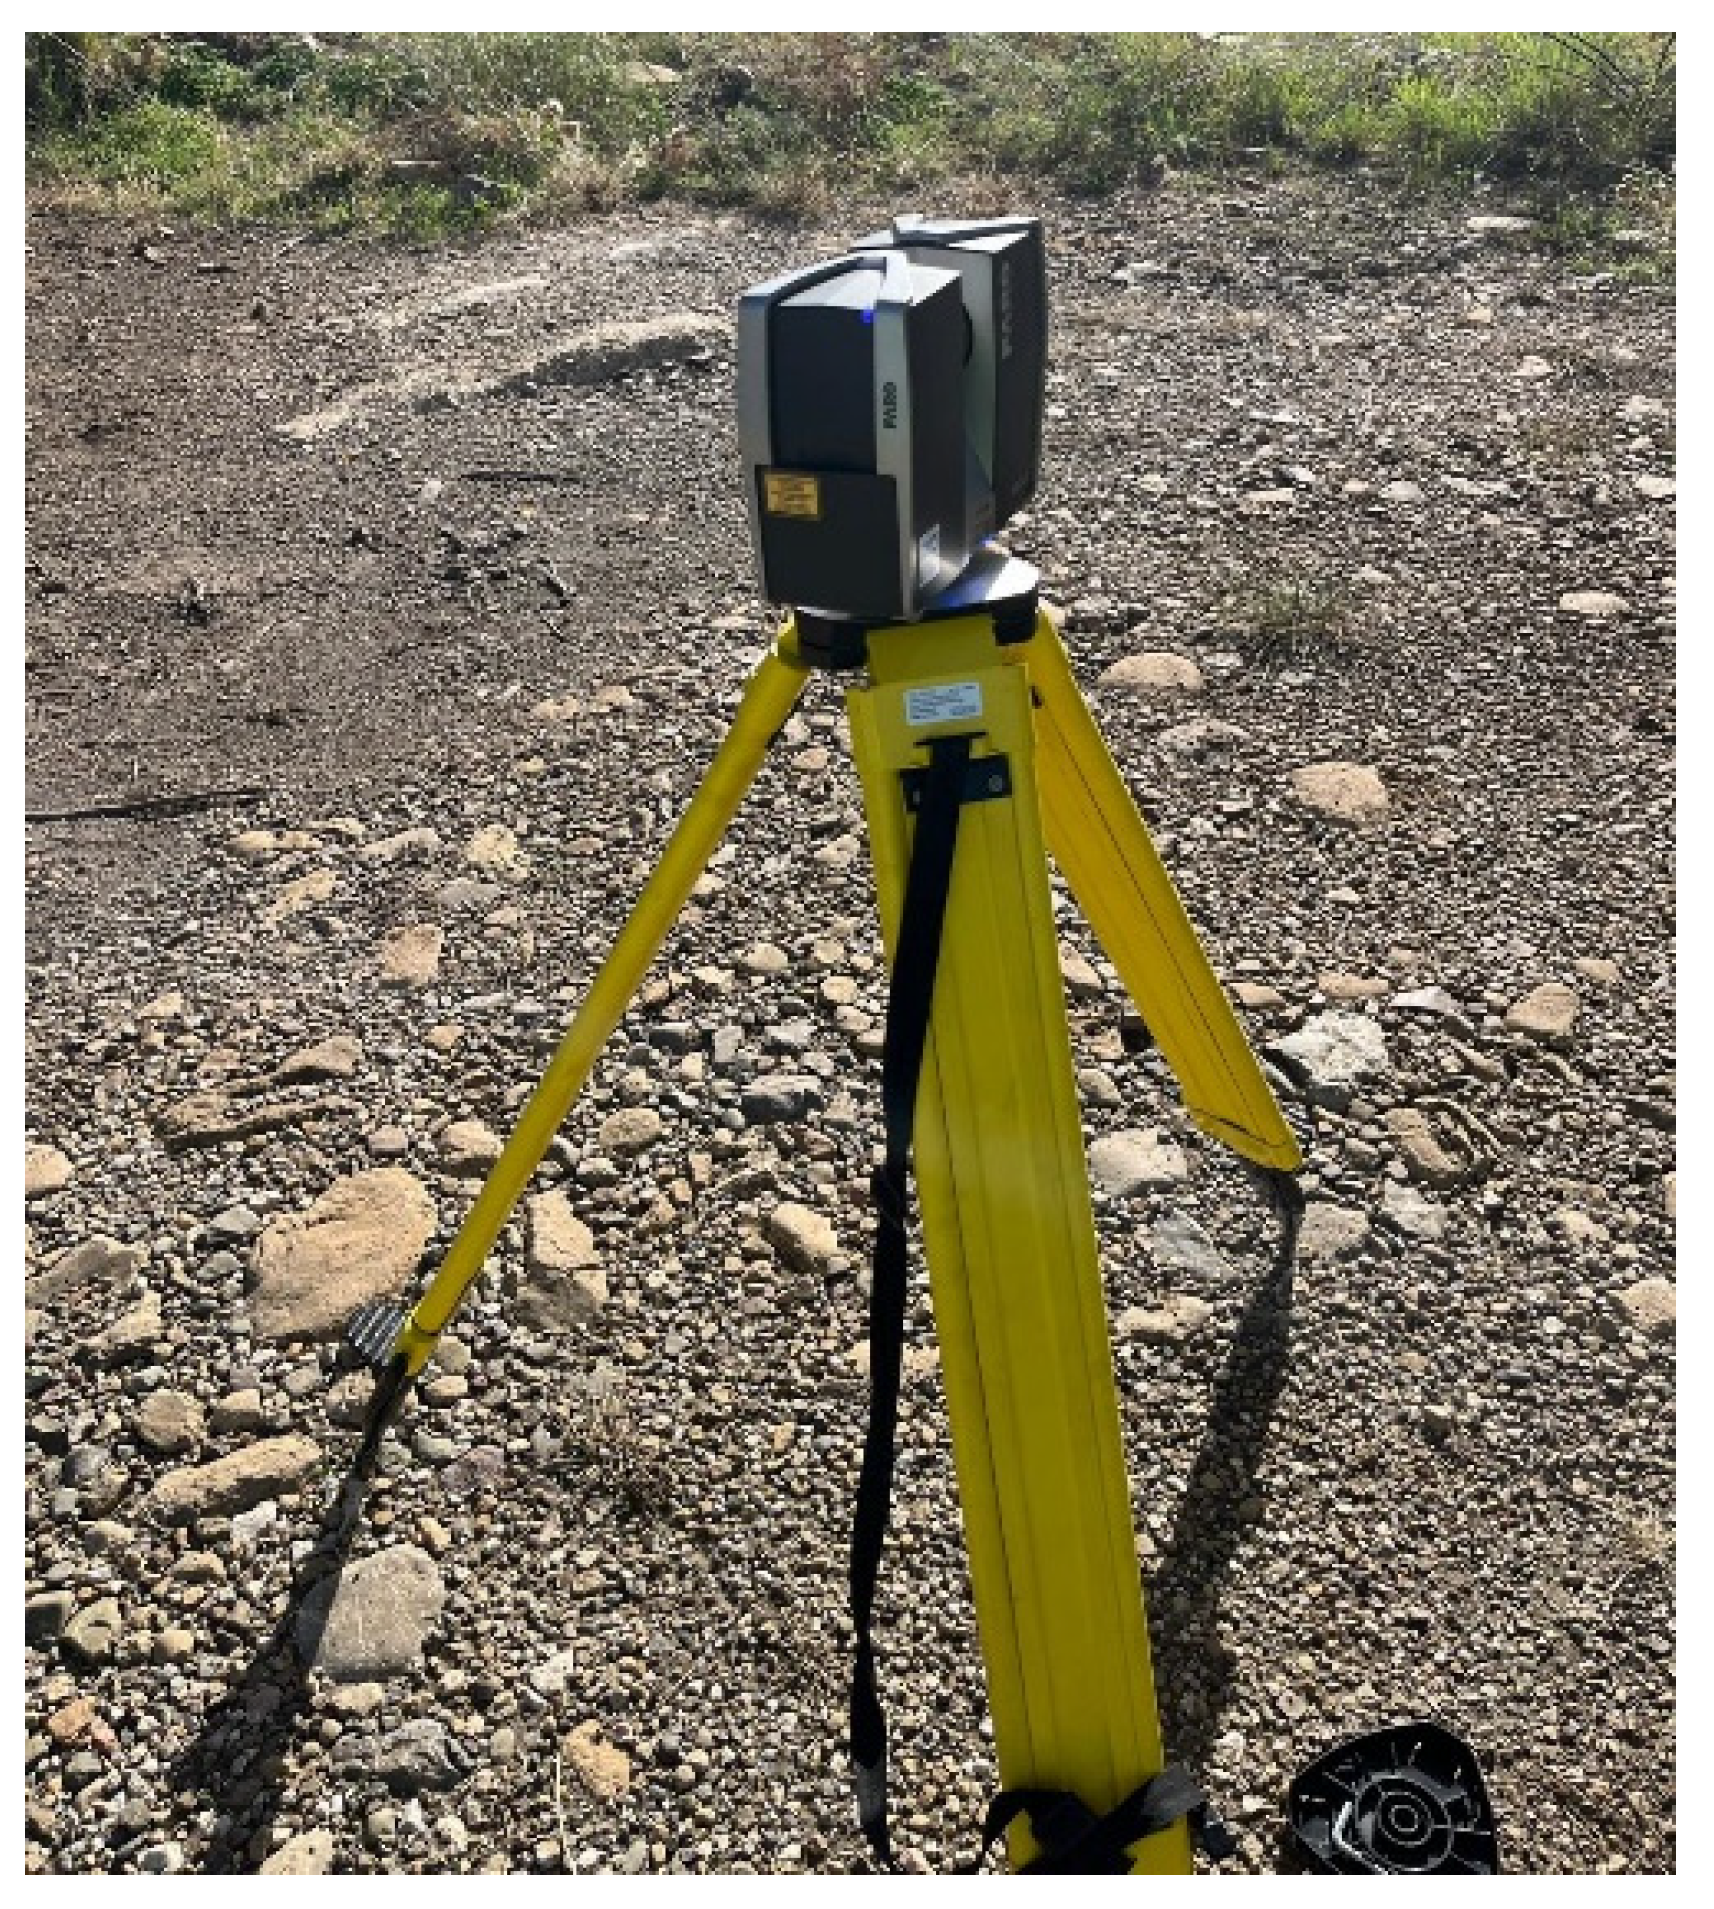
In projects where there are existing buildings, the acquisition of the relative structural conditions is often a critical operation. To overcome this problem, one of the frequently employed tools is a laser scanner, which allows for 3D points to be acquired with extreme precision on the surface of an existing physical object. In this research, a terrestrial laser scanner, FARO FOCUS (FARO Technologies, Inc., Lake Mary, FL, USA) (
Figure 2), is used for the survey phase: instrument equipped with an integrated GPS receiver, which represents a point of reference for 3D documentation and topographic surveys thanks to its ability to scan objects up to 70 m away.
Below (
Table 1), the technical specifications of the instrument are reported:
3.1.2. Interior
For the modeling of the interior, conversely, we proceed to carry out the survey to produce a DWG file to be imported into the BIM modeling software. To create the 3D model of the building’s interior, we started by importing the DWG file of the apartment plan, which had been previously created in AutoCAD. After positioning the building plan and selecting the appropriate level, we chose the walls from the “Architecture” section, ensuring they matched the specifications on site, including height and thickness. Indeed, Revit allows for aligning the walls with the contours of the DWG file, making the drawing process easier. In the same way as with the perimeter walls, we proceeded by inserting doors, windows, and floors, ensuring consistency with the conditions found on site.
Once the survey has been planned and carried out, “Faro Scene” software is used, and the point cloud acquired by the laser scanner is processed according to a standard methodology [
38,
39,
40]. In relation to the building in question, Autodesk Recap software is used for converting the point cloud format (.E57) into a format compatible (.rcp) with the software program Autodesk Revit, used for 3D modeling of the building. Once the file is exported in .rcp, the 3D model is created using Autodesk Revit.
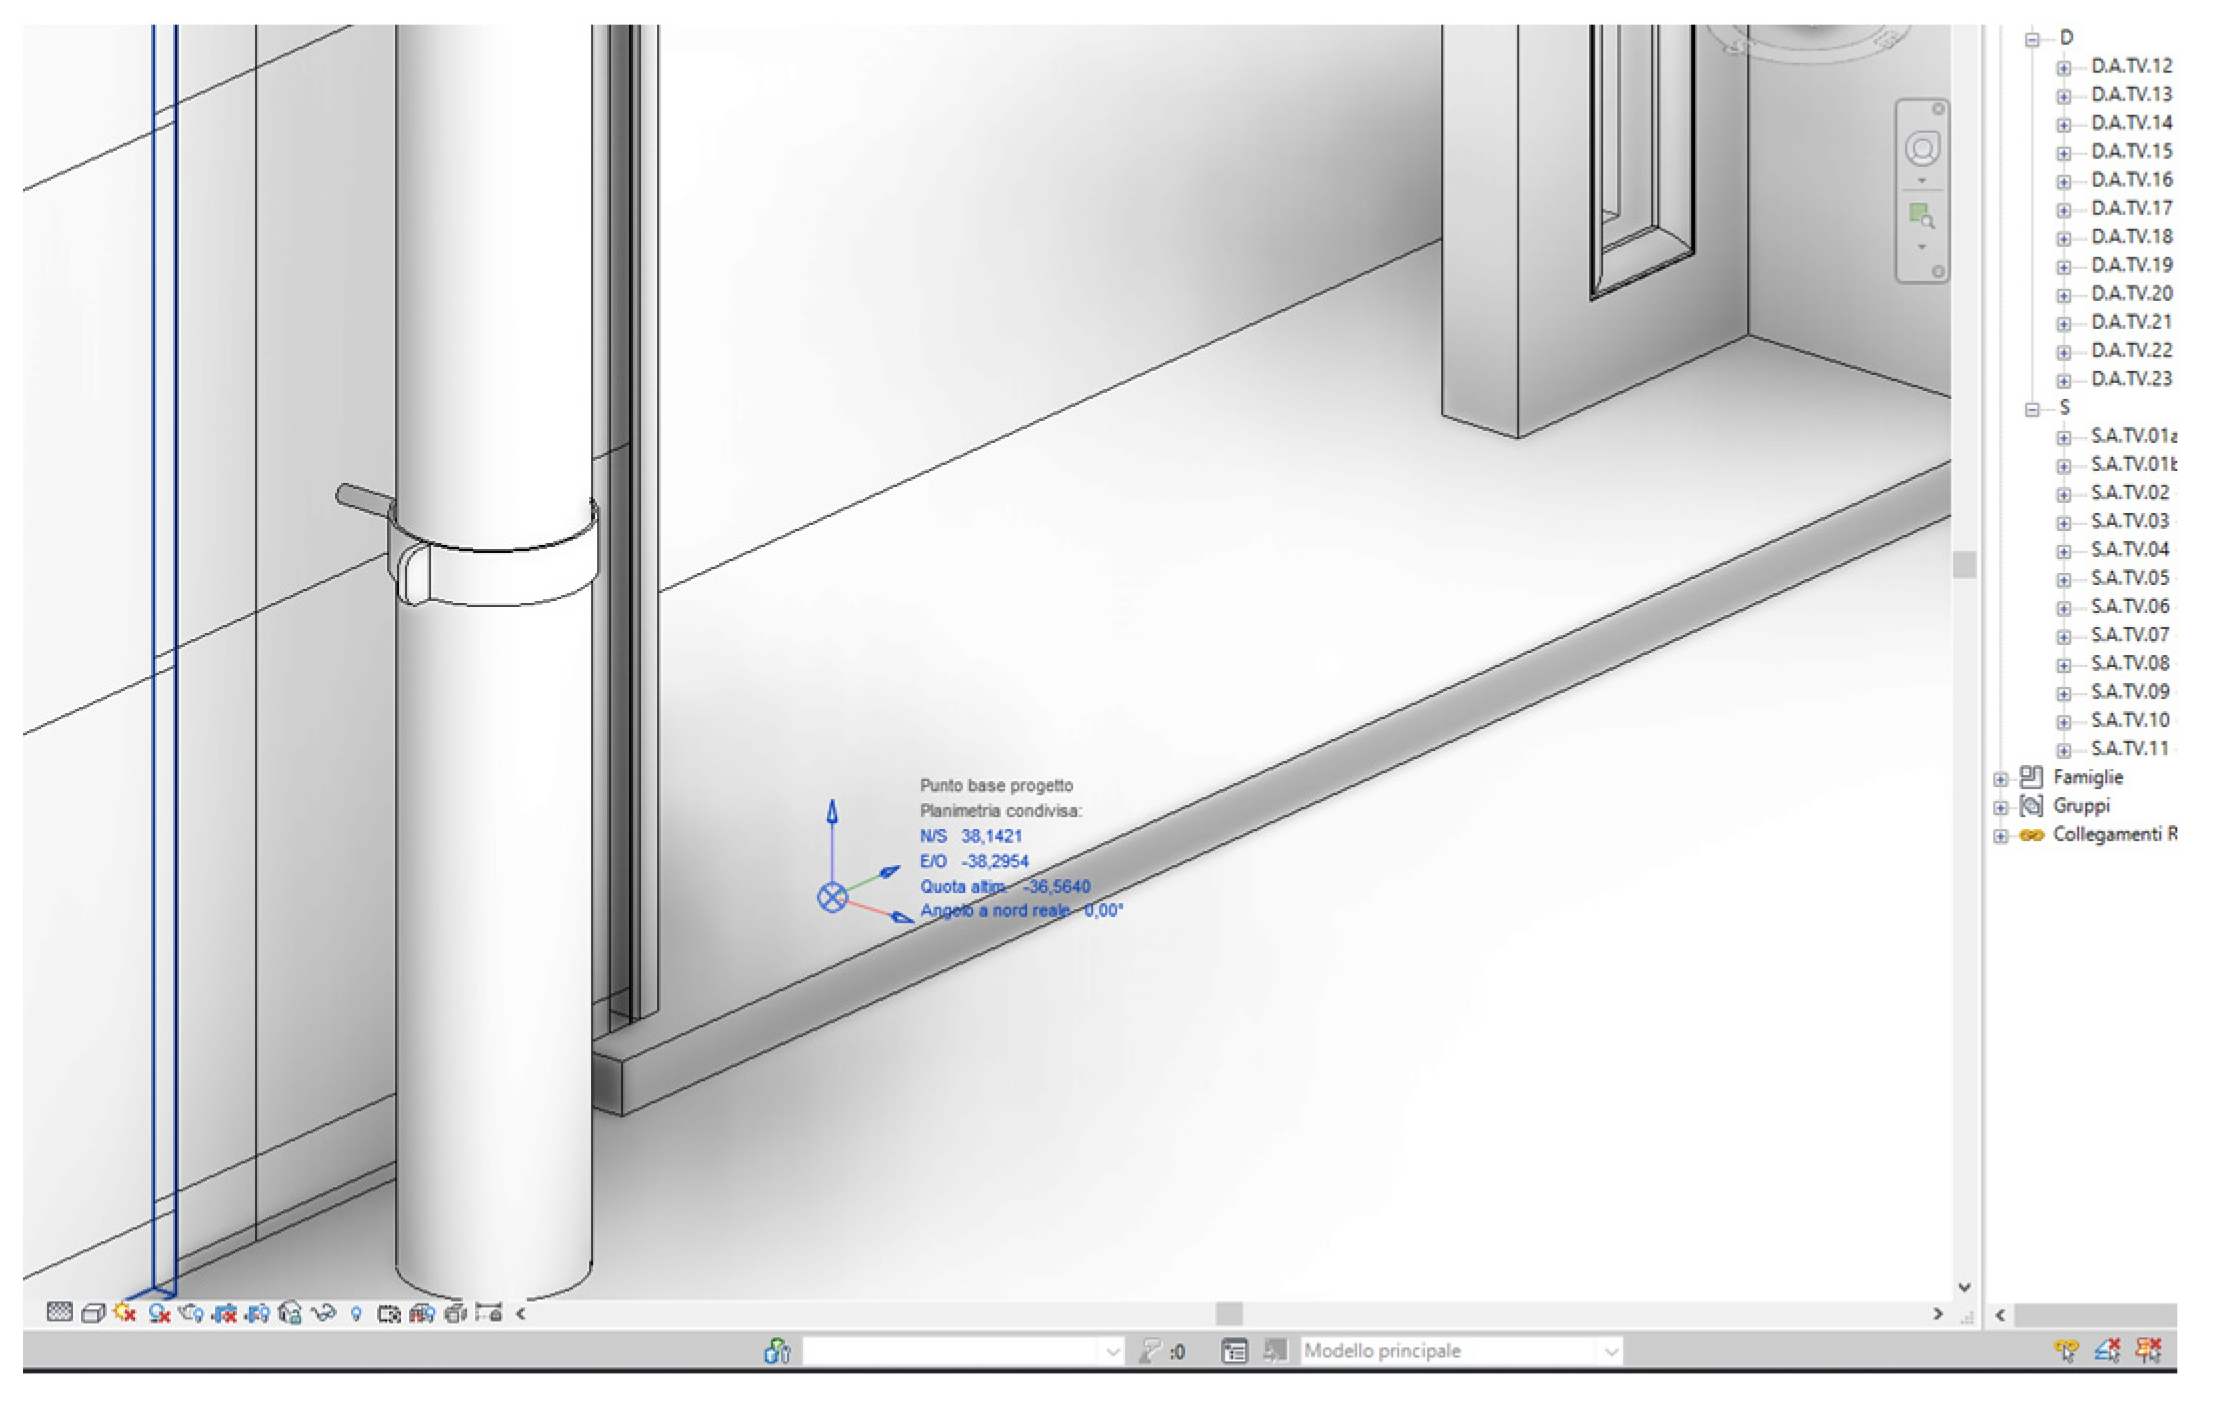
The commercial software Infraworks, which is used in the next phase, allows for users to import distinct types of digital records directly into the software if georeferencing information is available for those records. For this reason, a fundamental operation is the georeferencing of the model. Having opened the file containing the point cloud in Revit, the positioning is set to “Automatic: with shared coordinates” (
Figure 3): in Revit, it is assumed that the point cloud file’s coordinates are specified in the model’s coordinate system, [
41]. Thus, the point cloud origin aligns with the shared coordinates origin, accessible via the base survey point. The point cloud is oriented so that its north direction (0,1,0) matches true north in the Revit model. GIS coordinates are used to determine shared coordinates for different models such as the architectural, structural, and plant engineering models, ensuring the Revit model is correctly positioned relative to the site. These GIS coordinates define the model’s real position in latitude and longitude (WGS84). Revit also uses GIS data for energy analysis and when exporting models to other formats. Once this is completed, we move on to the architectural modeling phase, which initially envisages the modeling of the terrain on which the building rests and the subsequent construction of the model by positioning the generic construction components and by gradually adding more detailed components.
3.2. BIM and GIS Integration through Autodesk Infraworks
Autodesk Infraworks software (version 2023)is generally used to observe, model, and comprehend the project in its geographical context in order to integrate the information about the building model (BIM) and the geospatial information of the GIS environment [
42,
43]. By using Infraworks, which has the capacity to exchange and dynamically transmit data, it is feasible to build three-dimensional models of up to 200 km
2 of the study area. The suggested approach adds data layers as set features straight to Autodesk Infraworks models using Autodesk Connector for ArcGIS Pro 3.0. By using the ArcGIS login credentials, this utility allowed for the program to be connected to the ArcGIS data.
In this case, it is chosen to incorporate more detailed 3D models of the structures in the Infraworks project, in this region of interest, in order to meet any requirements pertaining to the territorial UP. Ultimately, positioning the model and defining its coordinate system, scale, and rotation allowed for its importation into Revit (
Figure 4). The ability to georeference digital data and 3D capabilities provides an interesting multi-scale environment that connects BIM and GIS.
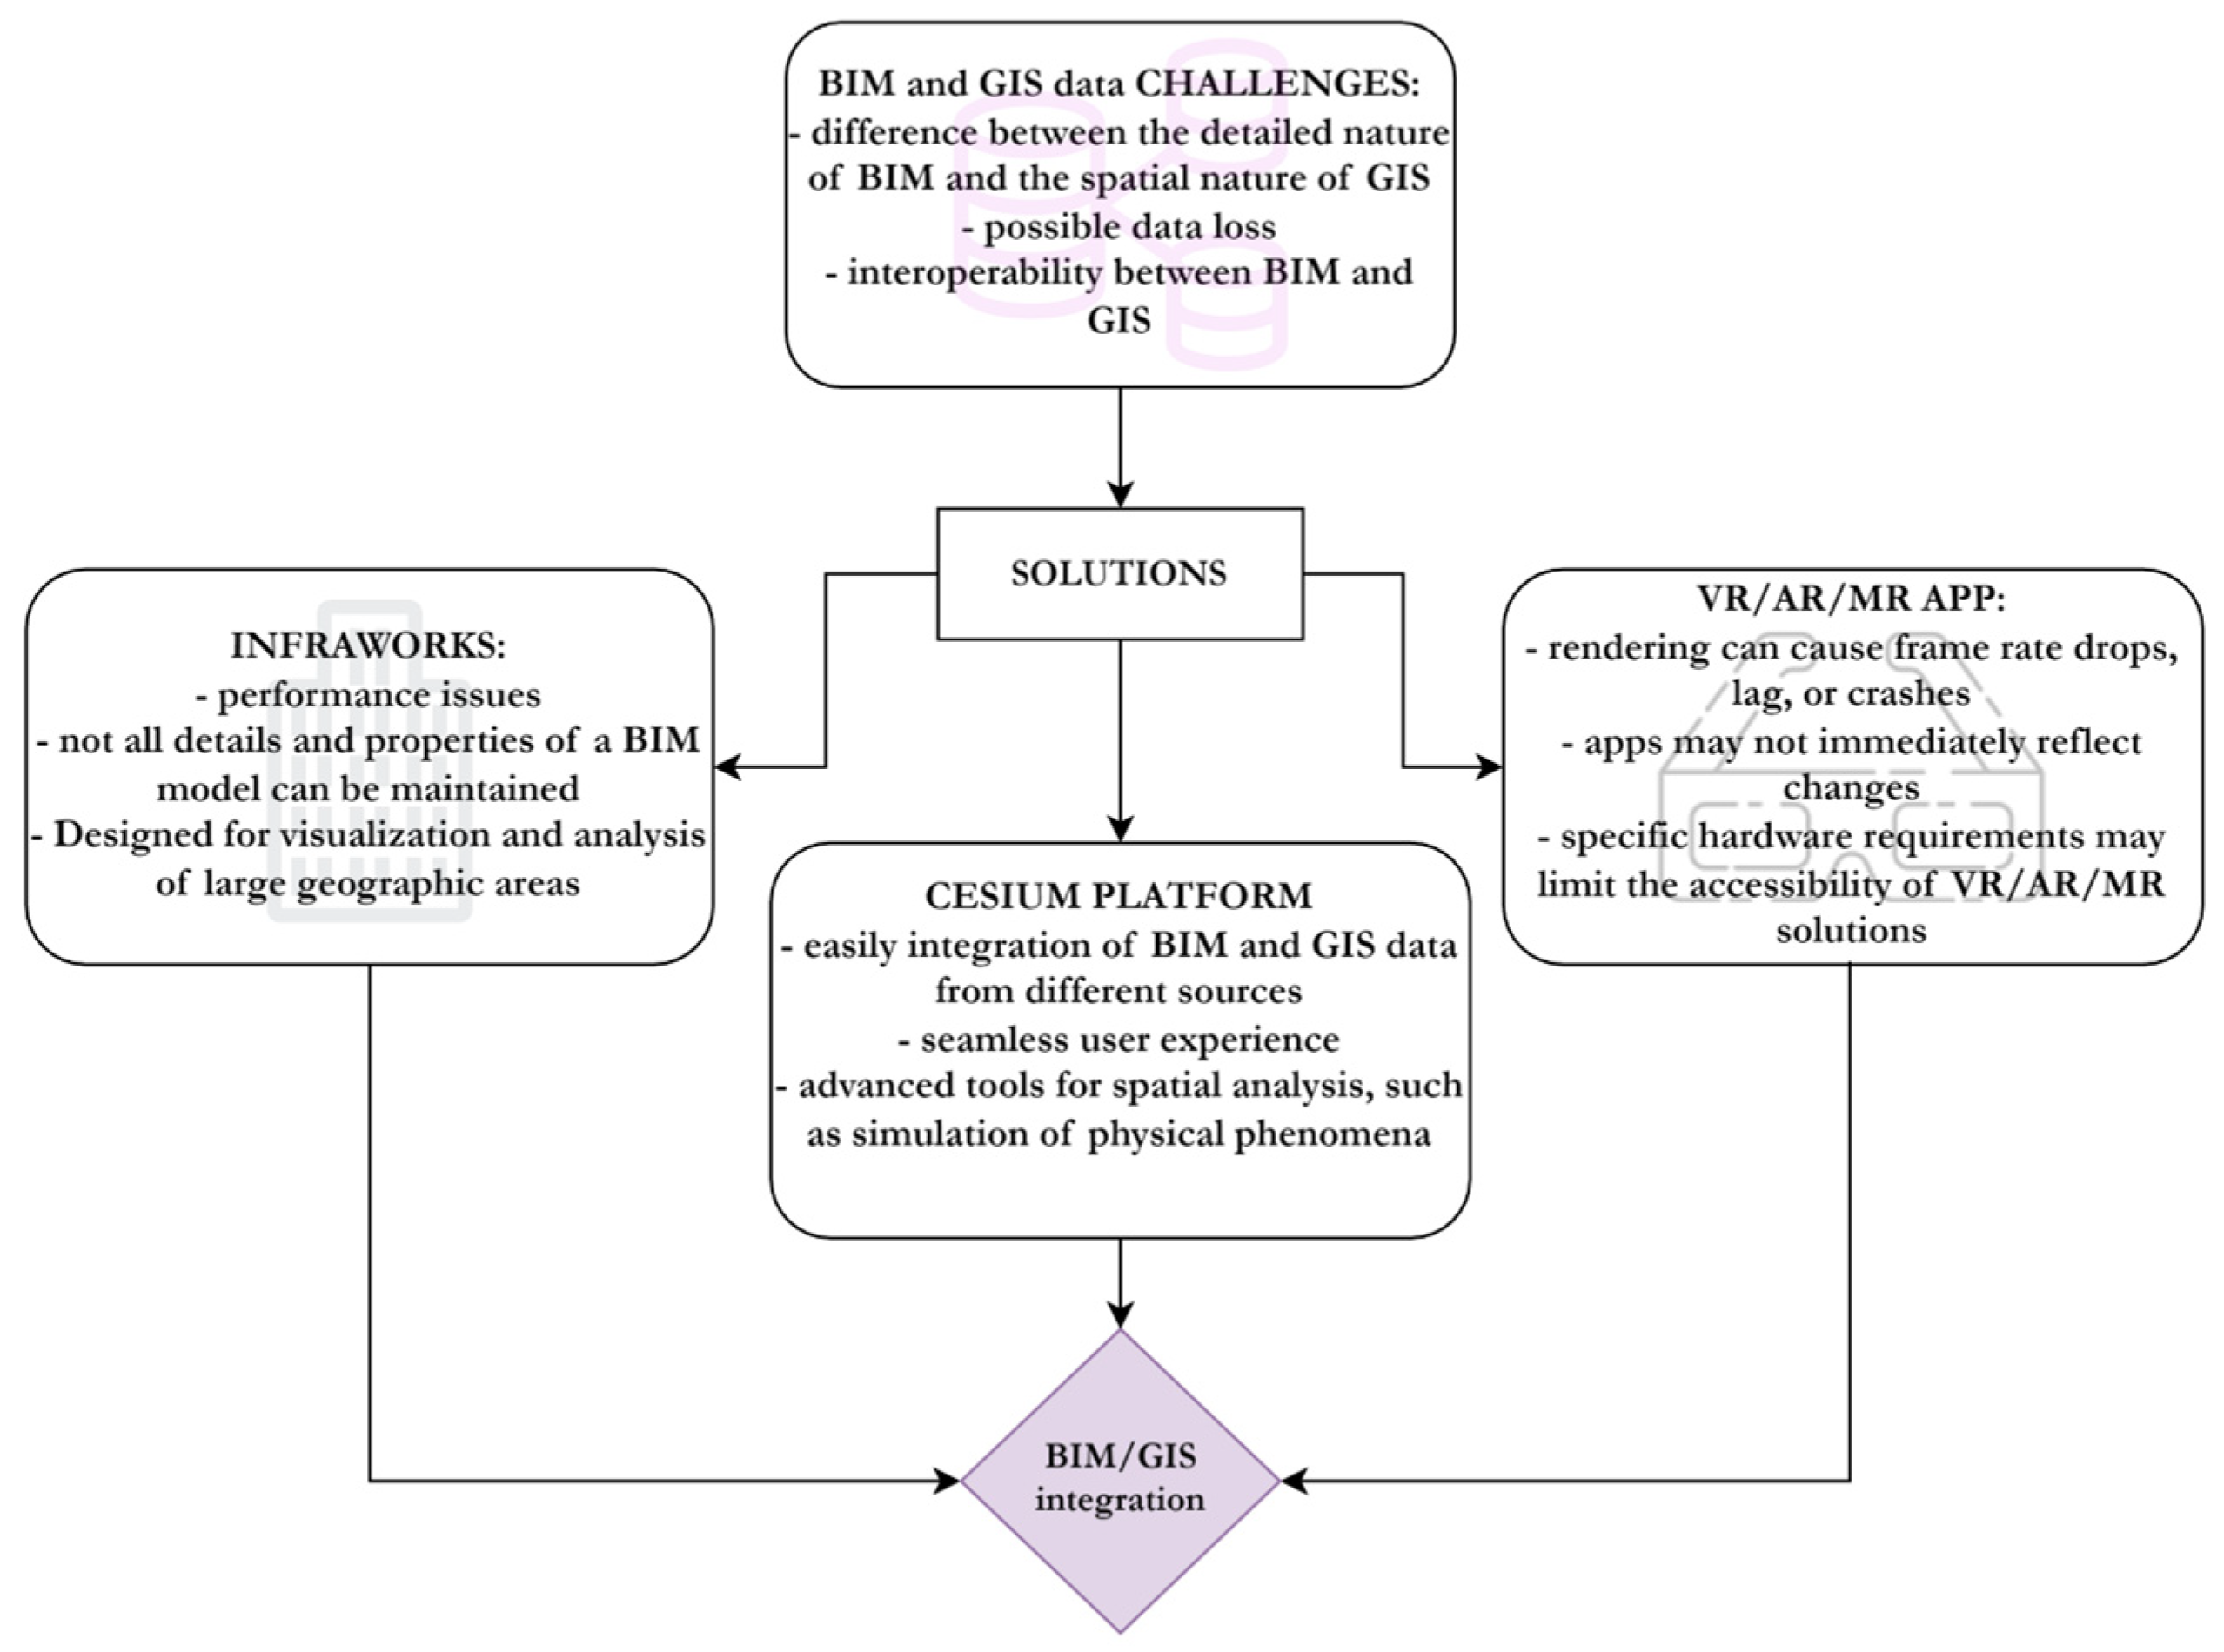
From a design point of view, the advantages of using Infraworks for the interoperability of BIM and GIS data are evident: this software allows for combining data from different origins, like BIM models, allowing for a complete and integrated analysis and enabling in-depth spatial analysis on a specific area by identifying the best design solutions. However, as is known, the main drawback of this proposed solution is that even if the building is georeferenced, the information associated with it is in any case almost nil and the necessity to use two separate software platforms persists.
3.3. BIM and GIS Integration through an Experimental VR/AR/MR App
To try to overcome the challenges of the prior solution, a feasible alternative is to use mixed, augmented, and virtual immersive reality. Concerning this, an app suitably implemented by the authors is proposed, also useful for remote inspection and virtual consultation. The aim of this app focuses on digitizing information and making it available at any time, as well as using innovative methodologies such as VR/AR/MR for visualizing 3D models and other relevant data. Moreover, with the aim to propose a solution to the unification of BIM and GIS data, the app has been implemented in such a way that the three-dimensional model of the building can be viewed in VR/AR/MR both in situ and remotely: the information contained in the model is displayed by activating the GPS coordinates or when the device recognizes the identifier of the building in question in the geospatial map, allowing for remote viewing of the hologram in any environment.
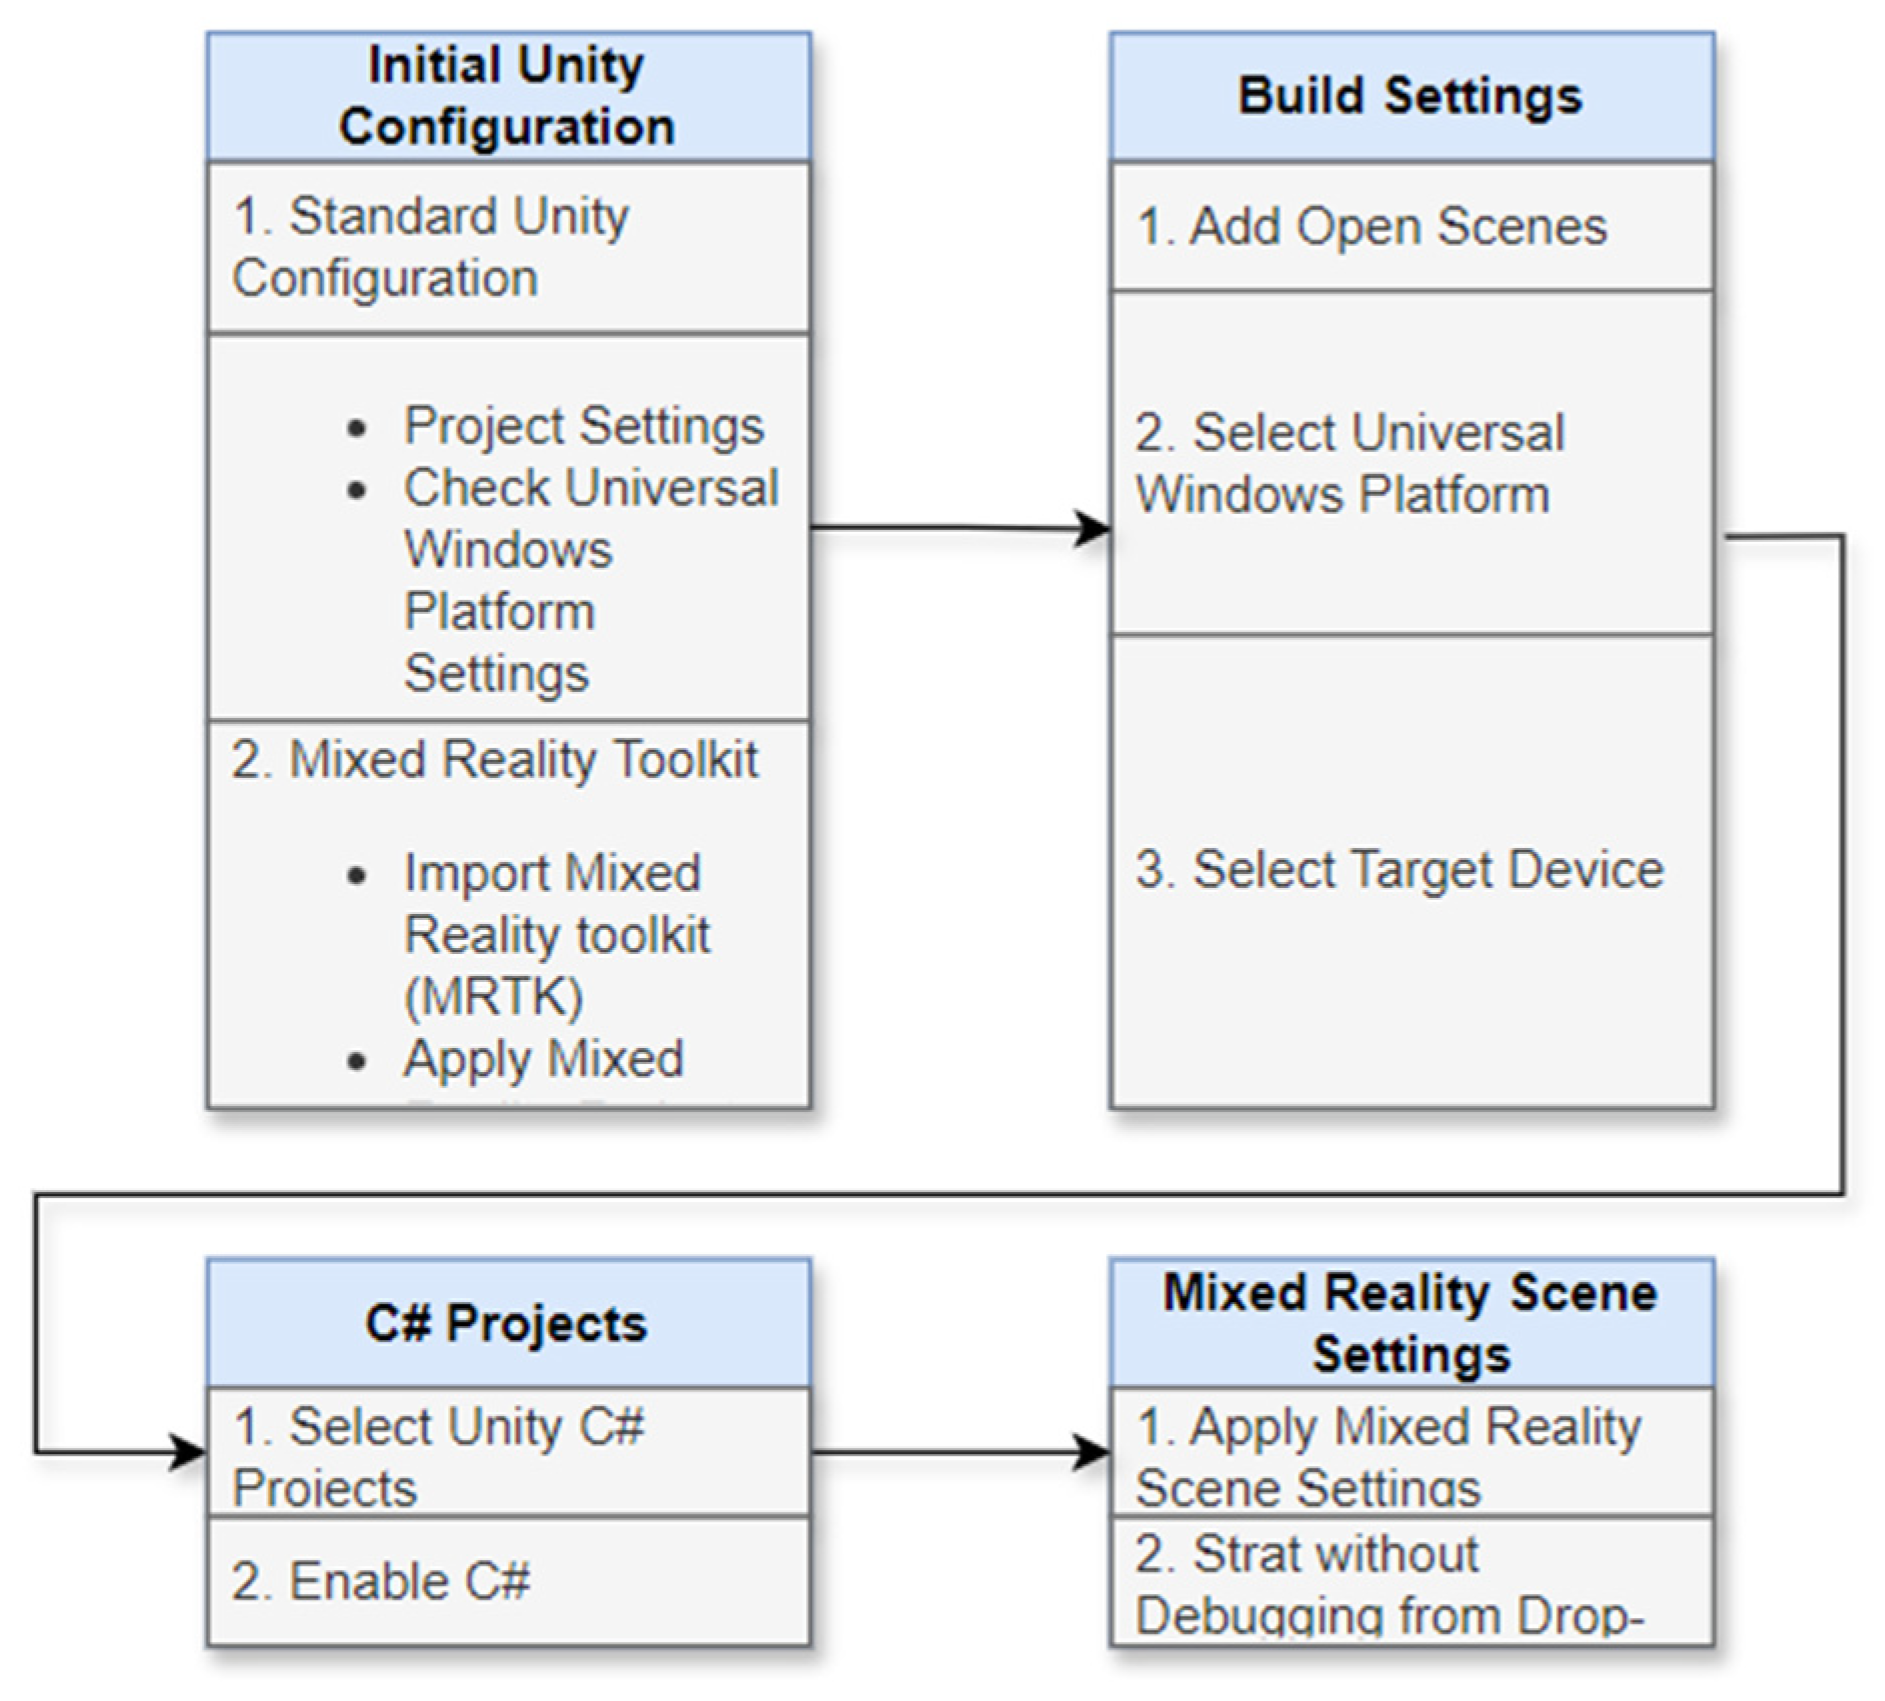
For app creation, there are several platforms and tools available, each with special capabilities leading to important advantages. For this investigation, the Unity 3D platform was selected [
44,
45], through which it was possible to develop the app by adding and controlling components with Unity’s user interface (UI) system. In order to provide an immersive and engaging experience, it was decided to use the Microsoft HoloLens viewer in addition to the app [
46,
47]. With the help of this kind of wearable viewer, which combines interactive virtual elements with the real world, users may interact with three-dimensional digital content inside their physical surroundings. Unity 3D 2021.3 allows for great visualization and the possibility to observe and manipulate 3D models as if they were actual objects inside the virtual scene. The device also includes an on-board processing unit (HPU) that handles data processing and motion tracking to enable precise and smooth interactions.
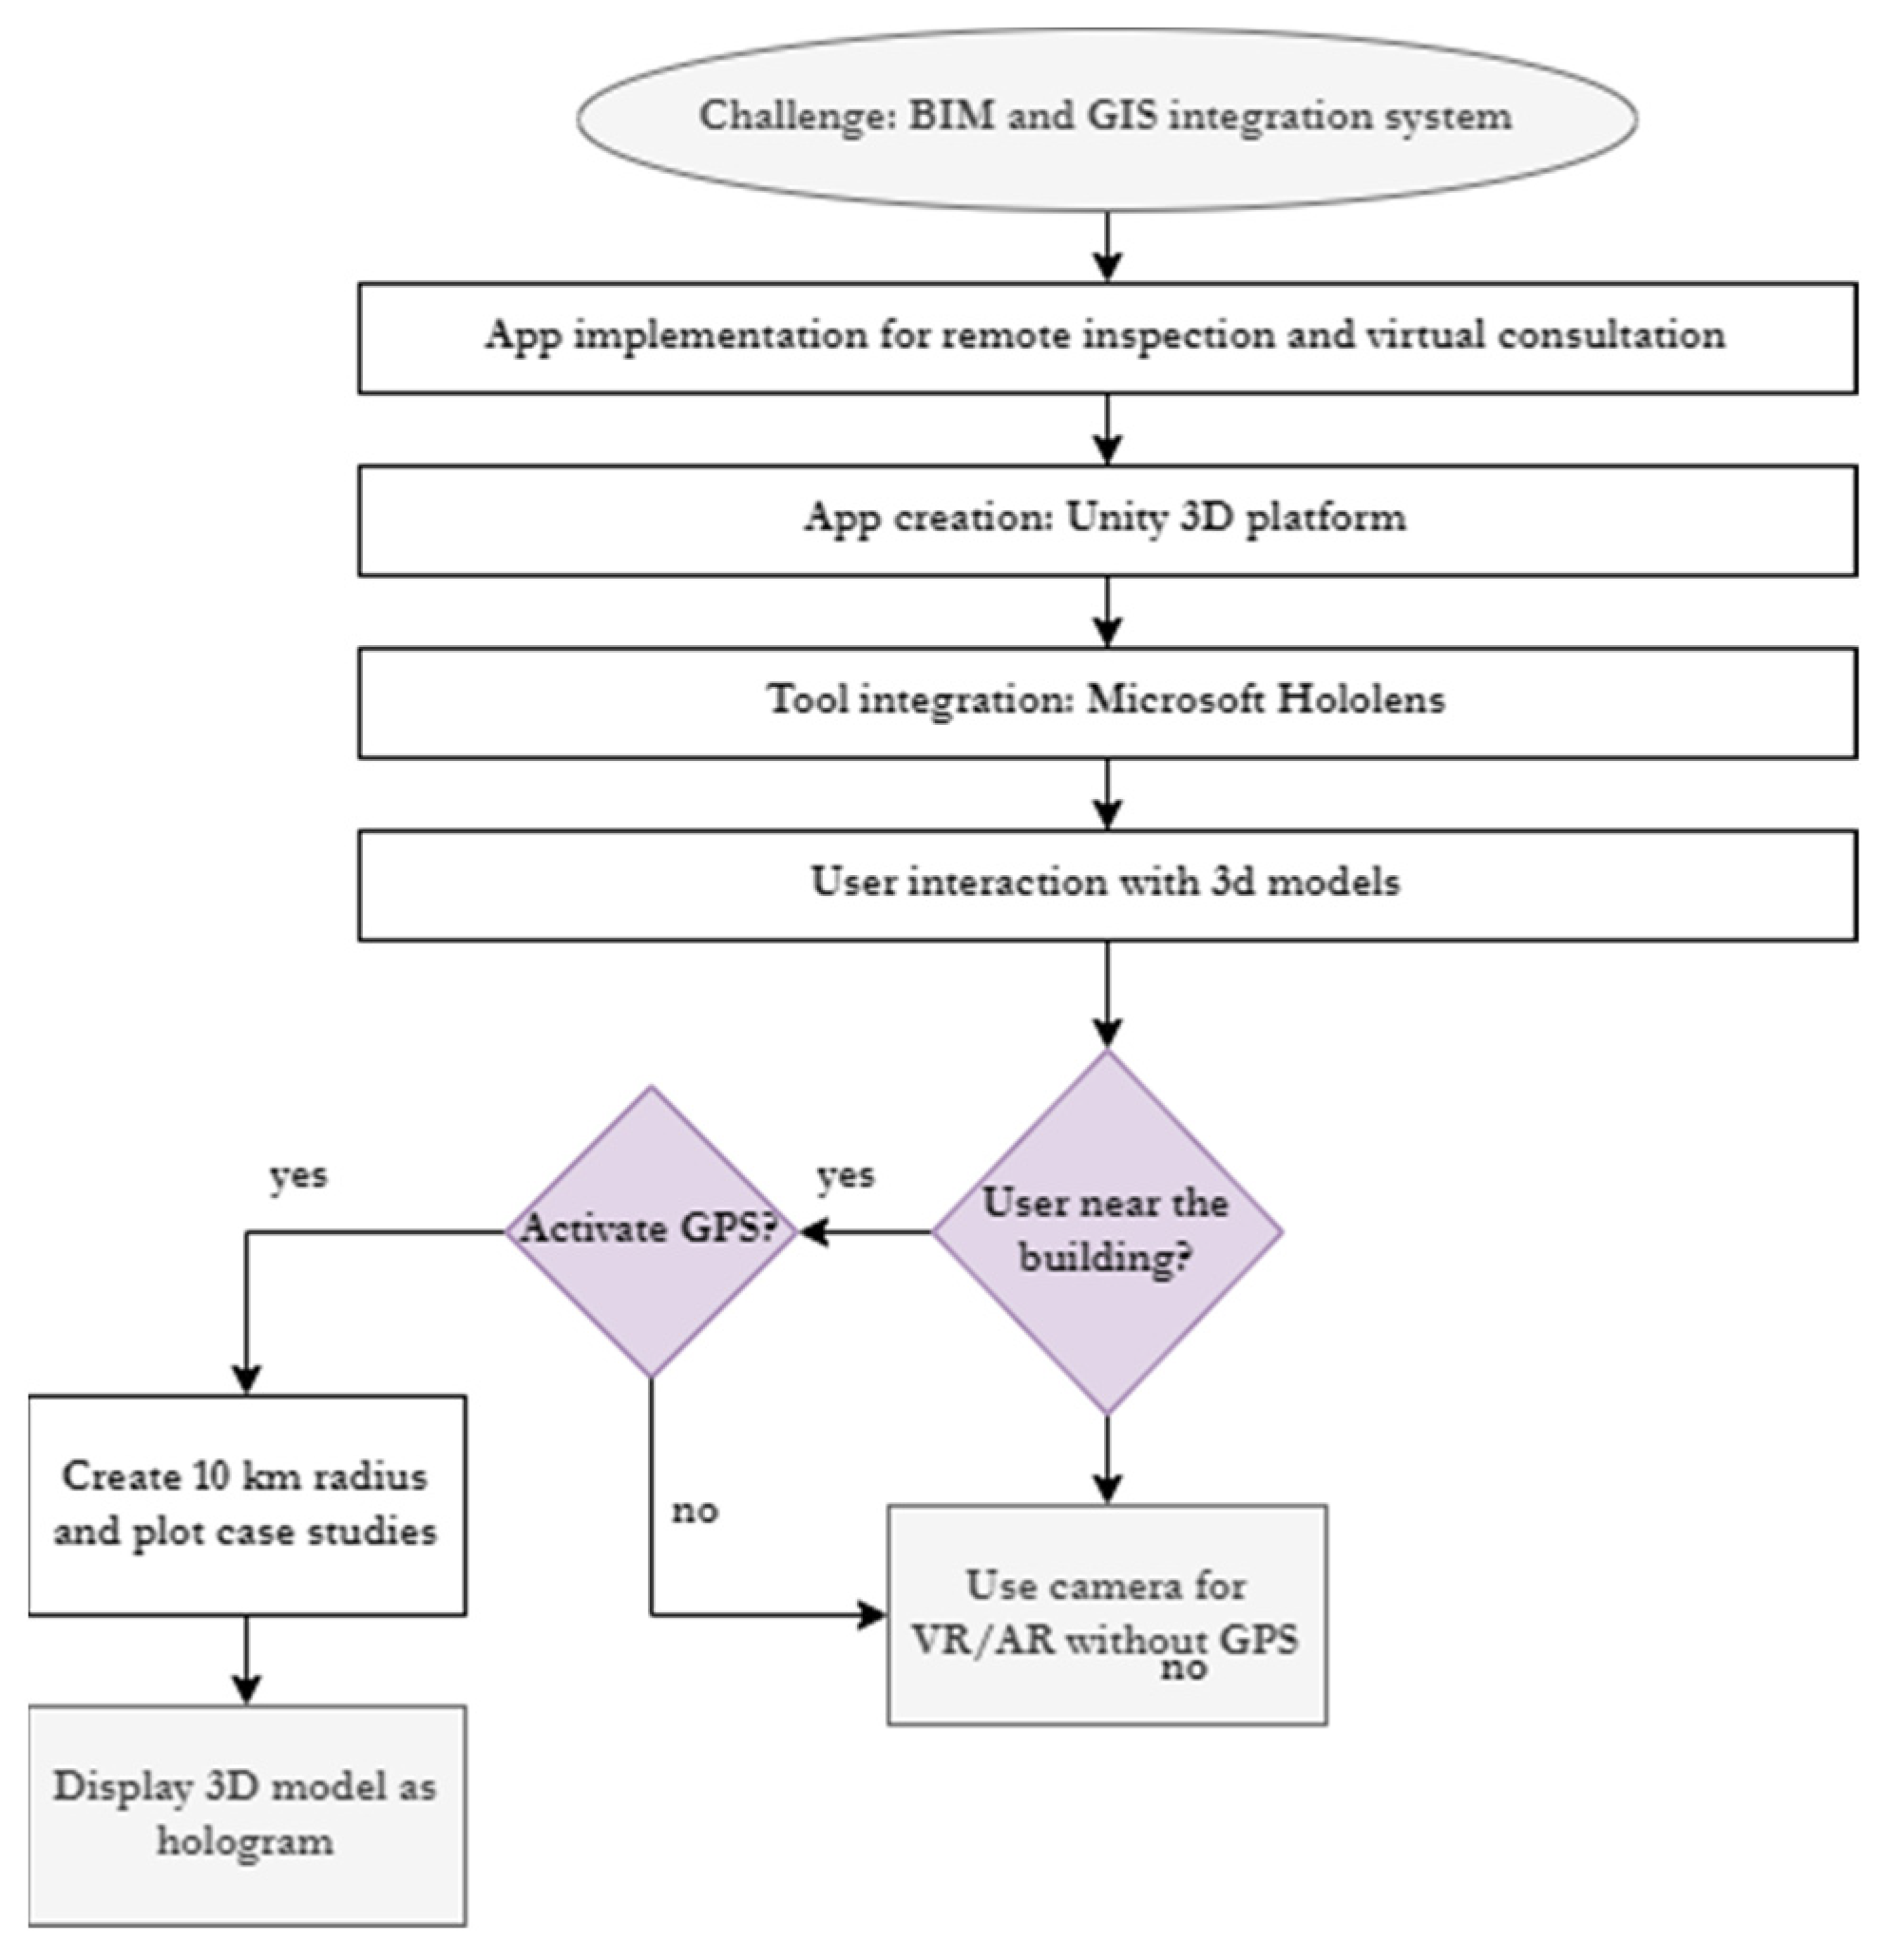
Figure 5 shows the flowchart of the methodology to create the app.
The app’s implementation shows the building’s 3D model as a holographic image overlaid on the field of view regardless of whether the user is in the area or whether the device running the app is close to the building in question and can identify the building’s ID from a GIS map. To do this, a user who wants to view the model when they are near the building will need to decide regarding the activation of the device’s GPS to define the spatial range for identifying additional models and analyzed case studies. When the user decides to turn on the GPS, the application will create a 10 km radius around their current position and plot any pertinent case studies on the map. The application offers the user the choice to see the 3D model, user interaction labels, and device for presenting information or 3D in virtual reality (VR) if they are within this range.
In this scenario, the camera must be turned on, allowing for the 3D model to be superimposed, thus making it visible. Alternatively, if the user does not activate the GPS, the augmented reality (AR) information and the view of the 3D model in VR will occur directly through camera framing. The VR/AR/MR app is certainly advantageous for an immediate and immersive visualization and allows for planners and managing bodies to make decisions supported by more detailed and complete information. The main disadvantage is not being able to carry out purely analytical analyses, which could instead be fundamental in some situations concerning the monitoring or the planning of interventions. Below, in
Figure 6, we present a flowchart highlighting the app process implementation and its logical stream.
3.4. BIM and GIS Integration through Cesium Platform
Cesium (version 1.13) is an open-source platform for viewing web-based interactive 3D maps. It allows for developers to create applications that display geospatial data dynamically on a three/four-dimensional map. It supports a variety of features, including the ability to view terrain, 3D models, satellite imagery, lines of sight, tags, and more. It can also integrate with data from various sources, such as map services, sensors, GIS data, and temporal data [
48,
49]. In particular, Cesium ion allows for loading 3D data and optimizing them as 3D tiles which, merged with other 3D contents such as Cesium World Terrain, Bing Maps Imagery, and Cesium OSM Buildings, allow for their visualization on the web through CesiumJS.
The data can be loaded using various tools such as Point Clouds Tiler, which supports .las and .laz formats typical of laser scanner restitution, and 3D Buildings Tiler, which allows for preserving metadata from CityGML and KML/COLLADA for interactive analysis in CesiumJS, which is a JavaScript library used for 3D geospatial visualizations in browsers and on different devices. Therefore, 3D geometries, deriving from a survey with drones or laser scanner, can be managed and shown in a GIS setting using libraries like three.js, making it easier to convert BIM geometry into formats that are compatible with GIS.
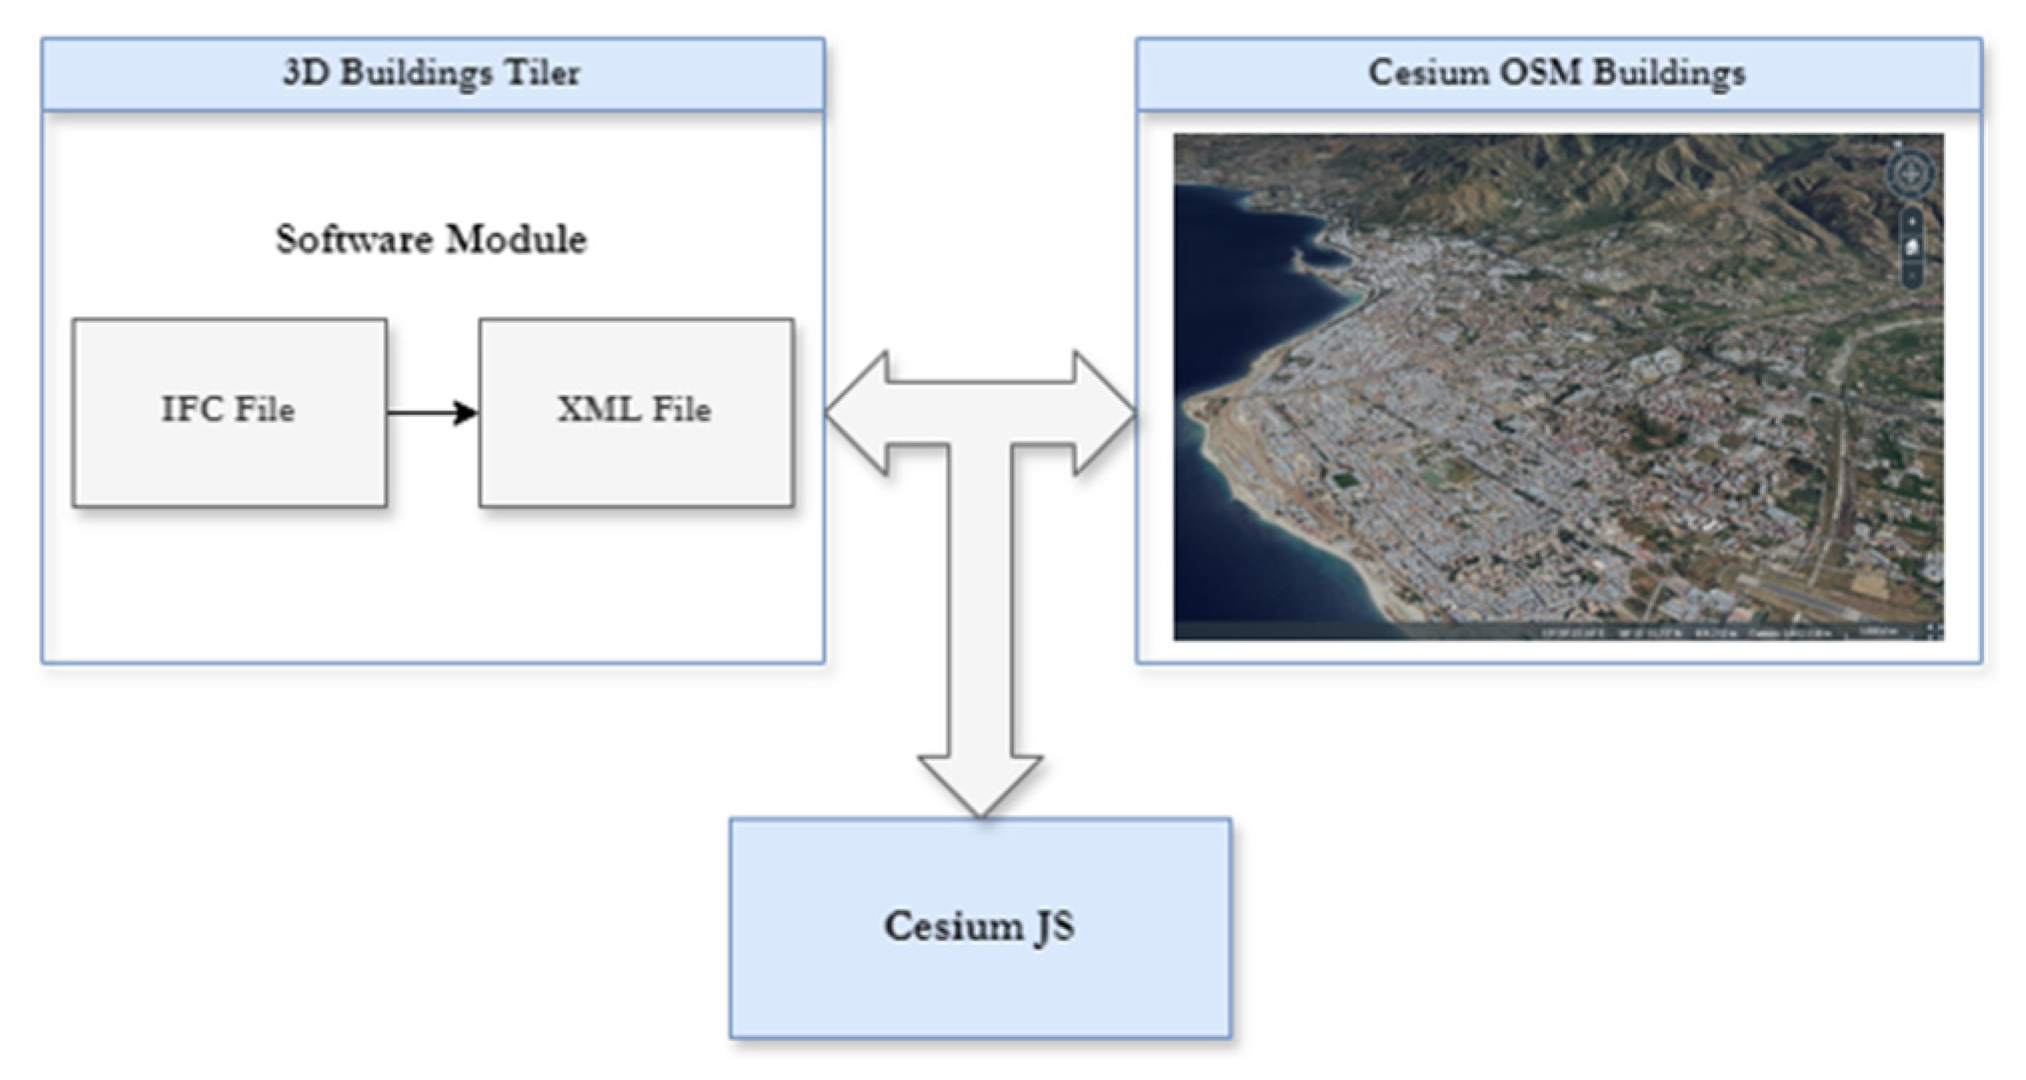
In relation to BIM/GIS integration issues, to overcome the limitations of Infraworks and the VR/AR/MR app, a strategy is proposed that consists of adding within the libraries available to Cesium ion, a software module capable of converting the starting file of the 3D model in .ifc format into a format compatible with one of the libraries present in Cesium. Cesium 3D Buildings Tiler allows for the import of 3D data in one of the following formats: .xml, .kml, etc. The aim, therefore, would be to customize the code by enriching it with a module that converts the .ifc format into the.citygml format. Furthermore, in Cesium, the representation of the same building can be imported as a point cloud and overlay both the 3D Buildings Tiler and the Point Clouds Tiler views in the representation. It should be emphasized that if the coordinates of the points coming from the BIM are not expressed in terms of a standard EPSG reference system (EPSG is a global registry that lists and catalogues spatial reference systems used worldwide, providing unique codes to identify them), the library can take charge of the re-mapping of the coordinates coming from the BIM in order to associate all the construction points with the coordinates consistent with the GIS reference system used within the 3D WebGis. Naturally, with this option, the transformation is semi-assisted, and an operator must indicate a mapping of three known construction points among all those being imported.
Figure 7 shows the proposed logical–functional scheme.
Moreover, Cesium ion also allows for the tiling of BIM or CAD models and displaying them in a geospatial setting for web sharing.
At this point, Cesium OSM Buildings (a global layer with over 350 million buildings from OpenStreetMap data) and Cesium World Terrain were added. The model was then imported into Cesium ion through the “My Assets” and “Add data” sections. Once the model is imported, it is automatically geolocated. Then, the code is customized by inserting a software module that takes the uploaded BIM model as input and converts it into a format compatible with Cesium, such as CityGML (.citygml, .xml, .gml), or KML/COLLADA (.kml, .kmz, .dae). In this case, any per-building properties in the source data will be included in the 3D output.
Parsing, or data extraction from the IFC format, is the first step in the conversion process. It consists of the following steps:
Loading the IFC file: The method first imports the IFC file using a library named IfcOpenShell. This library is used to read and understand data contained in IFC files.
IFC structure navigation: Once an IFC file has been loaded, the algorithm explores its hierarchical structure. Every structural component of the structure, including doors, windows, floors, and walls, is identified, and data on composition, size, and spatial orientation are collected.
Property extraction: Each element’s distinct geometric attributes and semantic information are retrieved. This step is relevant to ensure that all relevant data are retained throughout the conversion.
The following step was rearranging the data in the CityGML format that had been made after the extraction of the information from the IFC file. It follows the following phases:
Entity mapping: Connections between IFC entities and related CityGML ones are made. The IfcWall in IFC, for instance, is changed to a BuildingWallSurface in CityGML.
Coordinate conversion: The CityGML reference system is used to convert the geometric coordinates of the objects from the IFC file’s system. Converting 3D coordinates is carried out to ensure accurate spatial representation, fundamental to geospatial analysis.
Creation of CityGML elements: we used the citygml4j library in order to create corresponding CityGML elements with converted attributes and geometries (typical of GIS environments).
Data aggregation: Buildings, clusters of buildings, and other urban entities are created from the converted data.
In addition to the libraries already available in Cesium, using the Deck.gl libraries may be a possibility [
50]. Deck.gl is a free and open-source platform for dynamic geospatial data representation on three-dimensional maps, enabling developers to construct sophisticated, dynamic geographic data representations. The display layouts may be tweaked and customized to meet the particular requirements of the application. Further research is being conducted on the possibility of incorporating these types of libraries within the Cesium platform.
3.5. Case Study
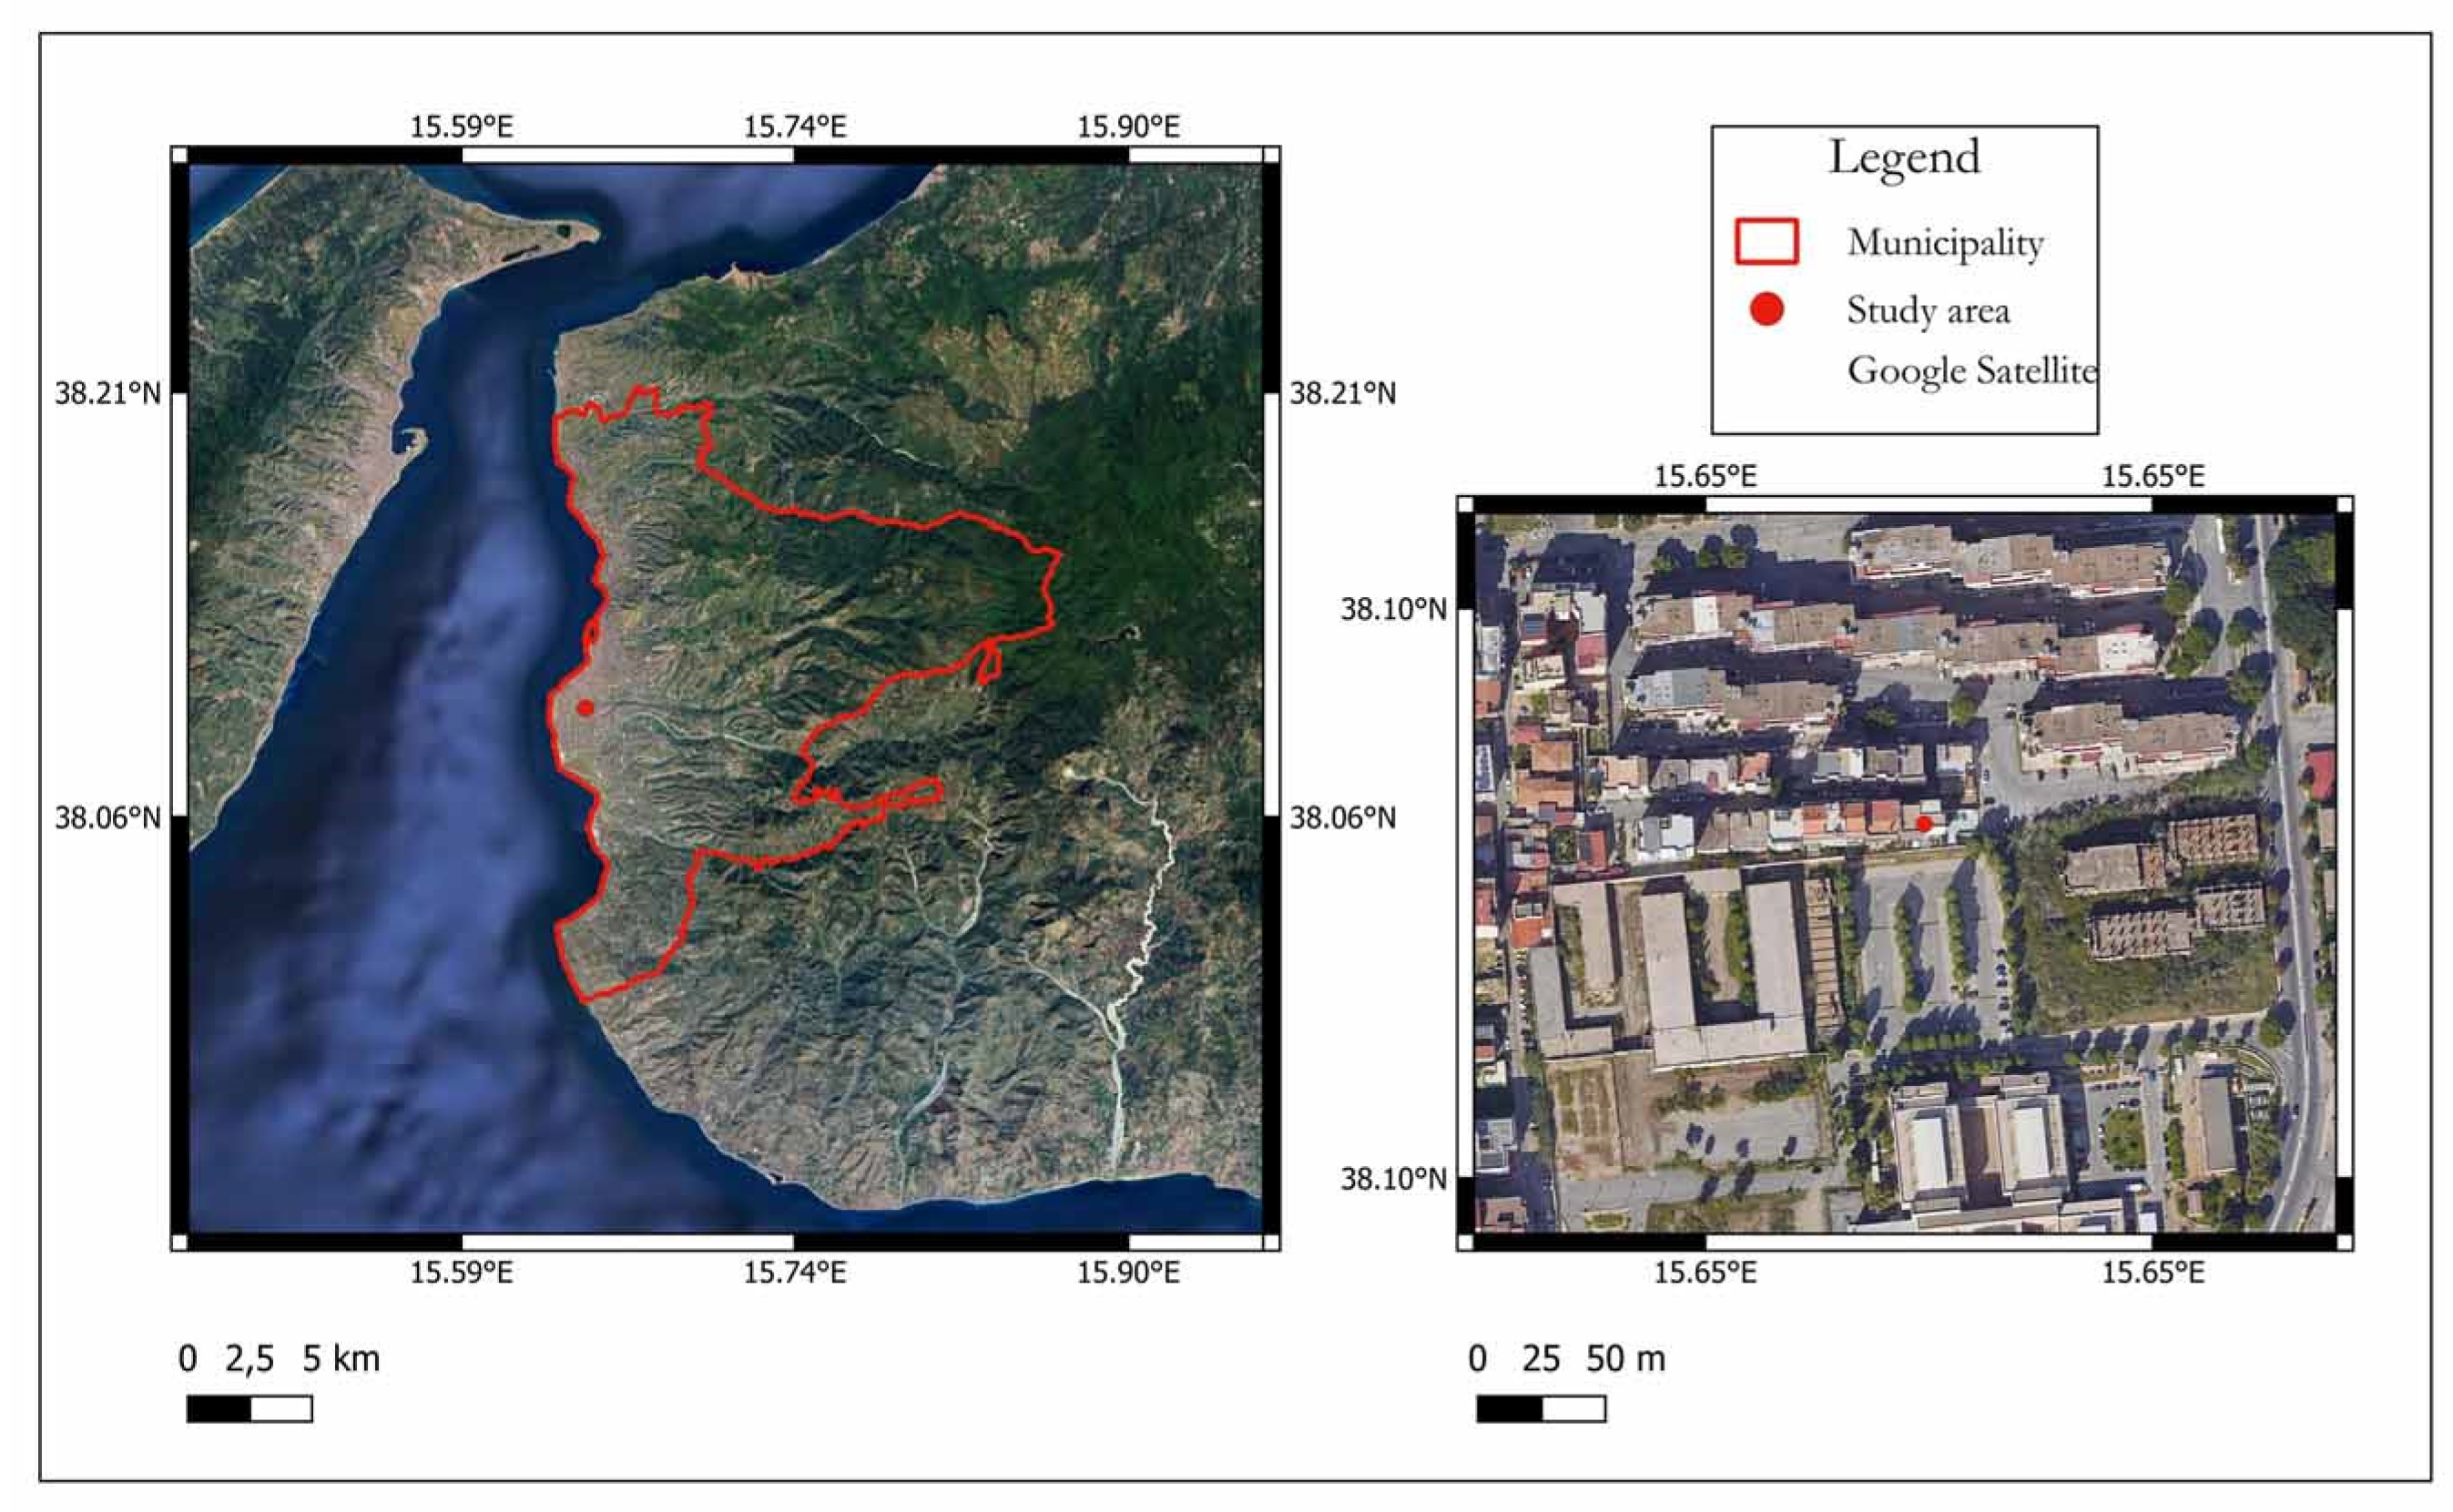
The methods were applied to a building located in the province of Reggio Calabria. On this building, as explained in the previous section, a survey was carried out with the laser scanner technique, and once the current status had been analyzed, we proceed to the energy efficiency phase. This phase involves the insertion of an external coat and photovoltaic panels on the entire facade of the building. This decision was taken for the known reasons of favorable climate, high solar radiation, low latitude, low presence of shadows, and various government incentives such as tax benefits.
Figure 8 shows the area in which the building under study is located.
First of all, the following building was chosen because it is a building where major redevelopment interventions have been carried out. These interventions have highlighted the need to integrate different data that provide complementary information in the analysis of the building’s performance and the impact that these interventions have on the surrounding environment. Furthermore, it is an overall simple structure, which allowed for the creation of an accurate 3D model. The building was deliberately chosen instead of a heritage structure (such as a church or similar) because the latter still presents difficulties in being faithfully represented, despite advanced 3D reconstruction techniques via drone acquisition. The goal was to obtain the most accurate representation possible in the geospatial environment. Finally, in the context of urban sustainability, it was essential to choose a building of this type to highlight the advantages of the proposed methodology, which could be of great use in the urban regeneration process. This process must necessarily accompany the development of new smart cities to keep pace with the speed with which new technologies are spreading across all disciplines of urban planning and urban design.
4. Results
The purpose of the research is basically to propose a possible solution to visualize 3D elements within a geospatial context characterizing the GIS environment. For the case study in question, we move from the use of the commercial software program Autodesk Infraworks to the creation of an interactive VR/AR/MR app, and finally, we propose a method, still under study, for the creation of a hybrid system in which, using a platform and dedicated libraries, it is possible to view and analyze the 3D elements and objects inserted therein.
With the aim of analyzing the various methodologies proposed, we proceeded, in the preliminary phase, with the creation of a three-dimensional model of the structure in Autodesk Revit, located in the study area illustrated in
Section 2.
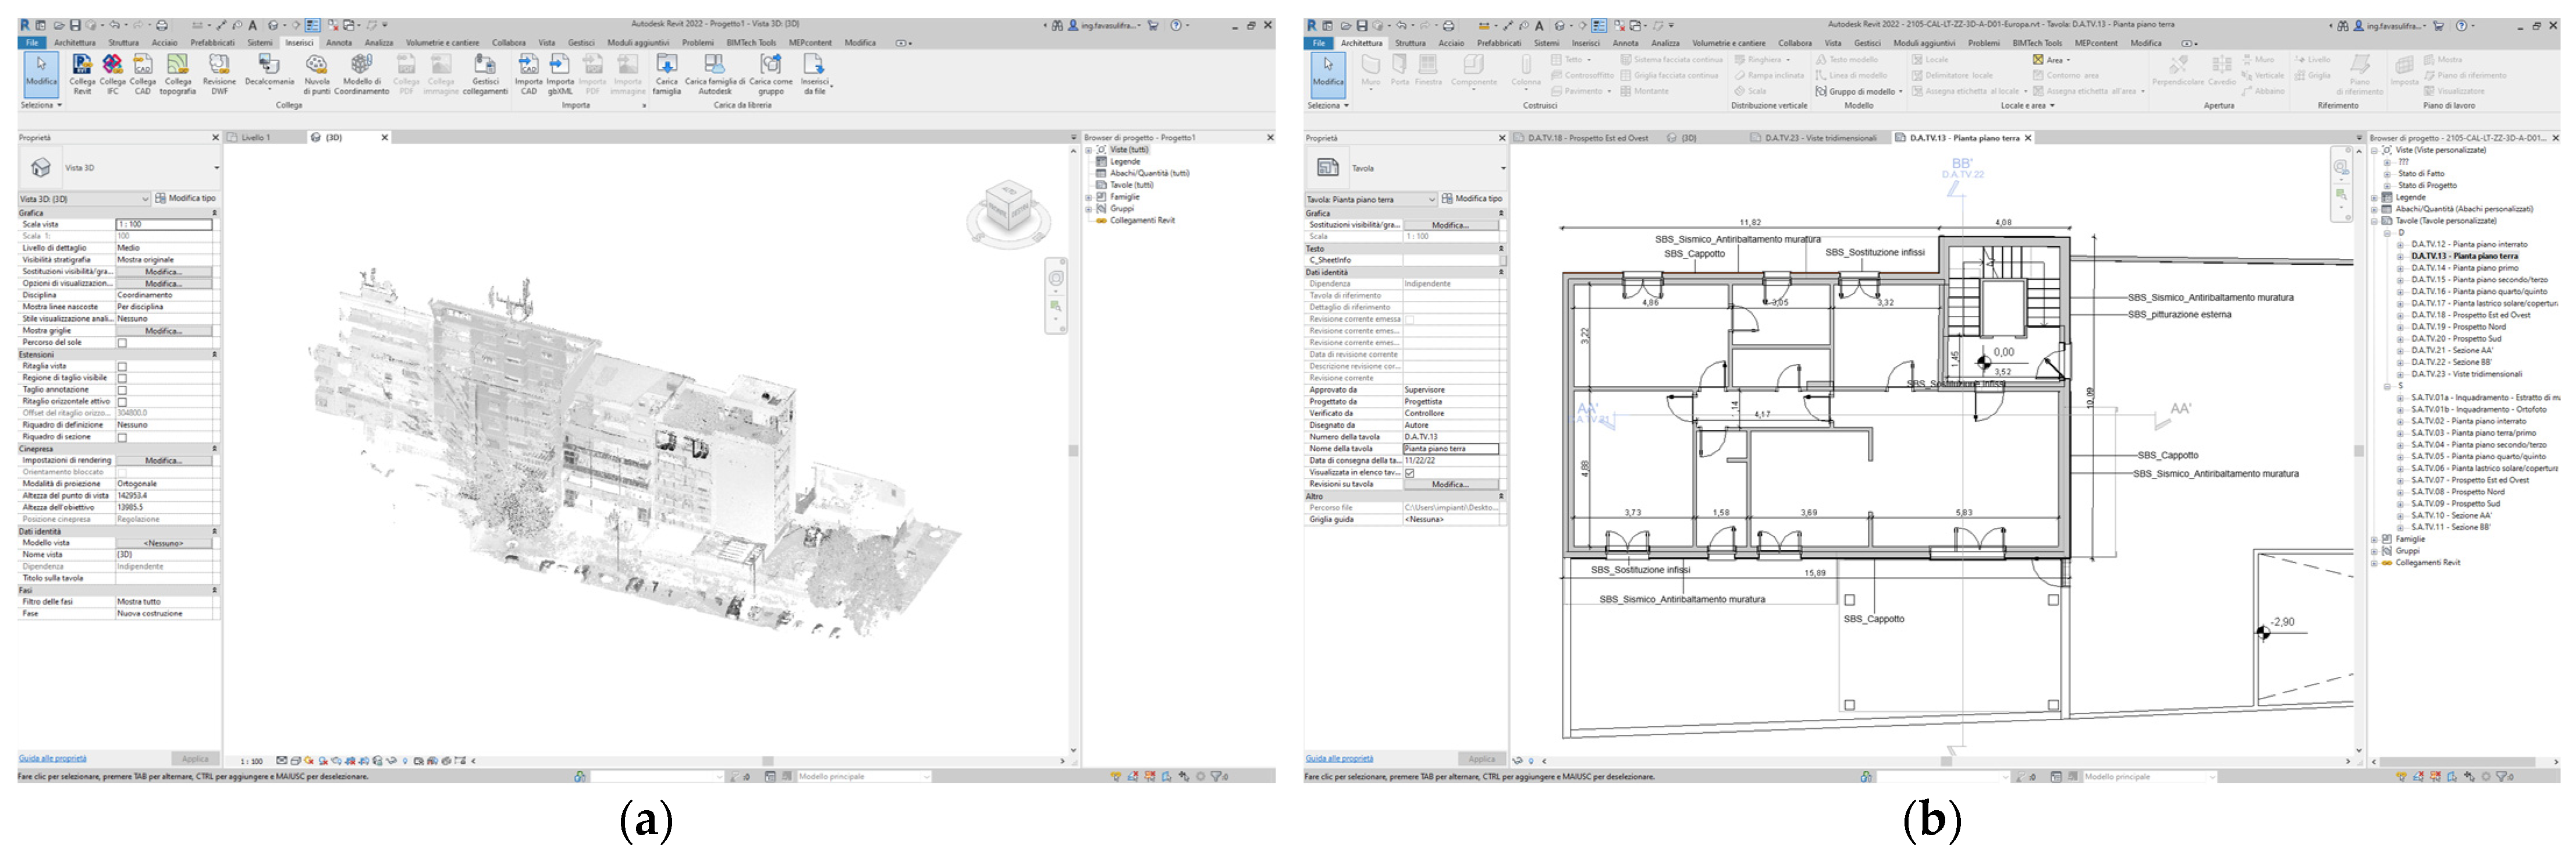
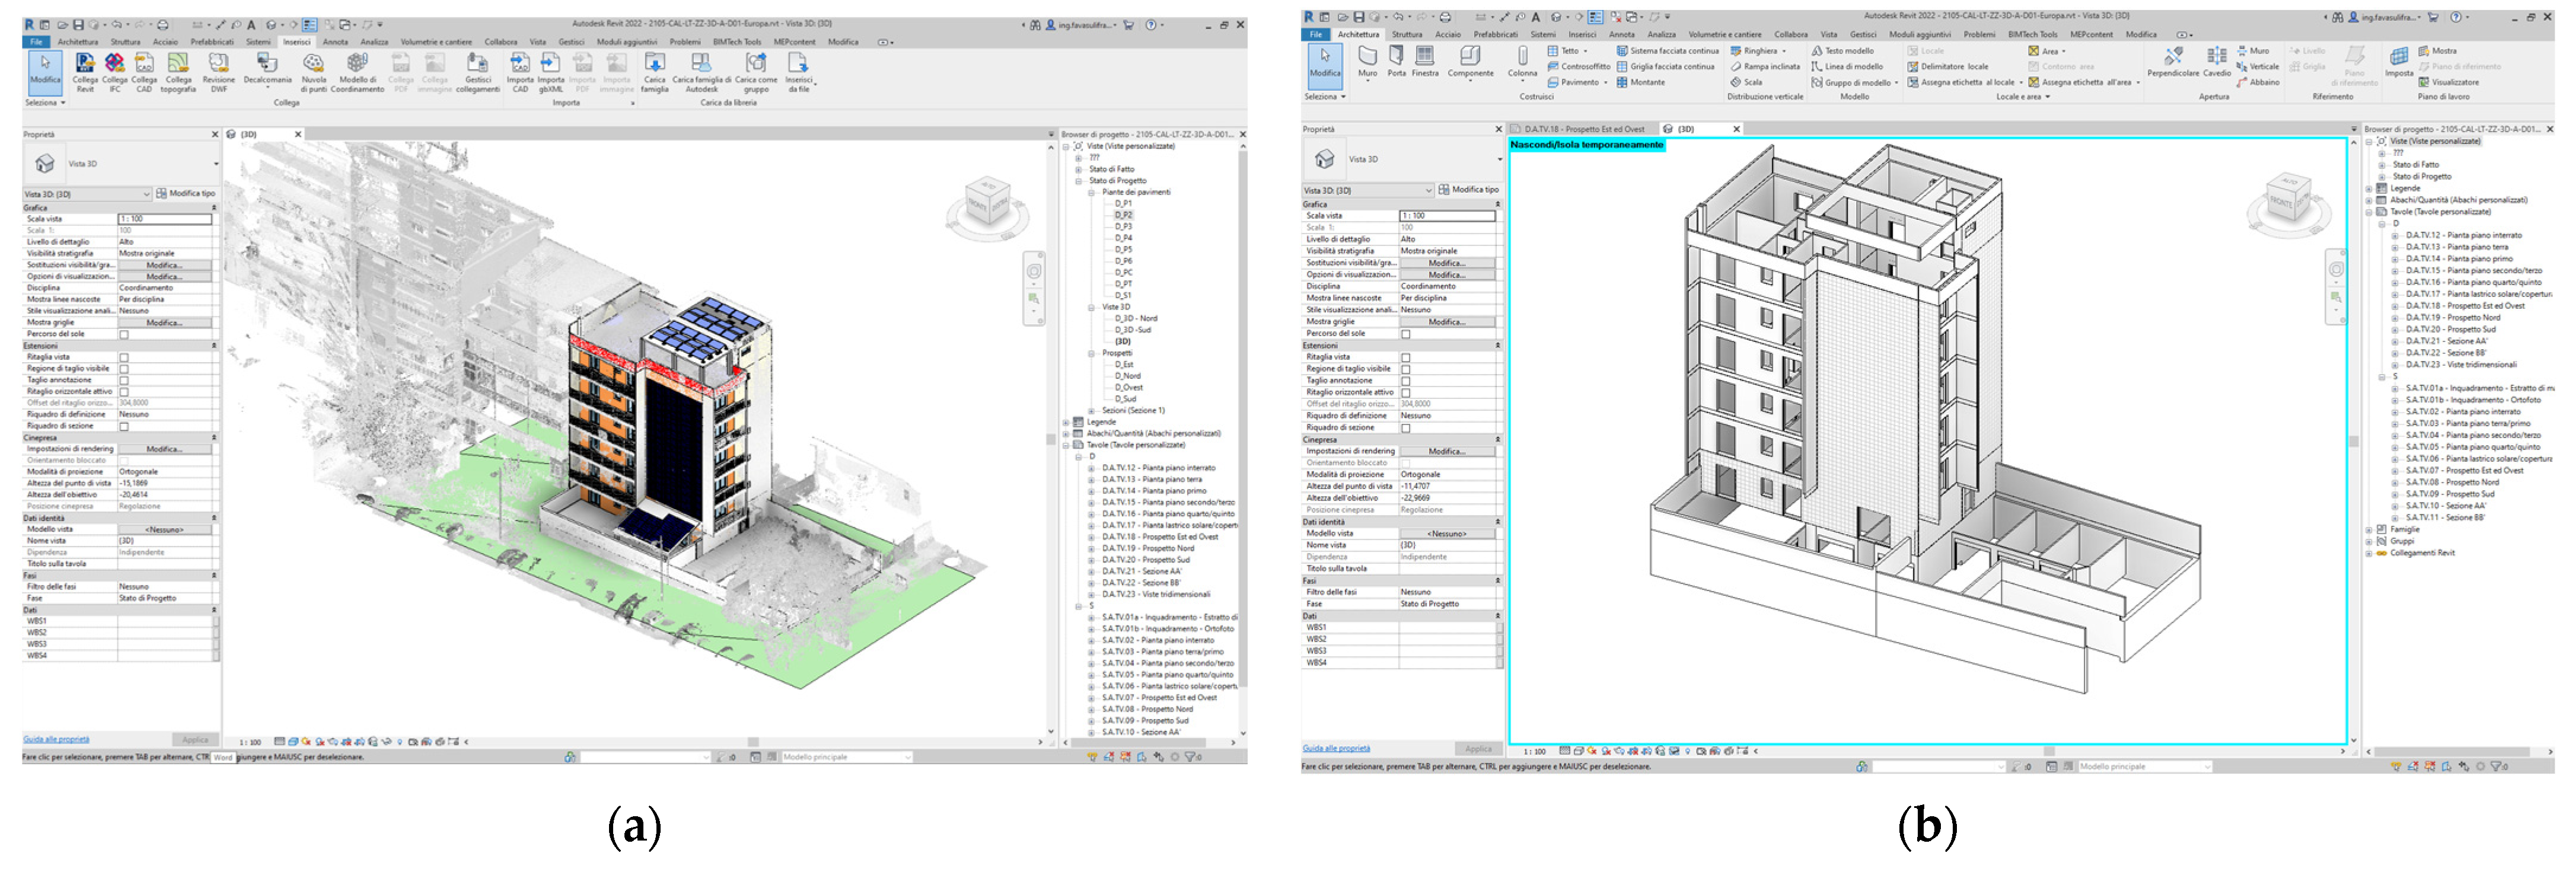
Figure 9a shows the integrated point cloud in the Revit project obtained after removing the excess parts that do not concern the effective area of the survey through Autodesk Recap (by doing so, it is possible not only to eliminate points in excess but also to distinguish points of the terrain from vegetation and from the objects present in the area of interest). As regards the interior, a classic metric survey was carried out, reporting everything on CAD to produce a DWG plan.
Figure 9b shows the CAD file obtained for the modeling of the internal structures.
We then proceeded with the model construction of the current state and project state.
Figure 10a shows the last stage of the model and
Figure 10b the modeling of the building interior.
4.1. Infraworks
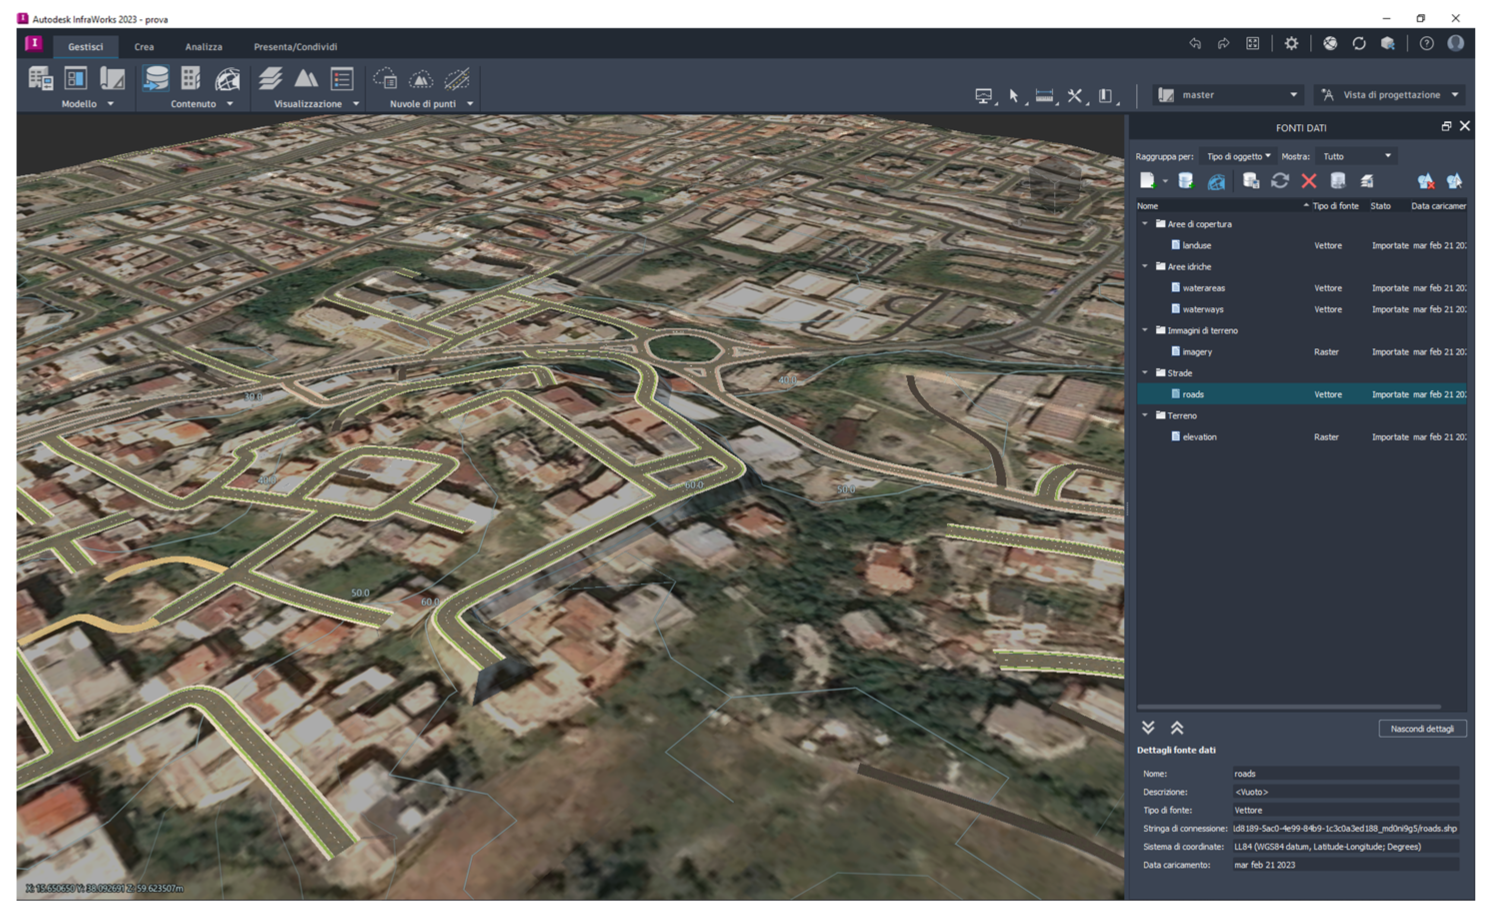
Once the BIM modeling phase was completed, we moved on to the BIM/GIS integration methodologies to obtain optimal urban planning. A simple GIS environment of the study area, created for purposes like the research in question, was imported into Infraworks. Primarily, we used information layers related to topographic surveys of the area, 3D city models, roads, water bodies, and underground utilities such as sewage, potable water, and lighting (which we had created based on previous work). These types of data allow for the analysis of the building’s surrounding context, including its solar exposure, orientation, and topography. When combined with BIM data (relating to the building’s materials), it enables the prediction of the building’s energy performance and the adaptation of the project to specific requirements to maximize overall energy efficiency. The integrated GIS data allows for the analysis of resource usage and, together with the BIM data, helps optimize material usage as well as provides a precise evaluation of the return on investment related to the installation of the chosen photovoltaic panels. However, having available more complete layers with a greater level of detail of the area under study through ArcGIS online, it was decided to use the latter for a more accurate visualization of the area and its characteristics, proceeding to the GIS modeling of the area, as shown in
Figure 11.
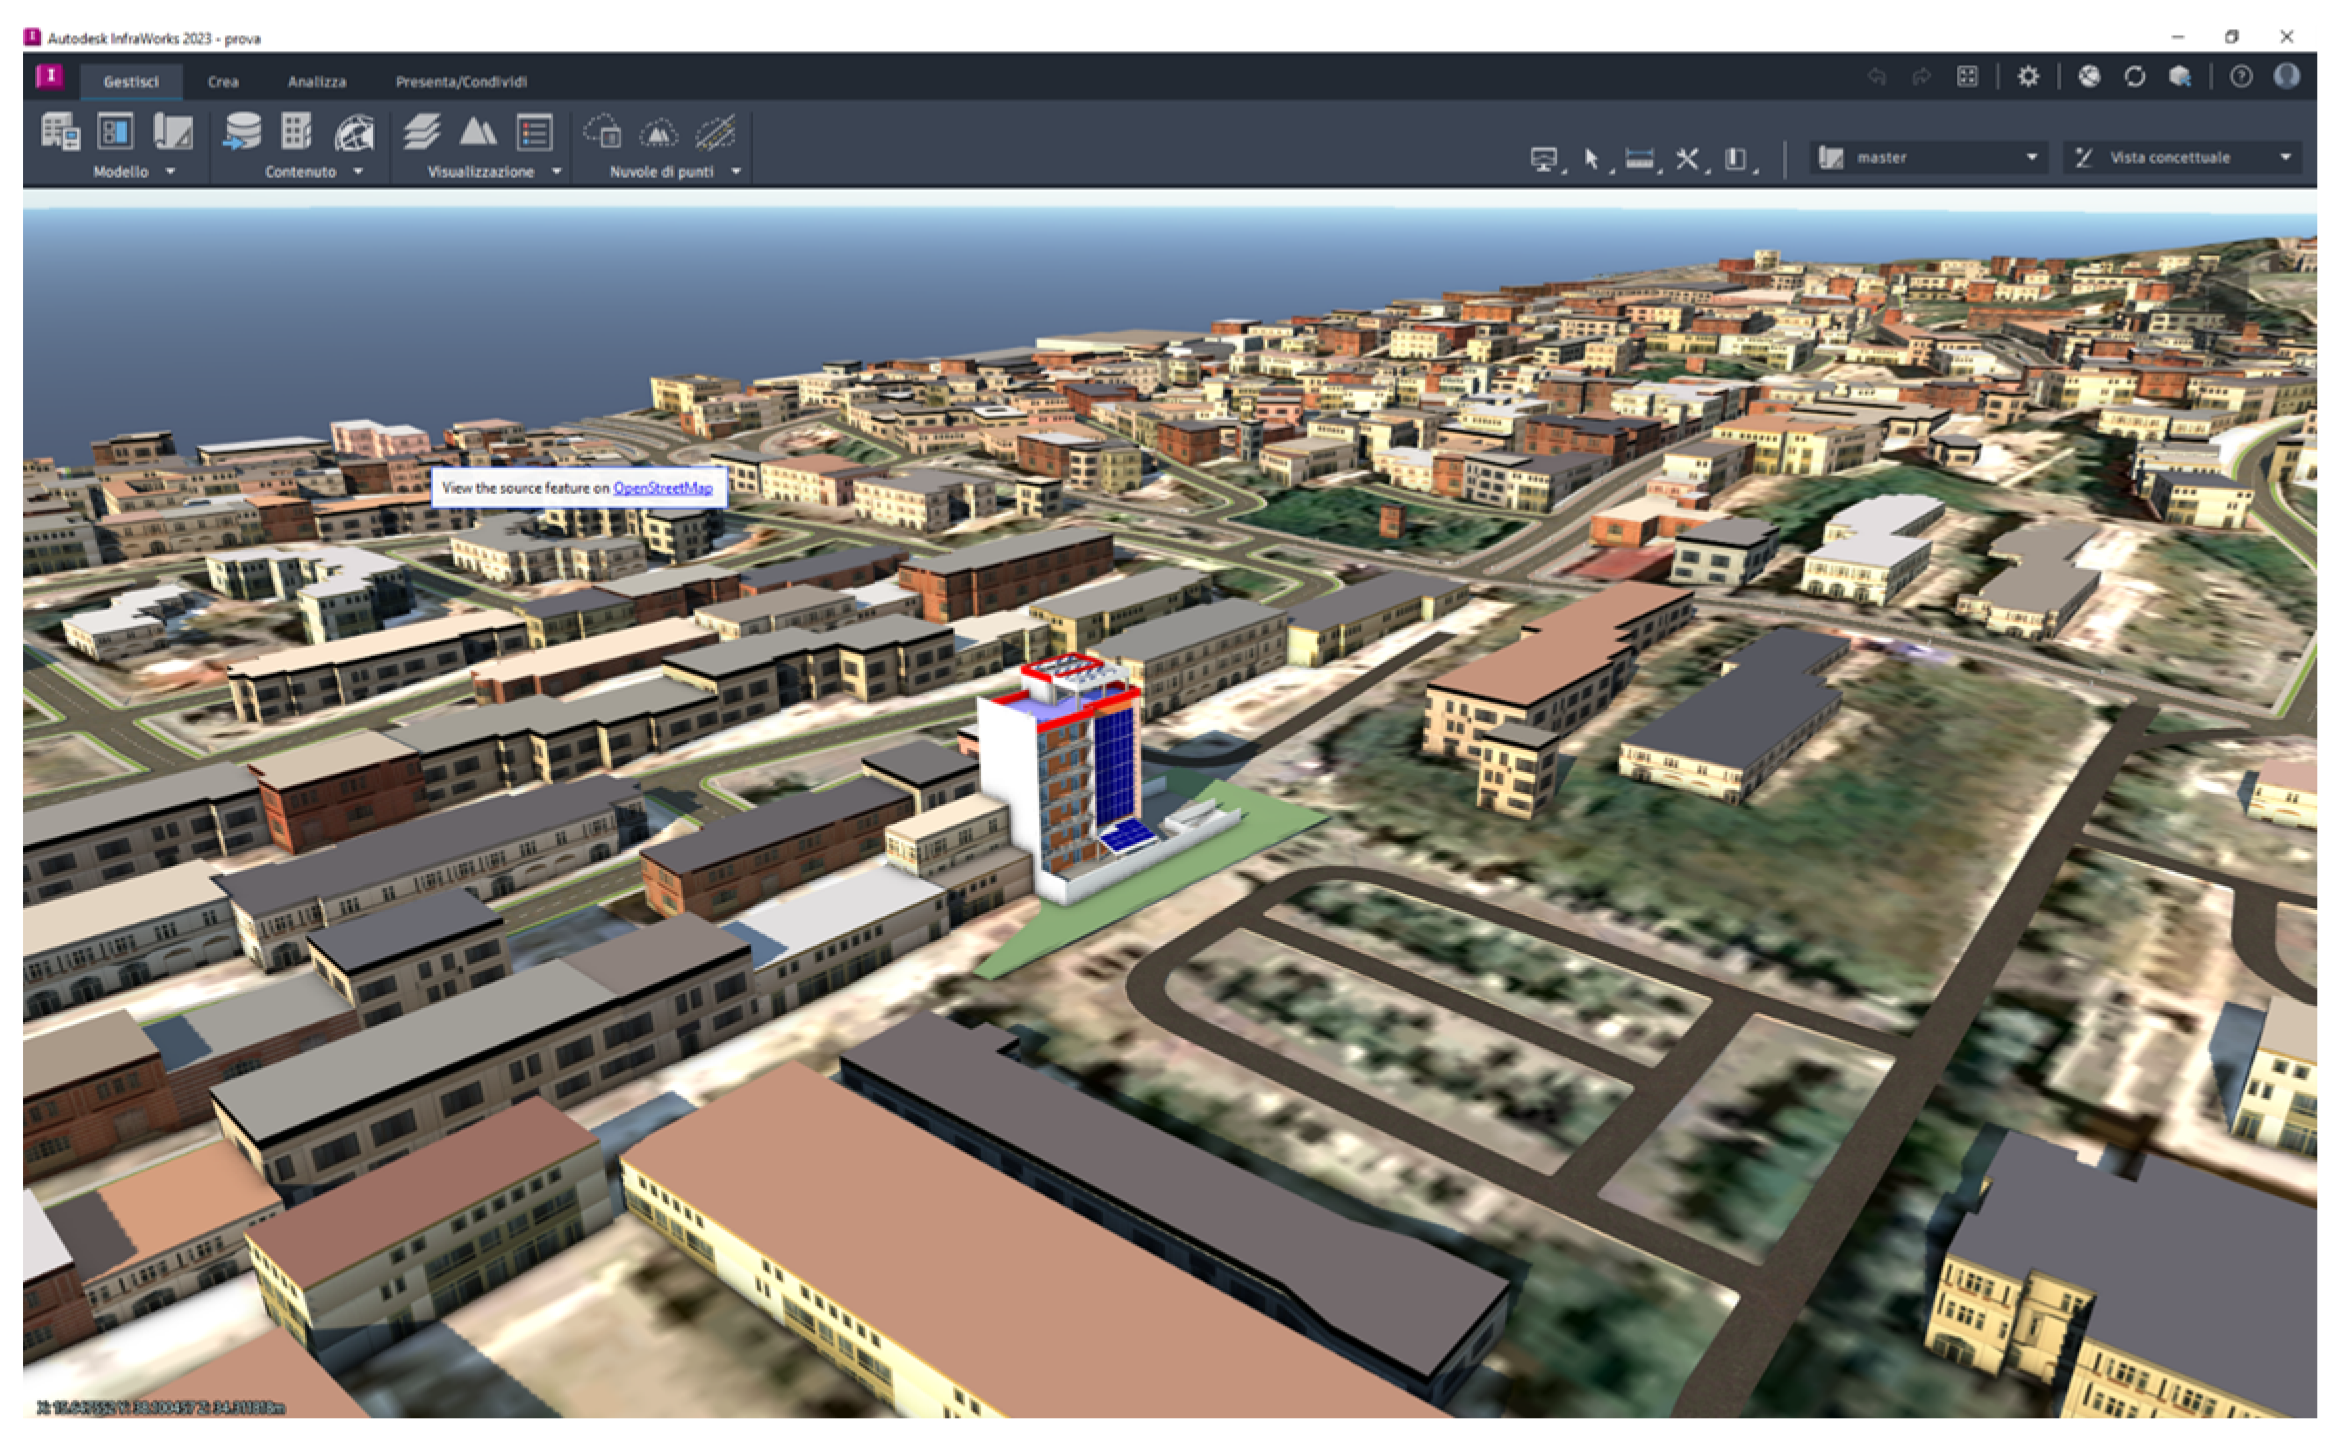
Figure 12 shows the building in question inserted within the urban context using the commercial software program Autodesk Infraworks.
Evident from the illustration, the choice to insert the photovoltaic panels on the facade was prudent: the building overlooks a parking lot and is not subject to shaded areas caused by other buildings or vegetation. Thanks to this visualization, the urban planner can make studied choices for better management of both the single building and the area in which it is inserted. Clearly, the limit remains the lack of information deriving from the loss of information from the importing process of the BIM model.
4.2. VR/AR/MR Application
Using the interactive app in VR/AR/MR allows for overcoming the restrictions of the previous method while still remaining a virtual environment with all the limitations that this method brings with it. In this case, BIM/GIS integration is guaranteed by the possibility of having detailed information about the building when the GPS coordinates of the device are activated or when the building ID is read on the GIS map.
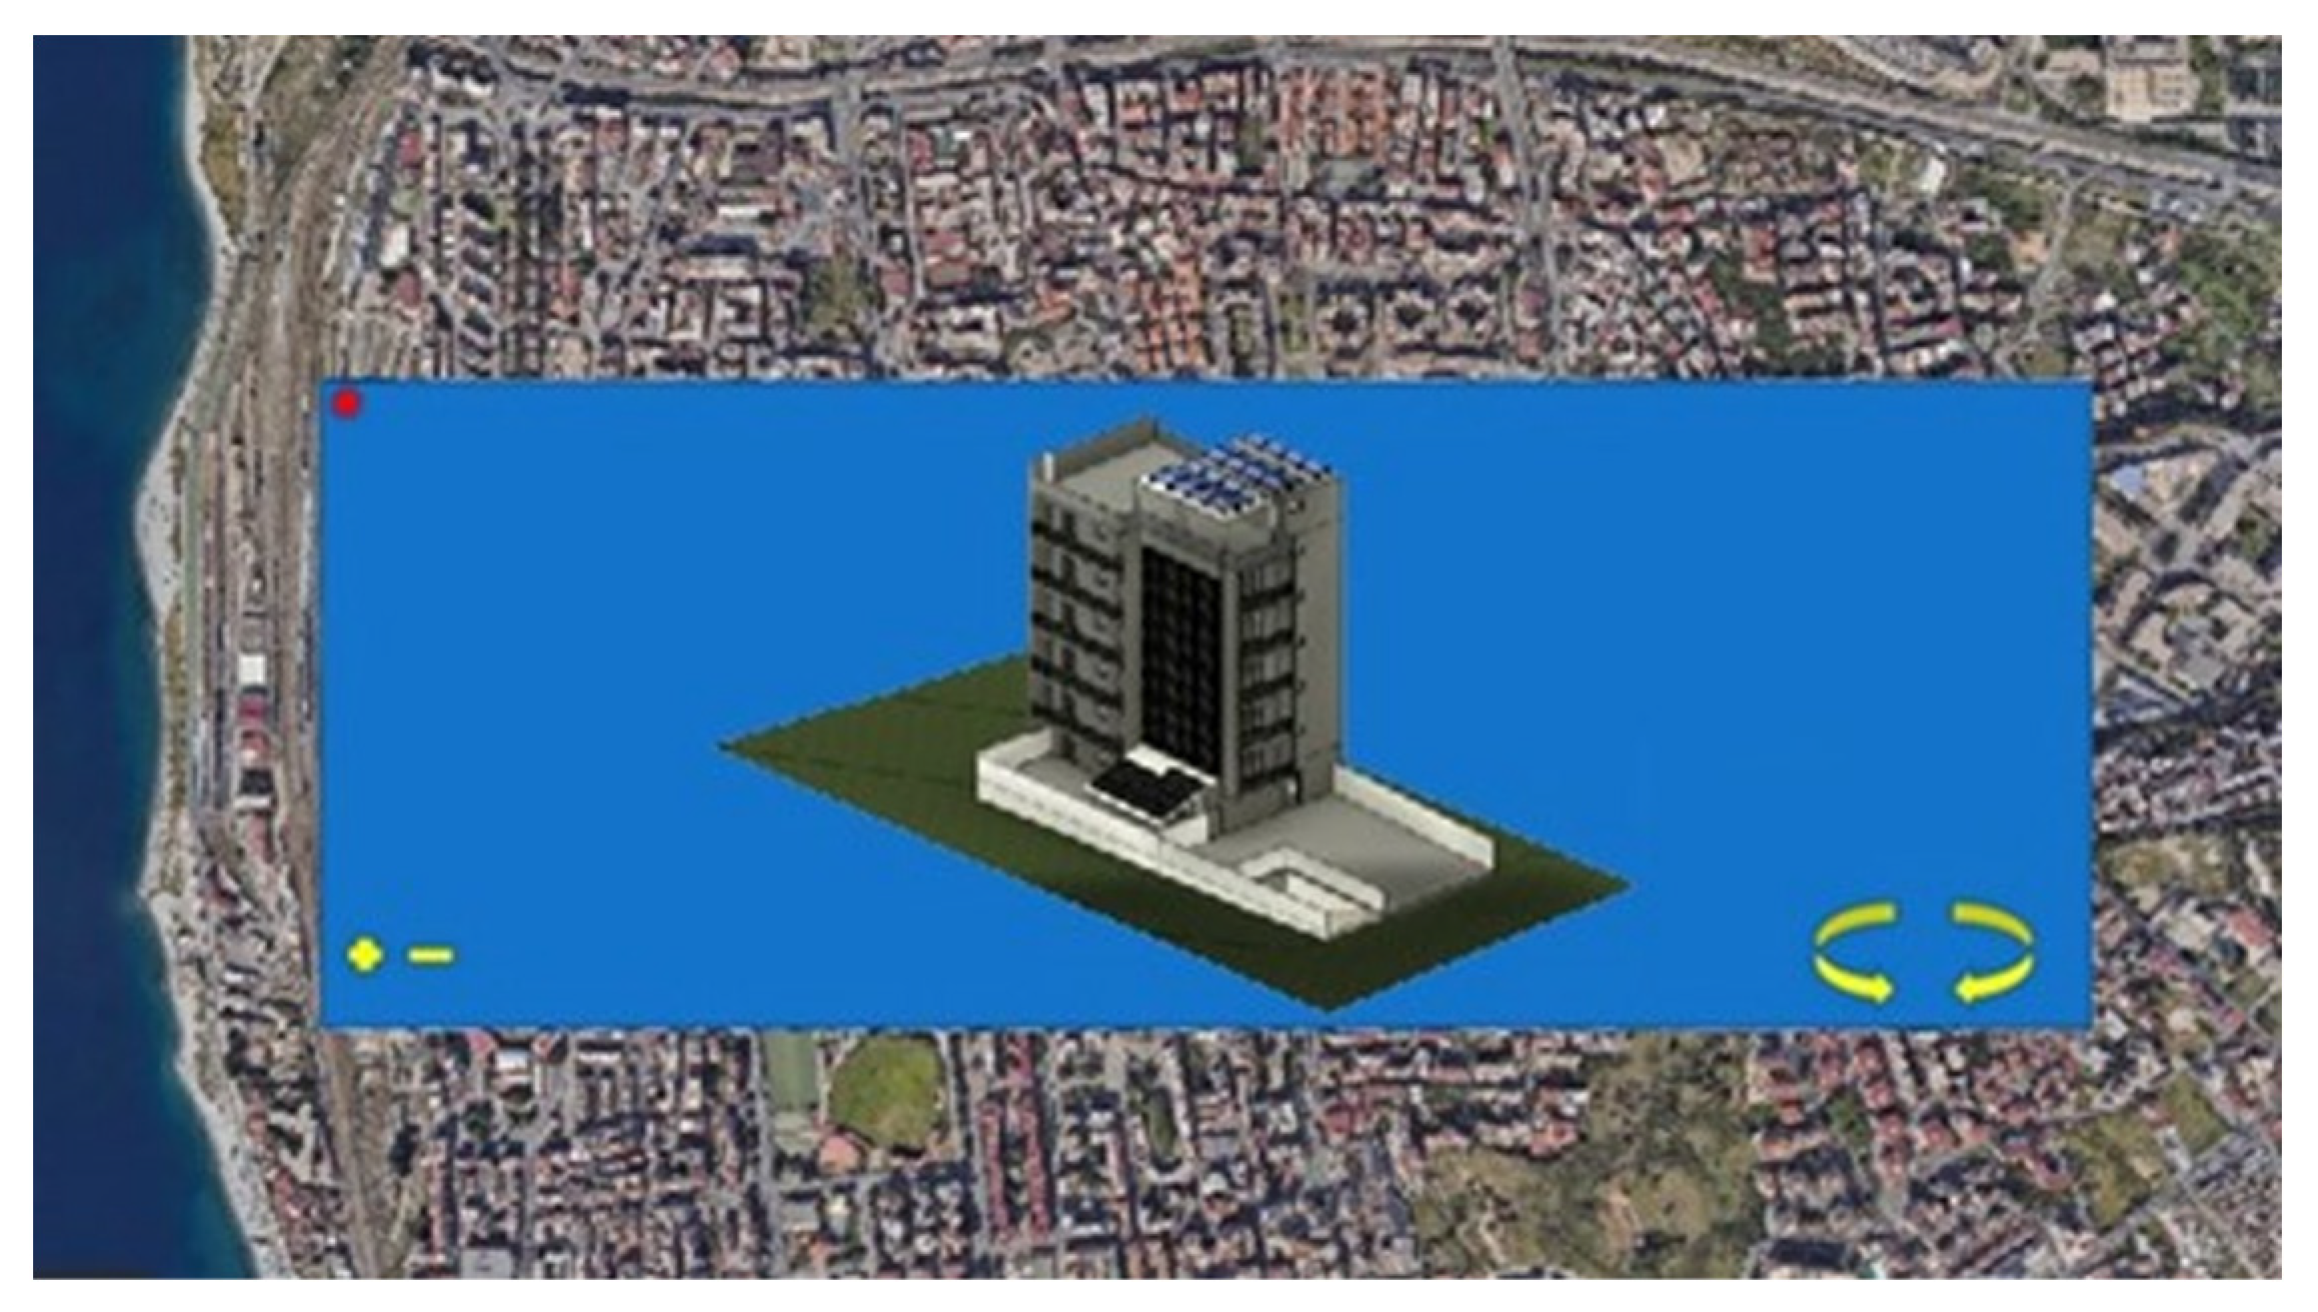
Figure 13 shows the screenshot of the three-dimensional model view on the GIS map. Obviously, from a general point of view, the representation of the model through an interactive virtual and augmented reality app guarantees the capacity of interaction with the model itself as well as the capacity of having accurate information of the building in the environment in which it is located. Furthermore, the operator can also access it remotely without going to the location where the building itself is located.
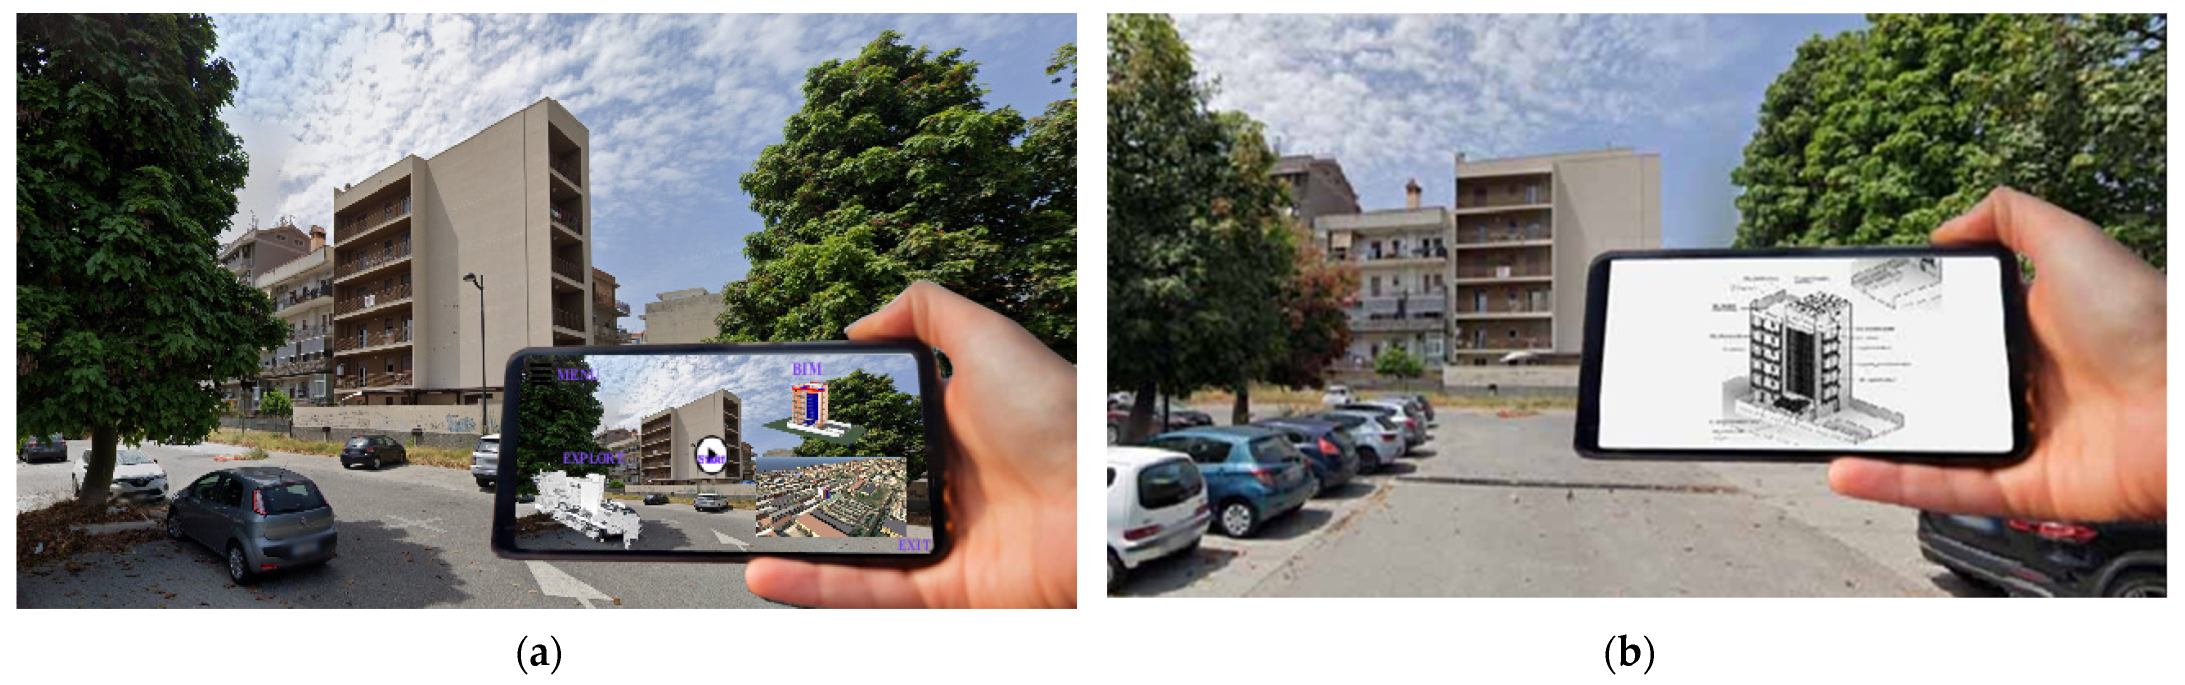
Figure 14a,b show the app screen that is activated when the device frames the building being surveyed on site. Various functions can be activated, including that of displaying the features of the 3D building.
By exploiting the potential of VR/AR/MR reality, it is also possible to see the various phases of the survey both in places different from the actual location of the building, and in situ by interacting with it.
In this regard,
Figure 15a shows the point cloud relating to the phase of the survey and illustrates a virtual representation of the surveyed area in an internal environment. The immersive experience can be exchanged with non-headset users through a monitor, allowing for multiple participants to engage simultaneously.
Figure 15b instead shows the possibility for users to virtually navigate and explore the BIM model. They can examine individual elements within the model by using distinct phases of modeling.
The VR/AR/MR reality offers a more accurate spatial perception: it improves the comprehension of the dimensions, distances, and proportions of the elements of the survey, allowing for a more accurate evaluation of the details and the relationships between the different elements that are composing the structure.
4.3. Cesium Platform
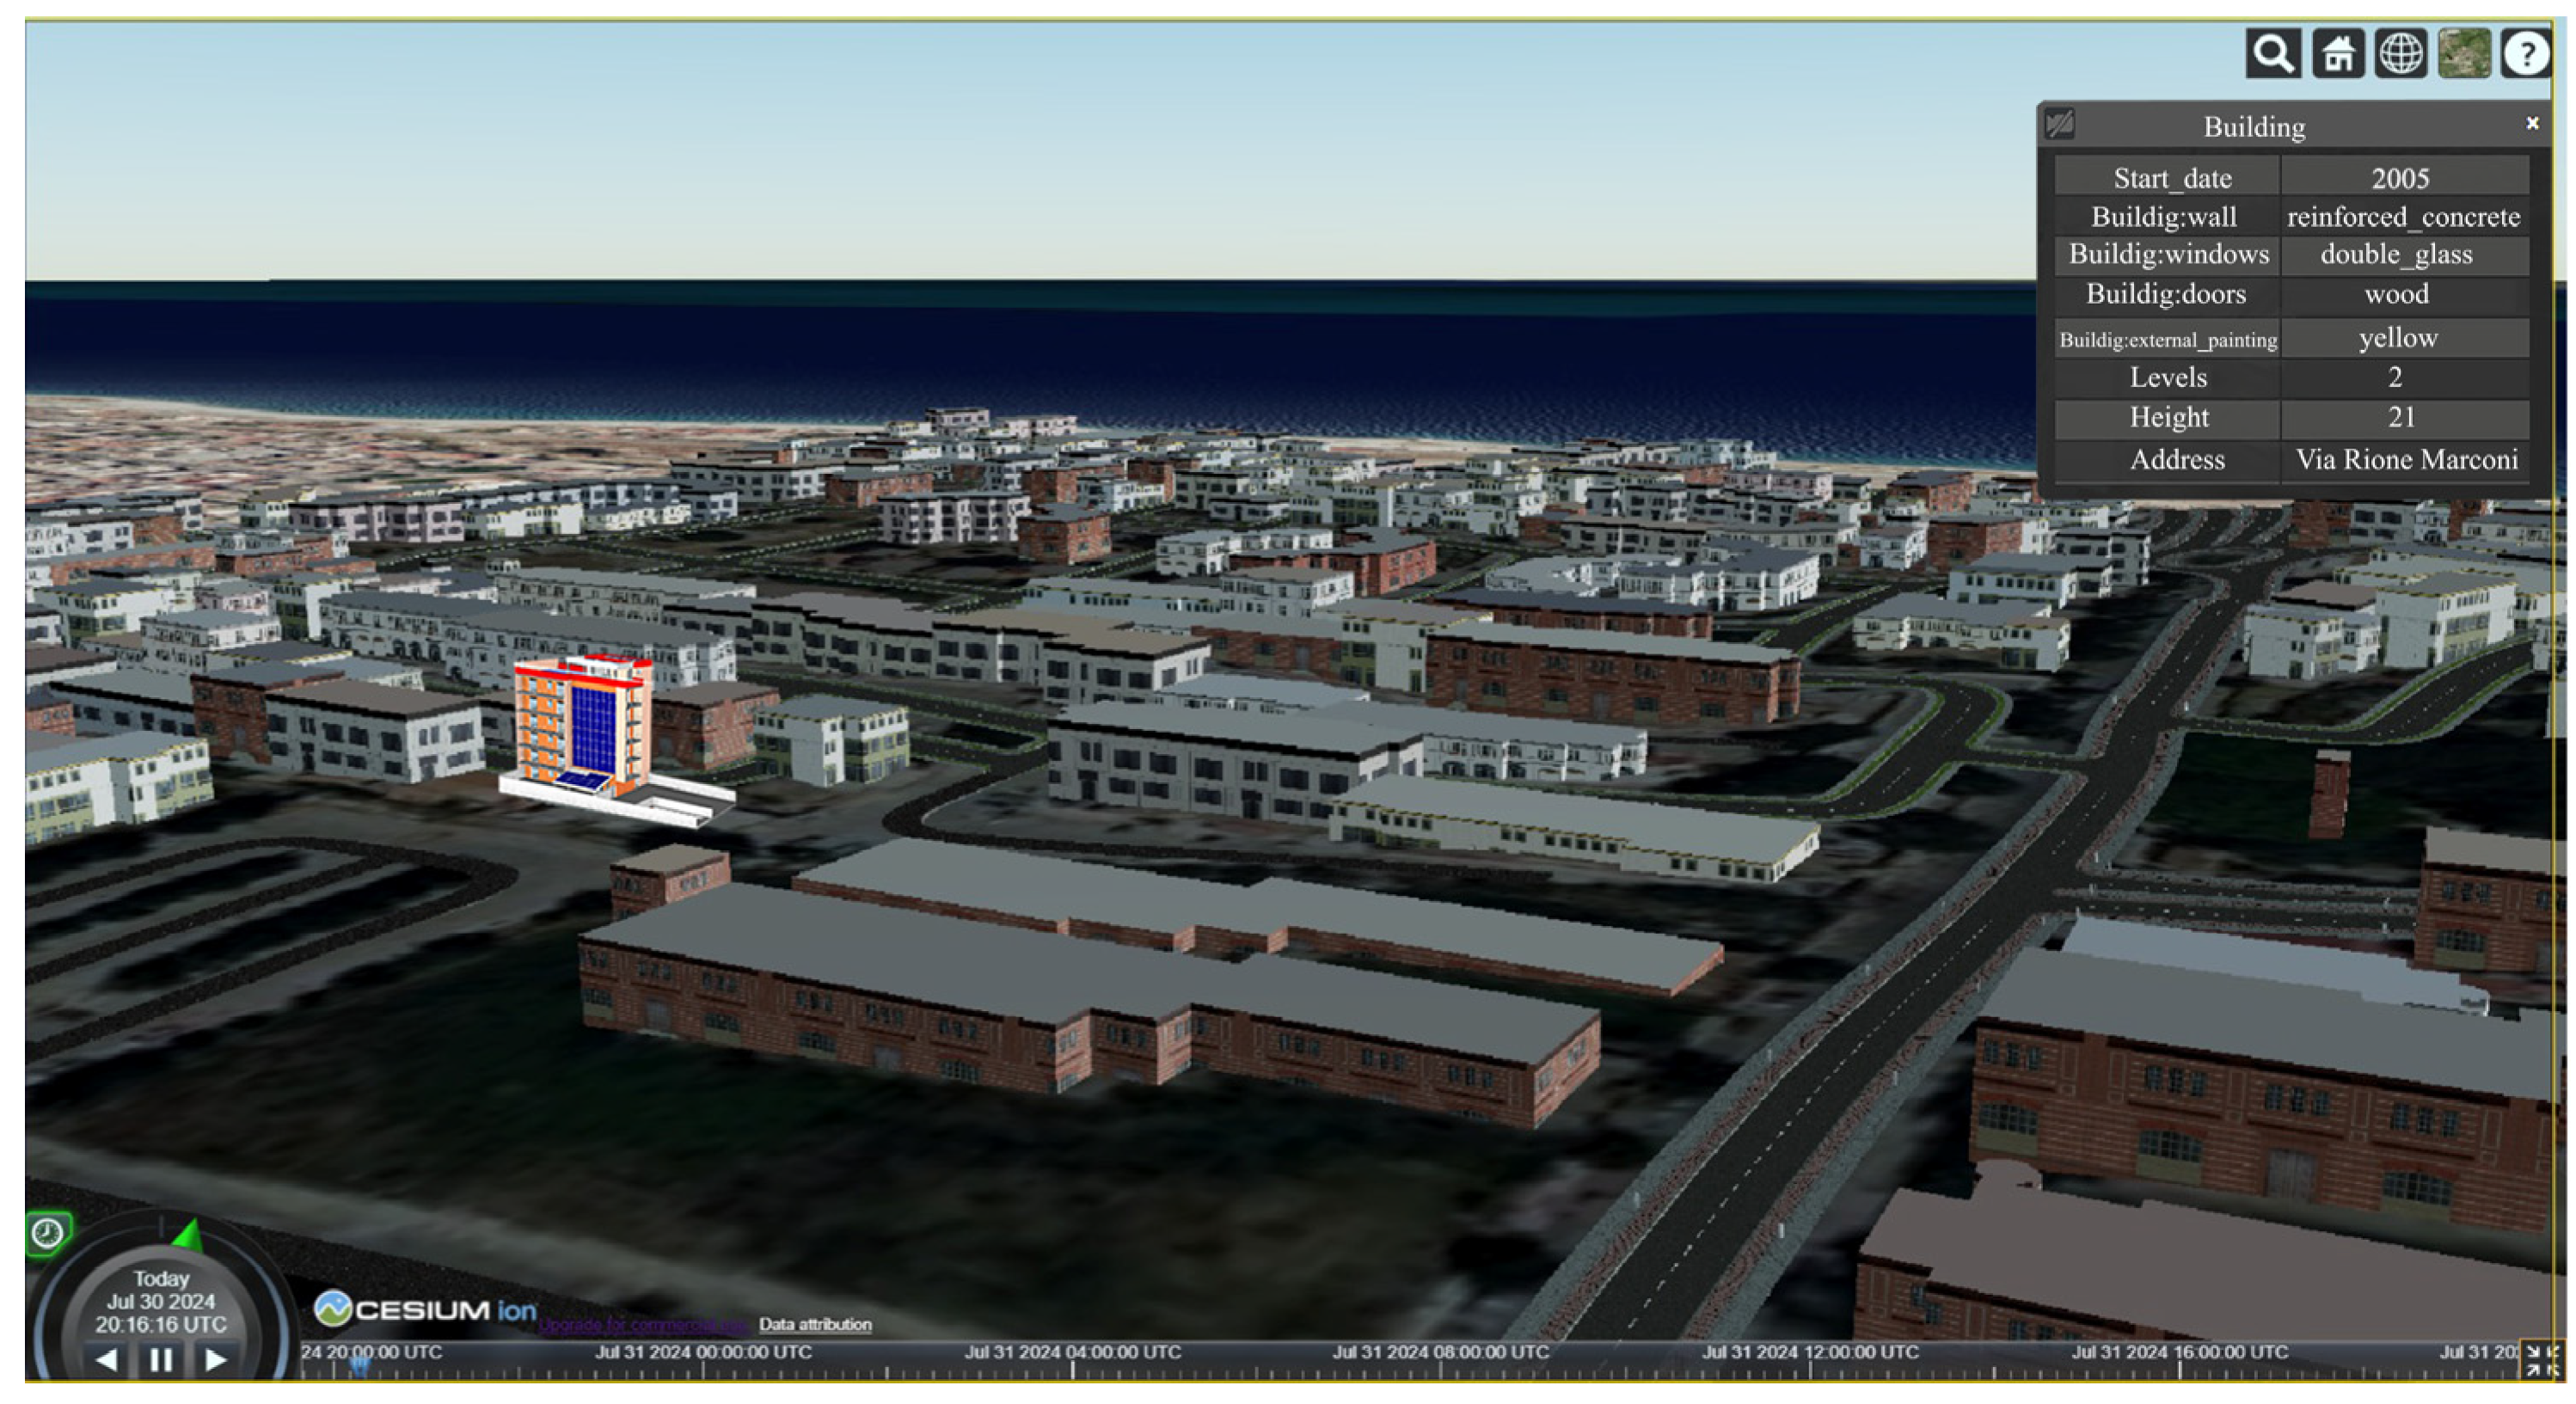
Obviously, as mentioned, this technique exhibits drawbacks in the use of VR/AR reality. In this regard, to overcome the limitations of both the first and the second method, a method based on the use of the libraries and the Cesium platform is proposed. In particular, a software module was implemented for the conversion of the .ifc file into the .cityGML file. The result of this combination is emphasized in
Figure 16, highlighting the characteristics present in the 3D model in the drop-down menu when the building of interest is queried.
The advantages of this merging are evident, allowing to integrate GIS-like modeling and BIM data both in its three-dimensional representation and with regard to querying, also here in GIS style (identify, filter, etc.). Below, in the picture, it is possible to observe the presence of a time bar that allows for conducting temporal simulations. In fact, by updating the BIM data in real time (by also integrating different kinds of sensors), it is possible to make simulations over time of the structural behavior of the building, allowing for evaluations of the influence of the positioning of the building (for example, evaluating the exposure to the sun during the day) on the performance of the materials used (in the facade or structural of the facade renovation), and on the state of deterioration of the photovoltaic panels. To display temporal data, CesiumJS uses CZML, a JSON format, for describing dynamic graphics. CZML allows for representing moving objects, changes over time, and other temporal dynamics. CesiumJS can integrate dynamic data in real time using WebSockets for continuous two-way communication and REST APIs for periodic update requests, allowing users to update visualizations in real time with data from sensors, data feeds, or other dynamic sources. Real-time data, such as the location of vehicles and the state of infrastructure or weather conditions, can be visualized using data streams that continuously update the scene in CesiumJS. The possibility of geo-temporal analysis therefore guarantees the study of short-, medium-, and long-term phenomena.
The data acquired can be used to simulate the impact of distinctive design solutions directly on the BIM model, reduce errors, and make data-driven decisions. It is possible to monitor infrastructures in real-time and to control the security and durability of structures thanks to more accurate inspections. Lastly, it can be used to strategize and oversee maintenance interventions using comprehensive data and forecast upcoming maintenance requirements, contributing to the realization of so-called digital twins.
5. Discussion
Using Autodesk Infraworks still has some disadvantages, caused by the depth of the information and the limitations of the software itself. In fact, despite its advanced features, Infraworks still fails to fully handle all characteristics of BIM and GIS data. Therefore, a valid alternative could be the use of a virtual/augmented/mixed reality app, which allows for immediate visualization of the issues related to city planning and the potential of interacting with the model both in situ and on site. The app provides flexibility and convenience when visualizing interventions directly on site, enabling stakeholders to immediately assess and interact with the 3D models in real time. This pragmatic viewpoint is essential for making well-informed decisions during the project’s execution phase, enabling modifications and enhancements as necessary. However, combining a software module with Cesium libraries provides a more customizable and reliable solution that goes beyond simple visualization. It creates an all-inclusive, freely accessible system that can be tailored and expanded in accordance with the particular project necessities. Undoubtedly, the proposed experimental approach with Cesium ion represents a future direction in this field: the creation of a platform that integrates 3D–4D data within a three-dimensional geospatial environment. The advanced customization of the layers present in the library would make it possible to obtain increasingly detailed information at the building level, thus guaranteeing true integration of the potential of both software programs. The developers could therefore implement increasingly complex and complete scripts to be inserted within the Cesium open-source platform, viewable on any device.
In the literature, many contributions highlight similar approaches. Lam et al. (2024) [
50] proposed data transformation methods involving mapping. They converted IFC data into CityGML and subsequently into PWL/RDF, visualizing the results on the Cesium ion platform. Clementi et al. [
51] proposed an interesting methodology for integrating open data related to solar radiation with in situ measurements to develop a GIS-based digital twin and create maps useful for urban planners and farmers. However, they highlight the necessity of combining mapped data with a database based on available energy and lighting. In the same field, Shirinyan and Petrova-Antonova [
52] focused their research on calculating solar incident radiation using remote sensing data for the creation of an urban digital twin. Simultaneously, Lv et al. [
53] used a module called “Sandbox” to create a platform with Unreal Engine for visualization in virtual/augmented reality. Overall, the issue of integrating BIM and GIS is well presented by Okonta et al., [
54] who discuss data conversion and emerging technologies like virtual and augmented reality. Referring to the contemporary literature cited above, this work proposes a solution for the correct georeferencing of buildings (IFC data) in Cesium ion in a GIS environment, an issue that is still complex. Moreover, the innovative aspect lies in its ability to provide information in the 4D domain (a real new characteristic in this field), and to present a case study demonstrating the use of the entire system for planning building renovation interventions and potentially realizing a digital twin starting from a point cloud. Obviously, all the potential problems relating to the loss of detailed information that occur during the conversion of files from a source format to a target format could remain, which are currently subject to further investigation.


