Article

Investigating the Use of Differential Scanning Calorimetry in the Prediction of Part Properties in the High-Speed Sintering Process

School of Mechanical, Aerospace and Civil Engineering, University of Sheffield, Sheffield S1 3JD, UK
*
Author to whom correspondence should be addressed.
Appl. Sci. 2024, 14(19), 8667; https://doi.org/10.3390/app14198667
Submission received: 16 July 2024 / Revised: 5 September 2024 / Accepted: 18 September 2024 / Published: 26 September 2024
(This article belongs to the Section Additive Manufacturing Technologies)

Abstract

:
High-speed sintering (HSS) is an additive manufacturing (AM) technique with high potential for end-use products. Previous research has identified differential scanning calorimetry (DSC) as being a viable method for evaluating the mechanical performance of parts manufactured using the (similar) laser sintering (LS) process through the determination of the degree of particle melt (DPM). This research expands this to demonstrate the applicability of DPM measurement to the HSS process, demonstrating a clear linear correlation between tensile properties and DPM. The DPM increased from 64.9% to 75.8% as sinter speed was reduced from 180 mm/s to 140 mm/s (a slower speed providing a higher energy input), with the ultimate tensile strength approximately doubling over this range. High coefficients of determination (>0.9) indicate that the DPM is a strong indicator of tensile properties, demonstrating the potential for DPM measurements as quality assessment tools for the HSS process.

1. Introduction

1.1. Overview

Additive manufacturing (AM) is defined as “the process of joining materials to make parts from 3D model data, usually layer-upon-layer” [1]. The geometric freedom, customisation, and reduced material waste permitted by AM techniques enable parts to be manufactured which are considered impractical using traditional processing routes such as extrusion or injection moulding. While AM has traditionally been used for prototyping and tooling, increased industrial interest in recent years has meant that it is now being considered for the creation of end-use products.
Polymer powder bed fusion (PBF) comprises a group of processes considered well-suited for the creation of end-use products, allowing good mechanical properties without the need for surrounding supports [2]. Laser sintering (LS) is the most well-established PBF technique out of those commercially available, utilising a CO2 laser incident on a bed of preheated powder to apply enough energy to sinter and solidify select regions. In comparison, high-speed sintering (HSS) (along with similar processes such as multijet fusion and selective absorption fusion) is a PBF technique that deposits a radiation-absorbing material (RAM) onto the surface of the powder and uses an infrared (IR) lamp to selectively sinter and solidify regions where the RAM has been deposited, as shown in Figure 1. Although it applies the same general principle as LS, HSS was designed with increased industrial productivity in mind due to its ability to sinter multiple parts concurrently and the ease of scalability of the printheads and IR lamps.
It is suggested that, between 2021 and 2026, the AM market will grow at a compound annual growth rate (CAGR) of 27.5% [4]. In turn, when producing parts, their performance and properties must be fully understood and validated to ensure sufficient quality and confidence in the finished products. This is particularly true when considering the increasing use of polymer PBF processes for the production of end-use parts, including customised insoles [5], the printing of pharmaceuticals [6], and mobile robots [7]. Further examples of the use of polymer AM, such as for aerospace components, surgical guides, and tissue engineering, can be found in [8].
Traditionally, sacrificial test pieces such as tensile and three-point bending tests are included within a build file and used for the qualification of part properties [9], but they are time-consuming and reduce productivity by taking up valuable build space. For these reasons, it would be beneficial to develop an alternative method to determine these properties, to ensure confidence in part performance.

1.2. DSC-Derived DPM Calculation

As a method of predicting part and material properties, significant research has been conducted studying the viability of using differential scanning calorimetry (DSC) techniques [10]. DSC is a technique that involves measuring the energy required to heat or cool a known quantity of material at a given rate, and, as such, it is capable of identifying key thermal characteristics of a material, such as the melting temperature and enthalpy of melting. For polymer PBF processes, DSC is primarily used to help identify the temperature at which the part bed is to be held throughout a build to simultaneously avoid melting the entire powder bed and crystallisation-induced part warpage.
However, DSC can also be conducted on small quantities (≈10 mg) of parts to determine the level of sintering induced during the manufacturing process, known as the degree of particle melt (DPM), a term first coined by Zarringhalam et al. [11]. DSC techniques are used to inform one about the DPM by identifying two distinct melting peaks and measuring their ratios—one corresponding to regions of powder particles which have been melted and crystallised, known as the “processing peak”, and another corresponding to particle cores encapsulated in the part which remains unmelted, known as the “core peak” [12,13]. These peaks are best represented by Figure 2, with their ratios being a direct consequence of the energy applied during printing.
The majority of previous research around this subject involved Nylon-12 parts produced using the LS process. Various findings show that the DPM increases with a higher amount of melted and crystallised material (MCM), formed from virgin powder [11], represented by an increased processing peak proportion. In addition, research has derived an equation to determine the DPM directly from DSC plots, as shown in Equation (1) [12].
D P M = ( T o t a l   c r y s t a l l i n i t y C o r e   c r y s t a l l i n i t y ) ( M C M   c r y s t a l l i n i t y C o r e   c r y s t a l l i n i t y )
From previous research, it has been shown that the MCM crystallinity (fully melted part) and core crystallinity (original powder) are 25% and 47%, respectively, for LS Nylon-12, with full melting occurring between 24.9 and 25.8% [13]. The total crystallinity is the crystallinity of the sample and is either measured directly or using Equation (2) [12]. The direct calculation of the total crystallinity is achieved by measuring the total melt enthalpy of a sample via DSC and dividing it by the melt enthalpy of a 100% crystalline sample (209.3 J/g) [14]. The calculation of total crystallinity using Equation (2) relies on %MCM and %Core being determined from the relative sizes of the peaks observed.
T o t a l   c r y s t a l l i n i t y = % M C M × M C M   c r y s t a l l i n i t y + ( % C o r e × C o r e   c r y s t a l l i n i t y )
The DPM has been found to be inversely proportional to the crystallinity of the sample, disagreeing with the general appreciation that strength and stiffness increase at the expense of ductility [15]. It is therefore initially surprising that previous research determined that the strength of SLS Nylon-12 increases with an increasing DPM [16]. However, it was hypothesised during this research that an increasing DPM induces improved bonding between powder particles, acting to increase the overall integrity of the part despite the decreased crystallinity. It is therefore clear that DSC-derived DPM is a viable way of determining the mechanical properties of LS Nylon-12 parts.

1.3. DPM in High-Speed Sintering

In contrast to LS, there is limited research conducted, studying DPM for parts produced via HSS. A research conducted by Ellis et al. [17] studied the effect of varying ink densities on the mechanical properties of HSS Nylon-12, with the results suggesting that an increasing DPM results in increasing ultimate tensile strength (UTS), Young’s modulus (YM), and elongation at break (EaB), up to the point of full melting. However, variations in ink density do not necessarily correlate directly to changes in the energy input in the process. Other research efforts [18,19] have demonstrated that other sintering parameters in HSS also affect the mechanical properties, although no link between mechanical properties and DPM for these parameters has been reported. This paper demonstrates, for the first time, the ability to link DPM measurements to the mechanical properties of HSS parts and specific, quantifiable, measures of energy input through variations in the processing speed.

2. Experimental Methodology

2.1. Part Manufacturing

For each build (a single machine set-up and operation), five ASTM D638 type I tensile samples were manufactured for mechanical testing. Alongside these, four “density blocks” were also manufactured for determining the DPM via DSC. The arrangement of tensile samples and density blocks within the build volume is shown in Figure 3. It should be noted that, whilst the manufactured density blocks were large to enable other tests to be carried out alongside this research, in a commercial build, these could be significantly smaller and more widely dispersed throughout the build volume, as only 5–10 mg of material is required for individual DPM calculations.
The tensile samples and density blocks were manufactured using virgin Nylon-12 powder (PA2200 from EOS) on a voxeljet VX200 HSS machine (voxeljet, Friedberg, Germany). In order to vary the energy density (and, therefore, the mechanical properties) of the manufactured parts, the sinter speed was increased in 20 mm/s increments between 140 mm/s and 180 mm/s (Table 1). Whilst other previously reported parameters such as part bed temperature or lamp power could have been used, sinter speed was selected, as it has the smallest impact on other aspects of the process such as powder removal or spectral absorption. All other parameters were maintained for each build, their values detailed in Table 2.
Upon build completion, the HSS machine was allowed to cool to below the glass transition temperature of the material, with the samples then being removed and cooled to room temperature. This was to ensure that the cooling rate for each build was kept consistent, as the polymer cooling rate is known to influence crystallinity [20]. Excess unbound powder was removed by hand before the parts were bead-blasted using a Guyson Euroblast 4SF blast cabinet (Guyson, Saratoga Springs, NY, USA).

2.2. DSC-Derived DPM Results

All DSC samples were tested using a Perkin Elmer DSC8500 (PerkinElmer, Waltham, MA, USA). Two samples from each of the three test builds were obtained by collecting 5–10 mg of part shavings from the centre of the density blocks. Sampling from the centre of the block is essential to avoid the inclusion of unmelted particles from the surface of the part. These particles can adhere to the part surface during the application of “finish” layers, which are included in order to assist the cooling process. The process we describe in this paper cannot distinguish between unmelted particle cores within the part and these surface particles; the inclusion of the surface would, therefore, disproportionately affect the results, leading to inaccurate calculations of the DPM.
While a value of MCM crystallinity for LS Nylon-12 from the literature could have been used (25%), it was deemed important to identify a corresponding value for HSS Nylon-12, as the introduction of RAM into the parts and the differing cooling profiles between machines could produce different resultant crystallinities. To obtain this value, a new build with the same layout as Figure 3 was carried out in HSS, with the aim of producing a fully melted sample. For this build, the sinter speed was reduced to 100 mm/s, and only 20 preheat layers were deposited prior to RAM deposition, ensuring that parts could be obtained prior to overheating and subsequent build failure. Whilst not fully representative of a standard HSS build, this was found to produce the closest approximation of the peak temperatures and cooling profile compared to a number of other methods attempted. The parts produced from this build were, otherwise, post-processed and prepared for DSC testing in line with other samples. In addition to the part samples, approximately 10 mg of virgin PA2200 was tested, from which the core crystallinity was determined and compared with the literature values (47%).
The prepared samples were subjected to the heating and cooling profile shown in Table 3. The Perkin Elmer Pyris software (version 11) was then used to calculate the melt enthalpy of each sample by drawing a baseline under any melt peaks and calculating the area between the baseline and the curve, as demonstrated in Figure 4. The MCM, core, and total (sample) crystallinities were then calculated using melt enthalpies from the relevant DSC traces and Equation (3), taking the melt enthalpy of a 100% crystalline Nylon-12 sample to be 209.3 J/g, as obtained in [14]. The DPM values for each sample were then calculated using Equation (1) in Section 1.2, with average values and standard deviations calculated for each data point.
C r y s t a l l i n i t y   % = M e l t   e n t h a l p y   o f   s a m p l e   ( J g ) M e l t   e n t h a l p y   o f   100 %   c r y s t a l l i n e   s a m p l e   ( J g ) × 100

2.3. Tensile Testing

Tensile testing was conducted in accordance with ASTM D638 [21] using a strain rate of 5 mm/min. Testing was completed using a Tinius Olsen H5kN tensile tester (Tinius Olsen, Horsham, PA, USA), with a H500L laser extensometer used to determine the EaB. The mechanical properties from each of the five tensile samples per build were then averaged, and the standard deviation was calculated to represent the variability in the properties within a single build.

2.4. Statistical Analysis

The coefficient of determination (also known as the R-Squared value) can be used to quantify which proportion of variation in a dependent variable can be explained by an independent variable in a regression model. In this work, the R-Squared value was used to identify the strength of correlation between the measured DPM and the tensile properties, with a higher R-Squared value indicating a stronger correlation.

3. Results

3.1. MCM and Core Crystallinity Values

The calculated values for the MCM and core crystallinity can be seen in Table 4. From the results, it can be seen that both the MCM and core values calculated were greater than those reported in the literature, by 25% and 47%, respectively [13]. Whilst the differences between the reported core crystallinities could have been the result of slight changes in the material’s composition since the original value in the literature was published, a more probable cause could be the way in which melt enthalpy was calculated from the raw DSC data. As there is no standardised method for determining an appropriate baseline for a given DSC trace, the resultant melt enthalpy values can vary by several percentages based on what any given operator determines to be an appropriate baseline. This operator error is exacerbated by traces that do not possess a sudden melt onset (commonly called a “tail”), an example of which can be seen on the left of the melt peak in Figure 4.
In addition to the variability introduced by the absence of a standardised method for determining an appropriate baseline, the higher MCM value reported in Table 4 could also be attributed to the samples used not being fully melted. This is evidenced in Figure 5, where a small secondary peak can be seen to the right of the main MCM peak, a result of the remaining unmelted core material with a higher crystallinity. However, as this was the highest energy density which could be obtained by varying sinter speed whilst still obtaining complete parts, this value was used as the equivalent of a 100% melted sample. Indeed, it should be noted that this will produce DPM values that are greater than equivalent LS samples (i.e., LS samples would be expected to contain a higher proportion of MCM material for a given DPM than their HSS counterparts).

3.2. Degree of Particle Melt

Using the MCM and core crystallinity values reported in Section 3.1, the DPM values for each sinter speed tested were calculated (Table 5). While an increase in the average DPM with increasing energy densities was recorded, this increase was found to be much smaller than anticipated and was accompanied by very large variability in the results within individual builds, providing little confidence in the repeatability and accuracy of the process. This was again attributed to the variability introduced by the lack of a standardised method for determining an appropriate baseline, rather than the absence of a change in DPM, due to clear changes in the ratios of MCM and core peaks in the raw DSC data (Figure 6). As the alternative method of calculating total crystallinity in the literature using peak height also required the establishment of an appropriate baseline, this was not considered viable. Therefore, based on the difficulties of repeatably processing the raw DSC data using established methods found in the literature, in addition to challenges obtaining a true MCM value for HSS parts, an alternative processing method was sought.
In order to develop an alternative method for determining the DPM from DSC data, it was first necessary to establish a repeatable process for creating a baseline under any melt peaks. As the DSC data immediately following any melt peaks tend to produce a straight line, this section of the trace was identified as a useful reference point. Secondly, as the original definition of DPM was the percentage of melted and crystallised material within a given sample, it was decided to measure the area (melt enthalpy) of the MCM peak and compare it to the total area (combined MCM and core peak areas), eliminating the need to determine the MCM and core crystallinity values. Finally, reproducible temperature lines that bound and separated the MCM and core peaks needed to be established; these were selected to be the MCM peak onset, peak minima, and core peak end-temperatures. From this, the procedure outlined in Table 6 was developed, with the images in Figure 7 demonstrating how this can be achieved using the Perkin Elmer Pyris software.
Using the procedure outlined in Table 6, raw DSC data from the three HSS builds were reprocessed to obtain alternative DPM values (Table 7). Whilst part crystallinity cannot be obtained via this method, from the table and the corresponding graph (Figure 8), a clear correlation between the sinter speed (energy density) and the DPM can be seen, with the DPM increasing linearly from 64.9% to 75.8% as the sinter speed is reduced from 180 mm/s to 140 mm/s. The variability between results from the same build is also dramatically reduced, providing greater confidence in the trend observed and suggesting that the proposed alternative method for calculating the DPM is repeatable between samples.

3.3. Mechanical Properties

Table 8 shows the average ultimate tensile strength (UTS), Young’s modulus (YM), and elongation at break (EaB) values for each of the three sinter speeds (energy densities) tested. From the table, it can be seen that all three mechanical properties increased linearly as the energy density was increased.

3.4. Correlation between DPM and Mechanical Properties

Figure 9 presents the correlation between the calculated DPM and the tensile properties, with all three mechanical properties obtained from tensile samples showing a strong correlation with the DPM of density blocks located within close proximity.

4. Discussion

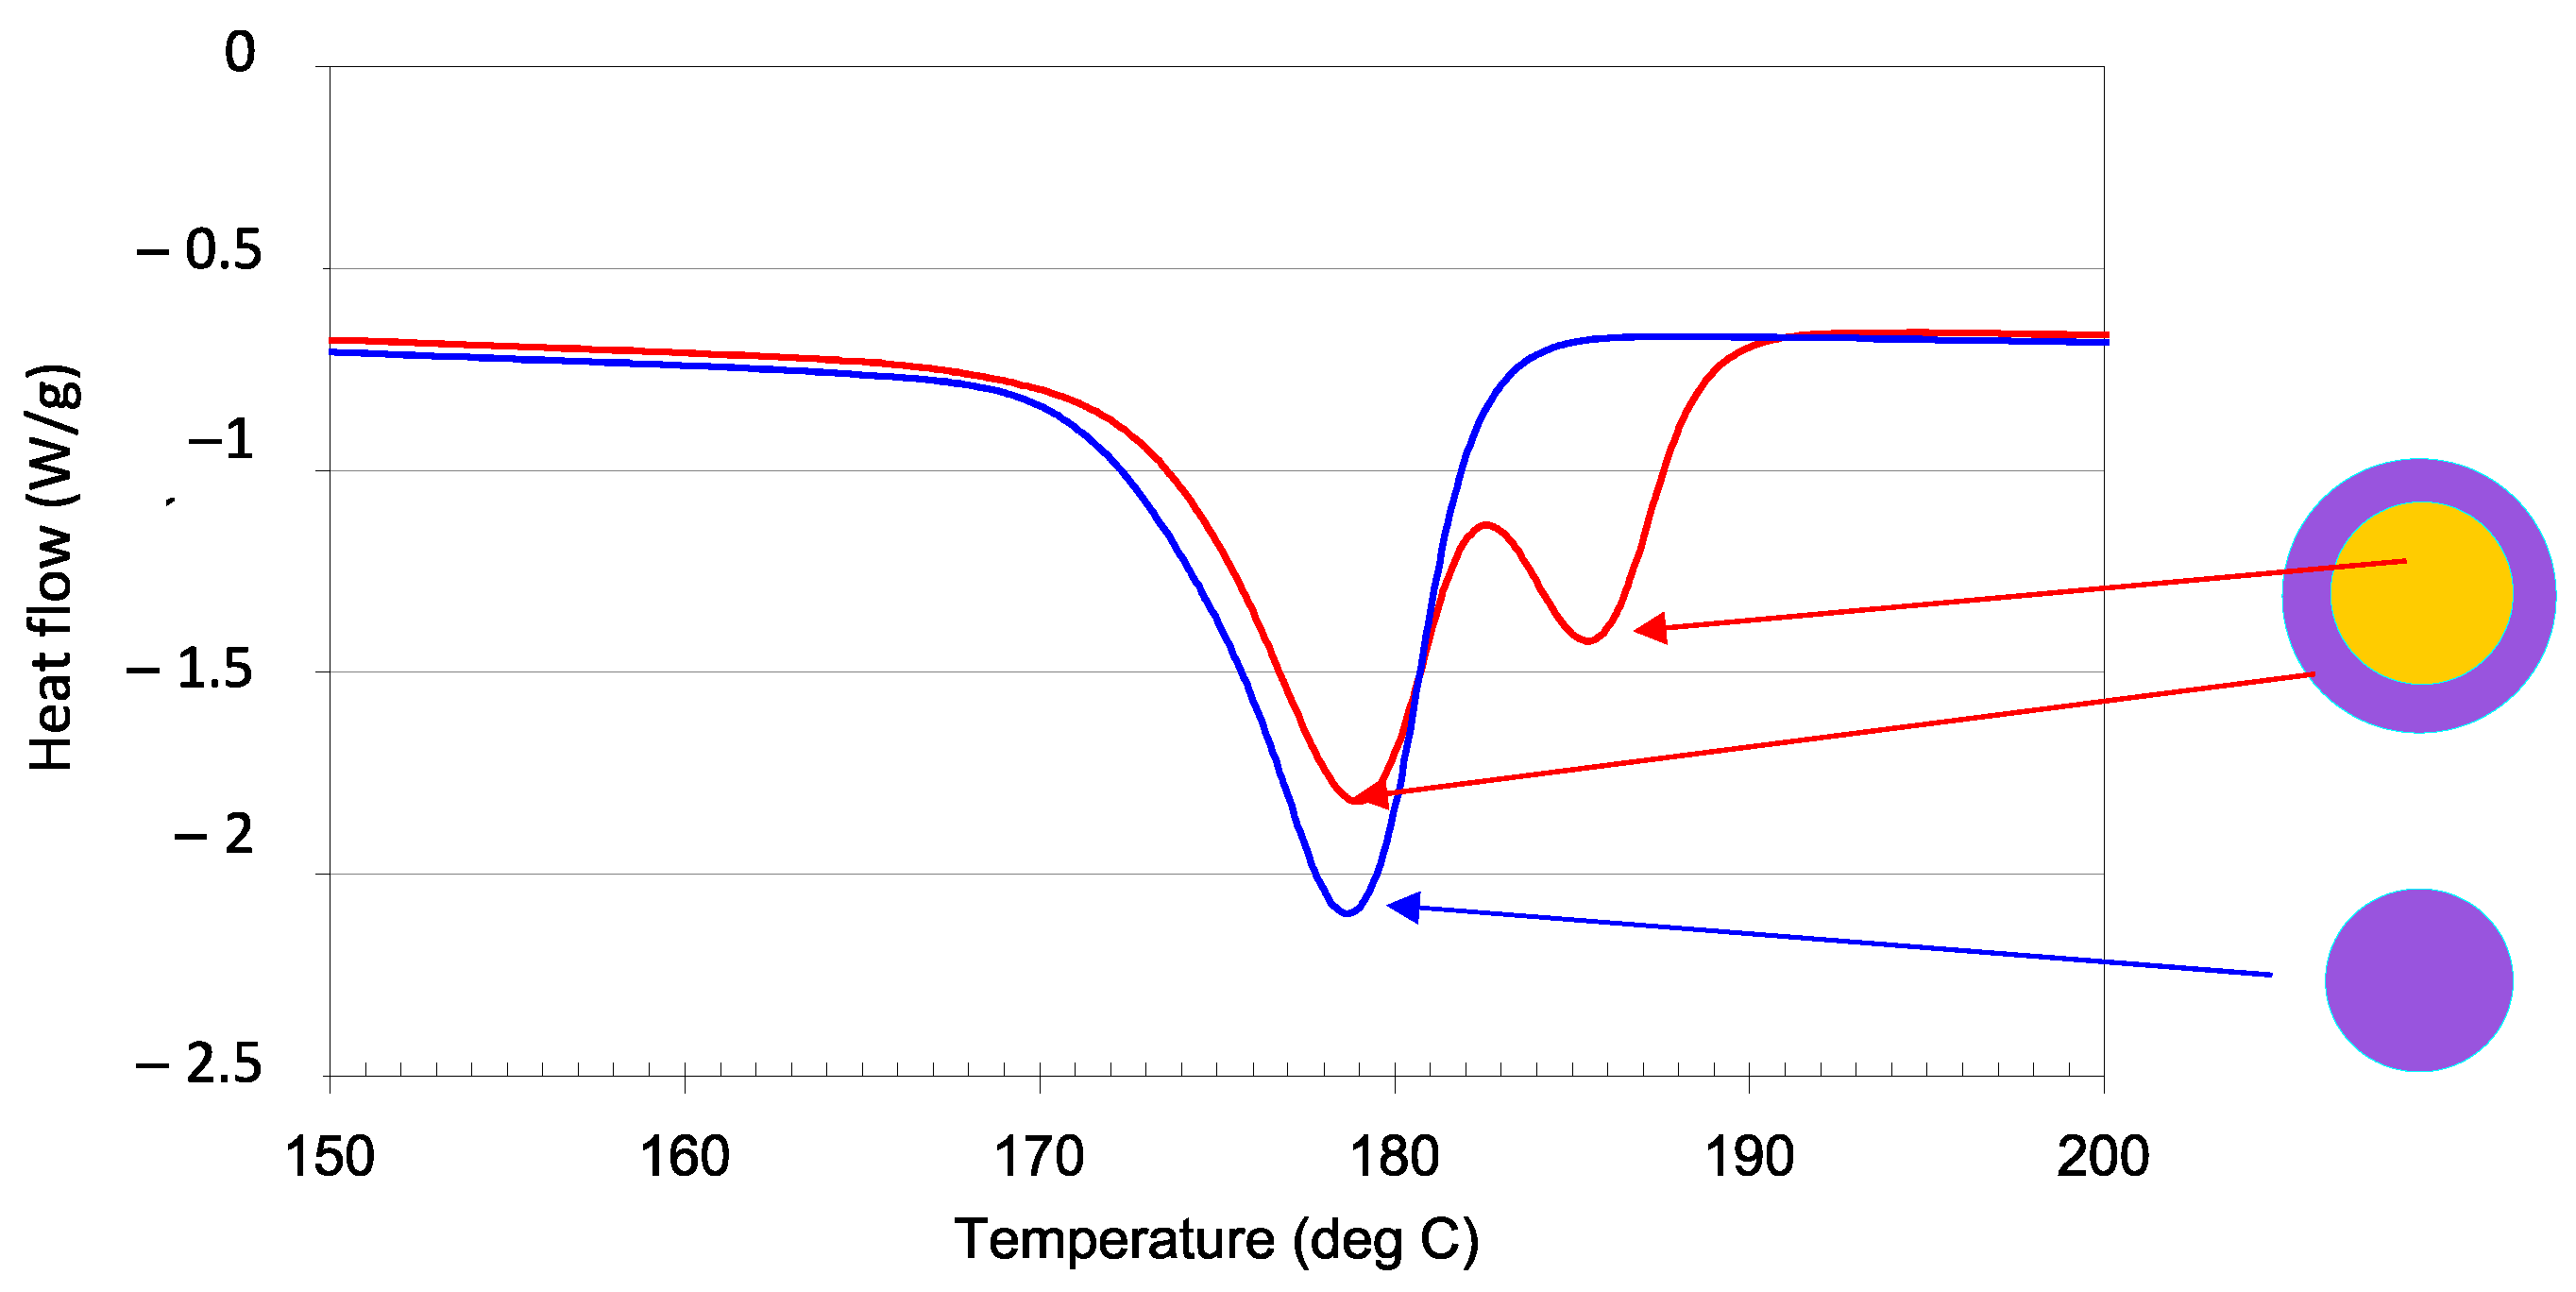
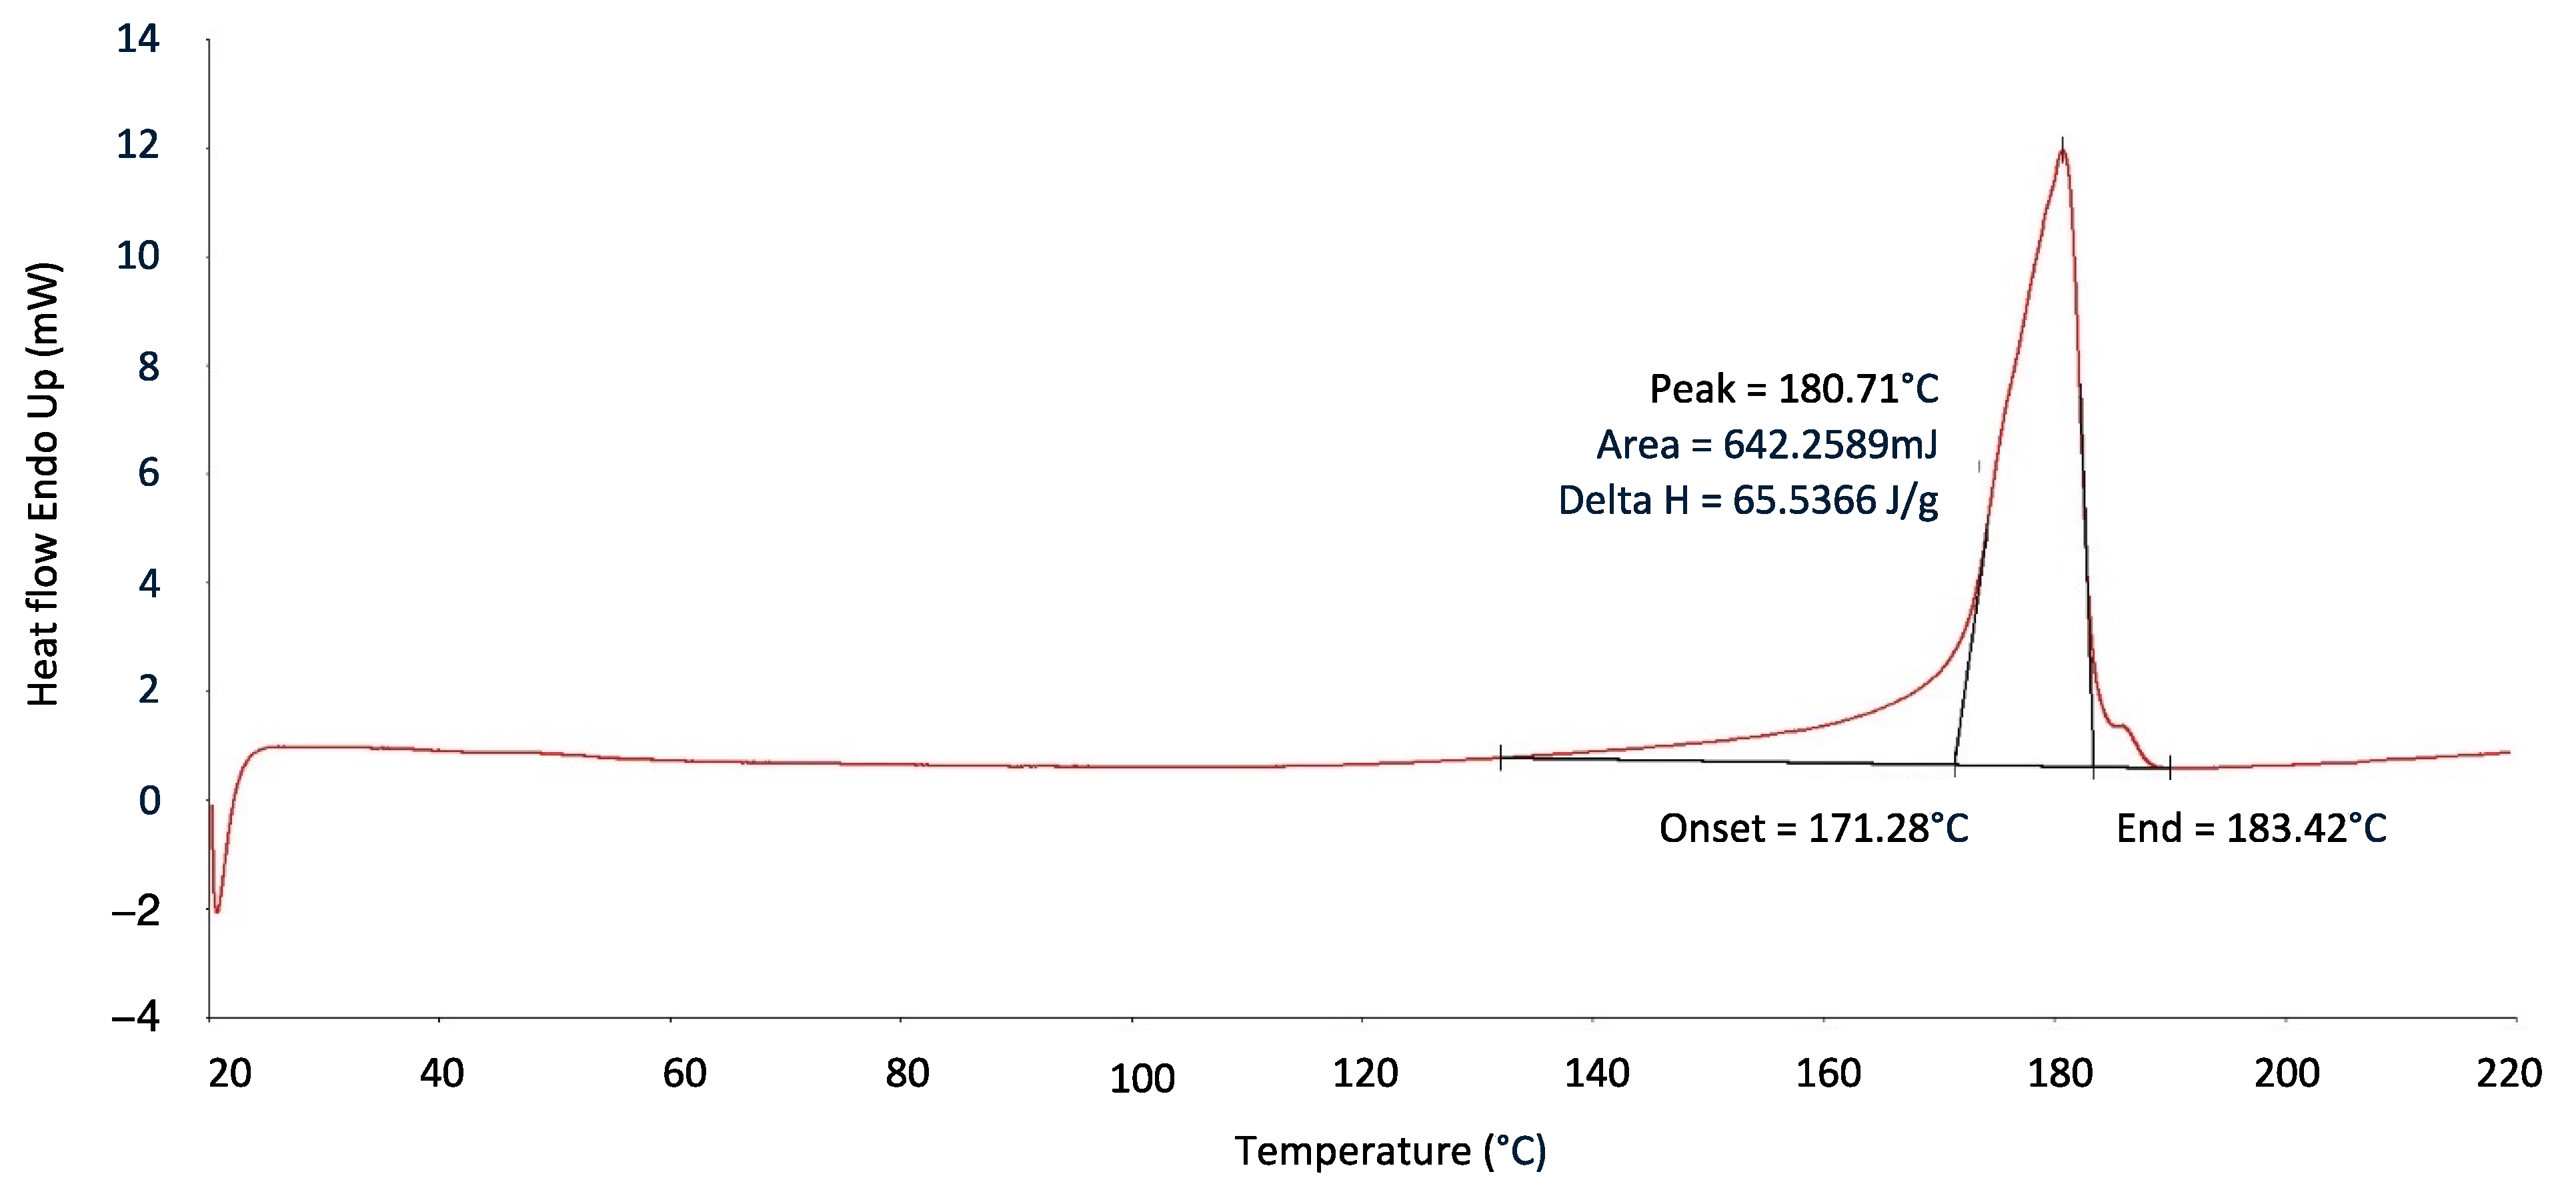
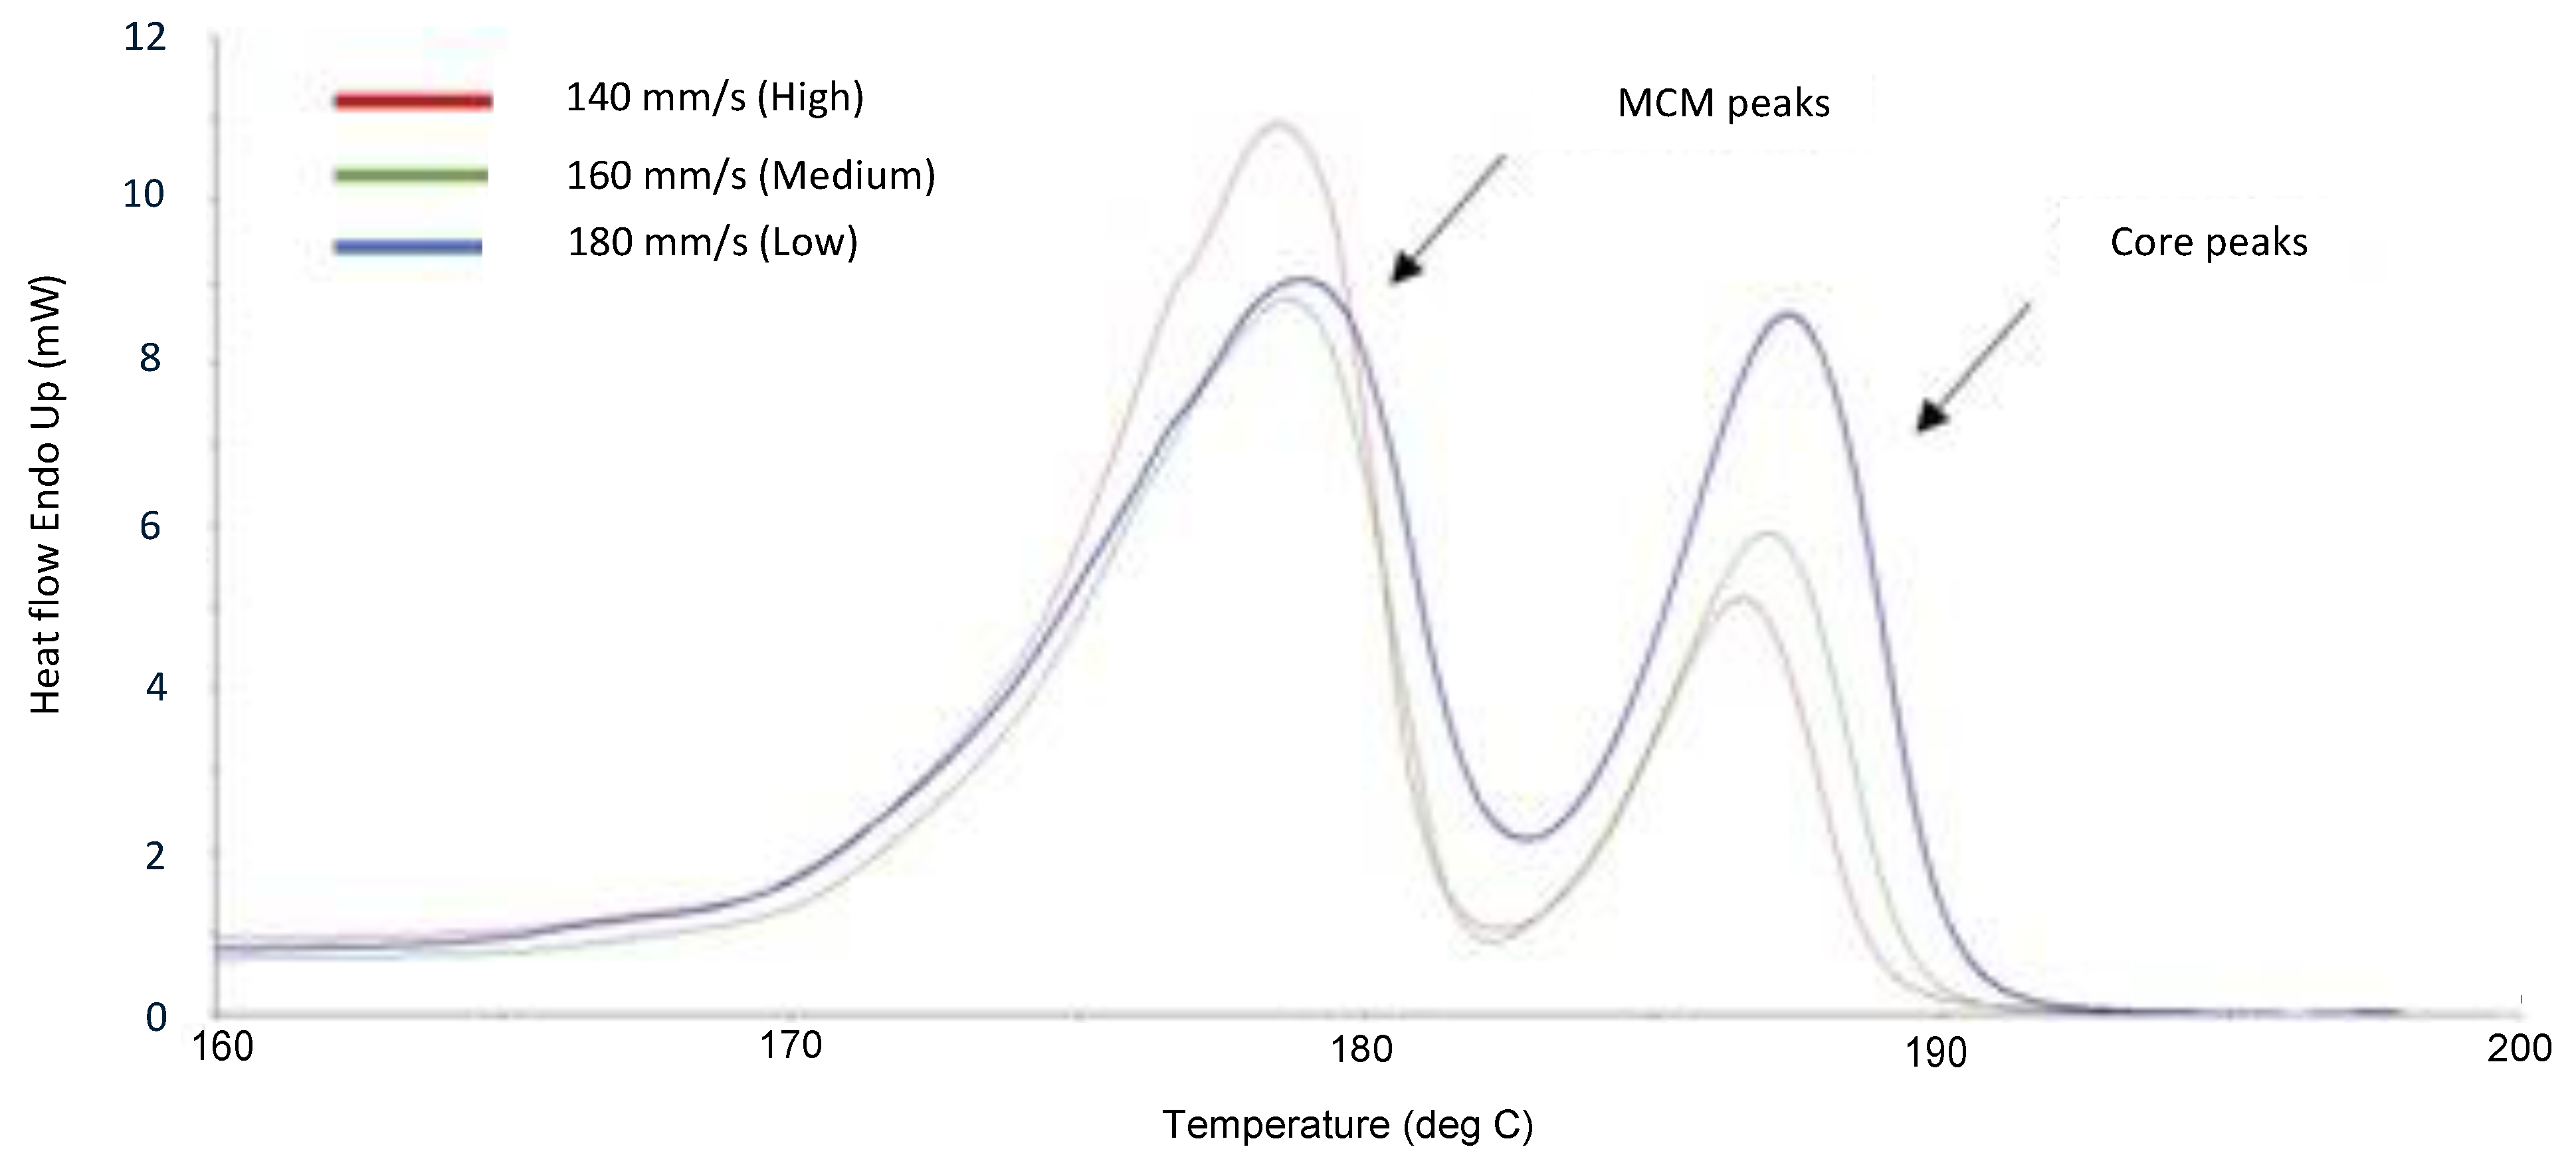
The trends seen here correlate well with the other literature focused on powdered polymer additive manufacturing, much of which has been based on selective laser sintering. Research on PA12, presented in [22], identified two peaks in the DSC traces, corresponding to the peaks of the raw powder and SEM images showing unmelted or partially melted particles.
The results presented in 
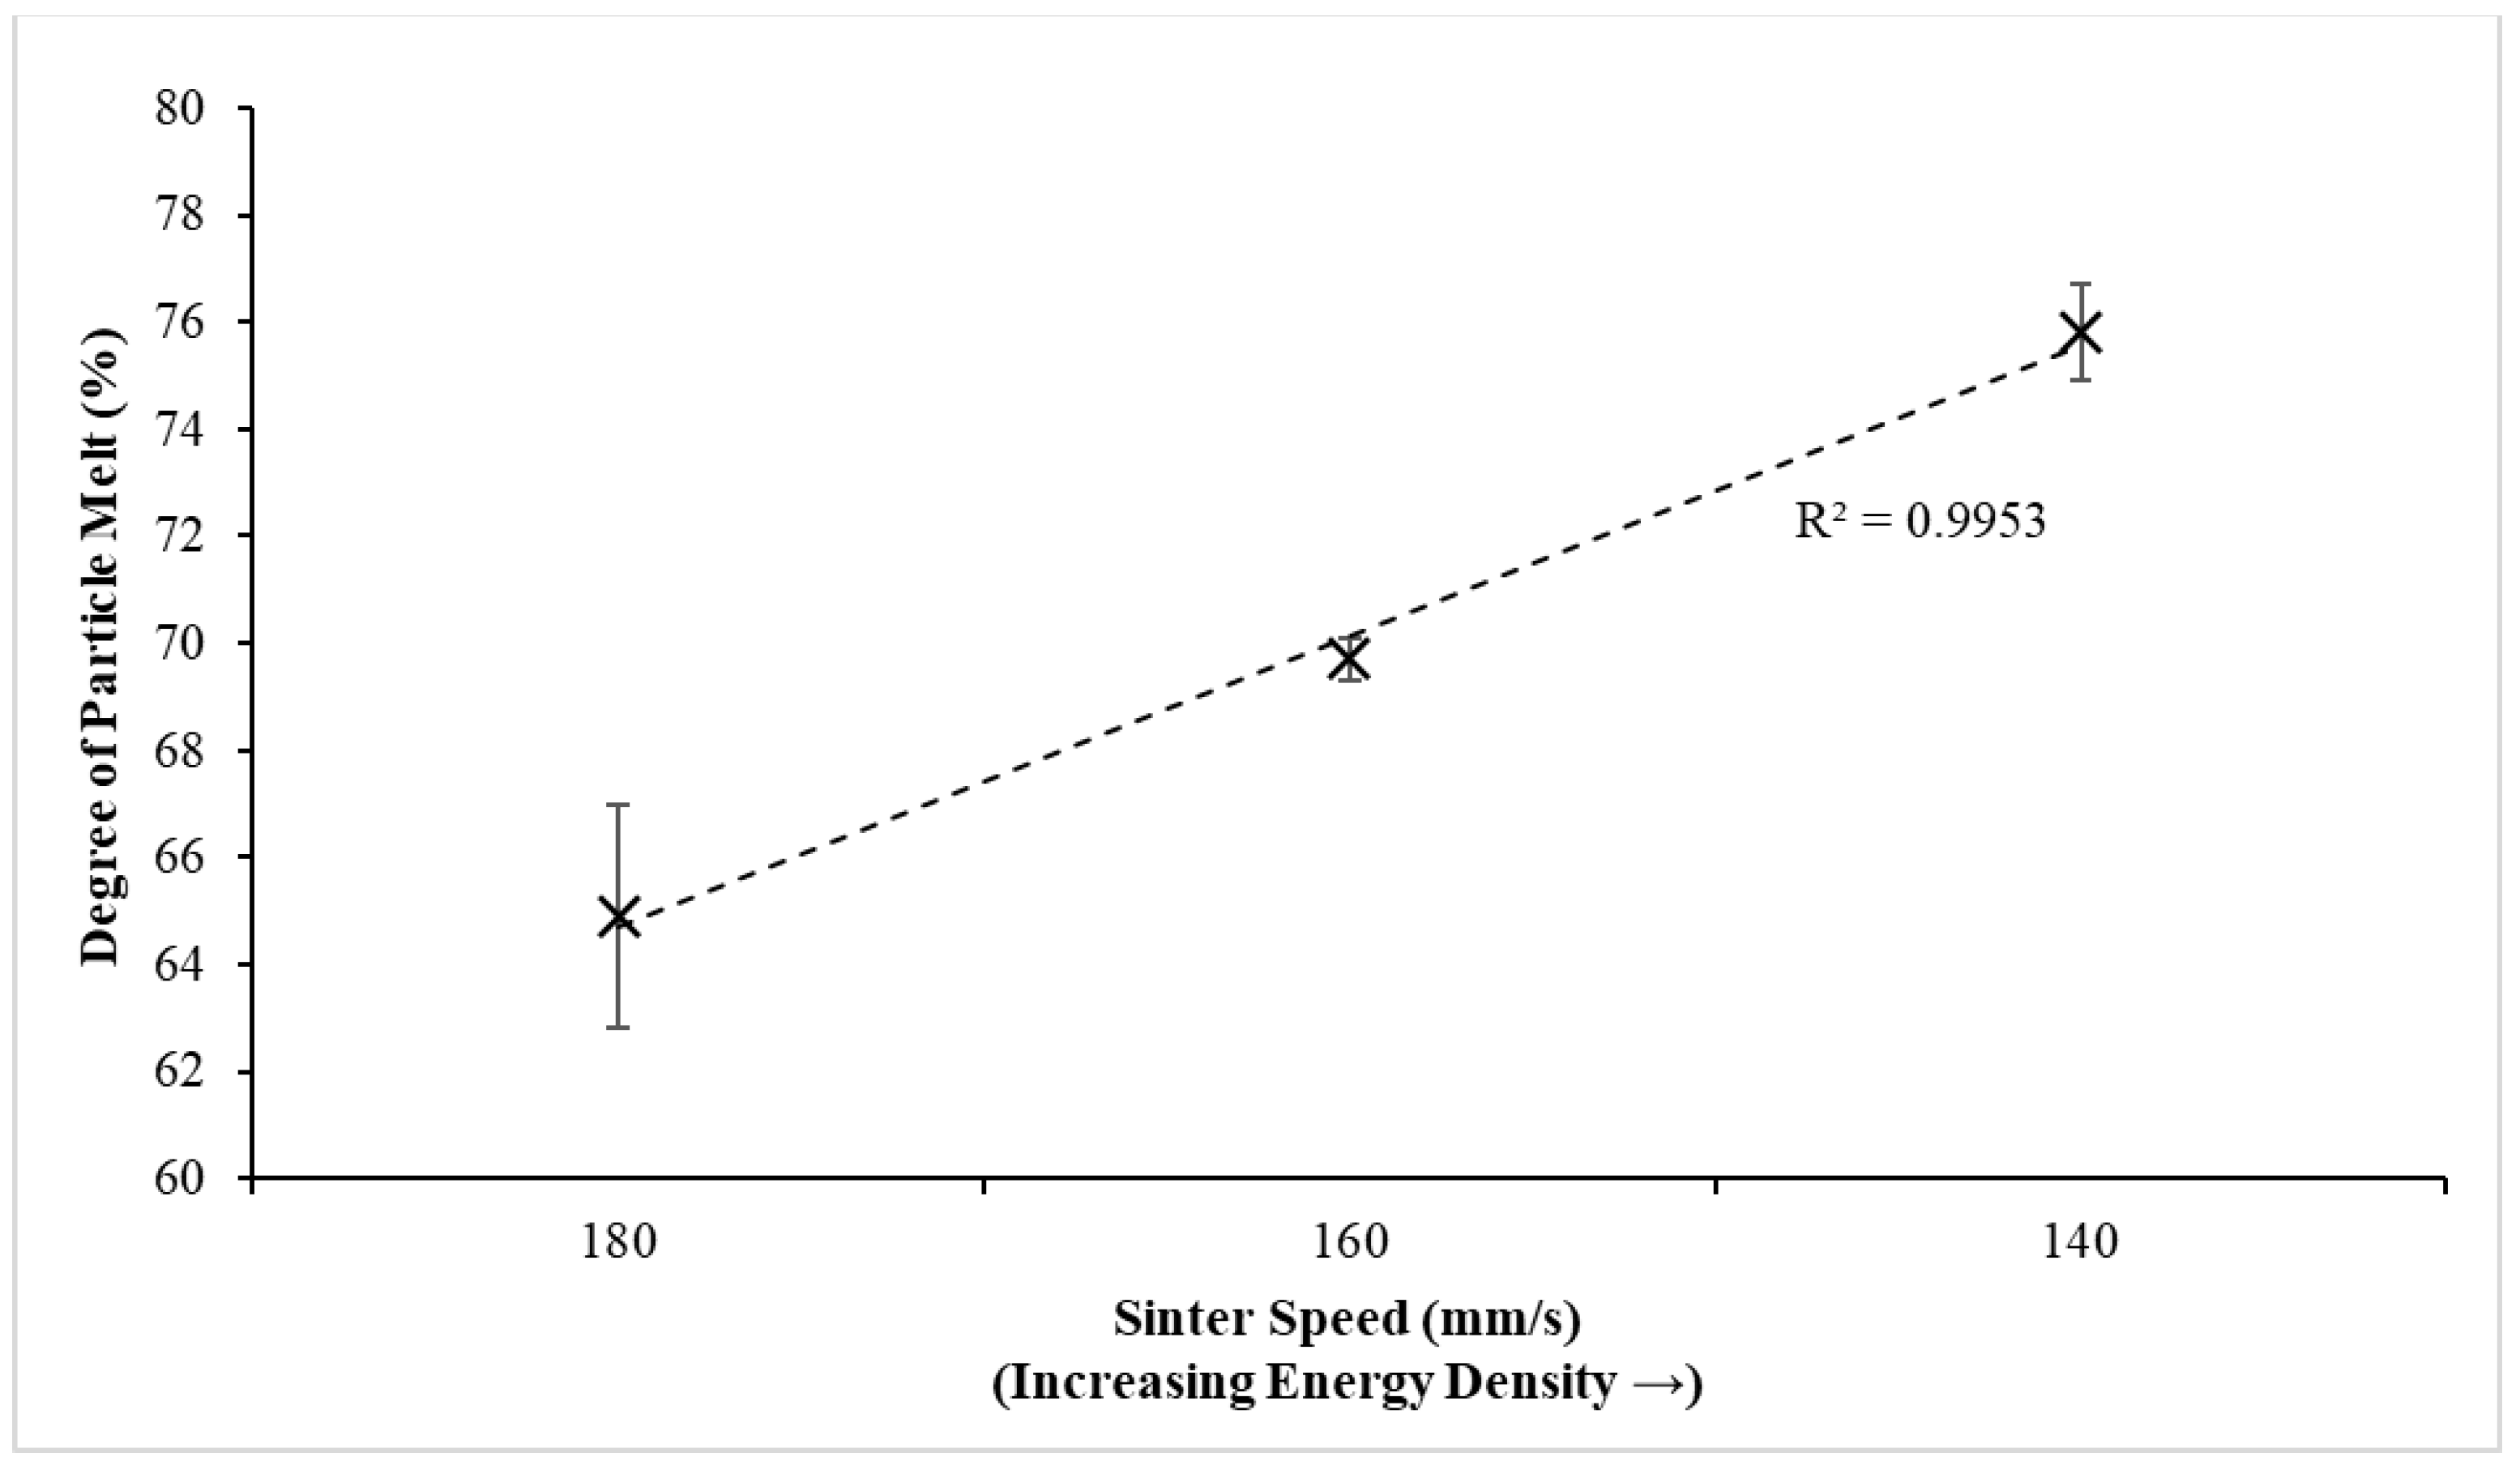
Table 8 indicate a linear increase in the mechanical properties as energy density increases. This is to be expected based on the existing literature relating to polymer powder bed fusion; early research into the laser sintering process [23] demonstrated increases in the tensile properties with increasing energy densities. Further research [24] showed similar effects, also identifying that the strength and modulus approach a maximum as the energy input exceeds the amount needed to fully melt the applied powder.
More recent research into the use of polyether block amide in the HSS process [
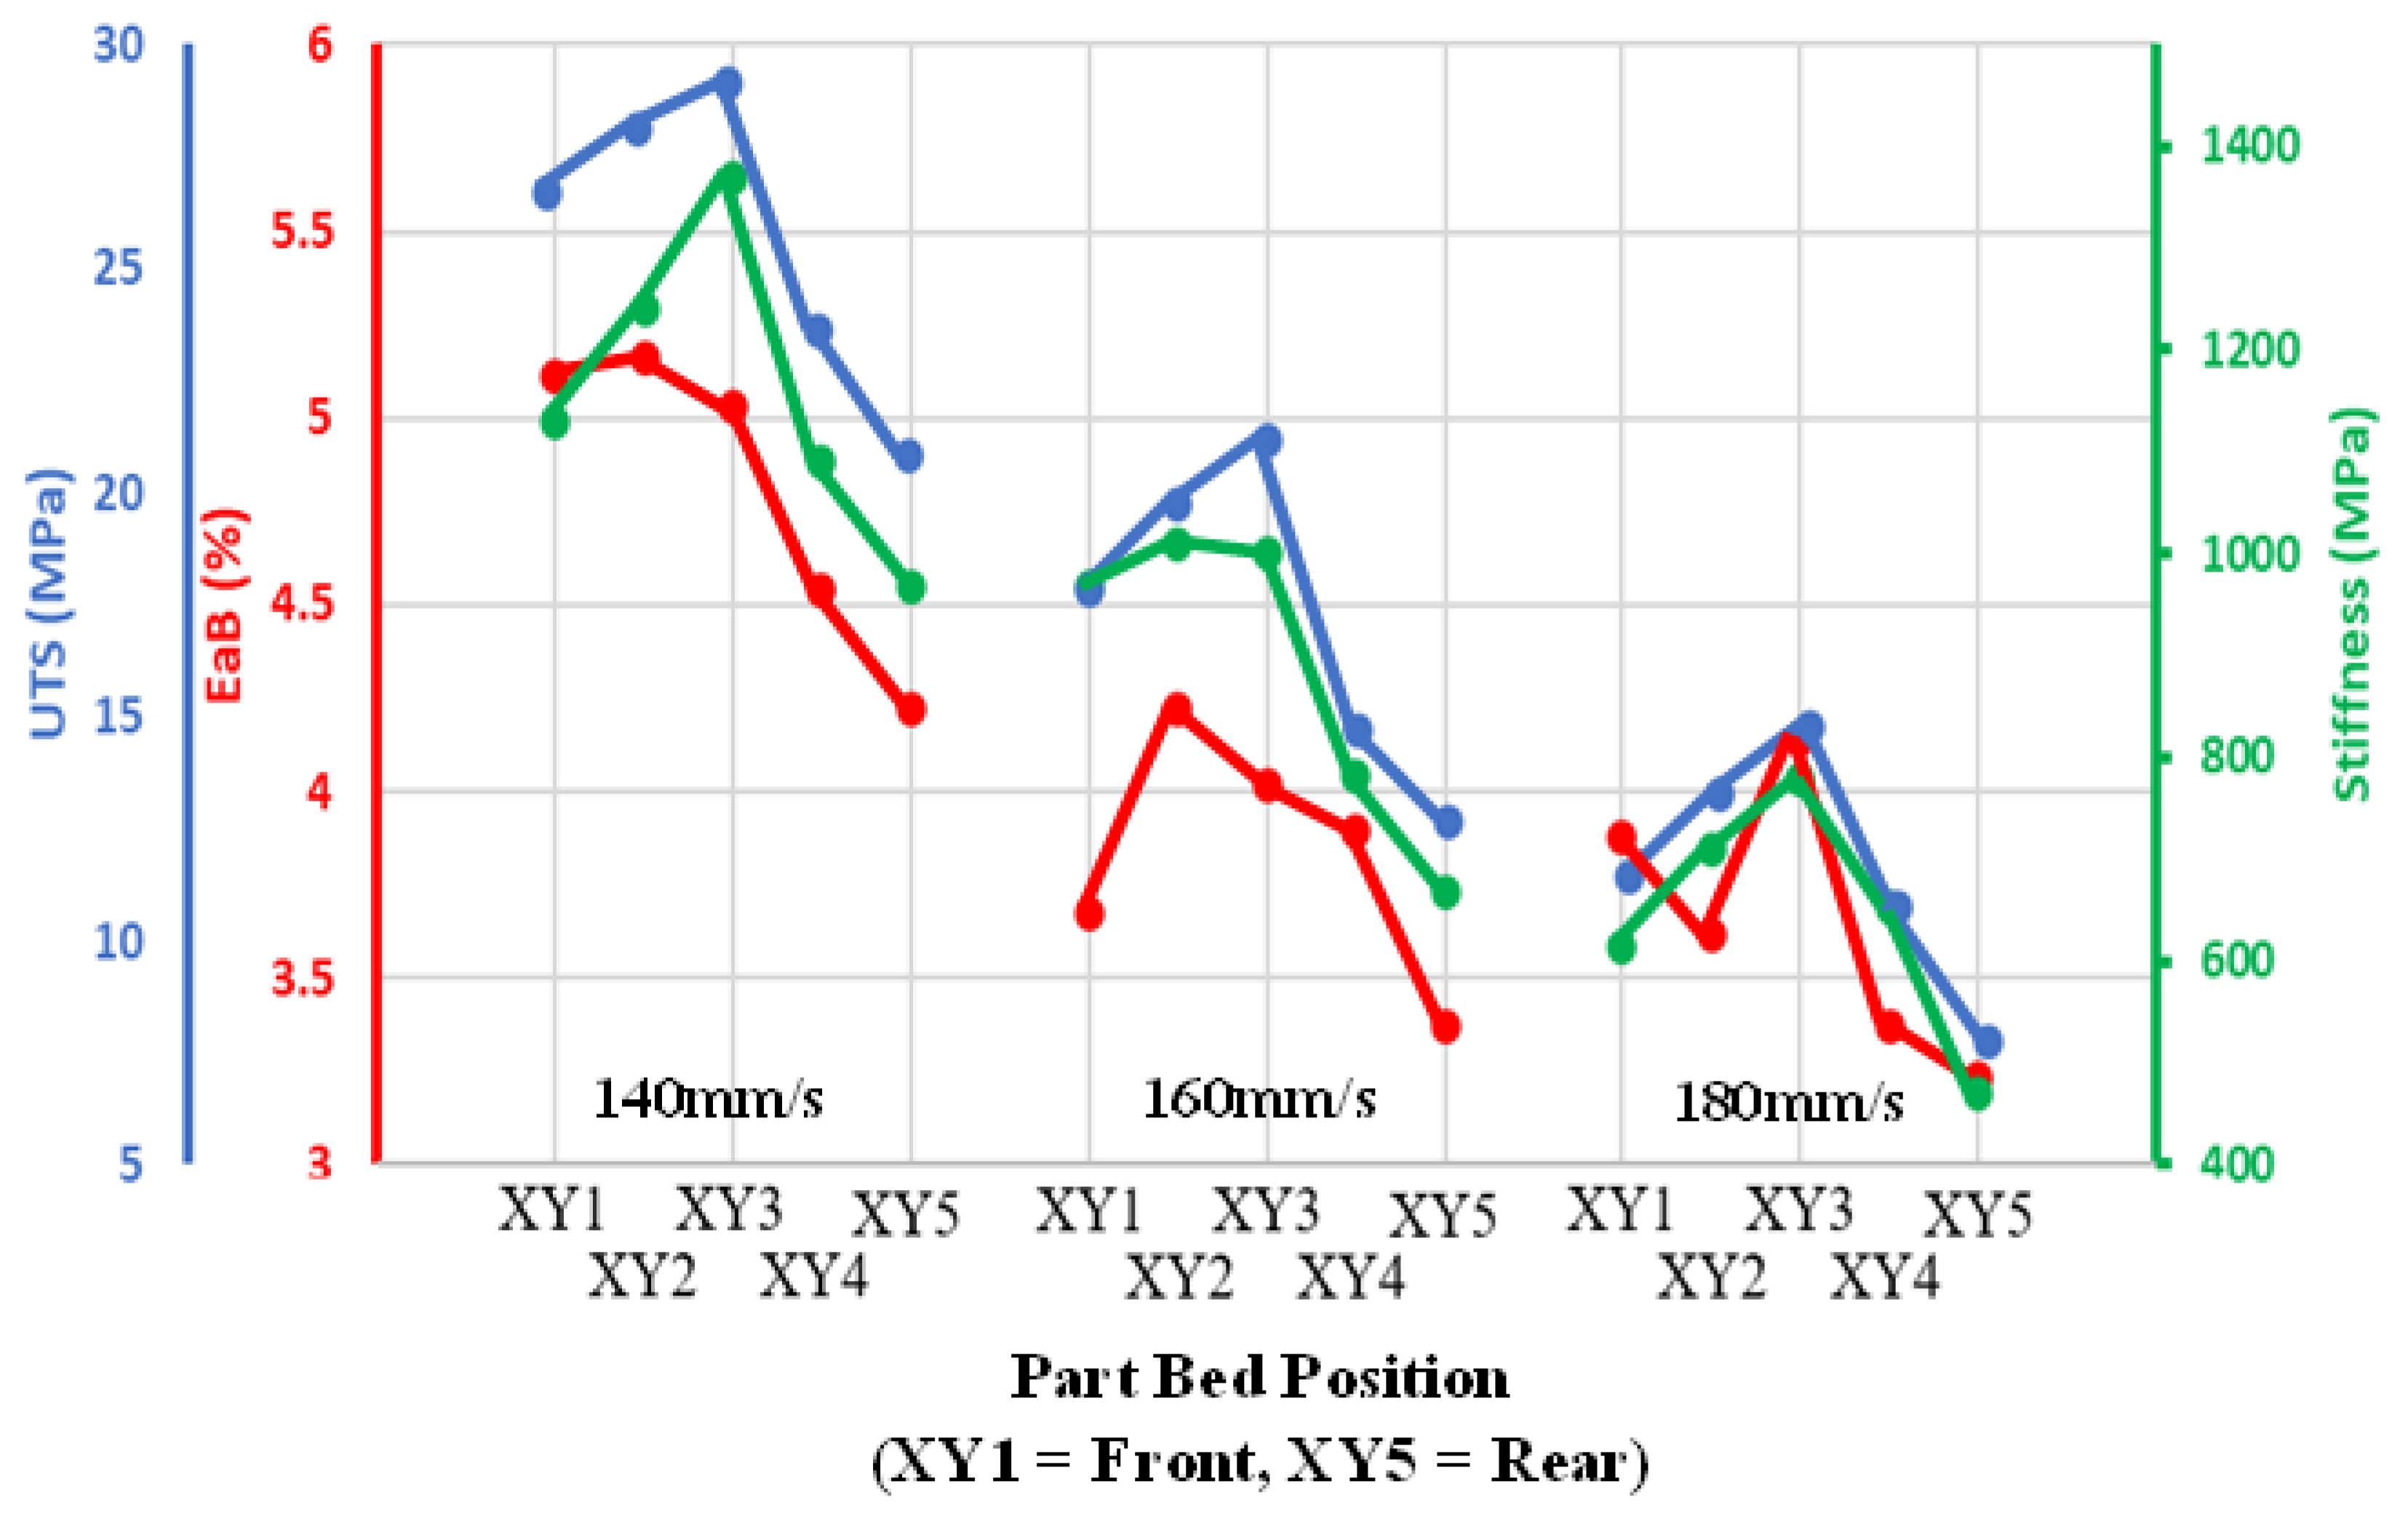
25] demonstrated an increase in the tensile properties with an increasing energy density, in this case induced via increases in the IR lamp power. In the work presented here, it can be seen that, as would be expected, an increase in the sinter speed, which corresponds to a decrease in the energy input, led to a subsequent decrease in the mechanical properties. While not the key focus of this work, it is worth noting that the significance of this effect would be dependent on the specific application of the parts and that the increase in the sinter speed would also lead to a decrease in the build time. For example, assuming the sinter stroke ~40% of the total layer time, an increase of 10% in the sinter speed would lead to a decrease in the build time of 9.1% following warm-up.
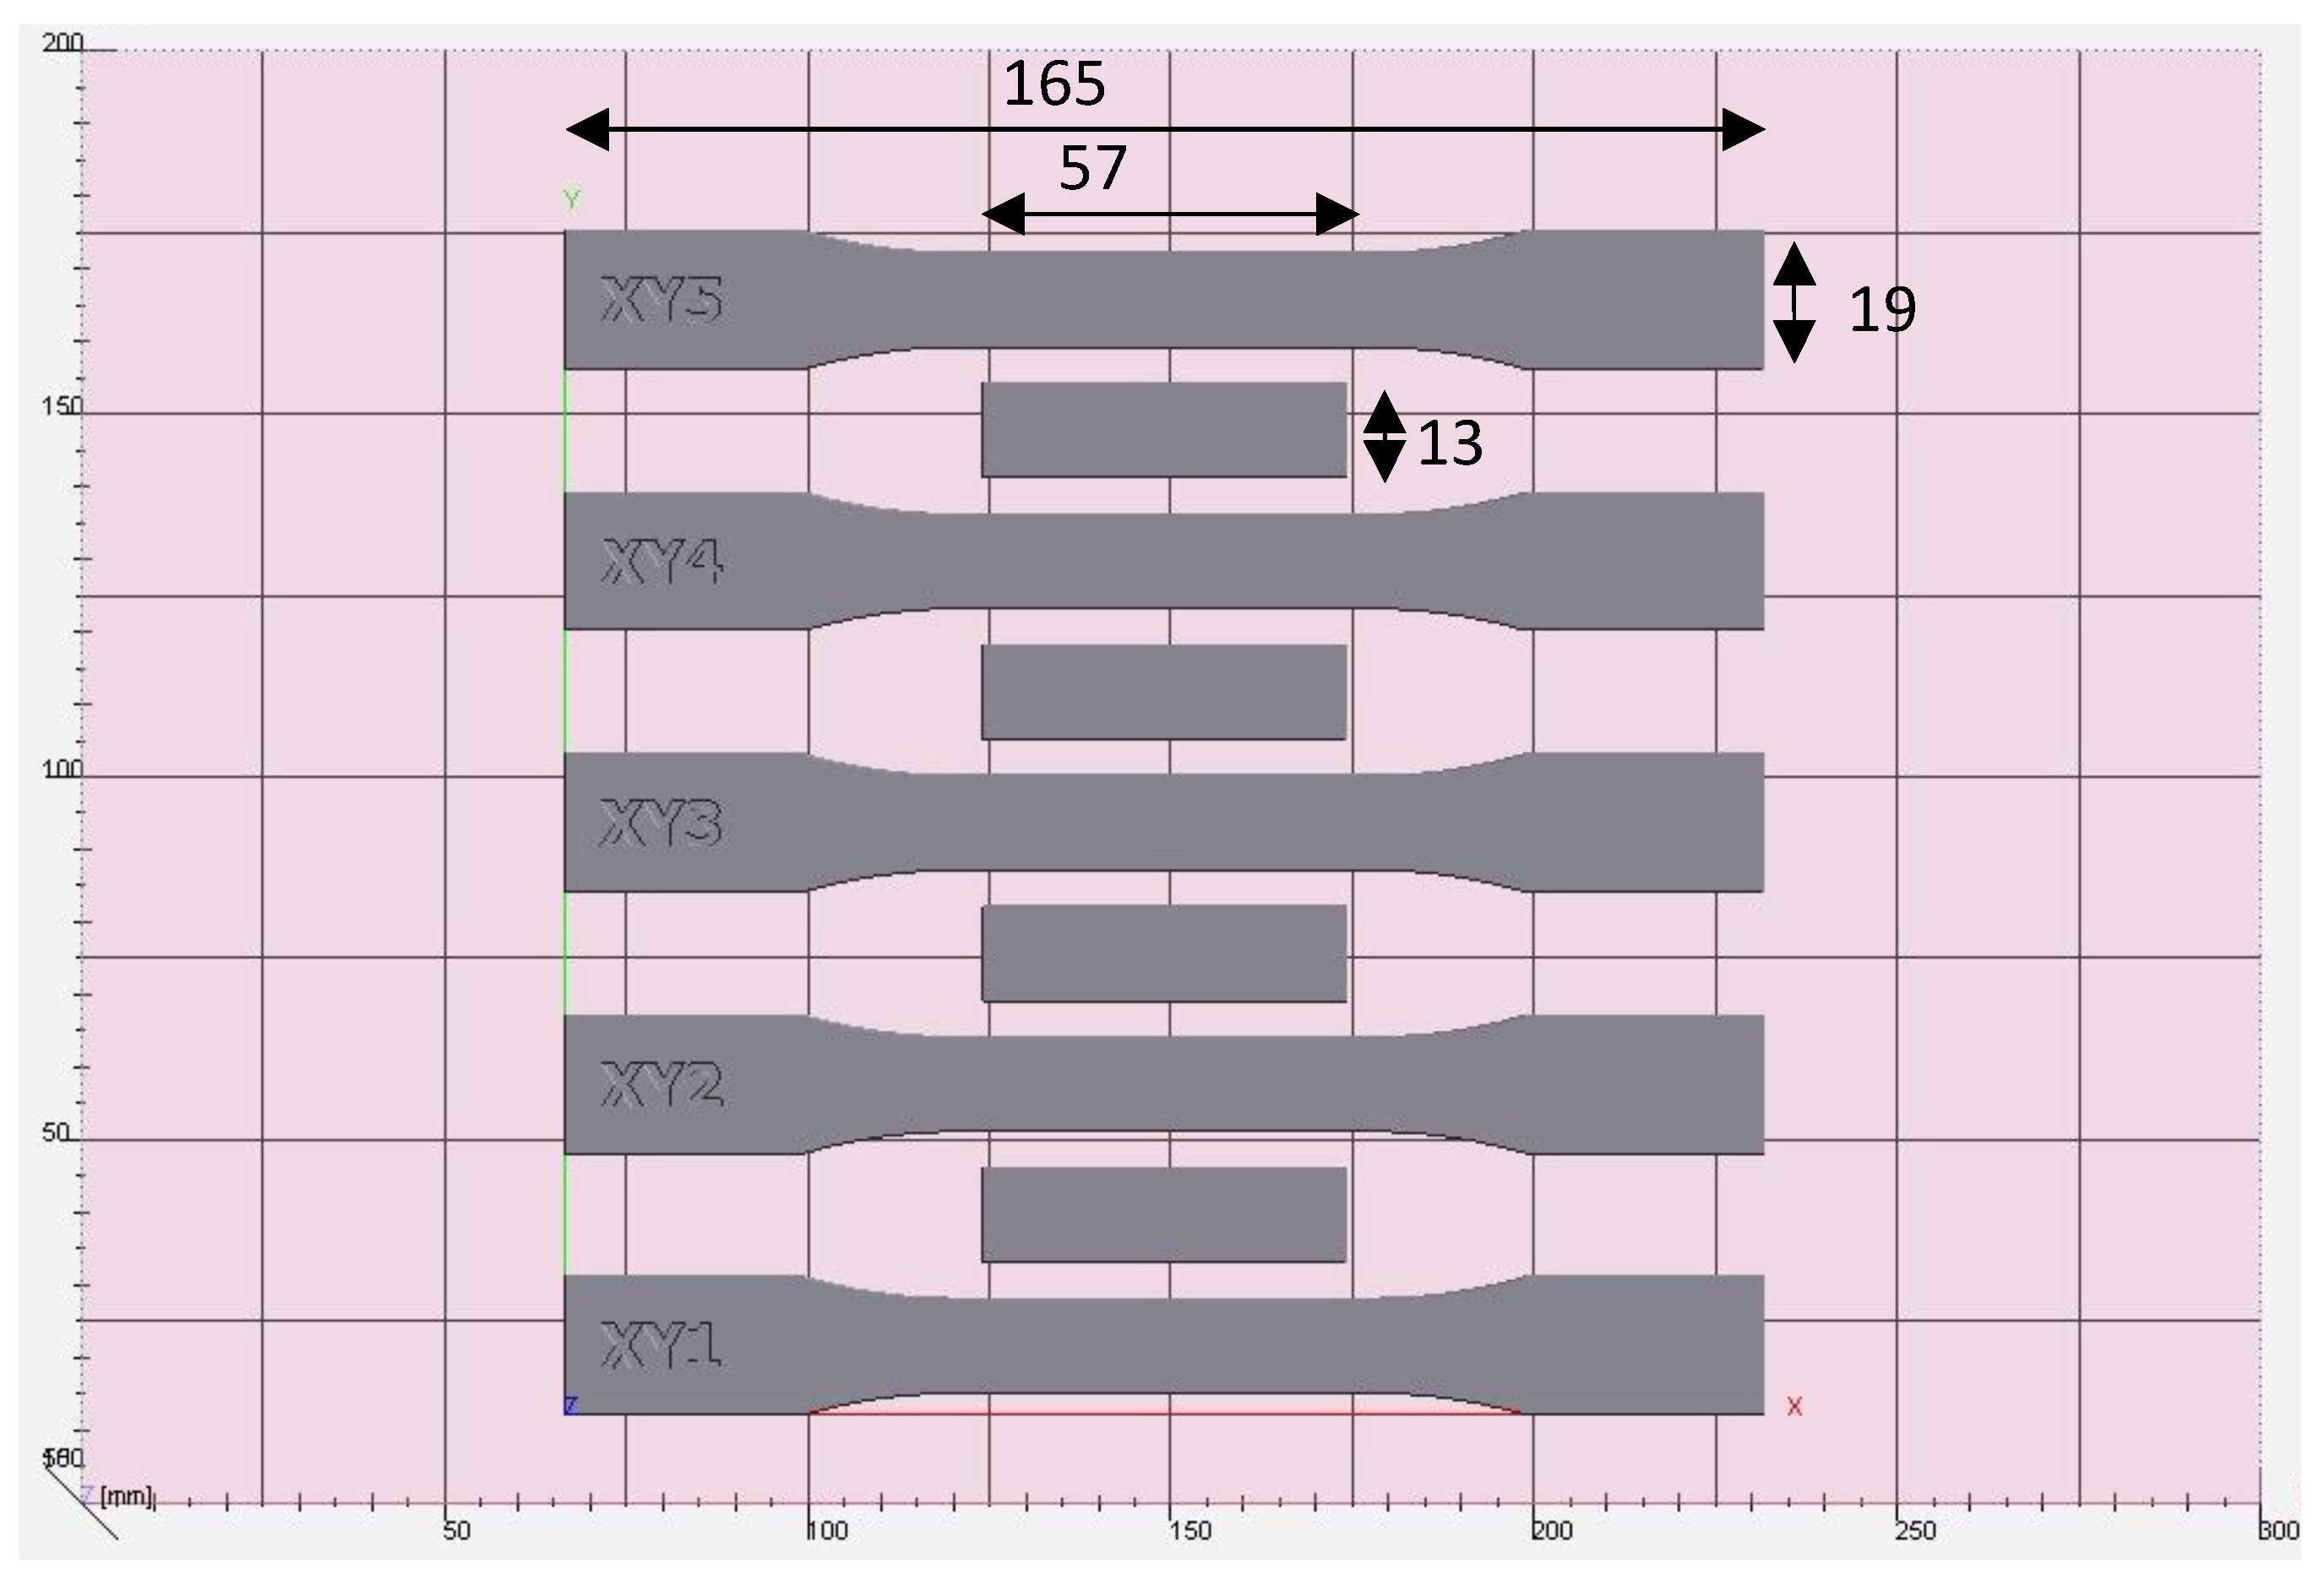
A closer inspection of the results identified a significant variation in the mechanical properties based on a part’s position within the build volume, with centrally located parts outperforming those closer to the edge (Figure 10). Whilst variations in the data are exaggerated compared to what would be expected in a commercial setting (due to the fact that the HSS machine used was a prototype version of a now commercialised machine), this is a well-known phenomenon in PBF caused by variations in the part bed temperature, and it highlights the importance of identifying mechanical properties at as many points as possible throughout the build volume in order to predict part performance with confidence.
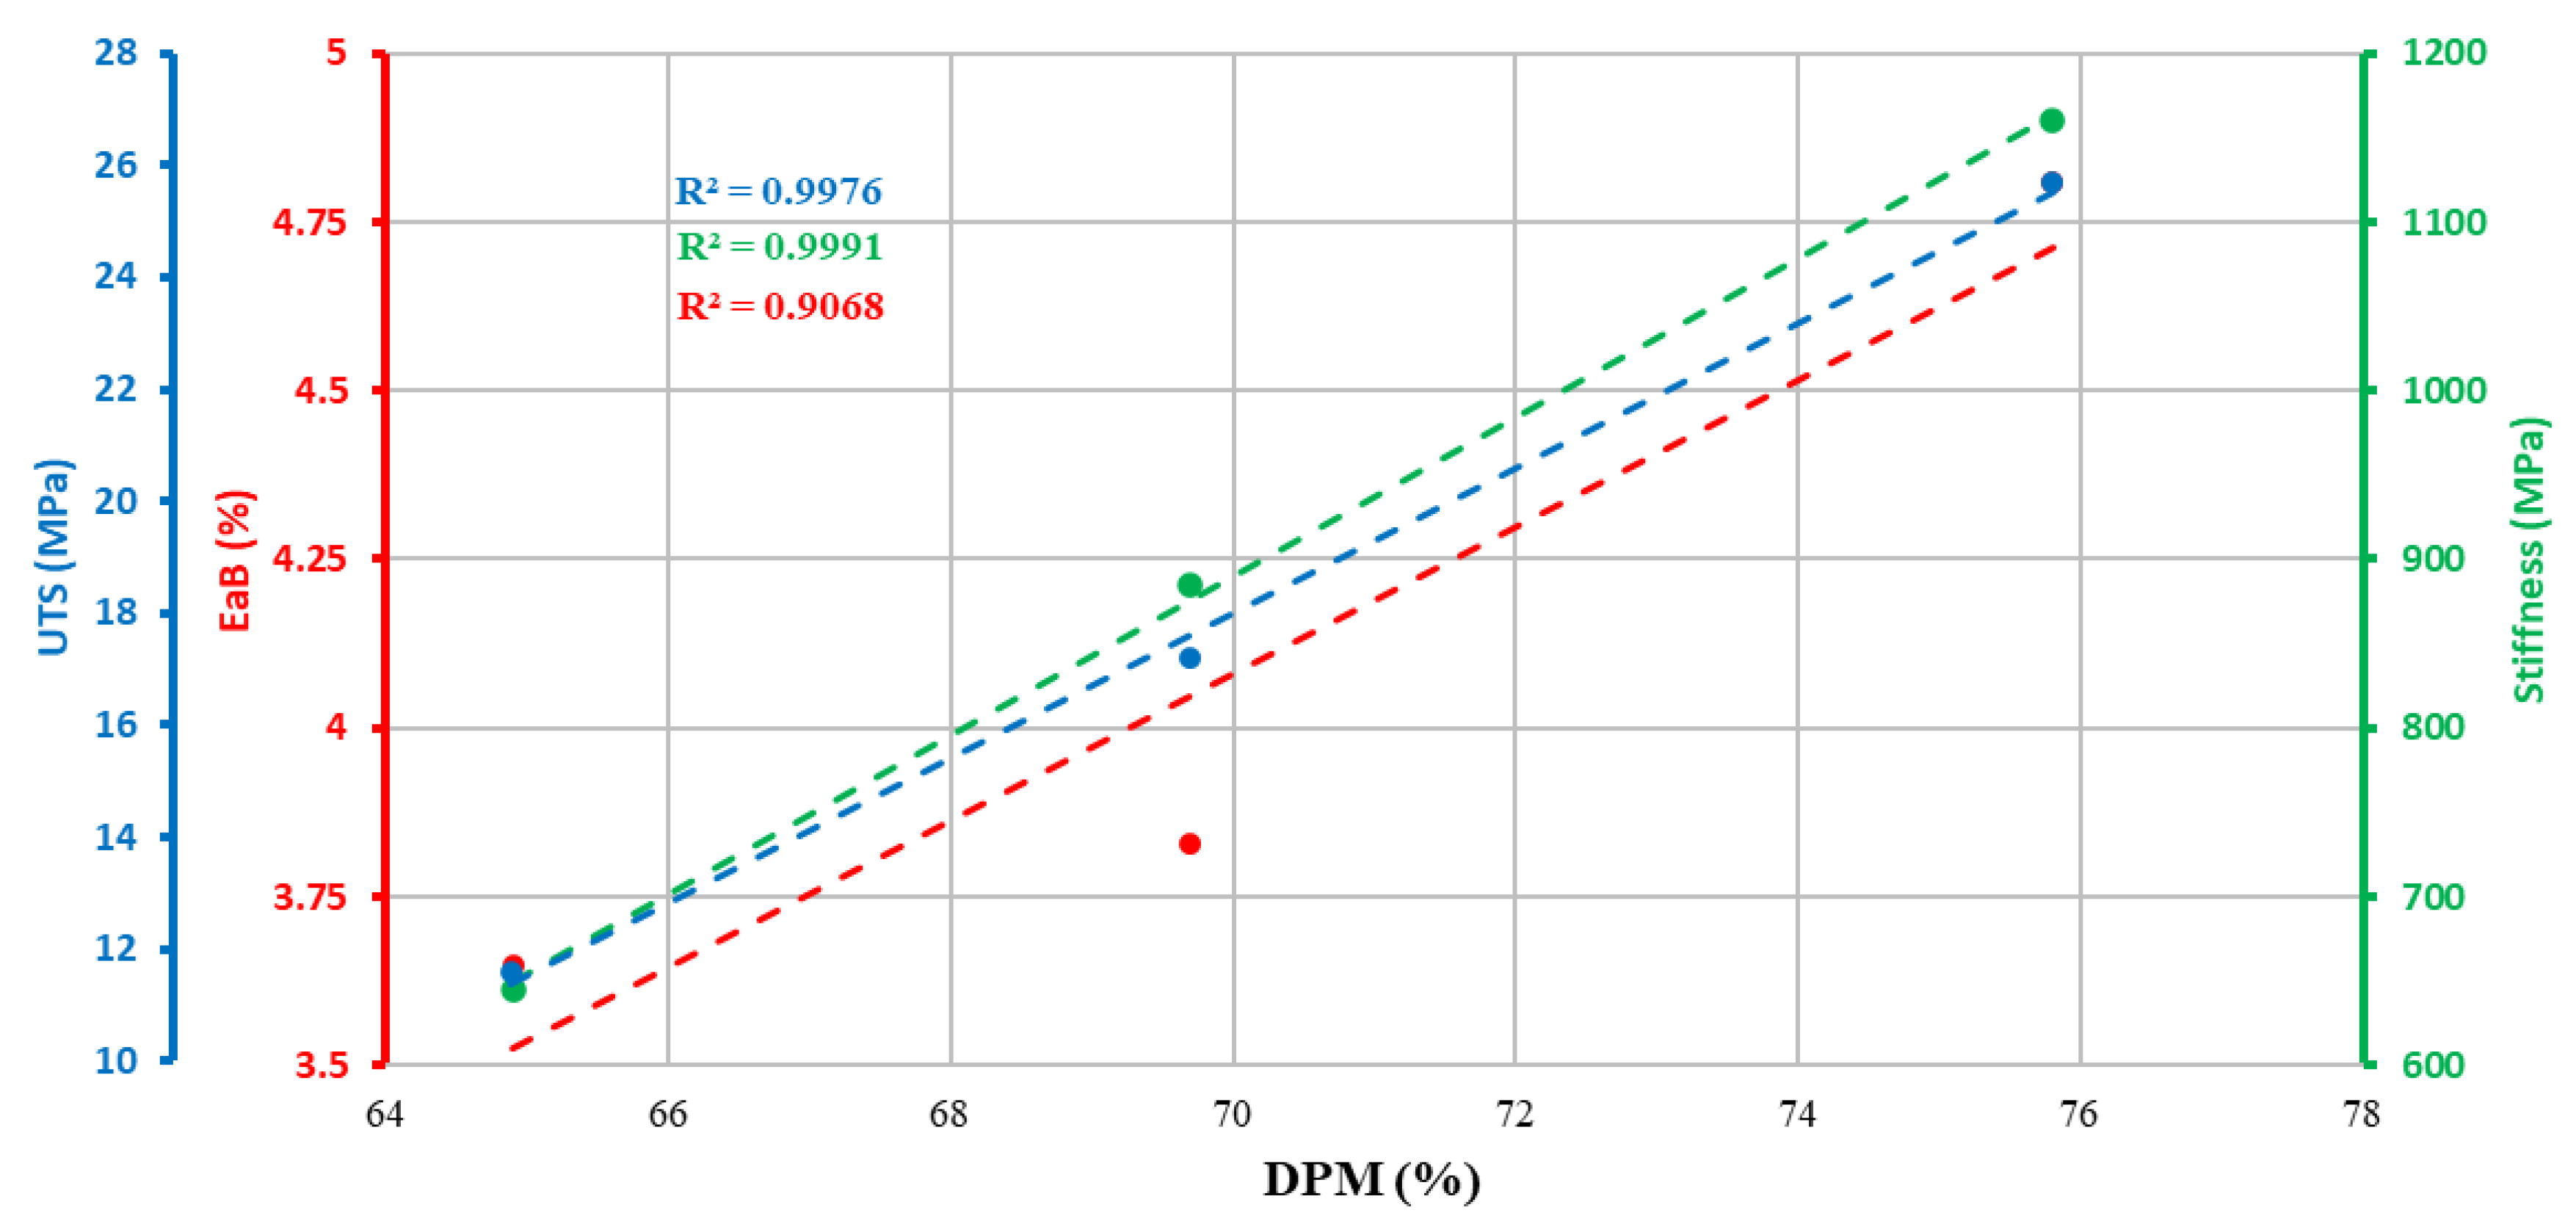
As noted in Section 3, the tensile properties showed strong correlations with the DPM. This matches existing LS research [16], whereby increases in strength and stiffness are seen despite the general appreciation that lower crystallinities (higher DPMs) should result in lower part strength and stiffnesses [15]. Whilst both UTS and YM demonstrate an incredibly strong correlation with the DPM (R2 values of 0.998 and 0.999, respectively), the EaB shows a weaker (although still >0.9) correlation. This is likely due to the brittle nature of the parts manufactured, with small changes in ductility affecting the average results more significantly. It has also been noted in the literature [26] that samples with less favourable microstructure and crystallinity may also contain higher levels of porosity, exacerbating the effects on the mechanical properties and, in particular, the elongation at break. Research into SLS PA12 [27] identified two melting peaks in samples produced at 0.096  J/mm3 energy density, transitioning to a single peak at 0.270  J/mm3, with an XRD analysis showing that higher proportions of the α crystal form at lower LS energy densities, suggesting a less effective melting of the PA12 particles.
Whilst the work presented in this paper focuses on PA12, there is reason to believe that this may extend to other materials; for example, the research in [28] identified residual powder melt peaks at low energy densities in PA11 for SLS. The evaluation of polyethylene terephthalate in the HSS process [29] identified lower properties for HSS than for SLS, due to unmelted areas within the HSS parts. This was thought to be a result of an insufficient energy input, in this case due to the lower temperature achievable in the machine.
We also expect that this work could be translated to other similar processes. Investigations into the MJF process [30] identified the presence of powder particles or unsintered particle cores in the interior of the parts, as opposed to LS, in which these were almost entirely melted. Anther research [31] produced MJF parts without these DSC shoulders, perhaps as a result of increased melting and possibly due to the thermal fusing agent used. Research into carbon black/PA12 composites in SLS [32] also demonstrated multiple DSC peaks, disappearing as the energy density increased, noting the effect of carbon black causing differences in heat transmission, which may be relevant when comparing processes such as HSS/MJF with the SLS process.
Having established that both the DPM and the mechanical properties are proportional to the energy density applied to the parts in a given HSS build, it follows that, provided that the samples used for DPM analysis are close enough to the parts of interest, the DPM should be able to predict the performance of those parts. For example, when producing multiple parts throughout a build volume (e.g., manufacturing high numbers of small connectors), DPM samples can be included throughout the build volume to give an indication of potential variations in the mechanical properties of the parts. The same could be applied when producing smaller numbers of large parts, in particular in proximity to areas of the part where the mechanical properties are critical.

5. Conclusions

The research presented here identified sources of variability in established methods for processing raw DSC data to determine DPM values, including the calculation of MCM and core crystallinities, before proposing an alternative method with improved processing standardisation. Using this method, the DPM of sacrificial parts was found to correlate strongly with the mechanical properties of adjacent tensile samples (R-Squared values of 0.9976, 0.9991, and 0.9068 for ultimate tensile strength, Young’s modulus, and elongation at break, respectively) when sinter speed was used to alter the energy density.
These results confirm that the approach previously established for laser sintering can also be expanded to the high-speed sintering process, with practical implications for quality control/assessment. Users of high-speed sintering systems may be able to confirm the quality and repeatability of the parts they produce through the inclusion of small, sacrificial samples positioned close to the main parts, to be subjected to DSC analysis.
Further work in this area should include the expansion of the range of energy densities tested by varying other key HSS parameters such as the part bed temperature and the lamp power, including combinations of these parameters, to confirm that the DPM is linked to the overall energy density imparted during the HSS process and not to these individual parameters. An expanded build containing multiple smaller DPM samples and tensile samples throughout should also be tested to determine the repeatability of the proposed DPM processing method, in addition to identifying the accuracy and reliability of mechanical property prediction. The effect of the proximity of any sacrificial DSC samples to parts whose properties require prediction should also be considered, as the increased separation of adjacent parts will improve powder removal. Finally, expansion to other materials should be considered to improve the overall usefulness of the proposed method in a commercial setting.

Author Contributions

Conceptualization, C.M.; Methodology, R.B., A.H. and C.M.; Formal analysis, R.B. and A.H.; Investigation, R.B. and A.H.; Writing—original draft, R.B. and A.H.; Writing—review & editing, C.M.; Supervision, R.B. and C.M.; Project administration, C.M.; Funding acquisition, C.M. All authors have read and agreed to the published version of the manuscript.

Funding

This research was funded by EPSRC grant number EP/P006566/1.

Data Availability Statement

The data presented in this study are available on request from the corresponding author (privacy).

Conflicts of Interest

The authors declare no conflict of interest.

References

  1. BS EN ISO/ASTM 52900:2021; Additive Manufacturing—General Principles—Fundamentals and Vocabulary. ASTM Compass: West Conshohocken, PA, USA, 2022. [CrossRef]
  2. Hopkinson, N.; Hague, R.; Dickens, P. Rapid Manufacturing: An Industrial Revolution for the Digital Age; John Wiley & Sons, Ltd.: Hoboken, NJ, USA, 2006. [Google Scholar] [CrossRef]
  3. Brown, R.; Morgan, C.T.; Majewski, C.E. Not just Nylon Improving the Range of Materials for High Speed Sintering, Solid Freeform Fabrication. In Proceedings of the 29th Annual International Solid Freeform Fabrication Symposium, Austin, TX, USA, 13–15 August 2018. [Google Scholar] [CrossRef]
  4. Additive Manufacturing and Materials Market—Growth, Trends, COVID-19 Impact, and Forecasts (2022–2027). 2020. Available online: https://www.mordorintelligence.com/industry-reports/global-additive-manufacturing-and-material-market-industry (accessed on 28 August 2024).
  5. Revolutionising Insole Production with SLS 3D Printing, Buchanan Orthotics. Available online: https://www.buchananorthotics.co.uk/clinicians/guides/revolutionising-insole-production-with-sls-3d-printing.html (accessed on 28 August 2024).
  6. Tabriz, A.G.; Kuofie, H.; Scoble, J.; Boulton, S.; Douroumis, D. Selective Laser Sintering for printing pharmaceutical dosage forms. J. Drug Deliv. Sci. Technol. 2023, 86, 104699. [Google Scholar] [CrossRef]
  7. Avular Customizes Drones via Materialise’s On-Demand Manufacturing, Empowered by HP Digital Manufacturing Network, Materialise. Available online: https://www.materialise.com/en/inspiration/articles/avular-customized-3d-printed-parts (accessed on 28 August 2024).
  8. Rajendran, S.; Palani, G.; Kanakaraj, A.; Shanmugam, V.; Veerasimman, A.; Gądek, S.; Korniejenko, K.; Marimuthu, U. Metal and Polymer Based Composites Manufactured Using Additive Manufacturing—A Brief Review. Polymers 2023, 15, 2564. [Google Scholar] [CrossRef] [PubMed]
  9. 3D Printing and the Need to Measure Physical and Dimensional Properties, AZO Materials. 2020. Available online: https://www.azom.com/article.aspx?ArticleID=19159 (accessed on 28 August 2024).
  10. Majewski, C.E.; Zarringhalam, H.; Hopkinson, N. Effect of degree of particle melt on mechanical properties in selective laser sintered Nylon-12 parts. Proc. Inst. Mech. Eng. Part B J. Eng. Manuf. 2008, 222, 1055–1064. [Google Scholar] [CrossRef]
  11. Zarringhalam, H.; Majewski, C.E.; Hopkinson, N. Degree of particle melt in Nylon-12 selective laser-sintered parts. Rapid Prototyp. J. 2009, 15, 126–132. [Google Scholar] [CrossRef]
  12. Majewski, C.E.; Zarringhalam, H.; Hopkinson, N. Effects of degree of particle melt and crystallinity in SLS Nylon-12 parts. In Proceedings of the 2008 International Solid Freeform Fabrication Symposium, Austin, TX, USA, 4–6 August 2008. [Google Scholar] [CrossRef]
  13. Zarringhalam, H. Investigation into Crystallinity and Degree of Particle Melt in Selective Laser Sintering. Ph.D. Thesis, Loughborough University, Loughborough, UK, 2007. Available online: https://repository.lboro.ac.uk/articles/thesis/Investigation_into_crystallinity_and_degree_of_particle_melt_in_selective_laser_sintering/9516743 (accessed on 28 August 2024).
  14. Gogolewski, S.; Czerntawska, K.; Gastorek, M. Effect of annealing on thermal properties and crystalline structure of polyamides. Nylon 12 (polyaurolactam). Colloid Polym. Sci. 1980, 258, 1130–1136. [Google Scholar] [CrossRef]
  15. Kong, Y.; Hay, J.N. The enthalpy of fusion and degree of crystallinity of polymers as measured by DSC. Eur. Polym. J. 2003, 39, 1721–1727. [Google Scholar] [CrossRef]
  16. Hopkinson, N.; Majewski, C.E.; Zarringhalam, H. Quantifying the degree of particle melt in selective laser sintering. CIRP Ann. 2009, 58, 197–200. [Google Scholar] [CrossRef]
  17. Ellis, A.; Noble, C.J.; Hopkinson, N. High speed sintering: Assessing the influence of print density on microstructure and mechanical properties of nylon parts. Addit. Manuf. 2014, 1, 48–51. [Google Scholar] [CrossRef]
  18. Norazman, F.; Smith, P.; Hopkinson, N. Spectral analysis of infrared lamps for use in the high speed sintering process. In Proceedings of the 27th Annual International Solid Freeform Fabrication Symposium—An Additive Manufacturing Conference, Austin, TX, USA, 8–10 August 2016; Available online: https://hdl.handle.net/2152/89704 (accessed on 28 August 2024).
  19. Majewski, C.E.; Oduye, D.; Thomas, H.R.; Hopkinson, N. Effect of infra-red power level on the sintering behaviour in the high speed sintering process. Rapid Prototyp. J. 2008, 14, 155–160. [Google Scholar] [CrossRef]
  20. Schawe, J.E.K. Cooling rate dependence of the crystallinity at nonisothermal crystallization of polymers: A phenomenological model. J. Appl. Polym. Sci. 2015, 133, 42977. [Google Scholar] [CrossRef]
  21. ASTM D638; Standard Test Method for Tensile Properties of Plastics. ASTM International: West Conshohocken, PA, USA, 2022.
  22. El Magri, A.; Bencaid, S.E.; Vanaei, H.R.; Vaudreuil, S. Effects of Laser Power and Hatch Orientation on Final Properties of PA12 Parts Produced by Selective Laser Sintering. Polymers 2022, 14, 3674. [Google Scholar] [CrossRef] [PubMed]
  23. Caulfield, B.; McHugh, P.E.; Lohfeld, S. Dependence of mechanical properties of polyamide components on build parameters in the SLS process. J. Mater. Process. Technol. 2007, 182, 477–488. [Google Scholar] [CrossRef]
  24. Starr, T.L.; Gornet, T.J.; Usher, J.S. The effect of process conditions on mechanical properties of laser-sintered nylon. Rapid Prototyp. J. 2011, 17, 418–423. [Google Scholar] [CrossRef]
  25. Sun, J.T.; Fan, Z.Y.; Mao, Y.W.; Li, W.; Zhu, W.; Cai, D.S.; Wei, Q.S. High speed sintering: Assessing the influence of energy input on microstructure and mechanical properties of polyether block amide (PEBA) parts. Chin. J. Polym. Sci. 2024, 42, 675–682. [Google Scholar] [CrossRef]
  26. Craft, G.; Nussbaum, J.; Crane, N.; Harmon, J.P. Impact of extended sintering times on mechanical properties in PA-12 parts produced by powderbed fusion processes. Addit. Manuf. 2018, 22, 800–806. [Google Scholar] [CrossRef]
  27. Czelusniak, T.; Amorim, F.L. Influence of energy density on polyamide 12 processed by SLS: From physical and mechanical properties to microstructural and crystallization evolution. Rapid Prototyp. J. 2021, 27, 1189–1205. [Google Scholar] [CrossRef]
  28. Esposito, G.R.; Dingemans, T.J.; Pearson, R.A. Changes in polyamide 11 microstructure and chemistry during selective laser sintering. Addit. Manuf. 2021, 48, 102445. [Google Scholar] [CrossRef]
  29. Pezold, D.; Wimmer, M.; Alfayez, F.; Bashir, Z.; Döpper, F. Evaluation of Polyethylene Terephthalate Powder in High Speed Sintering. Polymers 2022, 14, 2095. [Google Scholar] [CrossRef] [PubMed]
  30. Abbott, C.S.; Sperry, M.; Crane, N.B. Relationships between porosity and mechanical properties of polyamide 12 parts produced using the laser sintering and multi-jet fusion powder bed fusion processes. J. Manuf. Process. 2021, 70, 55–66. [Google Scholar] [CrossRef]
  31. Cai, C.; Tey, W.S.; Chen, J.; Zhu, W.; Liu, X.; Liu, T.; Zhao, L.; Zhou, K. Comparative study on 3D printing of polyamide 12 by selective laser sintering and multi jet fusion. J. Mater. Process. Technol. 2021, 288, 116882. [Google Scholar] [CrossRef]
  32. Hong, R.; Zhao, Z.; Leng, J.; Wu, J.; Zhang, J. Two-step approach based on selective laser sintering for high performance carbon black/polyamide 12 composite with 3D segregated conductive network. Compos. Part B Eng. 2019, 176, 107214. [Google Scholar] [CrossRef]
Figure 1. The HSS process selectively sinters regions where RAM has been deposited: (A) powder deposition stage; (B) printing stage; and (C) sintering stage (adapted from [3]).
Applsci 14 08667 g001
Figure 2. A DSC plot showing the processing (blue line, left-hand peak of red line) and core (right-hand peak of red line) peaks, alongside an indication of their respective MCM (purple) and unmelted (yellow) regions. The blue trace is indicative of a fully melted part, whereas the red line indicates a part containing some melted and some un-melted regions.
Applsci 14 08667 g002
Figure 3. Arrangement of tensile samples and density blocks within the HSS build volume (dimensions in mm).
Applsci 14 08667 g003
Figure 4. Selection of a baseline used to calculate the melt enthalpy (area between the curve and the baseline) of PA2200 powder for core crystallinity determination.
Applsci 14 08667 g004
Figure 5. DSC trace of a “fully melted” sample used to calculate MCM crystallinity, including a small core peak.
Applsci 14 08667 g005
Figure 6. Changes in the ratio of MCM and core peak heights with varying sinter speeds (energy density).
Applsci 14 08667 g006
Figure 7. Processing of DSC data to determine the DPM using the Perkin Elmer Pyris software, based on the steps outlined in Table 6.
Applsci 14 08667 g007
Figure 8. Correlation between the sinter speed (energy density) and the DPM values obtained from the DSC data using the proposed alternative method.
Applsci 14 08667 g008
Figure 9. Correlation between the DPM and the UTS, YM, and EaB.
Applsci 14 08667 g009
Figure 10. Variation in the tensile properties with the position within the build volume.
Applsci 14 08667 g010
Table 1. Variation in applied energy density via changes to sintering speed to induce differing DPM values.
Build No.Energy DensitySintering Speed (mm/s)
1High140
2Medium160
3Low180
Table 2. HSS machine parameters.
ParameterValueUnits
Part Bed Temperature160°C
Recoating Speed70mm/s
Lamp Power2kW
Ink Density3Drops per Dot (DPD)
Layer Thickness100µm
Blank “Preheat” Layers100-
Blank “Finish” Layers10-
Part Removal Temperature50°C
Table 3. DSC heating and cooling profile used to determine DPM.
Scheduled ActionDescription
Hold Hold at 20 °C for 1 min
HeatIncrease the temperature to 220 °C at 10 °C/min
HoldHold at 220 °C for 1 min
Table 4. Calculated values of MCM and core crystallinity obtained via DSC.
SampleMelt Enthalpy (J/g)Crystallinity (%)
Core (PA2200 Powder)112.353.6
MCM 165.531.3
MCM 268.032.5
MCM 362.329.8
Average MCM65.331.2
Table 5. Calculated DPM values for each sinter speed (energy density) using the methodology established in the literature (S.D. = standard deviation).
Sinter Speed (mm/s)Energy DensityAverage Total Crystallinity (%) [S.D.]Average DPM (%) [S.D.]
140High39.3 [0.1]64.1 [0.3]
160Medium41.2 [5.0]55.6 [22.4]
180Low41.7 [1.3]53.1 [5.7]
Table 6. Steps outlining an alternative method developed to determine the DPM from DSC data.
Step No.Description
1Adjust the slope of the DSC trace such that the section of the trace immediately following any melt peaks is parallel to the temperature axis.
2Identify the temperature of the minima between the MCM and core peaks.
3Extend a baseline from the newly horizontal DSC trace section such that it passes beyond both peaks.
4Identify the MCM peak onset temperature (defined as the intersection of the tangent to the rise in the MCM peak and the baseline).
5Identify the core peak end-temperature (defined as the intersection of the tangent to the fall of the core peak and the baseline).
6Calculate the melt enthalpy of the MCM peak (the area bound by the DSC trace, baseline, MCM peak onset temperature, and MCM and core peaks’ minimum temperatures).
7Calculate the melt enthalpy of the core peak (the area bound by the DSC trace, baseline, core peak end-temperature, and MCM and core peaks’ minimum temperature).
8Calculate DPM using M C M   m e l t   e n t h a l p y M C M   m e l t   e n t h a l p y + C o r e   m e l t   e n t h a l p y × 100 % (4)
Table 7. Calculated DPM values for each sinter speed (energy density) using the proposed alternative method.
Sinter Speed (mm/s)Energy DensityAverage DPM (%) [S.D.]
140High75.8 [0.9]
160Medium69.7 [0.4]
180Low64.9 [2.1]
(S.D. = standard deviation).
Table 8. Average tensile properties obtained by varying the sinter speed (energy density) in the HSS process.
Sinter Speed (mm/s)Energy DensityAverage UTS (MPa) [S.D.]Average YM (MPa) [S.D.]Average EaB (%) [S.D.]
140High25.7 [3.06]1160 [136.20]4.82 [0.36]
160Medium17.2 [3.15]885 [137.10]3.84 [0.30]
180Low11.6 [2.39]645 [103.30]3.68 [0.34]
(S.D. = standard deviation).
Disclaimer/Publisher’s Note: The statements, opinions and data contained in all publications are solely those of the individual author(s) and contributor(s) and not of MDPI and/or the editor(s). MDPI and/or the editor(s) disclaim responsibility for any injury to people or property resulting from any ideas, methods, instructions or products referred to in the content.

