
Impact of Kitchen Natural Gas Use on Indoor NO2 Levels and Human Health: A Case Study in Two European Cities


Abstract
1. Introduction

| Ref. | Location | Environment | Fuels | NO2 Concentration | Exposure Period | |
|---|---|---|---|---|---|---|
| Indoors | Outdoors | |||||
| [22] | Adelaide | Urban and Suburban (193) | NG | 33.28 ± 3.76 g·m−3 | - | - |
| Without NG | 15.61 ± 4.70 g·m−3 | |||||
| [15] | Wuhan, China | Urban | NG | Winter: | 30 min | |
| 167.0 ± 215.1 g·m−3 | 31.5 ± 23.0 g·m−3 | |||||
| Without ventilation: | ||||||
| 294.5 ± 372.0 g·m−3 | - | |||||
| With ventilation: | ||||||
| 97.9 ± 57.1 g·m−3 | - | |||||
| Electric | Winter: | |||||
| 32.9 ± 15.1 g·m−3 | 29.0 ± 20.0 g·m−3 | |||||
| Without ventilation: | ||||||
| 28.7 ± 11.6 g·m−3 | - | |||||
| With ventilation: | ||||||
| 38.9 ± 17.8 g·m−3 | - | |||||
| [20] | 6 Chinese cities | Summer: | ||||
| (different climatic areas) | Urban | NG (6) | 20 ± 0 g·m−3 | 75 g·m−3 | 3 h | |
| Coal gas (20) | 100 ± 80 g·m−3 | |||||
| [11] | Tanzania | Rural | Biomass | 59.80 ± 66.19 g·m−3 | 12.79 ± 23.88 g·m−3 | 24 h |
| (48) | (18) | |||||
| [12] | Pakistan | Urban (3) Rural (3) | NG, LPG | 0 g·m−3 | - | 24 h |
| Biomass | 14,200 g·m−3 | |||||
| Animal dung | 20,300 g·m−3 | |||||
| [13] | Ethiopia | Biomass | - | 24 h | ||
| Rural (17,215) | 97 ± 91.41 g·m−3 | - | ||||
| RuralHighland (9500) | 116 ± 101 g·m−3 | - | ||||
| RuralLowland (8015) | 176 ± 74 g·m−3 | - | ||||
| [23] | Netherlands | - | NG (49) | 26.59 ± 2.04 g·m−3 | - | 48 h |
| Electric (19) | 22.41 ± 2.48 g·m−3 | |||||
| [16] | London | Suburban (4) | NG | 135.96 g·m−3 | - | 96 h |
| Electric | 17.86 g·m−3 | |||||
| [24] | California | - | NG (343) | Cold seasons: | ||
| 31.78 ± 4.33 g·m−3 | 27.23 ± 3.39 g·m−3 | 6 days | ||||
| Ref. | Location | Environment | Fuels | NO2 Concentration | Exposure Period | |
|---|---|---|---|---|---|---|
| Indoors | Outdoors | |||||
| [14] | Pakistan | Urban | NG | Winter (16): | 1 week | |
| 218 ± 12 g·m−3 | 64 g·m−3 | |||||
| Summer (30): | ||||||
| 234 ± 196 g·m−3 | 138 g·m−3 | |||||
| Rural | NG | Winter (20): | ||||
| 242 ± 57 g·m−3 | 22 g·m−3 | |||||
| Summer (16): | ||||||
| 81 ± 65 g·m−3 | 26 g·m−3 | |||||
| Rural | Biomass | Winter (20): | ||||
| 256 ± 40 g·m−3 | 22 g·m−3 | |||||
| Summer (24): | ||||||
| 51 ± 27 g·m−3 | 40 g·m−3 | |||||
| [17] | Hertfordshire (UK) | Urban | Gas | Winter: | 1 week | |
| 38.74 ± 12.98 g·m−3 | - | |||||
| - Non-smokers: | - | |||||
| 18.9 g·m−3 | - | |||||
| - Passive smokers: | - | |||||
| 21.7 g·m−3 | - | |||||
| - Smokers: | - | |||||
| 24.8 g·m−3 | - | |||||
| Summer: | ||||||
| 26.70 ± 2.45 g·m−3 | - | |||||
| - Non-smokers: | - | |||||
| 14.0 g·m−3 | - | |||||
| - Passive smokers: | - | |||||
| 14.0 g·m−3 | - | |||||
| - Smokers: | - | |||||
| 16.2 g·m−3 | - | |||||
| Electric | Winter: | |||||
| 13.35 ± 5.27 g·m−3 | - | |||||
| Summer: | ||||||
| 20.69 ± 3.20 g·m−3 | - | |||||
| [10] | Taiwan | Winter: | ||||
| Rural (11) | NG (5), LPG (4) | 64.69 ± 17.11 g·m−3 | 75.41 ± 18.05 g·m−3 | 1 week | ||
| Urban (12) | LPG | 46.01 ± 12.41 g·m−3 | 44.19 ± 11.85 g·m−3 | |||
| [28] | Hong Kong | Urban (12) | Town gas | Summer: | 1 week | |
| 61.0 ± 22.4 g·m−3 | 71.8 ± 15.1 g·m−3 | |||||
| [18] | Netherlands | NG, Electricity (5%) | Winter: | 1 week | ||
| Urban (299)Rural (149) Rural (164) | 96 ± 59 g·m−3 64 ± 50 g·m−3 75 ± 62 g·m−3 | 62 ± 12 g·m−3 35 ± 19 g·m−3 22 ± 9 g·m−3 | ||||
| Urban | Unvented geiser (181): | |||||
| 120 ± 55 g·m−3 | ||||||
| Vented geiser (48): | ||||||
| 71 ± 53 g·m−3 | ||||||
| No geiser (44): | ||||||
| 49 ± 30 g·m−3 | ||||||
| Rural | Unvented geiser (181): | |||||
| 143 ± 60 g·m−3 | ||||||
| Vented geiser (105): | ||||||
| 60 ± 38 g·m−3 | ||||||
| No geiser (34): | ||||||
| 32 ± 24 g·m−3 | ||||||
| [19] | Portage | Rural | NG (I:237, O:240) | 65.5 ± 30.7 g·m−3 | 15.8 ± 6.3 g·m−3 | 1-week |
| LPG (I:568, O: 555) | 65.6 ± 38.4 g·m−3 | 11.8 ± 5.6 g·m−3 | ||||
| Electric (I:174, O:173) | 8.4 ± 4.7 g·m−3 | 12.8 ± 5.6 g·m−3 | ||||
| [35] | Boston | Urban | Gas | Heating season (57): | 2-weeks | |
| 94 ± 36 g·m−3 | 39 ± 11 g·m−3 | |||||
| Non heating season (43): | ||||||
| 62 ± 34 g·m−3 | 32 ± 13 g·m−3 | |||||
| Total (100): | ||||||
| 81 ± 38 g·m−3 | 36 ± 12 g·m−3 |
2. Nitrogen Dioxide Air Quality Standards
3. Materials and Methods
3.1. Site Selection
3.2. General Sampling Scheme
3.3. Data Analysis
3.4. Exposure Estimate
4. Results and Discussion
5. Conclusions
Author Contributions
Funding
Institutional Review Board Statement
Informed Consent Statement
Data Availability Statement
Acknowledgments
Conflicts of Interest
References
- Kleipeis, N.E.; Nelson, W.C.; Ott, W.R.; Robinson, J.P.; Tsang, A.M.; Switzer, P.; Behar, J.V.; Hern, S.C.; Engelmann, W.H. The National Human Activity Pattern Survey (NHAPS): A resource for assessing exposure to environmental pollutants. J. Expo. Sci. Environ. Epidemiol. 2001, 11, 231–252. [Google Scholar] [CrossRef] [PubMed]
- Eklund, B.; Bernhardt, T. Evaluation of potential short-term exposures to NO2 from cooking. Hum. Ecol. Risk Assess. Int. J. 2024, 1, 409–417. [Google Scholar] [CrossRef]
- Garrett, M.H.; Hooper, M.; Hooper, B.M.; Abramson, M.J. Respiratory symptoms in children and indoor exposure to nitrogen dioxide and gas stoves. Am. J. Respir. Crit. Care Med. 1998, 158, 891–895. [Google Scholar] [CrossRef] [PubMed]
- Quinn, A.K.; Bruce, N.; Puzzolo, E.; K, D.; Sturke, R.; Jack, D.W.; Mehta, S.; Shankar, A.; Sherr, K.; Rosenthal, J.P. An analysis of efforts to scale up clean household energy for cooking around the world. Energy Sustain. Dev. 2018, 46, 1–10. [Google Scholar] [CrossRef] [PubMed]
- Pollard, S.L.; Williams, K.N.; O’Brien, C.J.; Winiker, A.; Puzzolo, E.; Kephart, J.L.; Fandiño-Del-Rio, M.; Tarazona-Meza, C.; Grigsby, M.R.; Chiang, M.; et al. An evaluation of the Fondo de Inclusíon Social Energético program to promote access to liquefied petroleum gas in Peru. Energy Sustain. Dev. 2018, 46, 82–93. [Google Scholar] [CrossRef]
- E.I.A. Residential Energy Consumption Survey (RECS), United States Energy Information Administration. 2015. Available online: https://www.eia.gov/consumption/residential/ (accessed on 8 January 2024).
- Eurostat. Energy Consumption in Households; Eurostat: Luxembourg, 2024. [Google Scholar]
- Hannah, B.; Nicole, K.; Michael, S. Exposing the Hidden Health Impacts of Cooking with Gas, 2023, Technical report. Available online: https://www.clasp.ngo/research/all/eu-gas-cooking-health/ (accessed on 9 January 2024).
- Hu, Y.; Zhao, B. Relationship between indoor and outdoor NO2: A review. Build. Environ. 2020, 180, 106909. [Google Scholar] [CrossRef]
- Chan, C.C.; Yanagisawa, Y.; Spengler, J. Personal and Indoor/Outdoor Nitrogen Dioxide Exposure Assessments of 23 Homes in Taiwan. Toxicol. Ind. Health 1990, 6, 173–182. [Google Scholar] [CrossRef]
- Kilabuko, J.; Matsuki, H.; Nakai, S. Air quality and acute respiratory illness in biomass fuel using homes in Bagamoyo Tanzania. Int. J. Environ. Res. Public Health 2007, 4, 39–44. [Google Scholar] [CrossRef]
- Saeed, A.; Abbas, M.; Manzoor, F.; Ali, Z. Assement of fine particulate matter and gaseous emissions in urban and rural kitchens using different fuels. J. Anim. Plant Sci. 2015, 25, 687–692. [Google Scholar]
- Kumie, A.; Emmelin, A.; Wahlberg, S.; Berhane, Y.; Ali, A.; Mekonnen, E.; Brandstrom, D. Magnitude of indoor NO2 from biomass fuels in rural settings of Ethiopia. Indoor Air 2009, 19, 14–21. [Google Scholar] [CrossRef]
- Colbeck, I.; Nasir, Z.A.; Ali, Z.; Ahmad, S. Nitrogen dioxide and household fuel use in the Pakistan. Sci. Total. Environ. 2010, 409, 357–363. [Google Scholar] [CrossRef] [PubMed]
- Hu, D.; Gao, H.; Li, W.; Jia, C.; Lin, Y.; Shi, L.; Xu, X.; Geng, Z.; Mo, T.; Jiang, Q.; et al. A pilot study on characterization of air pollutants from typical Chinese cooking with clean fuels without and with range hood usage. Atmos. Pollut. Res. 2022, 13, 101537. [Google Scholar] [CrossRef]
- Melia, R.; Du, V.; Florey, C.; Darby, S.; Palmes, E.; Goldstein, B. Differences in NO2 levels in kitchens with gas or electric cookers. Atmos. Environ. 1978, 12, 1379–1381. [Google Scholar] [CrossRef]
- Kornartit, C.; Sokhi, R.; Burton, M.; Ravindra, K. Activity pattern and personal exposure to nitrogen dioxide in indoor and outdoor microenvironments. Environ. Int. 2010, 36, 36–45. [Google Scholar] [CrossRef]
- Fischer, P.; Brunekreef, B.; Boleij, J. Indoor NO2 pollution and personal exposure to NO2 in two areas with different outdoor NO2 pollution. Environ. Monit. Assess. 1986, 6, 221–229. [Google Scholar] [CrossRef] [PubMed]
- Spengler, J.; Duffy, C.; Letz, R.; Tibbitts, T.; Ferris, B. Nitrogen dioxide inside and outside 137 homes and implications for ambient air quality standards and health effects research. Environ. Sci. Technol. 1983, 17, 164e168. [Google Scholar] [CrossRef]
- Tian, L.; Guoqiang, Z.; Zhang, Q.; Moschandreas, D.J.; Hao, J.; Lin, J.; Liu, Y. The Impact of Kitchen Activities on Indoor Pollutant Concentrations. Indoor Built Environ. 2008, 17, 377–383. [Google Scholar] [CrossRef]
- Kashtan, Y.; Nicholson, M.; Finnegan, C.J.; Ouyang, Z.; Garg, A.; Lebel, E.D.; Rowland, S.T.; Michanowicz, D.R.; Herrera, J.; Nadeau, K.C.; et al. Nitrogen dioxide exposure, health outcomes, and associated demographic disparities due to gas and propane combustion by U.S. stoves. Sci. Total. Environ. 2024, 30, 409–417. [Google Scholar] [CrossRef]
- Jolanta, C.; Volkmer, R.E.; Edwards, J.W. Domestic Nitrogen Oxide Exposure, Urinary Nitrate, and Asthma Prevalence in Preschool Children. Arch. Environ. Health 2001, 56, 433–438. [Google Scholar] [CrossRef]
- Willers, S.; Brunekreef, B.; Oldenwening, M.; Smit, H.; Kerkhof, M.; De Vries, H. Gas cooking, kitchen ventilation and exposure to combustion products. Indoor Air 2006, 16, 65–73. [Google Scholar] [CrossRef]
- Swierczyna, R.; Johnson, M.; LaFleur, J.; Stein, J. Evaluating Residential Kitchen IAQ and Hood Performance. ASHRAE Trans. 2022, 128, 429. [Google Scholar]
- Zhang, Y.; Chen, B.; Liu, G.; Wang, J.; Zhao, Z.; Lin, L. Natural gas and indoor air pollution: A comparison with coal gas and liquefied petroleum gas. Biomed Env. Sci. 2003, 16, 227–236. [Google Scholar]
- Seltenrich, N. Take Care in the Kitchen: Avoiding Cooking-Related Pollutants. Environ. Health Perspect. 2014, 122, A154–A159. [Google Scholar] [CrossRef] [PubMed]
- Singer, B.C.; Chan, W.R.; Kim, Y.S.; Offermann, F.J.; Walker, I.S. Indoor air quality in California homes with code-required mechanical ventilation. Indoor Air 2020, 30, 885–899. [Google Scholar] [CrossRef]
- Chao, C.; Law, A. A study of personal exposure to nitrogen dioxide using passive samplers. Build. Environ. 2000, 35, 545–553. [Google Scholar] [CrossRef]
- Barros, N.; Fontes, T.; Silva, M.; Manso, M.C. How wide should be the adjacent area to an urban motorway to prevent potential health impacts from traffic emissions? Transp. Res. Part Policy Pract. 2013, 50, 113–128. [Google Scholar] [CrossRef]
- Gu, J.; Du, X.; Wang, Q.; Liang, Z.; Li, G.; An, T. Continuous Measurement of the Dynamics of Residential Indoor and Outdoor NO2 and the Contributions to Human Exposure. In Environmental Pollution; SSRN: Rochester, NY, USA, 2024. [Google Scholar] [CrossRef]
- Lebel, E.D.; Finnegan, C.J.; Ouyang, Z.; Jackson, R.B. Methane and NOx Emissions from Natural Gas Stoves, Cooktops, and Ovens in Residential Homes. Atmos. Pollut. Res. 2022, 56, 2529–2539. [Google Scholar] [CrossRef]
- Spicer, C.W.; Coutant, R.W.; Ward, G.F.; Joseph, D.W. Rates and mechanisms of NO2 removal from indoor air by residential materials. Environ. Int. 1989, 15, 643–654. [Google Scholar] [CrossRef]
- Sun, L.; Singer, B.C. Cooking methods and kitchen ventilation availability, usage, perceived performance and potential in Canadian homes. J. Expo. Sci. Environ. Epidemiol. 2020, 33, 439–447. [Google Scholar] [CrossRef]
- Singer, B.C.; Pass, R.Z.; Delp, W.W.; Lorenzetti, D.M.; Maddalena, R.L. Pollutant concentrations and emission rates from natural gas cooking burners without and with range hood exhaust in nine California homes. Build. Environ. 2017, 122, 215–229. [Google Scholar] [CrossRef]
- Zota, A.; Adamkiewicz, G.; Levy, J.; Spengler, J. Ventilation in public housing: Implications for indoor nitrogen dioxide concentrations. Indoor Air 2005, 15, 393–401. [Google Scholar] [CrossRef] [PubMed]
- Bauer, M.A.; Utell, M.J.; Morrow, P.E.; Speers, D.M.; Gibb, F.R. Inhalation of 0.30 ppm nitrogen dioxide potentiates exercise-induced bronchospasm in asthmatics. Am. Rev. Respir. Dis. 1986, 134, 1203–1208. [Google Scholar] [PubMed]
- Li, J.; Zhang, X.; Li, G.; Wang, L.; Yin, P.; Zhou, M. Short-term effects of ambient nitrogen dioxide on years of life lost in 48 major Chinese cities, 2013–2017. Chemosphere 2021, 263, 127887. [Google Scholar] [CrossRef] [PubMed]
- USEPA. Basic Information about NO2. 2023. Available online: https://www.epa.gov/NO2-pollution/basic-information-about-NO2 (accessed on 9 January 2024).
- WHO, World Health Organization. WHO Global Air Quality Guidelines: Particulate Matter (PM2.5 and PM10), Ozone, Nitrogen Dioxide, Sulfur Dioxide and Carbon Monoxide; World Health Organization (WHO): Geneva, Switzerland, 2021.
- WHO. Air Quality Guidelines: Global Update 2005: Particulate Matter, Ozone, Nitrogen Dioxide and Sulfur Dioxide; World Health Organization (WHO): Geneva, Switzerland, 2006.
- EU. EU Air Quality Standards. Technical Report. 2008. Available online: https://environment.ec.europa.eu/topics/air/air-quality/eu-air-quality-standards_en (accessed on 9 January 2024).
- Australia State of Environment. National and International Agreements and Policy. Technical Report. 2021. Available online: https://soe.dcceew.gov.au/air-quality/management/national-and-international-agreements-and-policy (accessed on 12 January 2024).
- Australia Government, NEPC. Variation to Ambient Air Quality NEPM-Ozone, Nitrogen Dioxide and Sulfur Dioxide. Technical Report. 2008. Available online: https://www.nepc.gov.au/nepms/ambient-air-quality/variation-ambient-air-quality-nepm-ozone-nitrogen-dioxide-and-sulfur. (accessed on 7 January 2024).
- NIPH. National Institute of Public Health. Air Quality Criteria—Effects of Air Pollution on Health; Technical Report (2013:9); National Institute of Public Health: Phnom Penh, Cambodia, 2017. [Google Scholar]
- WHO. Air Quality Guidelines for Europe, 1st ed.; World Health Organization (WHO): Geneva, Switzerland, 1987. [Google Scholar]
- WHO. Air Quality Guidelines for Europe, 2nd ed; World Health Organization (WHO): Geneva, Switzerland, 2000. [Google Scholar]
- GB/T 18883-2002; Indoor Air Quality Standard. Standards Press of China: Beijing, China, 2022. Available online: https://www.chinesestandard.net/PDF/English.aspx/GBT18883-2002 (accessed on 11 January 2024).
- Government of Canada. Residential Indoor Air Quality Guideline: Nitrogen Dioxide. Technical Report, 2015. Available online: https://www.canada.ca/en/health-canada/services/publications/healthy-living/residential-indoor-air-quality-guideline-nitrogen-dioxide.html (accessed on 7 January 2024).
- USEPA. Review of the Primary National Ambient Air Quality Standards for Oxides of Nitrogen; United States Environmental Protection Agency: Washington, DC, USA, 2018; Volume 83, pp. 17226–17278. [Google Scholar]
- South African Bureau of Standards. SANS 1929: Ambient Air Quality—Limits for Common Pollutants. Technical Report, 2011. Available online: https://archive.org/details/za.sans.1929.2011/page/n1/mode/2up (accessed on 12 January 2024).
- Passam. Diffusion Tube for Nitrogen Dioxide; Passam AG, Technical Report (SP01_NO2_2023), 2023. Available online: https://www.passam.ch/wp-content/uploads/2023/02/SP01_NO2_Product-Sheet_2023_EN.pdf (accessed on 12 January 2024).
- Mannan, M.; Al-Ghamdi, S. Indoor air quality in buildings: A comprehensive review on the factors influencing air pollution in residential and commercial structure. Int. J. Environ. Res. Public Health 2021, 18, 3276. [Google Scholar] [CrossRef]

| Authority, Ref. | I / O a | Year to Be Met | Max. 15 min Average | Max. 1 h Average | Max. 24 h Average | Annual Concentration |
|---|---|---|---|---|---|---|
| WHO [45] | Both | 1992 | - | 400 | 150 | - |
| WHO [46] | Both | 2000 | - | 200 | - | 40 |
| WHO [39] | Both | 2021 | - | 200 | 25 | 10 |
| China [47] | I | 2022 | - | 200 | - | - |
| Canada b [48] | I | 2015 | - | 170 | - | 20 |
| Canada b [48] | I | 1987 | - | 480 | - | 100 |
| Australia [42] | O | 2021 | - | 182 | - | 38.5 |
| Australia [43] | O | 2025 | - | 150 | - | 28.2 |
| EU [41] | O | 2010 | - | 200 (18) | - | 40 |
| Norway [44] | O | 2013 | 300 | 100 | - | 30 |
| US EPA [49] | O | 1971 | - | - | - | 100 |
| US EPA [49] | O | 2010 | - | 188 | - | - |
| South Africa [50] | O | 2002 | - | 200 (88) | - | 40 (0) |
| ID | City | House Characteristics | |||
|---|---|---|---|---|---|
| Type | Typology a | Total n.° of Inhab. |
Cooking Fuel | ||
| (n.º of Children b) | |||||
| P1 | Aveiro | House | T5 | 3 (0) | NG |
| P2 | Aveiro | Flat (2nd floor) | T4 | 4 (0) | NG |
| P3 | Aveiro | Flat (3rd floor) | T3 | 3 (0) | NG |
| P4 | Aveiro | Flat (5th floor) | T3 | 4 (0) | NG |
| P5 | Aveiro | Flat (2nd floor) | T3 | 4 (0) | NG |
| P6 | Aveiro | Flat (G floor) | T2 | 3 (0) | NG |
| P7 | Aveiro | Flat (1st floor) | T3 | 2 (0) | NG |
| P8 | Aveiro | Flat (3rd floor) | T3 | 2 (0) | NG |
| P9 | Aveiro | Flat (2nd floor) | T4 | 2 (0) | NG |
| P10 | Porto | House | T4 | 3 (0) | Electric |
| P11 | Porto | House | T4 | 3 (0) | Electric |
| P12 | Porto | Flat (3rd floor) | T4 | 5 (0) | Electric |
| P13 | Porto | Flat (1st floor) | T4 | 4 (0) | Electric |
| P14 | Porto | Flat (2nd floor) | T3 | 4 (0) | Electric |
| P15 | Porto | Flat (5th floor) | T4 | 3 (0) | Electric |
| P16 | Porto | Flat (9th floor) | T4 | 4 (0) | Electric |
| P17 | Porto | Flat (4th floor) | T3 | 4 (0) | Electric |
| P18 | Porto | Flat (2nd floor) | T3 | 4 (2) | Electric |
| Indoors | Outdoors | |||||||
|---|---|---|---|---|---|---|---|---|
| City/Fuel Type | N | Min. | Max. | Avg. ± SEM | Min. | Max. | Avg. ± SEM | I/O |
| Fuel type | ||||||||
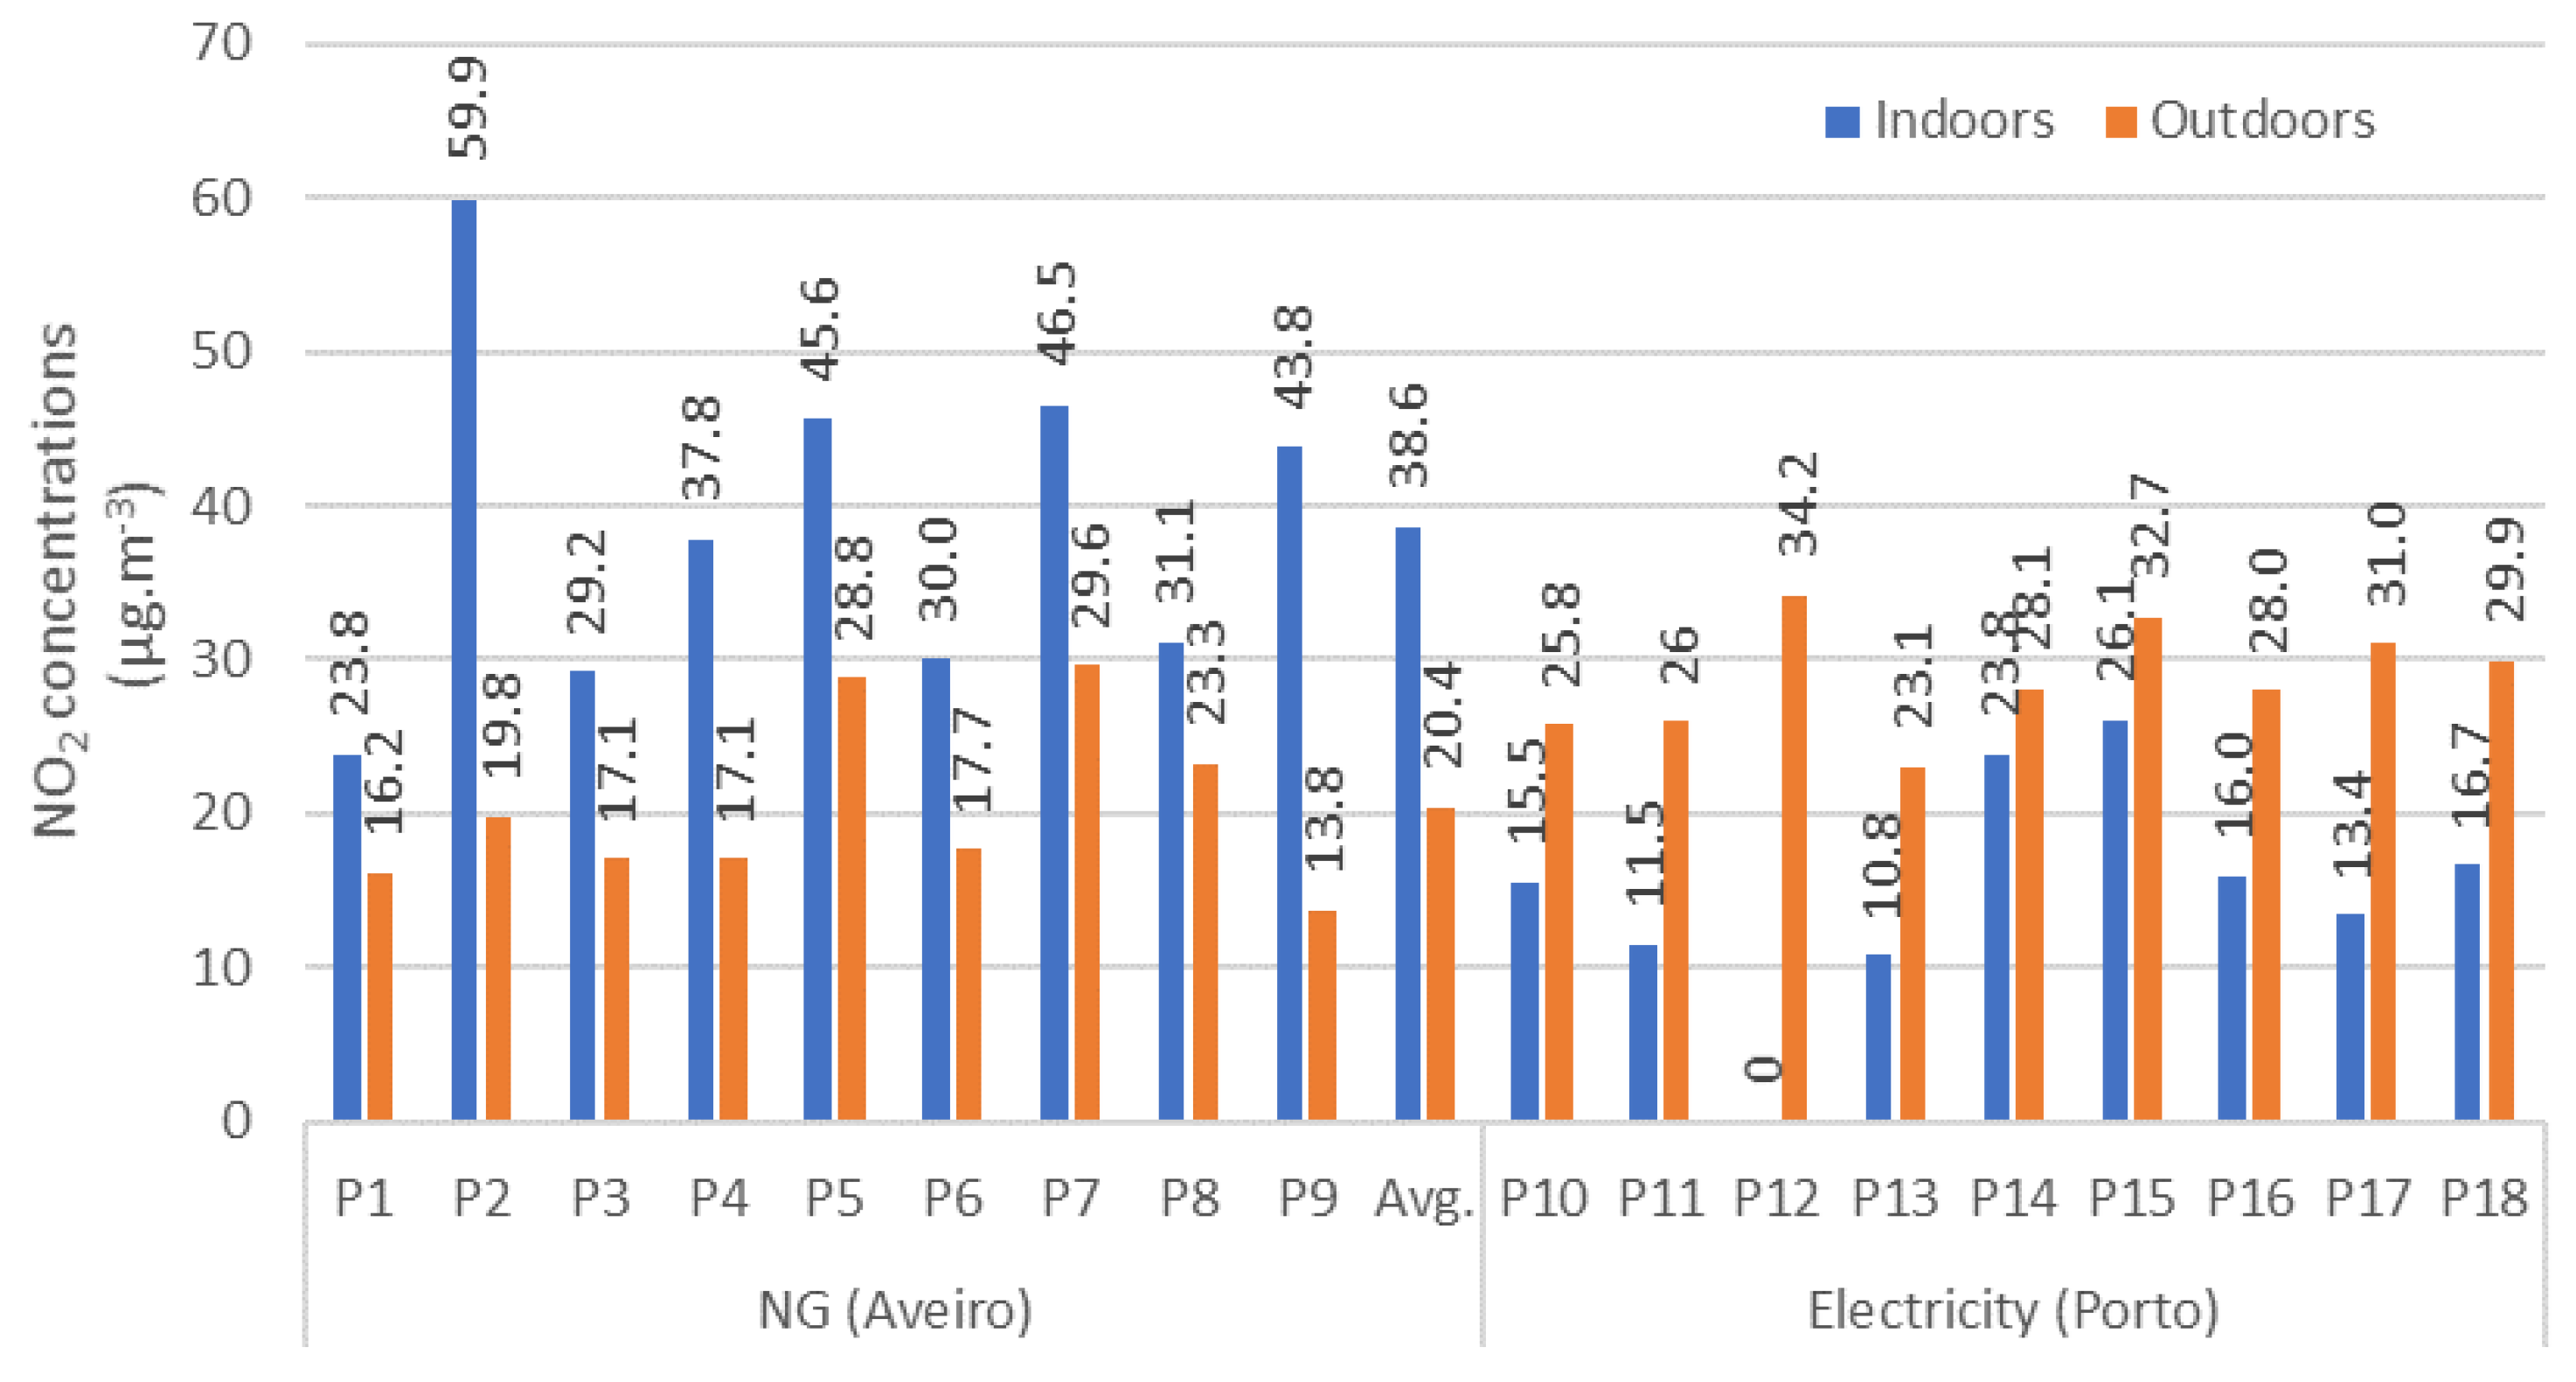
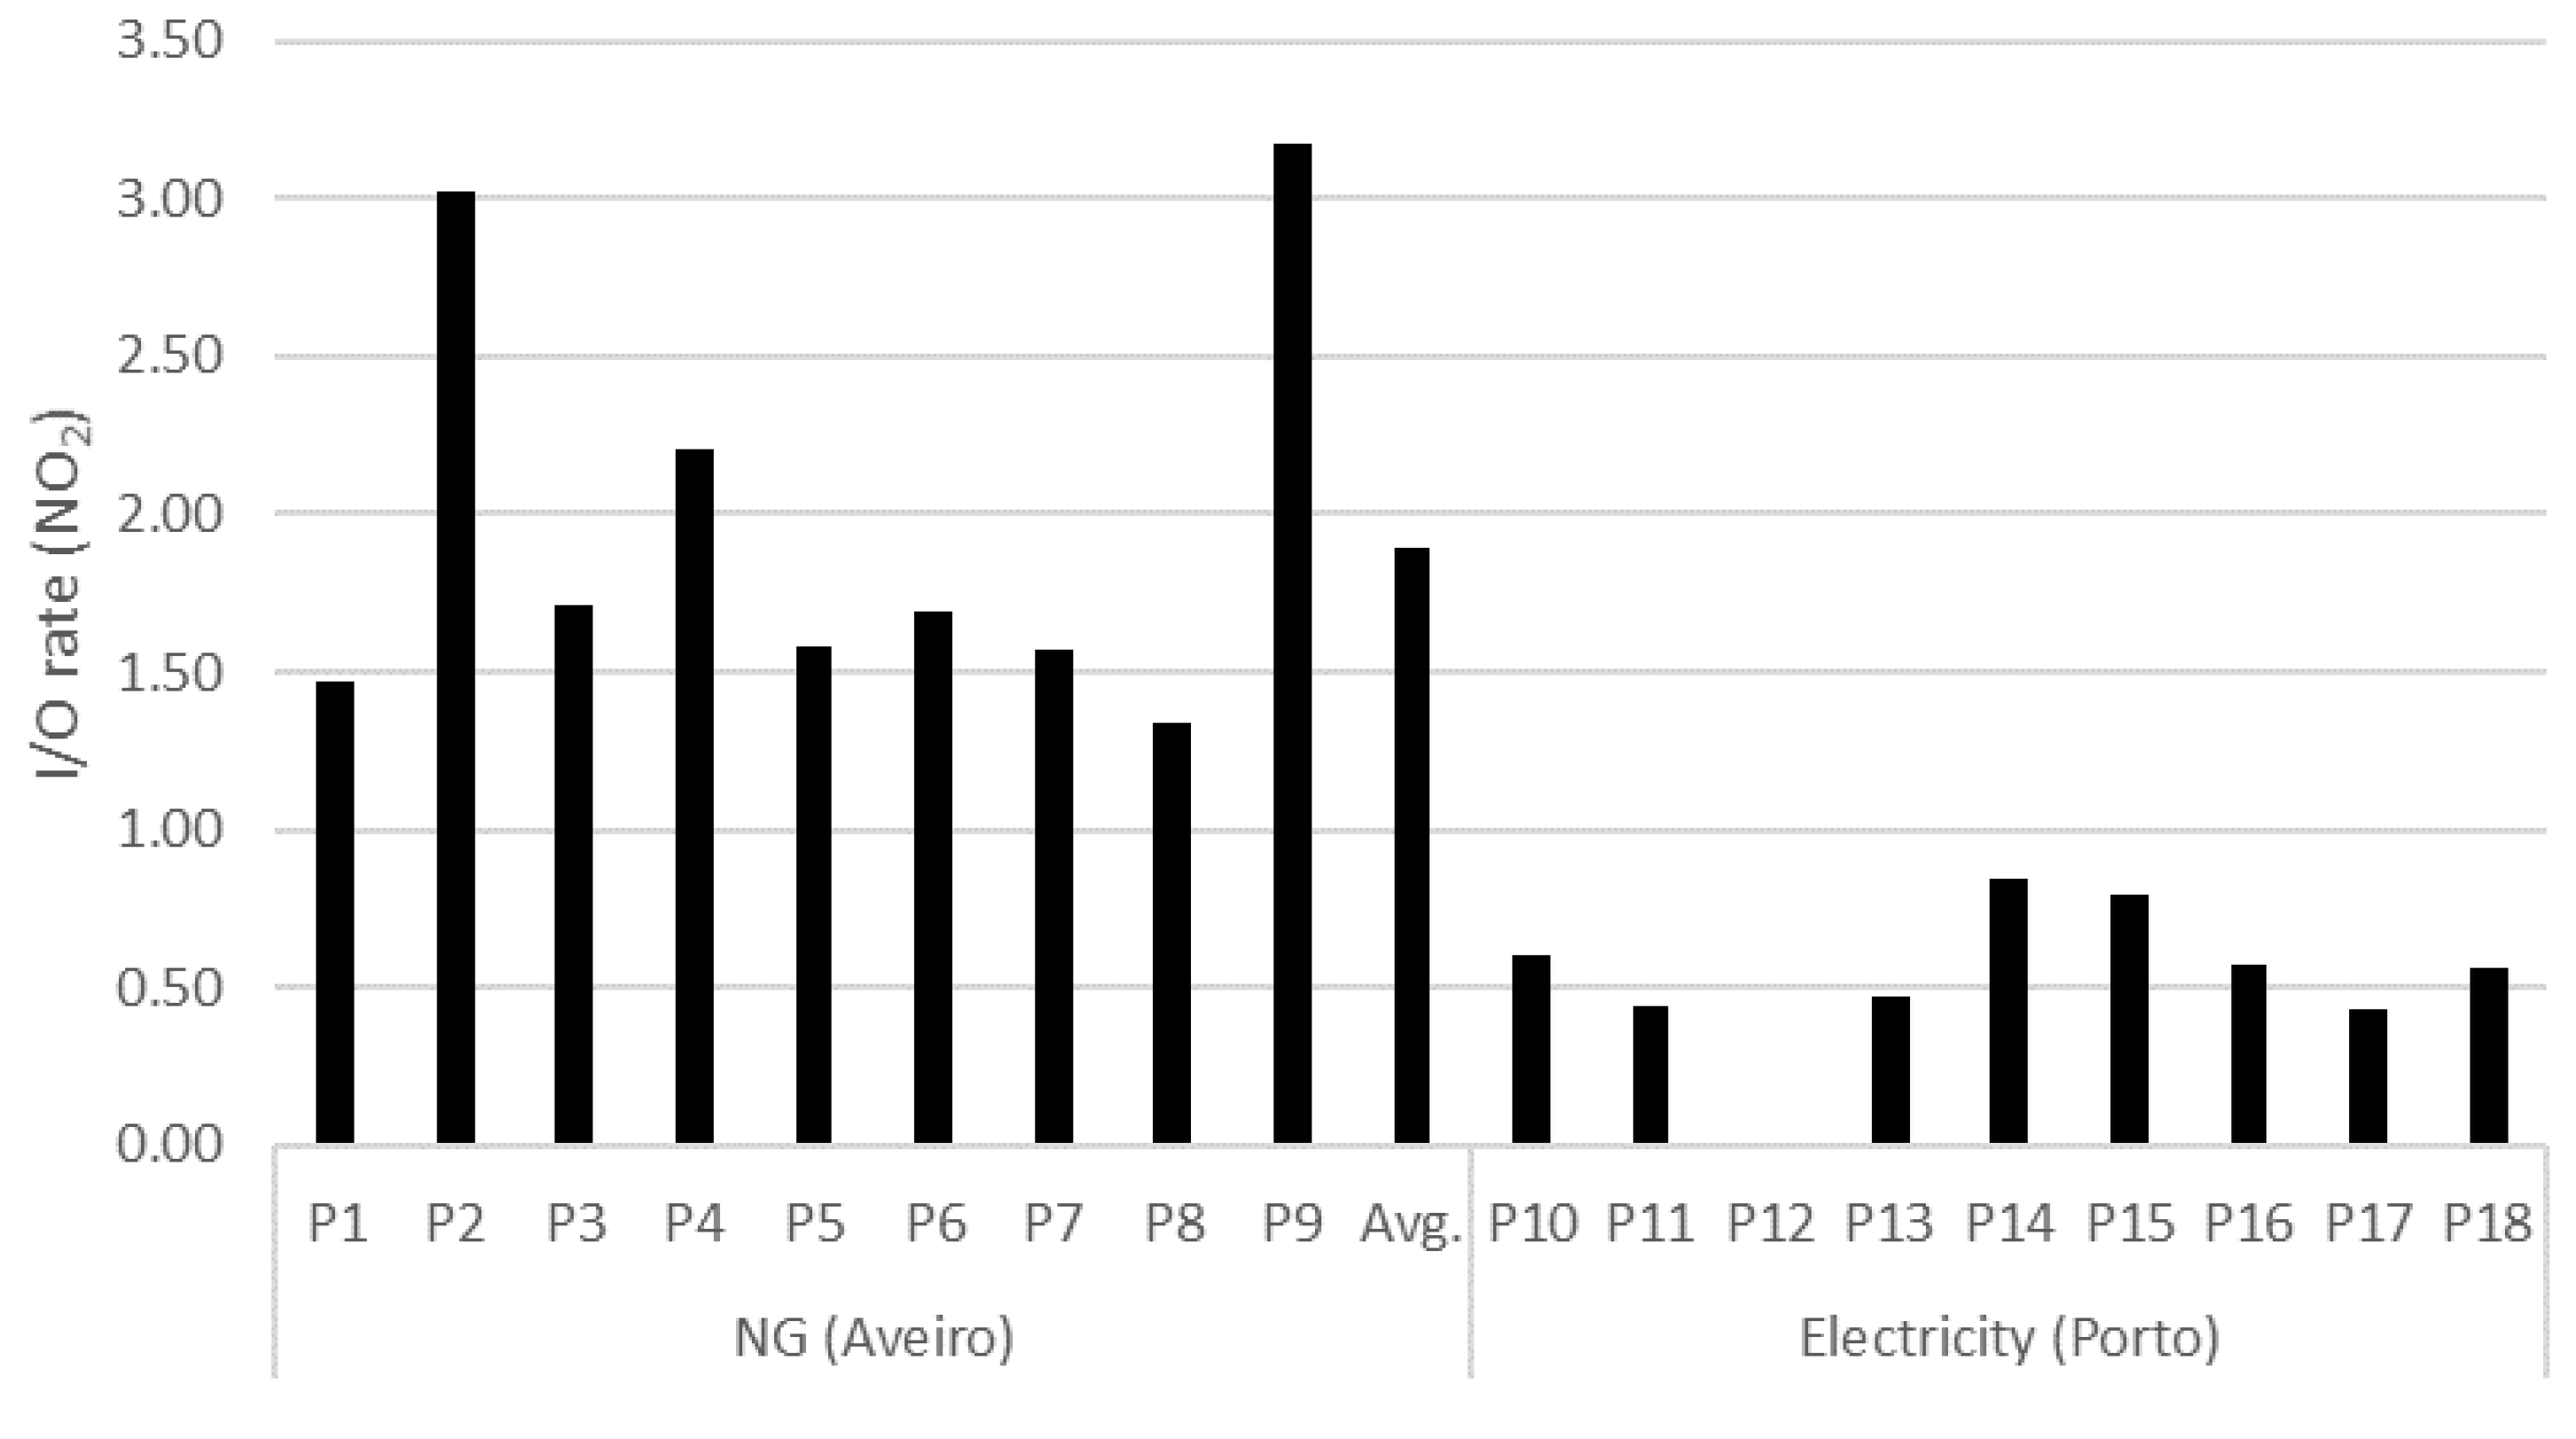
| - NG (Aveiro) | 9 | 23.8 | 59.9 | 38.6 ± 11.3 | 13.8 | 29.6 | 20.4 ± 5.3 | 1.90 |
| - Electricity (Porto) | 9 | 10.8 | 26.1 | 16.7 ± 5.5 | 23.1 | 34.2 | 28.8 ± 3.6 | 0.58 |
| House typology (flats) | ||||||||
| - NG (Aveiro) | ||||||||
| - T2 | 1 | - | - | 30.0 | - | - | 17.7 | 1.69 |
| - T3 | 5 | 29.2 | 46.5 | 38.4 ± 8.0 | 17.1 | 29.6 | 23.2 ± 6.1 | 1.64 |
| - T4 | 2 | 43.8 | 59.9 | 51.9 ± 11.4 | 13.8 | 10.8 | 16.8 ± 4.2 | 3.09 |
| - Electricity (Porto) | ||||||||
| - T3 | 3 | 13.4 | 23.8 | 18.0 ± 5.3 | 28.1 | 31.0 | 29.7 ± 1.5 | 0.61 |
| - T4 | 4 | 10.8 | 26.1 | 17.6 ± 7.8 | 23.1 | 34.2 | 29.5 ± 5.0 | 0.60 |
| House type (flats) | ||||||||
| - NG (Aveiro) | ||||||||
| - 1st floor | 1 | - | - | 46.5 | - | - | 29.6 | 1.57 |
| - 2nd floor | 3 | 43.8 | 59.9 | 49.8 + 8.8 | 13.8 | 28.8 | 20.8 ± 7.5 | 2.39 |
| - 3rd floor | 2 | 29.2 | 31.1 | 30.2 + 1.3 | 17.1 | 23.3 | 20.2 ± 4.4 | 1.49 |
| - 5th floor | 1 | - | - | 37.8 | - | - | 17.1 | 2.21 |
| - Electricity (Porto) | ||||||||
| - 1st floor | 1 | - | - | 10.8 | - | - | 23.1 | 0.47 |
| - 2nd floor | 2 | 16.7 | 23.8 | 20.3 ± 5.0 | 28.1 | 29.9 | 29.0 | 0.70 |
| - 3rd floor | 1 | - | - | - | - | - | 34.2 | - |
| - 4th floor | 1 | - | - | 13.4 | - | - | 31.0 | 0.43 |
| - 5th floor | 1 | - | - | 26.1 | - | - | 32.7 | 0.80 |
| - 9th floor | 1 | - | - | 16.0 | - | - | 28.0 | 0.57 |
Disclaimer/Publisher’s Note: The statements, opinions and data contained in all publications are solely those of the individual author(s) and contributor(s) and not of MDPI and/or the editor(s). MDPI and/or the editor(s) disclaim responsibility for any injury to people or property resulting from any ideas, methods, instructions or products referred to in the content. |
© 2024 by the authors. Licensee MDPI, Basel, Switzerland. This article is an open access article distributed under the terms and conditions of the Creative Commons Attribution (CC BY) license (https://creativecommons.org/licenses/by/4.0/).
Share and Cite
Barros, N.; Fontes, T. Impact of Kitchen Natural Gas Use on Indoor NO2 Levels and Human Health: A Case Study in Two European Cities. Appl. Sci. 2024, 14, 8461. https://doi.org/10.3390/app14188461
Barros N, Fontes T. Impact of Kitchen Natural Gas Use on Indoor NO2 Levels and Human Health: A Case Study in Two European Cities. Applied Sciences. 2024; 14(18):8461. https://doi.org/10.3390/app14188461
Chicago/Turabian StyleBarros, Nelson, and Tânia Fontes. 2024. "Impact of Kitchen Natural Gas Use on Indoor NO2 Levels and Human Health: A Case Study in Two European Cities" Applied Sciences 14, no. 18: 8461. https://doi.org/10.3390/app14188461
APA StyleBarros, N., & Fontes, T. (2024). Impact of Kitchen Natural Gas Use on Indoor NO2 Levels and Human Health: A Case Study in Two European Cities. Applied Sciences, 14(18), 8461. https://doi.org/10.3390/app14188461