Article

Numerical Evaluation of Hot Air Recirculation in Server Rack

by
Nelson Bafana Madihlaba
and
Thokozani Justin Kunene
*
Department of Mechanical and Industrial Engineering Technology, University of Johannesburg, Doornfontein Campus, Corner of Siemert and Beit Streets, Johannesburg 2028, South Africa
*
Author to whom correspondence should be addressed.
Appl. Sci. 2024, 14(17), 7904; https://doi.org/10.3390/app14177904
Submission received: 7 August 2024 / Revised: 31 August 2024 / Accepted: 2 September 2024 / Published: 5 September 2024

Abstract

:
In air-cooled data centers, hot aisle containment is used to separate hot and cold air from mixing to improve cooling effectiveness. However, this creates a significant pressure imbalance between the cold and hot aisles, with the latter being high. The hot aisle high pressure creates bac pressure that pushes against the server-unit fan system, which subsequently results in hot recirculation and insufficient server-unit cooling. This study examines the application of series-configured server fans with the intention of increasing the system pressure head to overcome the hot aisle containment back pressure and eliminate server hot air recirculation. A detailed computational fluid dynamics model for the Dell 2950 2U server is calibrated and validated using existing experimental test results. Furthermore, the impact of changing the server fan system to a series configuration by adding four or more server fans is investigated under different hot-aisle pressure conditions. It was found that changing the server fan system configuration from parallel to series arrangement positively improved the available system static pressure, but it did not result in the elimination of hot air recirculation. The server with the series-configured fan system experienced an average inlet air temperature increase of 9% when compared to the original server under similar conditions. This study serves as a base for integrating liquid and air-cooling systems to form hybrid cooling systems for high-density racks in legacy data centers.

1. Introduction

Energy is at the core of the sustainability debate, impacting all three components of sustainability: economic, social, and environmental [1]. In recent years, internet service utilization has increased exponentially, leading to a high energy demand and consumption in data centers. A data center is an environmentally controlled physical space with clean electrical power and network connectivity optimized for hosting servers [2]. Current power consumption trends are continuously increasing to satisfy the growing needs of e-commerce and other novel technologies such as cloud computing [3]. Koomey et al. [4] found that global data centers accounted for between 1.1% and 1.5% of the global total electricity consumption. The high demand for computation speed has led to a surge in the utilization of high-power density rack servers (processing and storage ITE) in cloud computation data centers.
A third of the total power consumption in data centers does not go towards computation and data storage functions, but towards cooling ITE (servers, storage, and networking) [5]. Wang et al. [6] noted that in traditional data centers, the cooling system infrastructure consumes 40–50% of the data center’s total power supply. In most data centers, cooling is provided through air-cooling systems because of their high reliability and low initial capital cost [7]. The air-cooled data center cooling system comprised cooling units (CRAH/CRAC units), air containment, and air-path plenums. The conditioned cold air is supplied to the servers, which are equipped with fans responsible for drawing air from the cold aisle through the front air intake into the server to cool the internal components, such as the central processing unit (CPU, memory modules, motherboard, and power supply), and discharge air into the hot aisle [8]. Thus, improving the server cooling efficiency affects the overall data center efficiency. Shah et al. [9] performed an energy analysis of a data center cooling system, and the results revealed an overall cooling system inefficiency of 20%. A substantial portion of the wasted cooling energy is apportioned to local hotspots in data centers [10]. Zhao et al. [11] stated that when the server is fully stressed or under maximum IT load, it generates a significant amount of heat, without sufficient cooling capacity it can become a hotspot, which will subsequently lead to a failure. The serve inlet and outlet air temperatures were previously used as indicators of hotspots in the data center. Khalili et al. [10] experimentally studied the impact of internal design on the efficiency of IT equipment in a hot aisle containment system. The server CPU and inlet/outlet temperatures were used as indicators to identify hotspots on the server under various operating conditions. Kodama et al. [12] found that server IT workload or node arrangement affects the fan speed, where CPU temperatures are used to show the impact.
Zhao et al. [11] conducted overview research on data center local hotspot management strategies, where non-uniform airflow distribution, unbalanced airflow supply and demand, and airflow were stated as the primary causes for hotspot formation in air-cooled data centers. All these issues cause insufficient cold air supply to the server or negative pressure in front of the server, which eventually draws hot air from the hot aisle to fill the suction side of the server and mix with the cold air. Mixed air increases the inlet air temperature, which subsequently leads to insufficient cooling of the server or the formation of a hotspot (Figure 1).
Zhao et al. [11] approach accounts for the hot recirculation at rack-level only, where the hot air recirculates by going over the rack to mix in the cold aisle before entering the server. This mixing is likely to occur in non-containerized cold or hot aisles. Khalili et al. [10] studied the impact of internal design on the efficiency of IT equipment in the hot aisle containment system. The study was conducted experimentally, where three 2U servers from various manufacturers and generations were utilized to analyze the internal thermal performance of the server. The experimental results confirmed the interdependency between the ITE internal design, back pressure (hot aisle pressure), and hotspot formation owing to hot air recirculation. Khalili et al. [13] numerically studied the impact of changing the chassis fan location with regard to the server hot air recirculation. The CFD model revealed that chassis fan relocation significantly improves the server’s overall cooling efficiency, but it brought in the new phenomenon of “reverse flow through the power supply units” due to back pressure (hot aisle pressure).
To improve the air-cooled data center cooling system capacity, a novel hybrid cooling system (air and indirect single-phase liquid) has been experimentally evaluated [14]. The hybrid system was composed of two L2A (liquid to air) in-row CDUs, three racks, and fully containerized cold and hot aisles. Hot air recirculation was observed at the inlet of the servers owing to the open rack-discharge side. Blanking panels were added to the back of the racks, the inlet air mixing subsided, and visible hotspots remained in the intake. This may have been due to the hot aisle back pressure pushing against server chassis fans. Most previous studies have focused on hot air recirculation as a data center-level issue instead of server-level inefficiency, as noted by Zhao et al. [11]. This study focuses on evaluating the hot air recirculation phenomenon inside a server unit resulting from the hot aisle back pressure. An air-cooled server is selected for this study so that the hot air recirculation evaluation can be narrowed down to the airflow impact on the hot recirculation formation.
A detailed computational fluid dynamics model for the Dell 2950 2U server is calibrated and validated using the existing experimental test results from Khalili et al. [10]. To accurately forecast fan performance at lower costs, simplified models, such as the extended actuator disk model (EADM) and reverse-engineered empirical actuator disk model (REEADM), have been developed because of the high computational cost of solving full three-dimensional numerical models of axial flow fans [15]. Kusyumov et al. [16] used momentum theory in conjunction with a pressure jump and a virtual blade model to investigate the effect of rotors on the aerodynamics of a helicopter fuselage. Barakos et al. [17] used a pressure-sensitive paint rotor [17] to simulate rotor flow wakes using a virtual disk (AD) model, and the outcomes were compared to those of fully resolved rotor blade simulations. They proved that compared to the completely resolved models, the CFD findings for the AD models accurately depicted the primary vortical structures surrounding the rotor disk.
The central focus has been on the main cooling components of the server, that is, the “fan set”. The server thermal design requires knowledge of the impact of the internal configuration of the server on cooling efficiency. Hence, this study attempts to understand the impact of the fan set configuration on the server inlet temperature at multiple back-pressure readings. The use of computational fluid dynamics to study server thermal performance under various operational conditions has risen sharply over the past decade owing to the introduction of high-density server racks [8,18,19]. Complex CFD models have high computational requirements, and convergence of the solution is time-consuming. Several experimentally validated CFD compact server models have been developed in multiple studies to minimize the computation time and resources required for the solution [19,20,21].

2. Materials and Methods

2.1. Geometrical Configuration

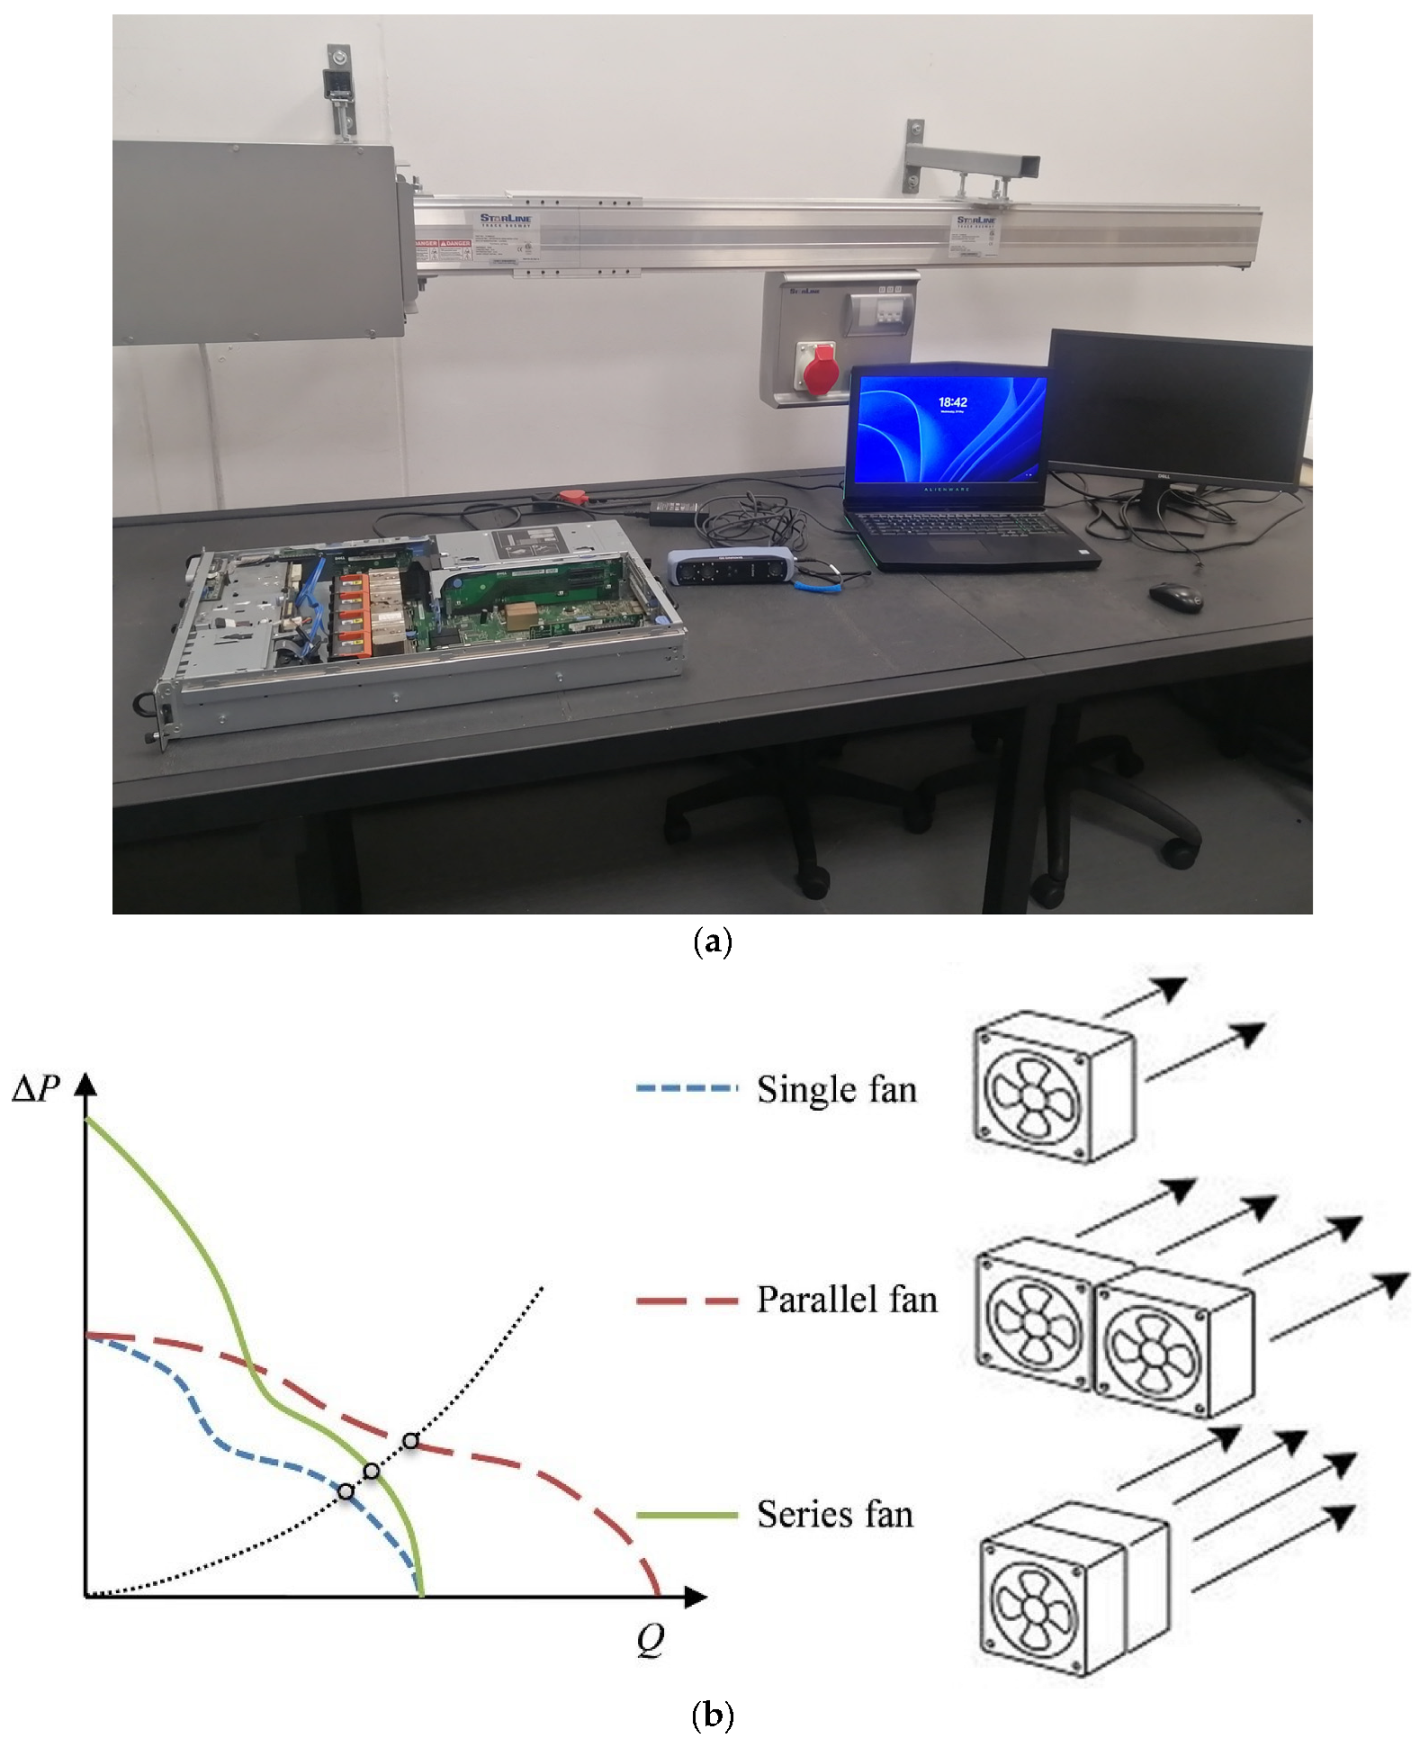
In this study, numerical simulations were performed based on the experimental measurements conducted by Khalili et al. [10]. The first phase involved creating a computer-aided drawing (CAD) model from the actual server using 3D scanning technology and an Autodesk Inventor to further detail the model. The second phase involved creating a CFD model and subsequently validating the CFD model against the experimental results of Khalili et al. [10]. The first phase was conducted in three stages: scanning, meshing, detailing of components (on Autodesk Inventor), and assembling (Autodesk Inventor). Einstar 3D scanner software v.1.2.2.0 was installed on a laptop and calibrated according to the manufacturer’s requirements, as shown in Figure 2a. Figure 2b shows the P-Q curves for the single, two-fan parallel, and series fans. It is observed that when there is less resistance, the flow nearly doubles, and the airflow rate increases owing to the parallel operation. However, the static pressure increases and remains constant. The static pressure doubled during the series operation, but the flow rate did not increase. This combination of axial fans works well when there is insufficient airflow from a single fan owing to excessive system resistance [22].
A cooling fan is a low-cost component used for forced-convection cooling in conventional server-unit cooling systems. The server cooling fans were designed to produce sufficient static pressure to overcome the pressure drop across the server unit. The cooling fans ramped up and down in response to the temperature changes of the server CPU, RAM, SAS, and other thermal components. The server airflow is a function of the fan-set static pressure. Consequently, an increase in system impedance decreases the airflow across the server. A parallel fan system is commonly used in conventional server units, where a set of server fans and other server components are optimized as a system. The design approach does not consider the server discharge pressure condition, which affects the server airflow and the overall cooling performance. The ideal parallel server fan set provides a high airflow at a low system impedance, whereas the series configuration provides a low airflow with a high static pressure. A proper server thermal design should consider the host layout, intake, and discharge pressure conditions to study the flow interaction effect between the server and surroundings. In this context, a numerical study was performed on the effect of the server back pressure (hot aisle pressure) against series and parallel fan configurations.
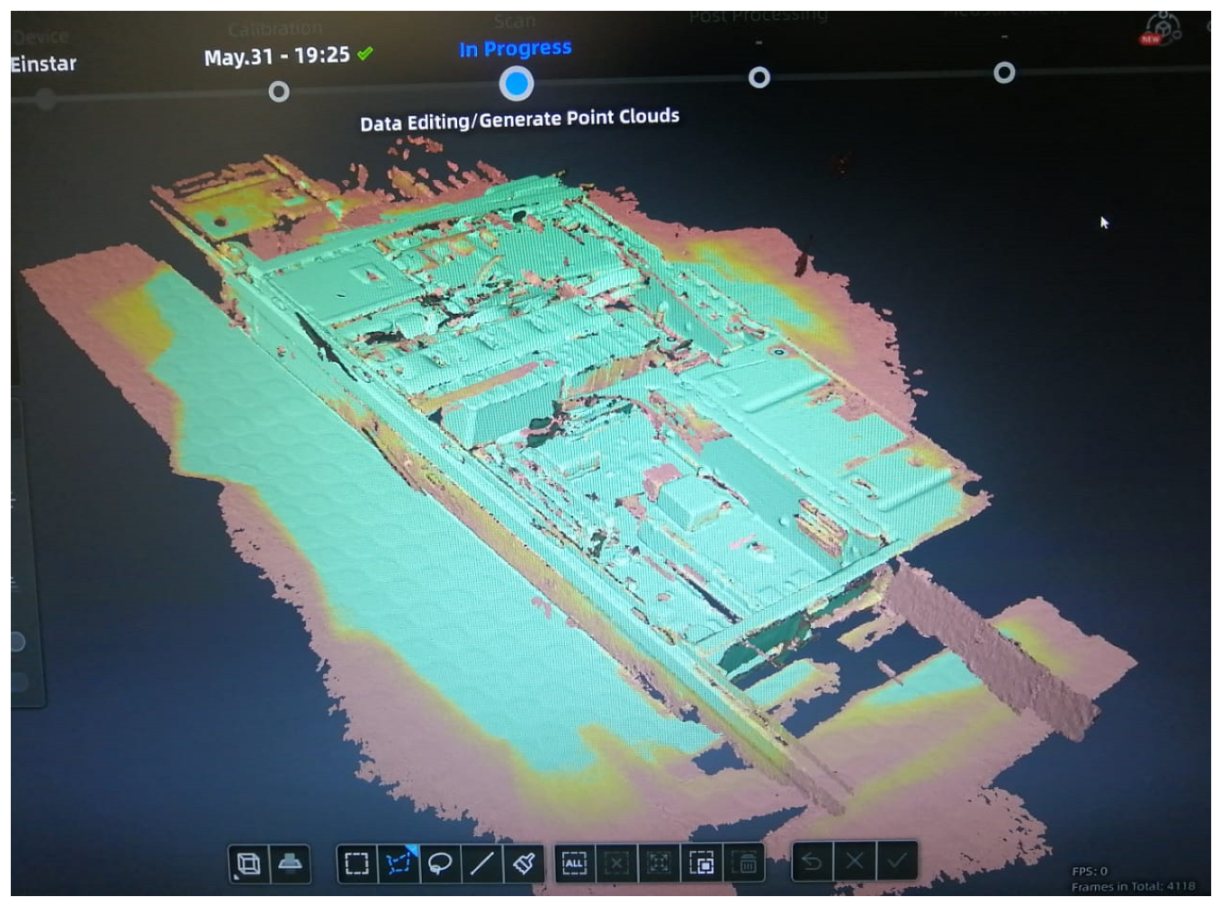
Table 1 lists the minimum operational system requirements for the computer to be used during scanning. The server was scanned using a 3D scanner and the model was displayed on a laptop for data quality monitoring. The green color in the model indicates good data quality, and orange indicates poor data quality, making it difficult to process and mesh the data, as shown in Figure 3.
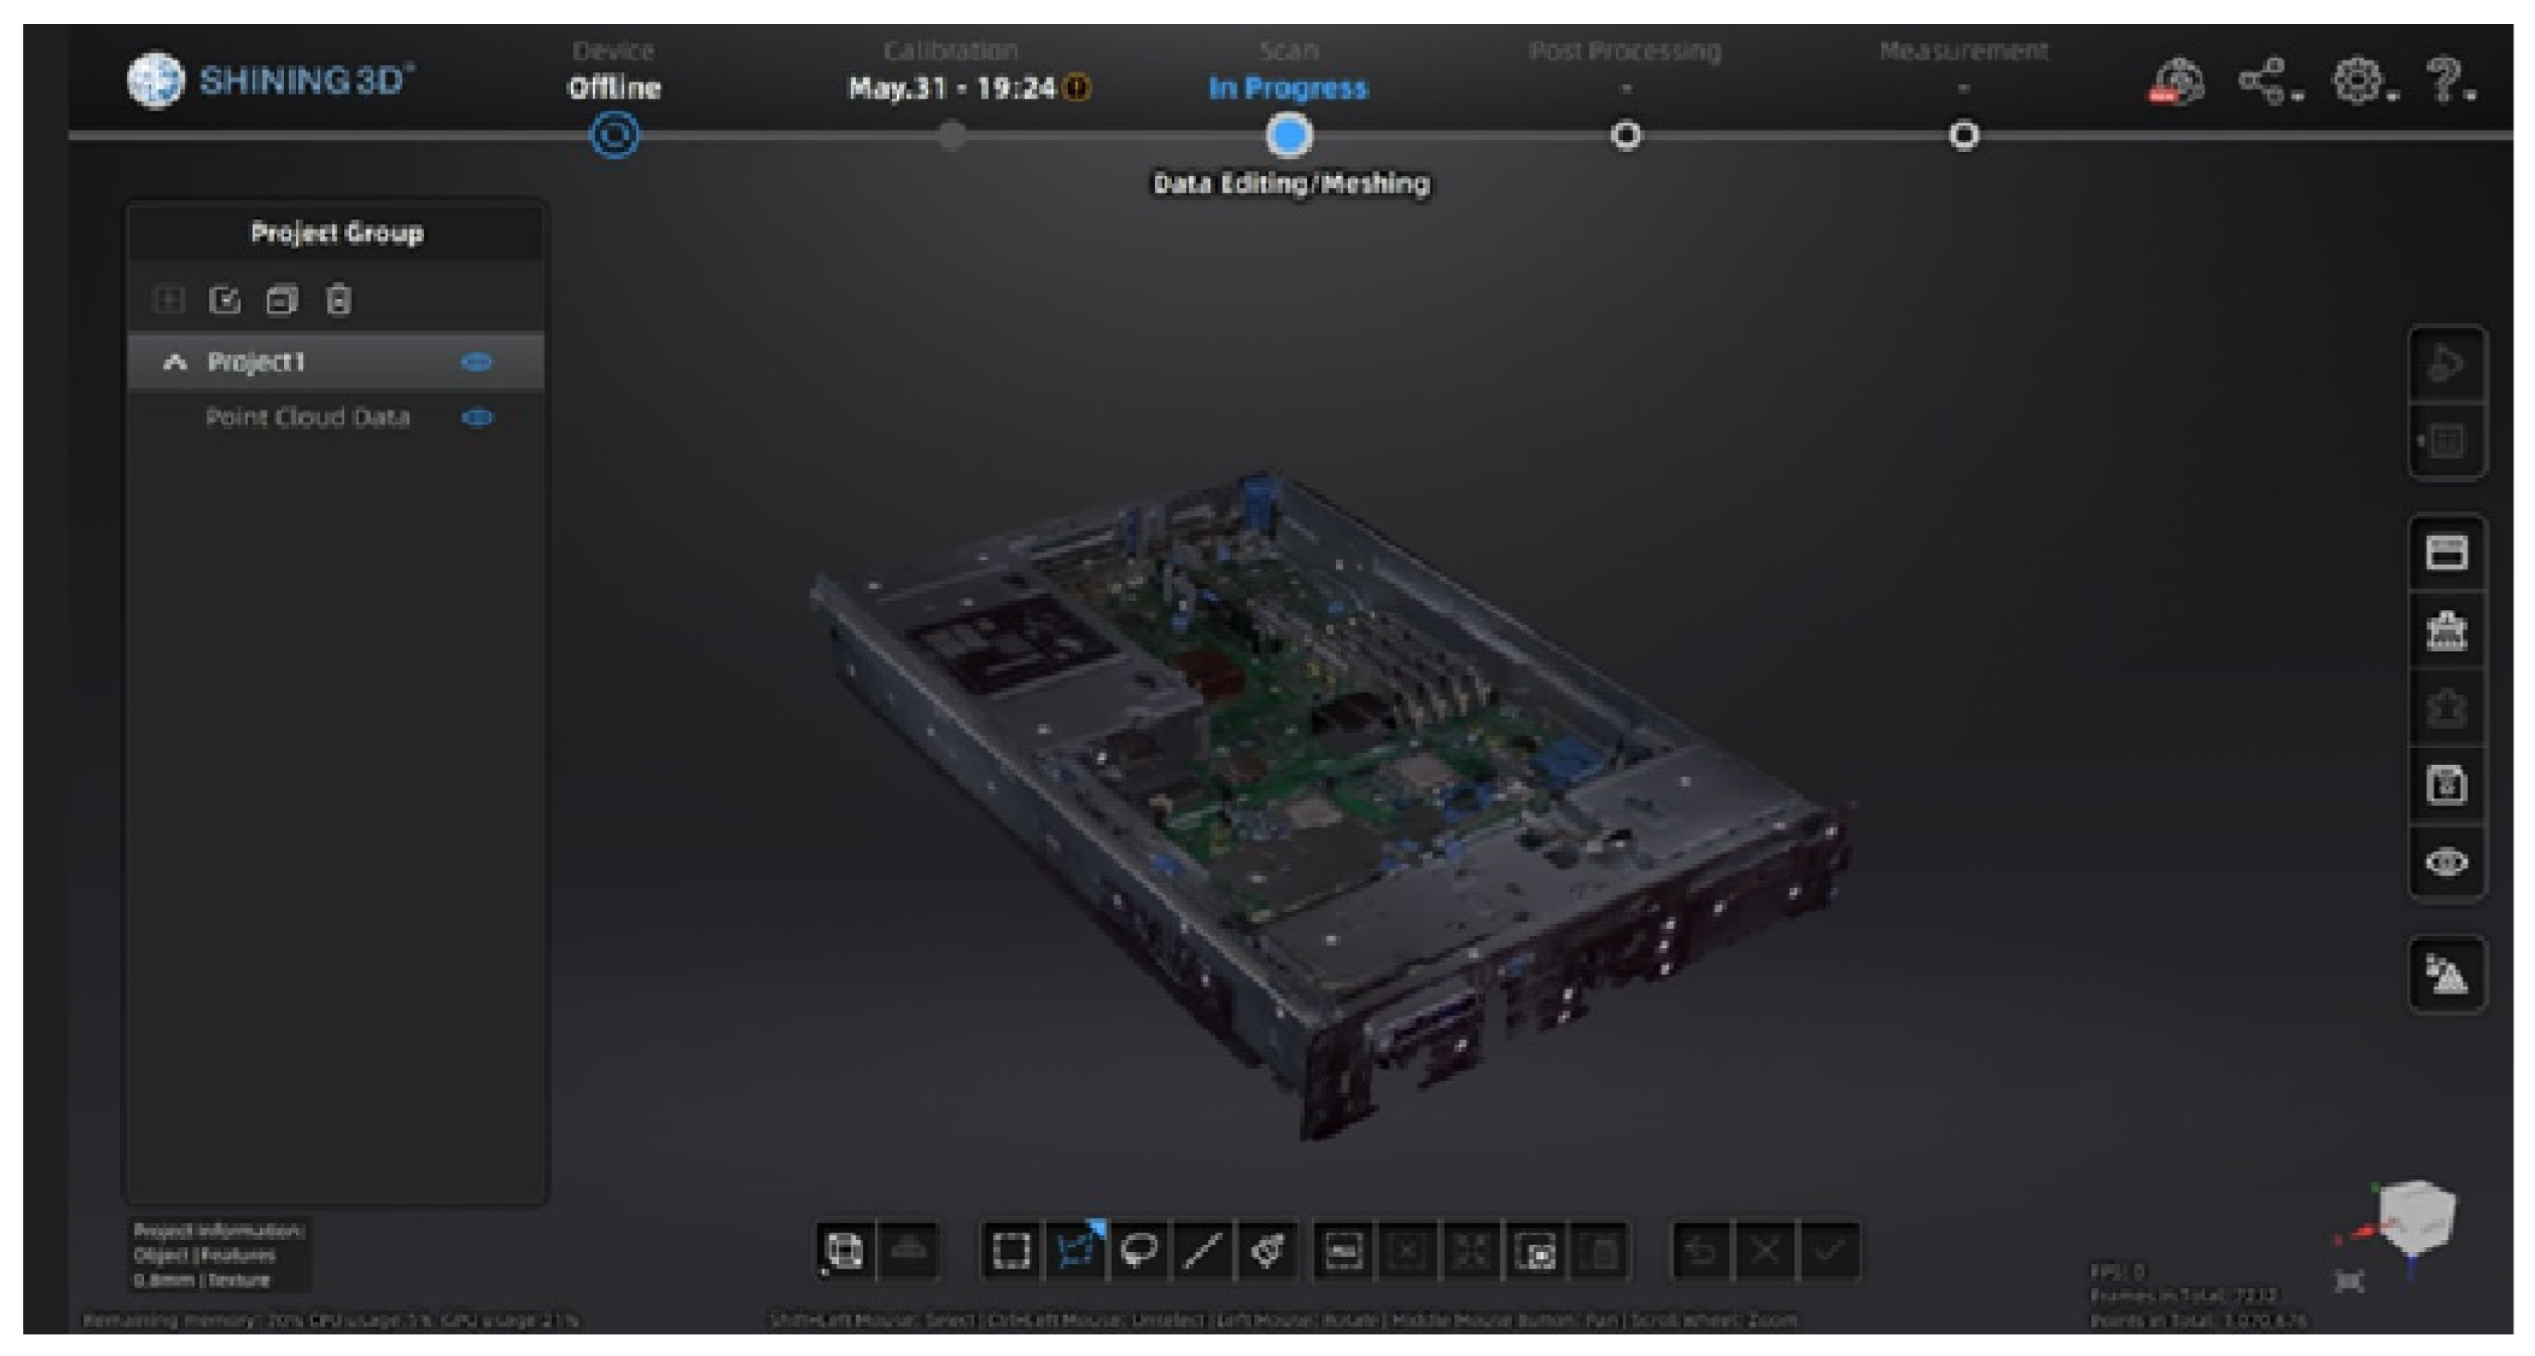
The model progressed into the meshing phase, where the data could be edited to allow meshing, as shown in Figure 4.
In the second step, the model was meshed and saved as an STP file to allow further editing of components that were not fully defined, as shown in Figure 5.
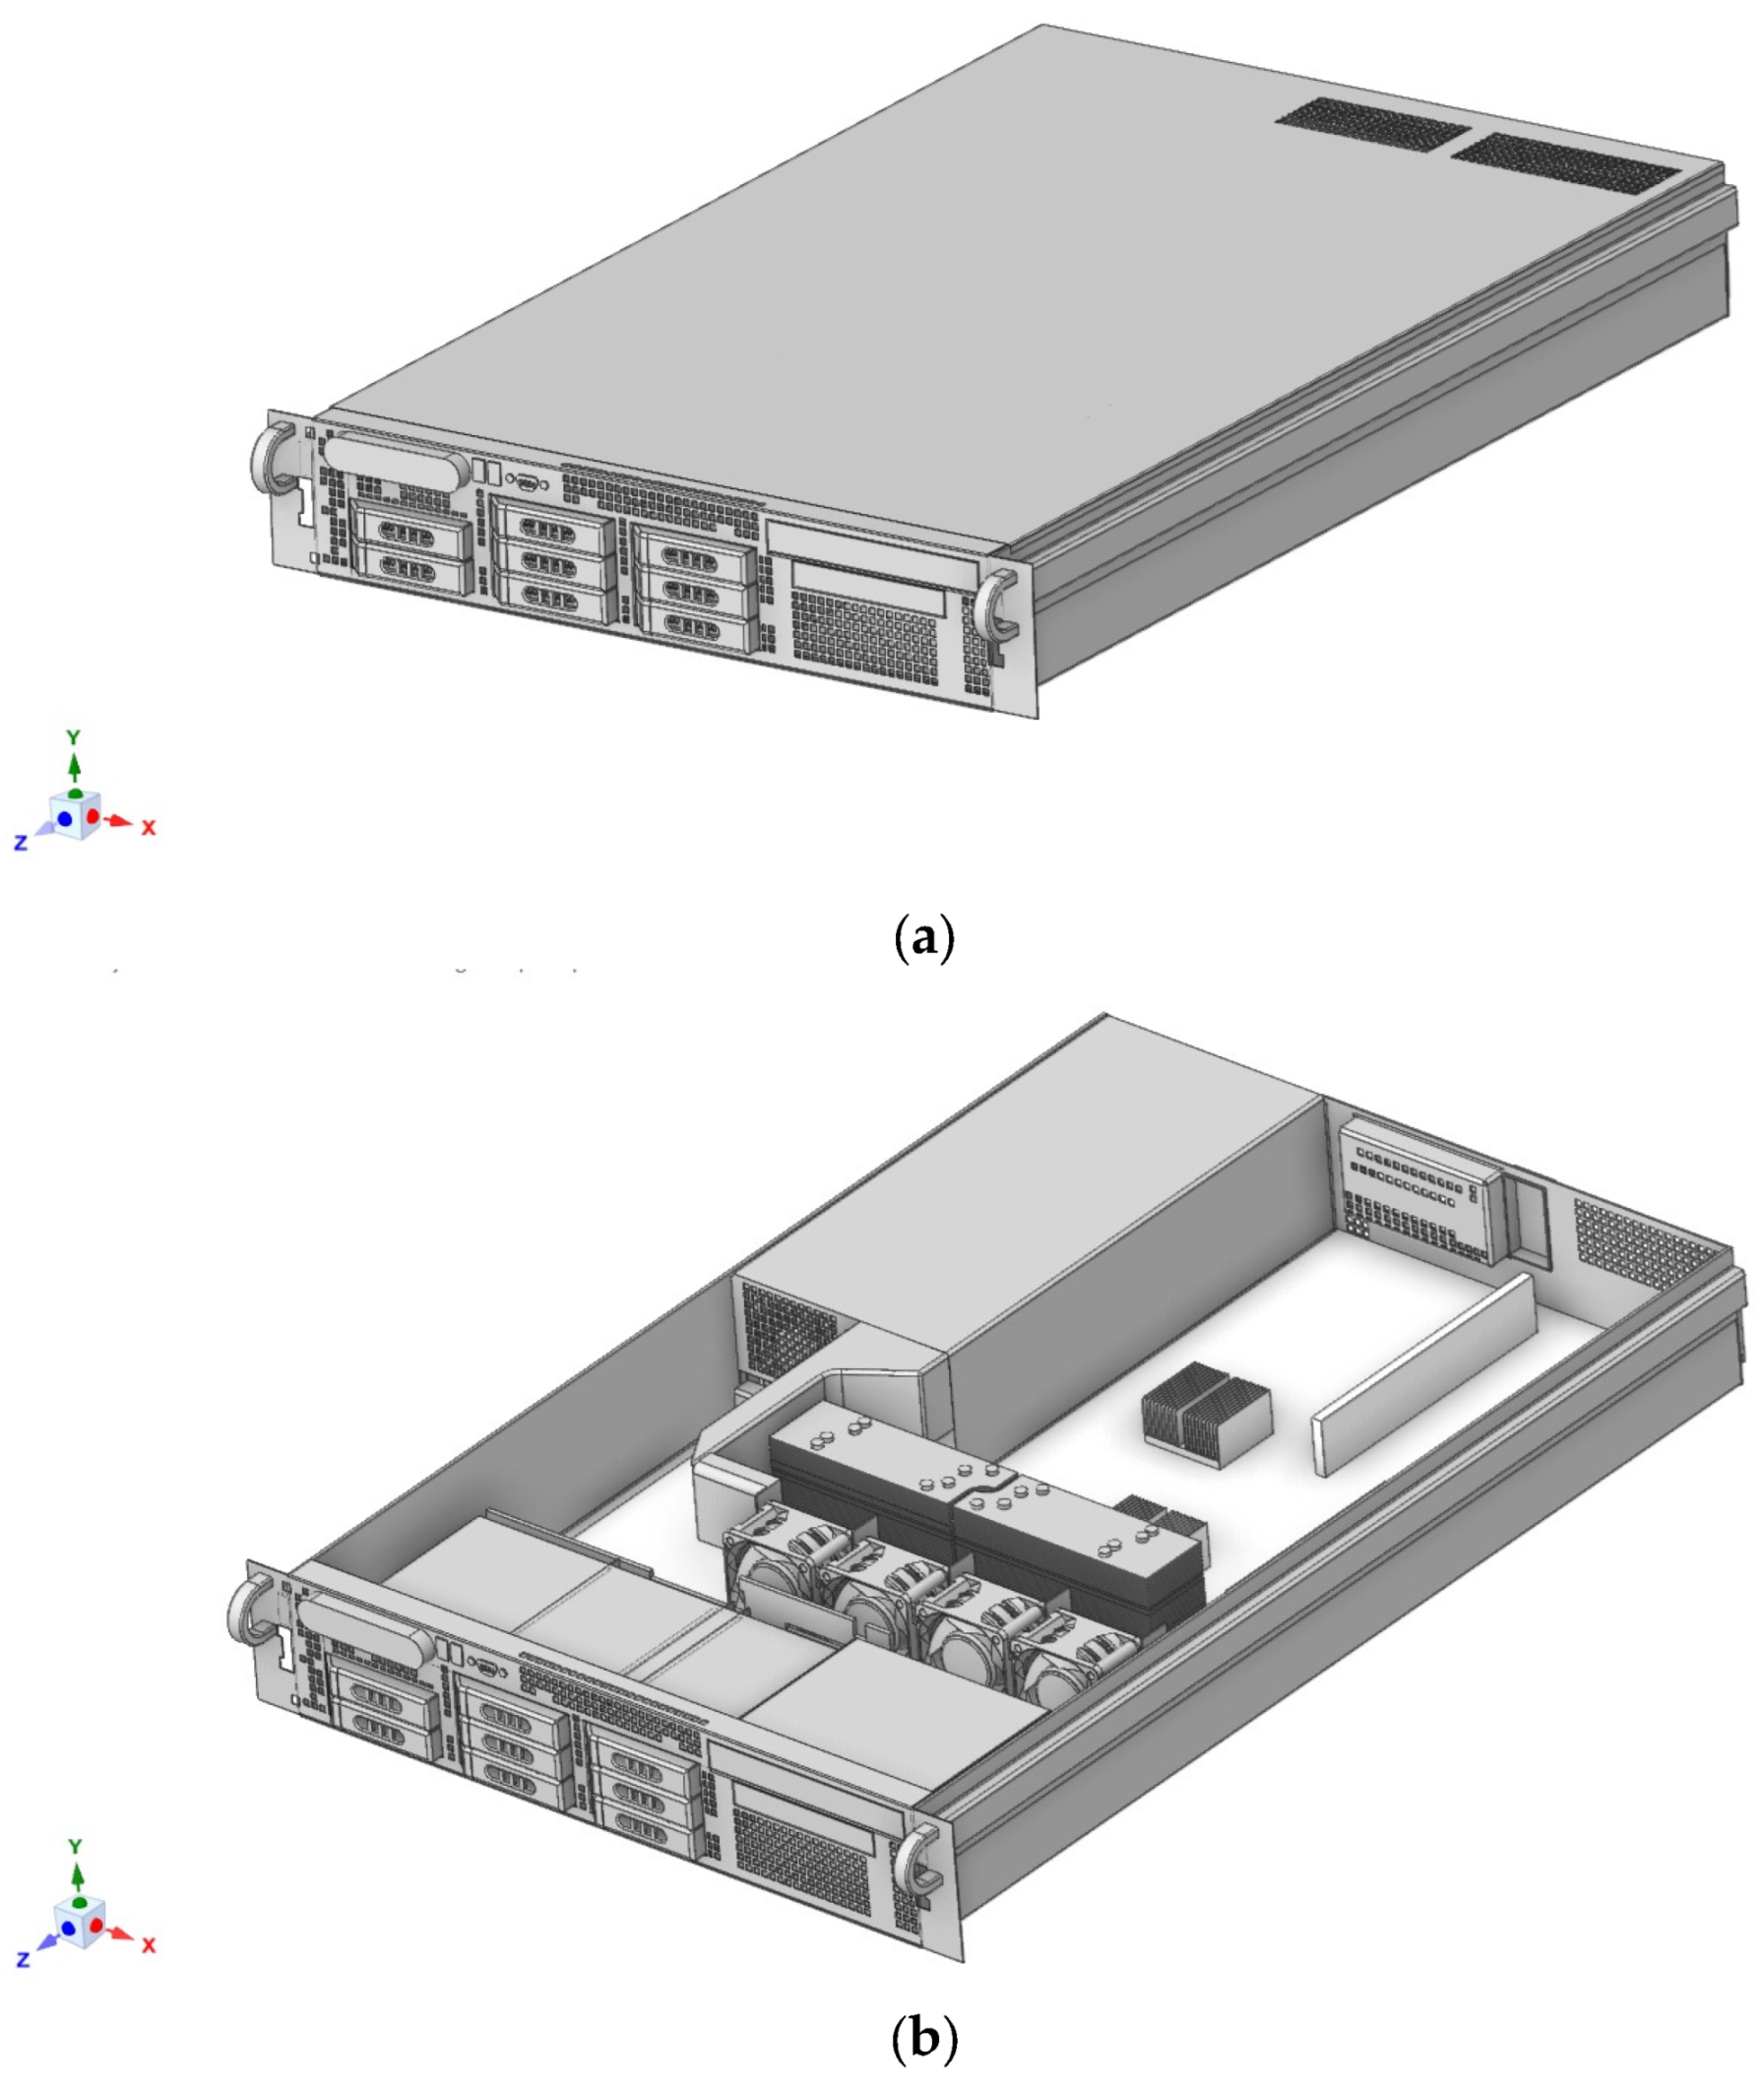
The STP file from the above does not provide sufficient detail for subsequent use in CFD simulations, which requires a much more simplified and detailed model. A Vernier caliper was used to physically measure and reproduce all major components of the Autodesk Inventor. Reproducing all major server components while neglecting smaller ones, which would have warranted a much smaller mesh size, increased the density of the volume mesh, as shown in Figure 6. It needs to be mentioned that a mesh of greater fineness would be necessary to capture the intricate geometry and fluid dynamics of smaller components. Yet, employing a finer mesh raises the count of cells or elements within the computational domain, consequently increasing the computational burden. Therefore, accommodating highly refined mesh for smaller components presents challenges in parallelization efficiency [23]. Our study attempted to balance the workload between processors which proved to be more difficult, potentially undermining the overall efficiency of the computation. However, a grid sensitivity in Section 3.2 mitigated this problem.

2.2. Fan Specification and Component Power

The server comprises four parallel San Ace 60 fans spanning approximately three-quarters of the server width located at the front end of the server in a push configuration, which draws air from the inlet and pushes it toward the thermal sources. Equally sized parallel fans double the airflow rate at the free-delivery point [24].
According to Korpela [24], this type of application should be used only when the fans operate in a low-resistance system or free-delivery-point condition. To simulate the operation of the server fans, they were modeled as compact models based on the San Ace 60 fan curve. The heat dissipation of the server components in Table 2 is based on the experimental data reported by Khalili et al. [10].

3. Numerical Analysis

3.1. Governing Equation and the Large-Eddy Simulation Turbulence Model

The following equations are conservative forms of the filtering equations for mass and momentum conservation in Newtonian incompressible flow [25]:
i u i = 0
t ρ u i + j ρ u i u j = i p + 2 j μ S i j ¯ j τ i j
S i j ¯ = 1 2 i u j + j u i
τ i j = ρ u j u j ¯ u i u j
where ρ is the density, u i is the filtered velocity, p is the filtered pressure, μ is the molecular viscosity, and τ i j is the unknown sub-grid scale (SGS) stress tensor. The filtered or resolved scale strain rate tensor is represented by S i j ¯ . These are the movements in large-eddy simulation (LES)-resolved fields.

3.1.1. SGS Modeling

Numerous SGS models have been developed, and the majority depict the SGS stress tensor using Boussinesq’s hypothesis and eddy viscosity assumption. Here, represents how these are displayed [26].
τ i j = 2 μ t S i j ¯ + 1 3 δ i j τ l
where μ t is the eddy viscosity of the SGS. We substitute this into Equation (5), which then becomes
t ρ u i + j ρ u i u j = i p + 2 j μ + μ t S i j
When the equation is calculated, the pressure is obtained not only by the static pressure, but also by the addition of the modified pressure P = p + 1 3 τ l l . SGS eddy viscosity calculation is the only remaining problem, and the simplest model was originally proposed by Smagorinsky:
μ t = ρ C S Δ 2 S S = 2 S i j S i j 1 2 Δ = ( Δ x Δ y Δ z ) 1 3
where C S is the Smagorinsky constant, which depends on flow type. A Smagorinsky constant C S = 0.1 was used in this study to account for near-wall effects.

3.1.2. Virtual Disk Model: Actuator Disk Methods

Star-CCM+ 17.04.008-R8 is a helpful tool for modeling fans, allowing the input of fan parameters such as power coefficients. The study modelled virtual disks, as shown in Figure 7a, based on actuator disk methods. Using computational fluid models, the blade element approach calculates the power produced by axial fans, showcasing blade behavior, and fluid dynamics. Zhao et al.’s approach was adopted for our fan model [27]. They provided a turbine rotor, which was mapped onto a computational mesh, and the thrust force acting on it was averaged over annular rings or the entire disk. This yields the thrust force acting on the rotor as
T disk = s disk b = 1 B   0 R   0 2 π   t b ( r ) d θ d r
where B is the number of turbine blades; R = D / 2 is the rotor radius (blade length); r is the local radial position; and θ is the azimuthal direction. In addition, s disk = 1 / ( 2 π ) , represents the effective solidity of actuation zone. The torque of the rotor is calculated as follows:
Q disk = s d i x b = 1 B   0 R   0 2 π   q b ( r ) r d θ d r
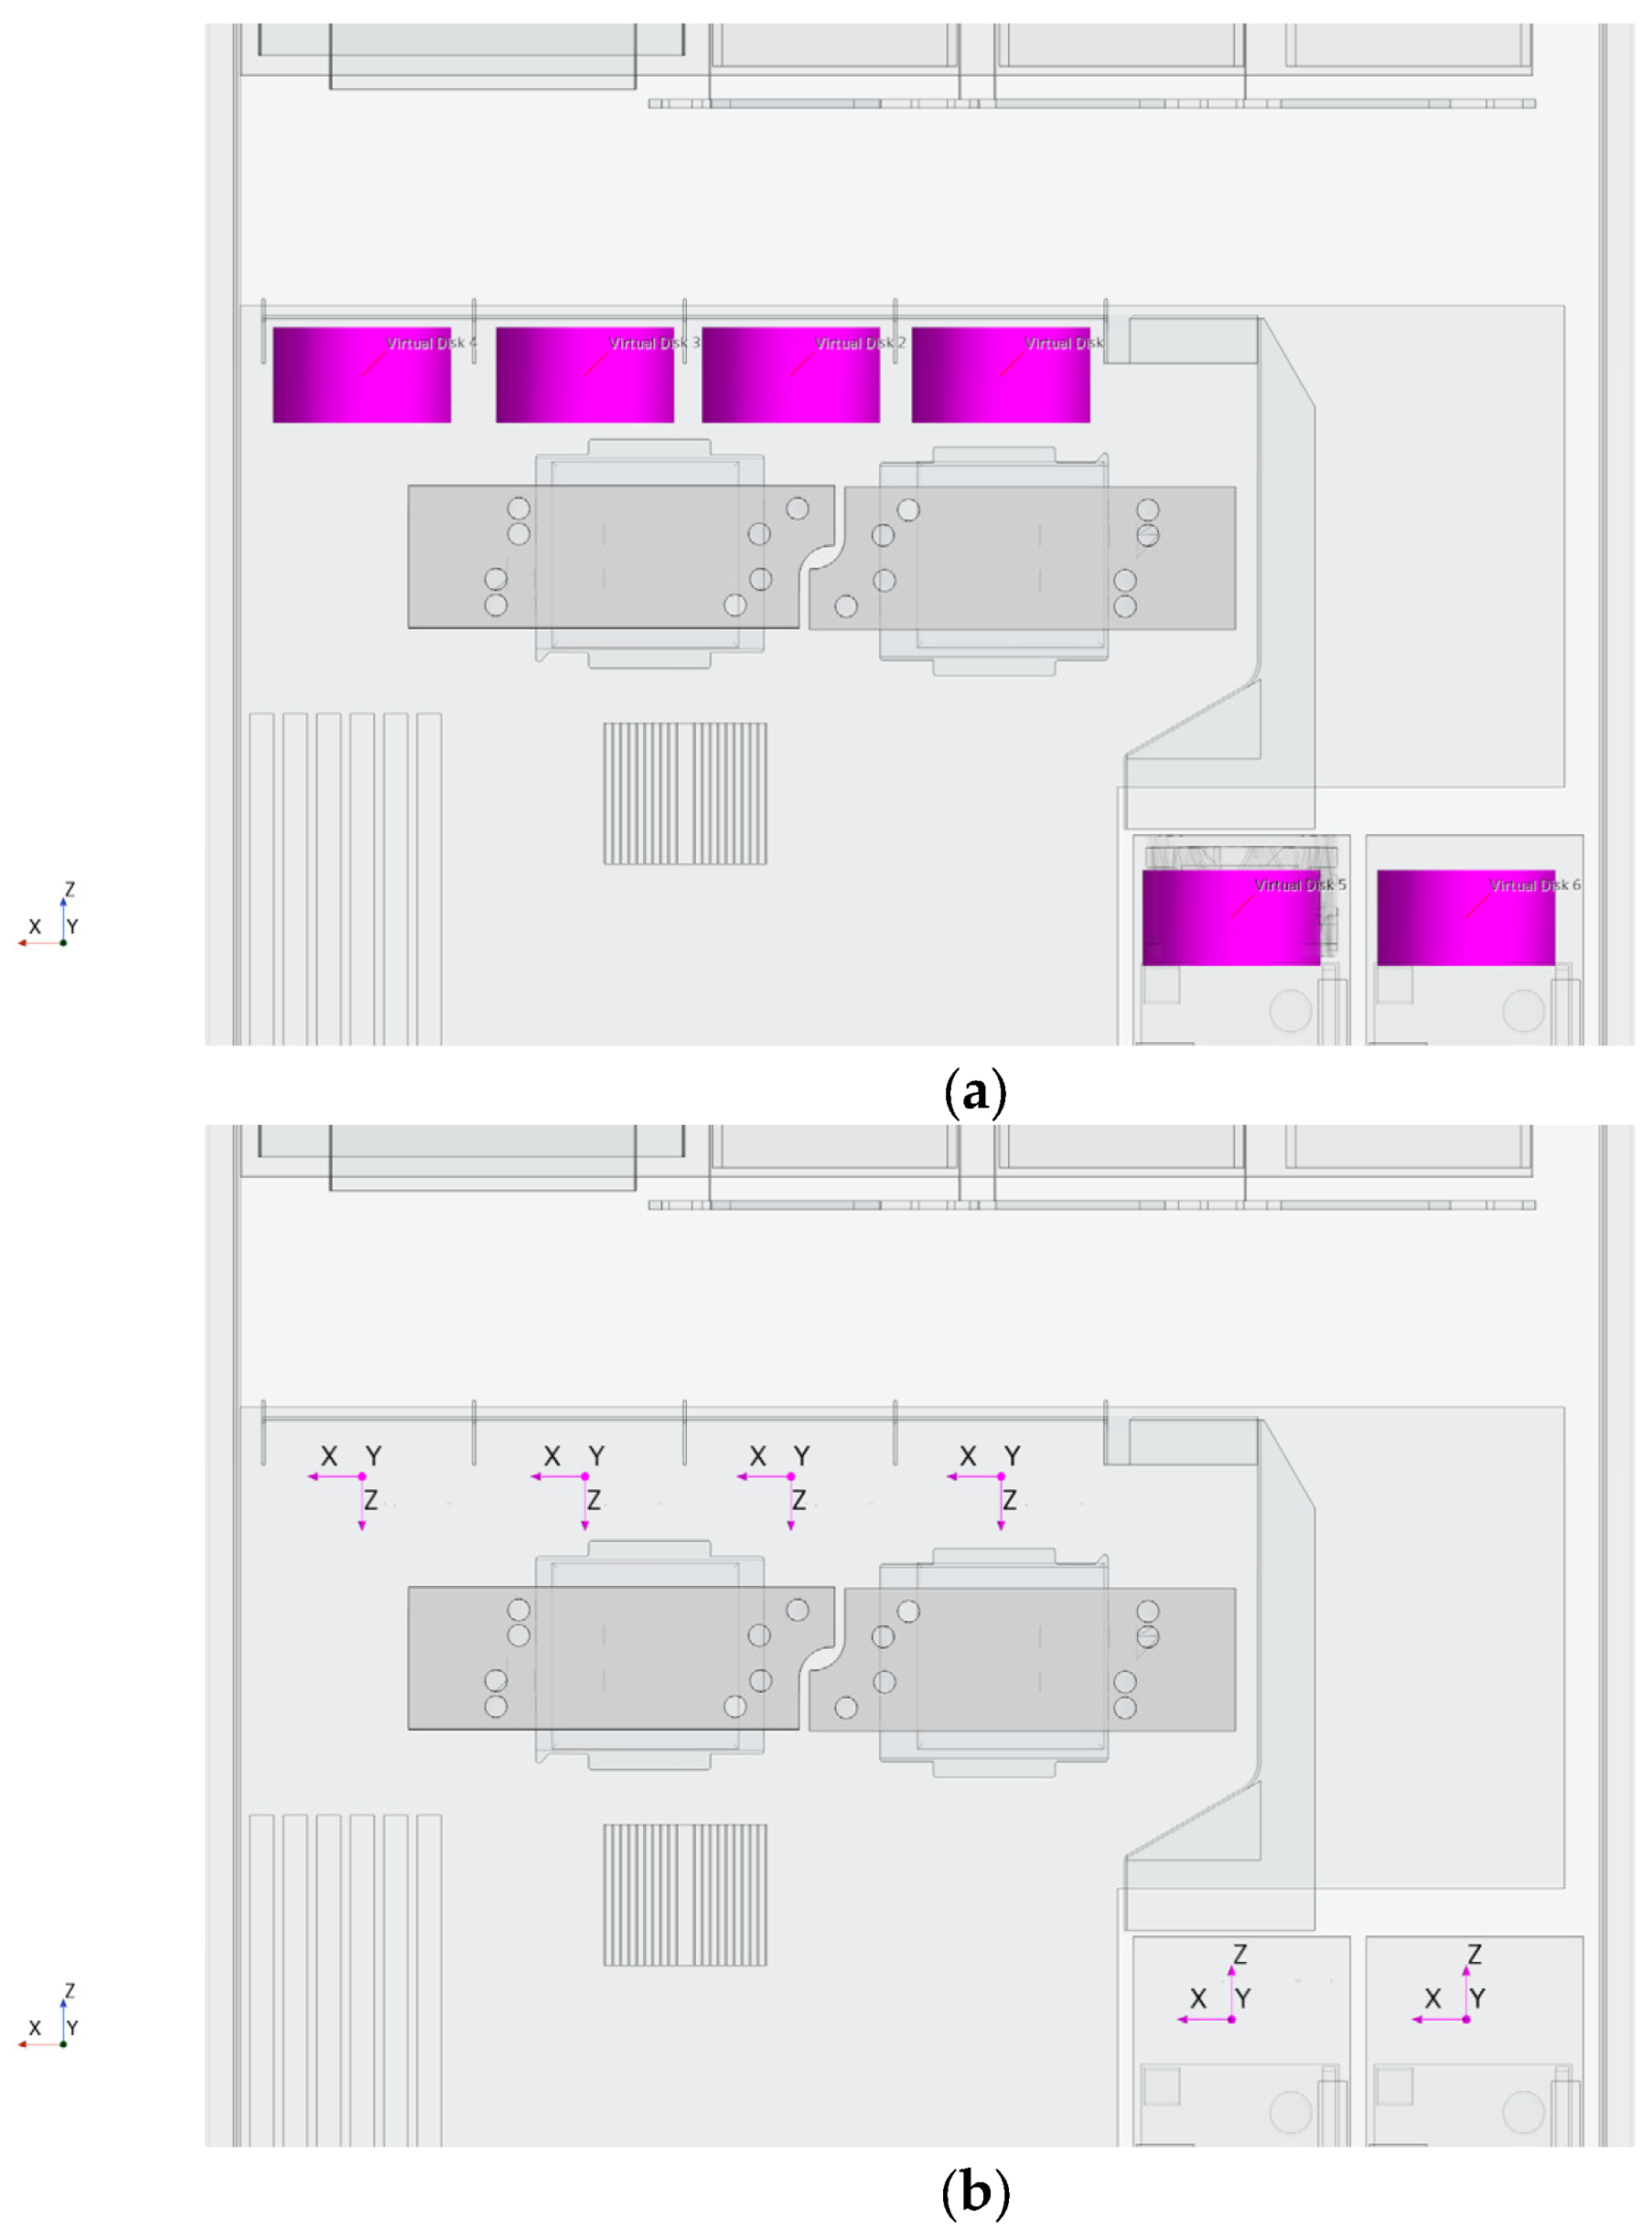
Instead, the shape of the virtual disk was created by specifying relevant parameters, such as radius, thickness, and orientation, to an existing mesh. Propeller performance curve table for the simulation. A polynomial (wind speed) node and rotation rate were selected. A new local coordinate system, as shown in Figure 7b, was created to indicate where all four series fans and six fans were parallel to the positions of the virtual disk. The inflow velocity vector was specified in these local coordinate systems.
The fan effects were modeled using the body force propeller method, which is part of the Star CCM+ virtual disk model. The fluid dynamic forces on the virtual disk resulting from fluid interaction were represented using the Wageningen B-series [28] propeller performance curves, as shown in Table 3. Table 3 shows the data imported to Star CCM+, which matches the non-dimensional advance ratio (J) thrust (Kt), torque (Kq), and efficiency (Eta) as properties with their respective columns.

3.2. Mesh Sensitivity Study

The internal volume of the server was extracted using the surface wrapper feature of Star CCM+. The volume of interest is the volume of the surface wrapper extracted from the self-contained volume of the server. In other words, all outer surfaces of the internal parts of the server were surface wrapped to form a volume within the server. The method was used to create seed points placed at two defined locations within the server and extract the volume. A surface mesh wrapper was used concurrently with trimmer volume meshes (hexahedral mesh with a minimal cell skewness angle close to zero to target orthogonal meshes around concave cells). The prism layer with a total thickness of 1 × 10⁻⁴ m from the surface and seven inflation layers, produces near-wall cells of y + = 5 the values used. The subsequent objective was to determine the optimal mesh grid size that would prevent a significant decrease in the model’s accuracy resulting from the discretization of the computational domain [29]. Therefore, a grid convergence index (GCI) was used to evaluate the discretization error of the computational meshes to ensure the accuracy and convergence of the numerical solutions [30]. The Richardson extrapolation method was used in the analysis, and cell size was used to obtain the minimal refinement ratio. A refinement ratio r = G _ c o u r s e G _ f i n e of 1.34 is proposed by Celik et al. [28] for lowering grid sizes [31,32,33].
G C I fine   = 1.25 | ε | r p 1
ε = f 2 f 1 / f 1
where is r the refinement ratio between two successive grids, and N cells is the number of grid elements.
The GCI values were calculated using different mesh sizes to test the mesh convergence. The outlet pressure from the far field was used. The initial boundary condition at the outflow was set to a zero-gauge pressure.
A three-grid investigation of grid convergence was used in this study, and the base sizes selected from which the mesh cells were generated were f_1, f_3, and f_5, as listed in Table 4. The outlet pressure is represented by phi and its extrapolated value is extrapolated by phi. Where r is the refinement ratio between two successive grids, and N cells is the number of grid elements. The grid convergence index (GCI) is a percentage, and the asymptotic GCI indicates its asymptotic value. When its value was approximately unity, it denoted a grid-independent solution. p indicates the order attained during the simulation.
The pyGCS code result output is shown in Figure 8 as follows from pyGCS import GCS#, creating a grid convergence study object based on a representative grid size gcs = GCS (dimension = 3, simulation order = 2, grid size = [3, 4, 5.5], cells = [1,989,244, 1,799,871, 1,220,578], solution= [2.094528, 2.106948, 2.253675]) # output information to Markdown-formatted table gcs.print table (output type = ‘markdown’, output path = ‘.’).
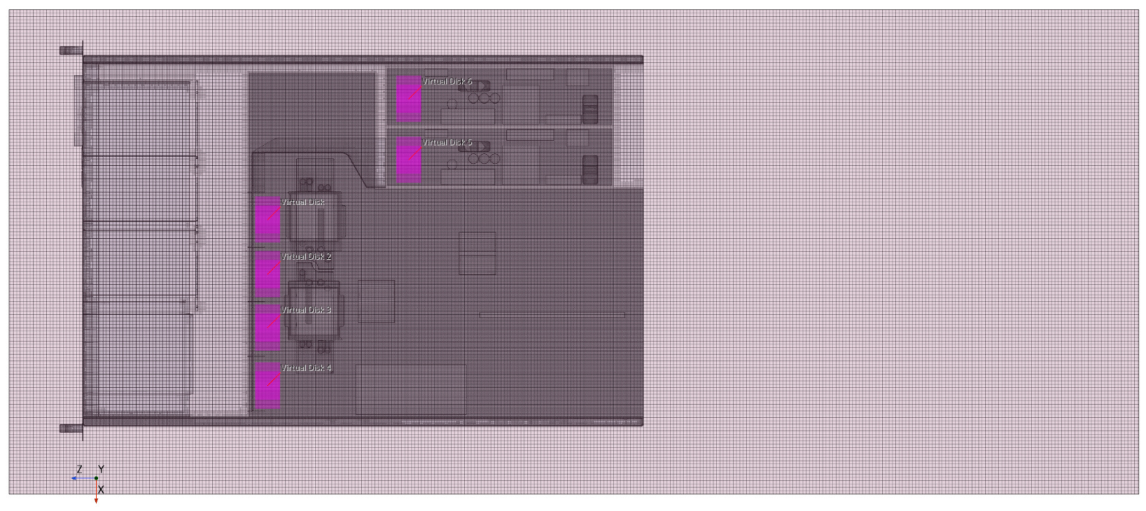
The optimal convergence of the GCI asymptotic value is 1.006, which is close to unity, as recommended by Celik et al. [31]. This convergence translates to a grid size selection, where the outlet pressure (phi) was 2.107 Pa. It converged towards an initial boundary conduction with a gauge pressure of 0 Pa at the outlet. Therefore, the number of cells at this convergence was 1,799,871, see Figure 9. The refinement ratio, r, between the grid base sizes, is 1.4 over a course grid with 1,220,578 and the finest at 1,989,244, generally with more cells [25].

3.3. Model Validation

Computational fluid dynamics models can be experimentally validated by comparing the CFD model under the same conditions as the existing experimental results [3]. The heat flux used for all the heat-generating components was based on the thermal design power of the actual server. Visual disk fans were used for this model, and an actual server fan curve was used to define the operation of these fans. The fans were kept at 6800 rpm while varying the discharge-back pressure. The following experimental boundary conditions and component thermal design power heat dissipation rates were simulated to validate the CFD model:

3.3.1. Boundary Conditions

The following boundary conditions are based on the actual experimental data.
The server initial cold aisle inlet temperature
T _ i n l e t   ( x , 0 ) = 20     ° C
The server discharge pressure
P d i s c h a r g e x = ( 20   p a   t o   20   p a )

3.3.2. Model Validation Results

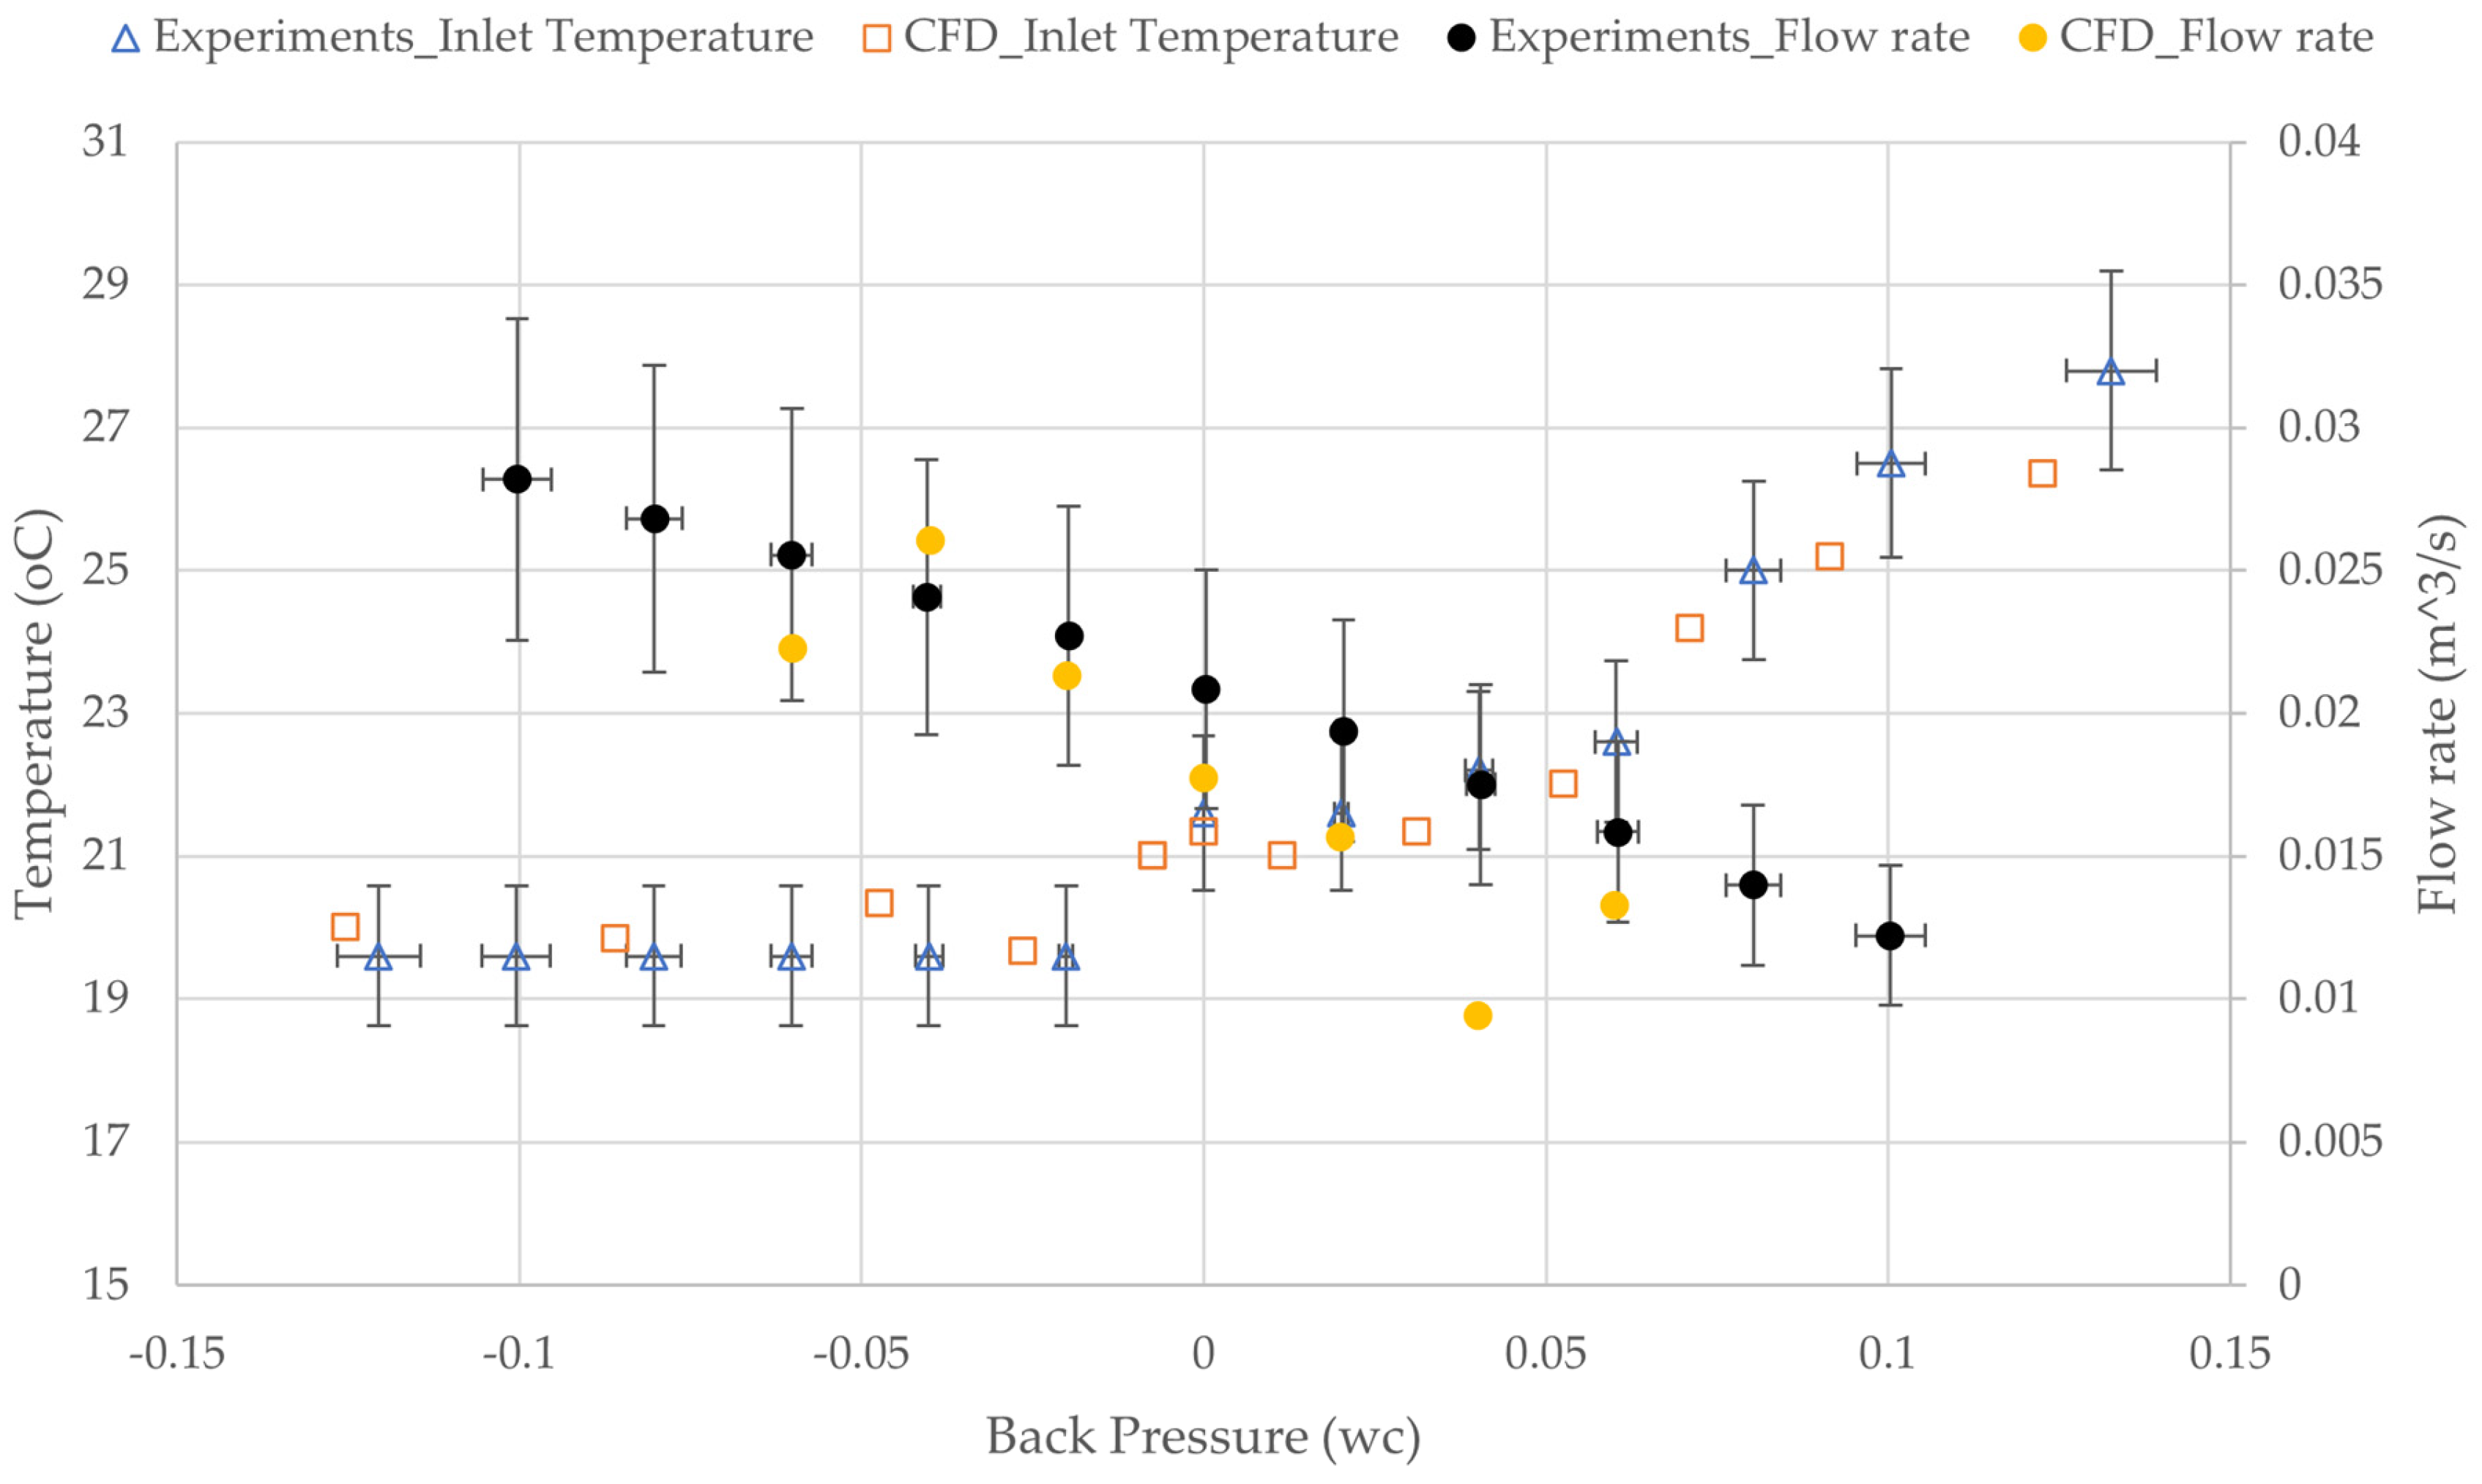
Figure 10 shows the impact of varying server back pressure on the IPMI inlet air temperature experimental results from Khalili et al. [10], experimental study on the impact of internal design on the efficiency of IT equipment in a hot aisle containment system and the CFD inlet air temperature results under the same experimental conditions, where the fan set speed was maintained constant at different back-pressure magnitudes. The initial server supply air inlet temperature for both the experimental and CFD simulations are approximately 20 °C, between −0.15 and 0.02-inches of wc back pressure. The CFD results have an error of under 5%. An additional validation of the numerical model was conducted for the static pressure across the chassis (inlet baffle) of the server in relation to the airflow rate through it. The numerical model showed a discrepancy within 15% of the experimental results. This deviation is attributed to the flow impedance being proportional to the square of the flow stream, requiring the surface resistance of the chassis model to be highly accurate. It is postulated that the accuracy of the virtual disk is conditional to the precision of the fitting curve, the mesh density, and the numerical efficiency of the solver.
The supply air inlet temperature starts increasing at the free delivery pressure, which signifies insufficient static fan set pressure or high system impedance. From the free delivery back pressure, there is an evident proportionality relationship between the back pressure and the inlet supply air temperature. The IPMI inlet server supply air temperature was used to validate the CFD model against the experimental results. Based on the results, there is an average of 3% difference for each data point between the experimental data and CFD model results under similar environmental and operational conditions. The differences can be attributed to sensor inaccuracies, material properties (fluid flow and thermal), and heat dissipation values. Based on the CFD model validation results, the server back pressure is directly proportional to the server inlet temperature. This phenomenon was also evident in the study by Khalili et al. [10], who noted the increase of inlet temperature, when the back pressure is increased.

3.4. Solver and Numerical Parameters

More implicitness was achieved by considering the resistance coupling factors from the semi-implicit method for the pressure-linked equation (SIMPLE) algorithm and the coupled algorithm for pressure-velocity coupling. A converged and temporarily stable time step was used in the simulations. To accurately describe the temporal and spatial dynamics, a time-step size of ∆t = 1.0 × 10⁻⁴ and a typical cell size of approximately ∆x ≈ 4 mm were used. A computer cluster with four (virtual) nodes, each with 24 cores running 24 Message Passing Interface (MPI) processes for a total of 192-way parallel, ran each converged model at a Central Processing Unit (CPU) time of 133,260.91 s. The MPI protocol significantly reduces the time spent on communication between computing nodes in distributed memory architectures, thereby enhancing the overall computational efficiency of the system [34]. The time step, ∆t, was increased to 1 s to reach 60 s after the model was run for 5 s for residuals to stabilize.

4. Results and Discussion

4.1. Pressure in the System

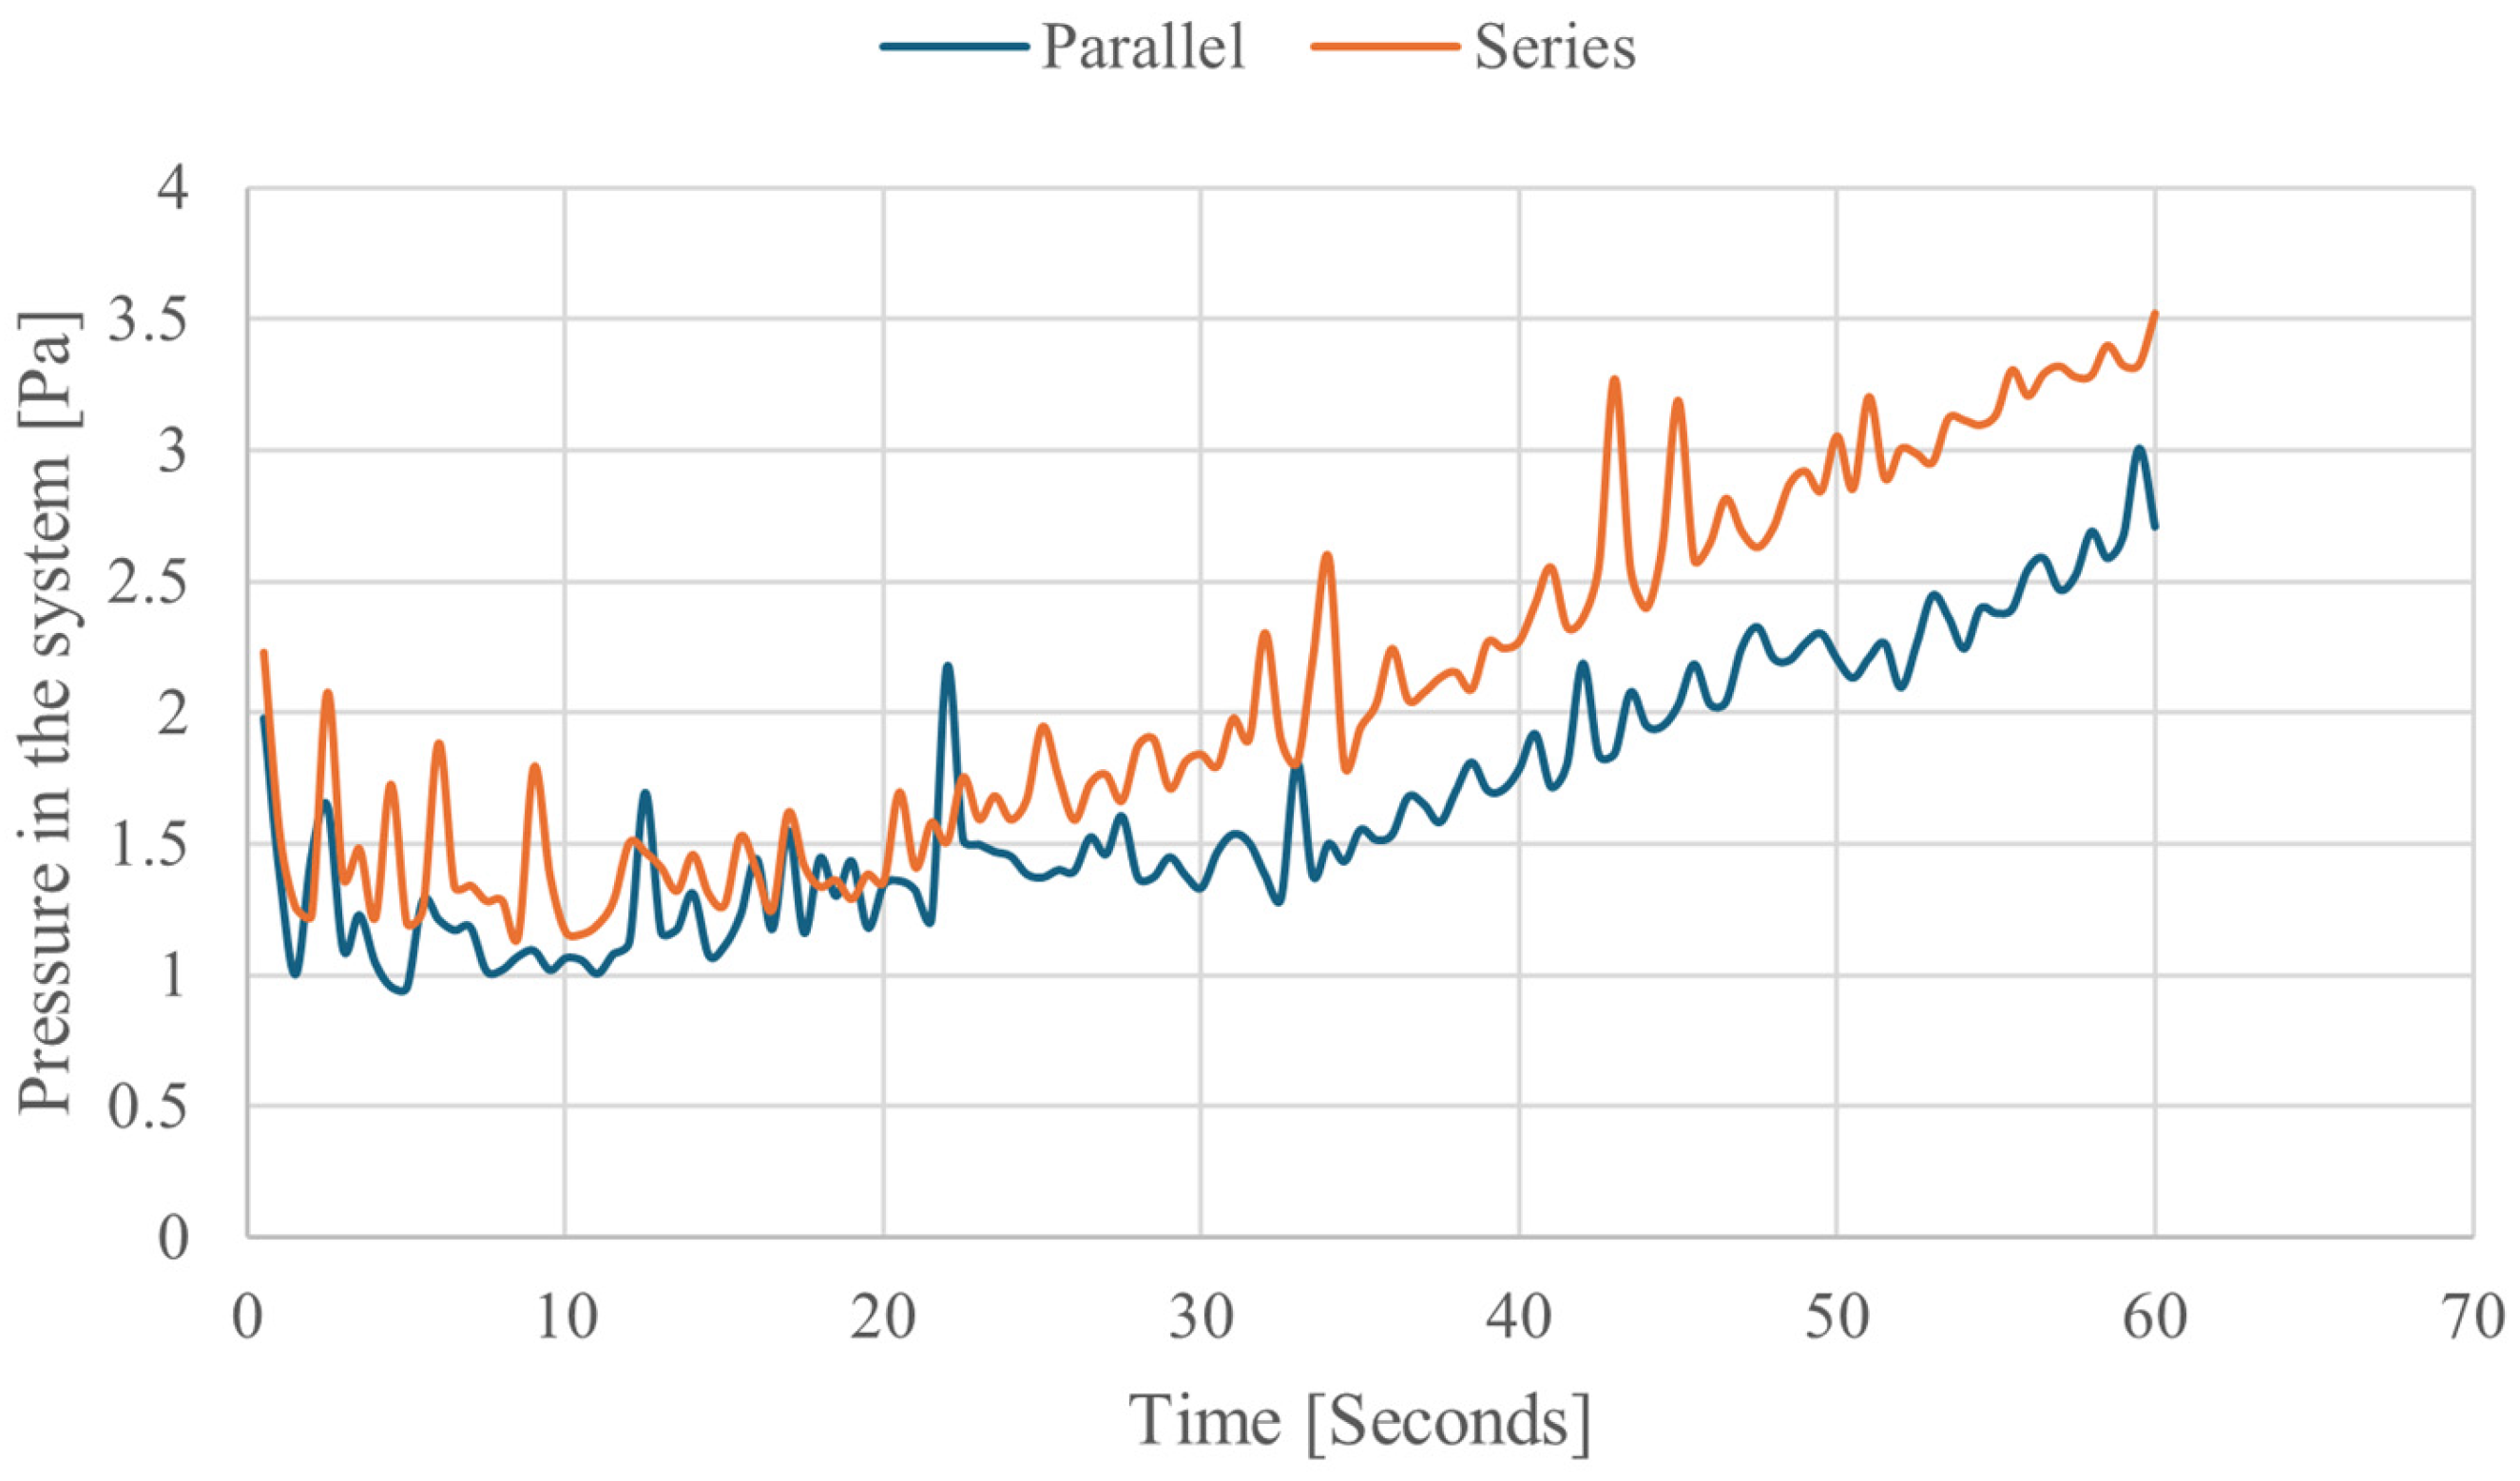
As shown in Figure 11, the server fans were reconfigured to a series arrangement with four additional server fans added behind the original server fans, but the overall server configuration remained unchanged. All the openings, internal compartments, boundary conditions, and fan-set speed remained unchanged. As shown in Figure 11, the results showed an increased system available pressure when the system was running against a 10 Pa hot aisle back pressure. Based on the proportionality between the fan static pressure and the airflow rate through the system, the supply inlet temperature is expected to decrease. The noticeable working point of the two systems is that after 22 s the fans in parallel provide a reduced pressure in the system. The increase in system pressure is expected to lower hot air recirculation at a back pressure of 10 Pa in comparison to the parallel-configuration fan set.
Figure 12 shows the system’s available pressure at free delivery pressure (0 Pa back pressure). The series configuration consumes significant power with no significant improvement in air distribution. It provides no further noticeable contribution to the system after 41 s. These results also reveal that the series fan configuration is not ideal for servers that run on a low IT load (computation workload), which is prevalent in cloud computation servers.
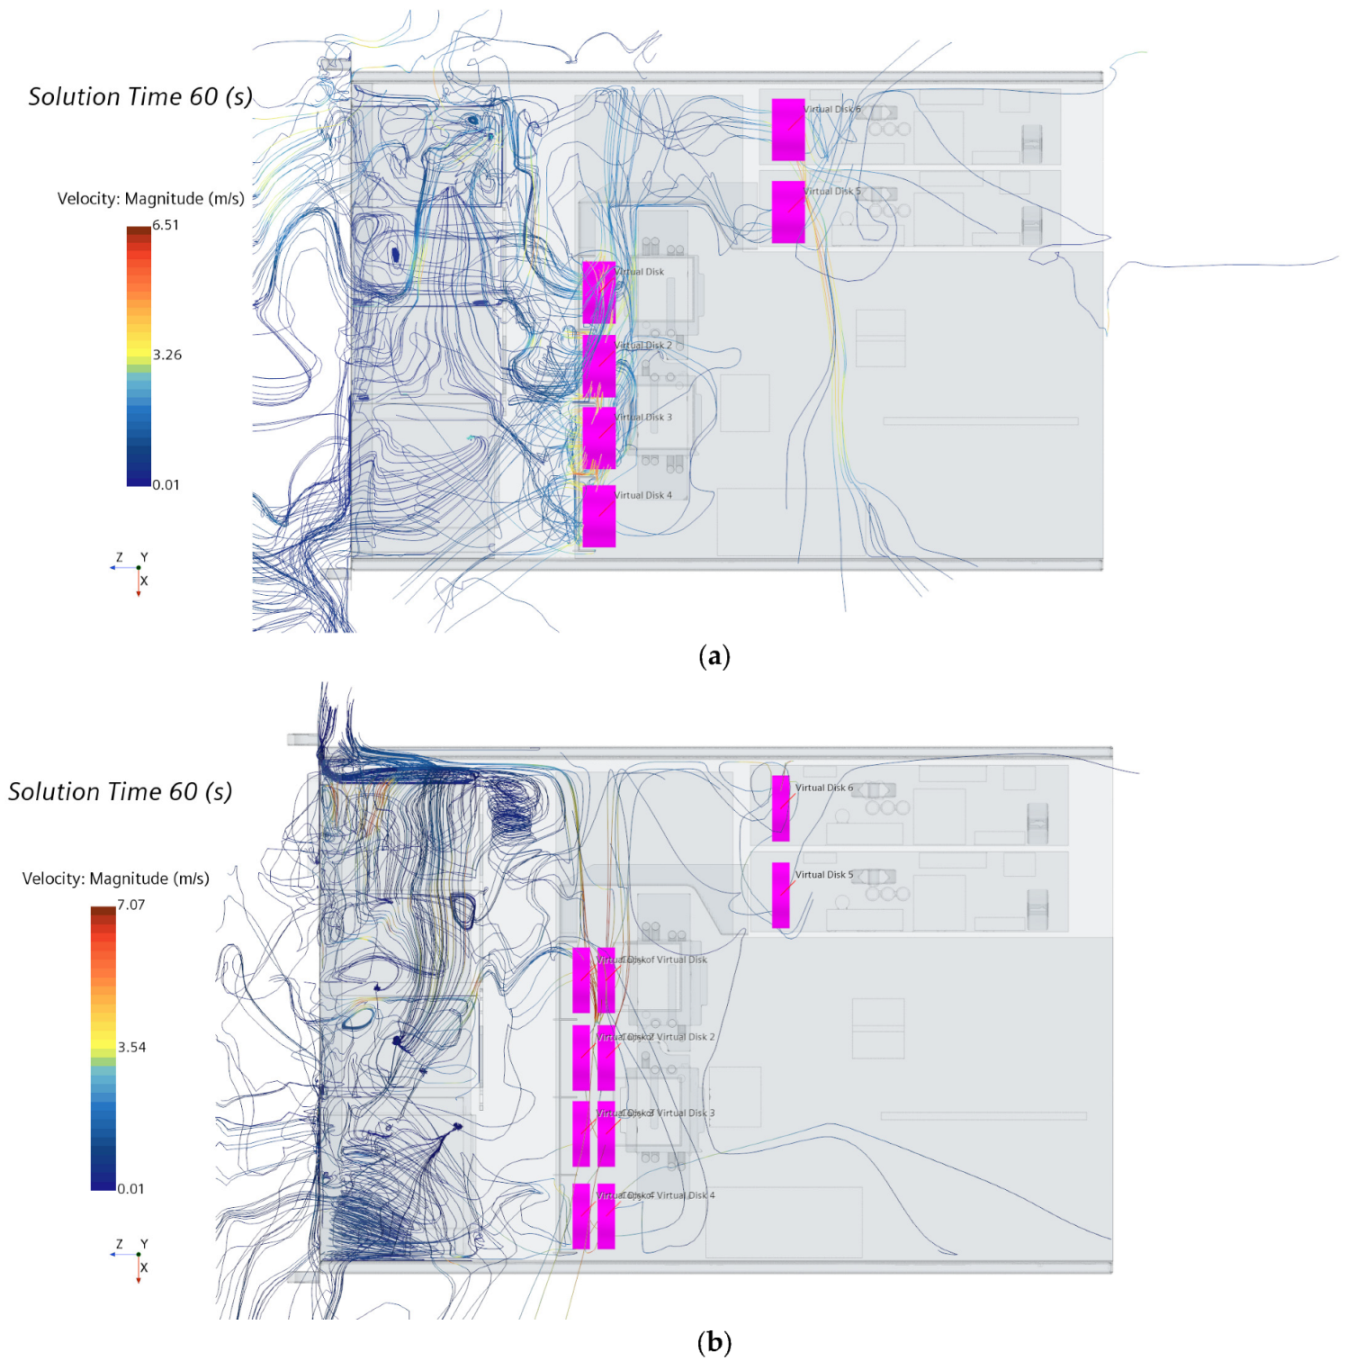
Figure 13a,b shows the velocity streamlines at the 0 Pa back pressure. As shown in Figure 13a, the parallel fan configuration possesses a uniform intake flow resulting from a low system impedance and there is also poor airflow uniformity in the discharge region of the fans, which signifies hot recirculation and insufficient static fan pressure. A similar phenomenon is evident from the series fan configuration velocity streamline results shown in Figure 13b. Although the series fan arrangement improves the system’s available head pressure, it does not improve the cold air intake distribution. Air is predominately drawn through the far-right corner of the server intake section, which leaves a dead zone next to the hard drive (SAS). Both configurations showed airflow recirculation under free-delivery pressure conditions.
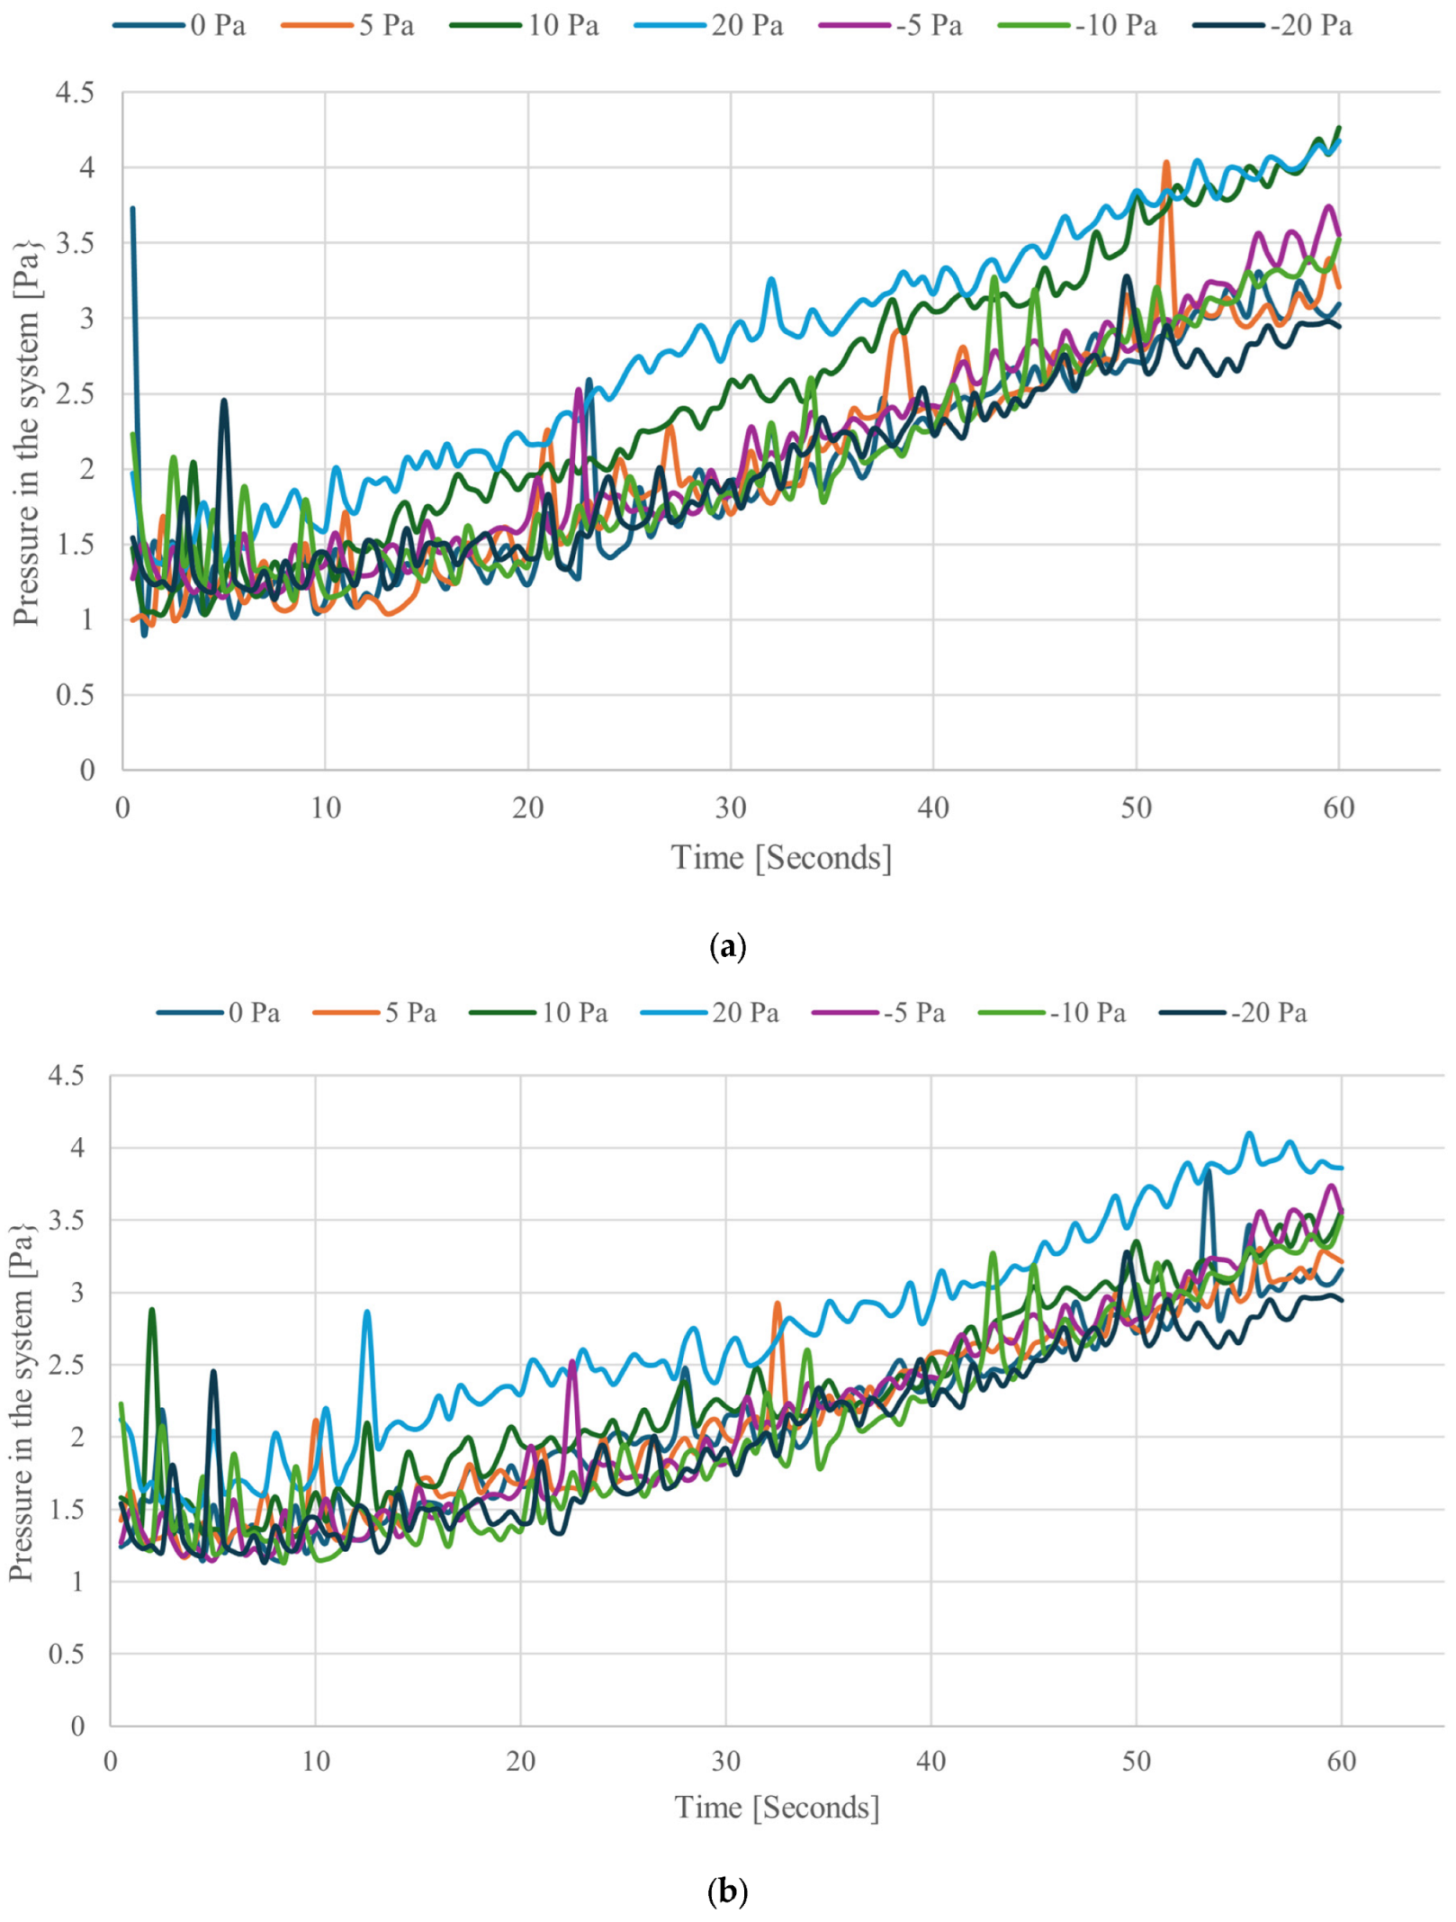
Figure 14a,b show the system pressure against time for the simulated series and parallel fan configurations operating at −10 Pa to 20 Pa back pressure and a constant fan speed of 6800 rpm. A significant system pressure improvement was evident for the series configuration under 20 Pa and 10 Pa back-pressure conditions. In both configurations, the −10 Pa to 5 Pa back-pressure conditions exhibited similar system trends. However, the results from the parallel fan configuration server show different behaviors. The available pressure head of the system increased with the back pressure. Contrary to common knowledge, high back pressure decreases the available system pressure.

4.2. Inlet Air Temperature

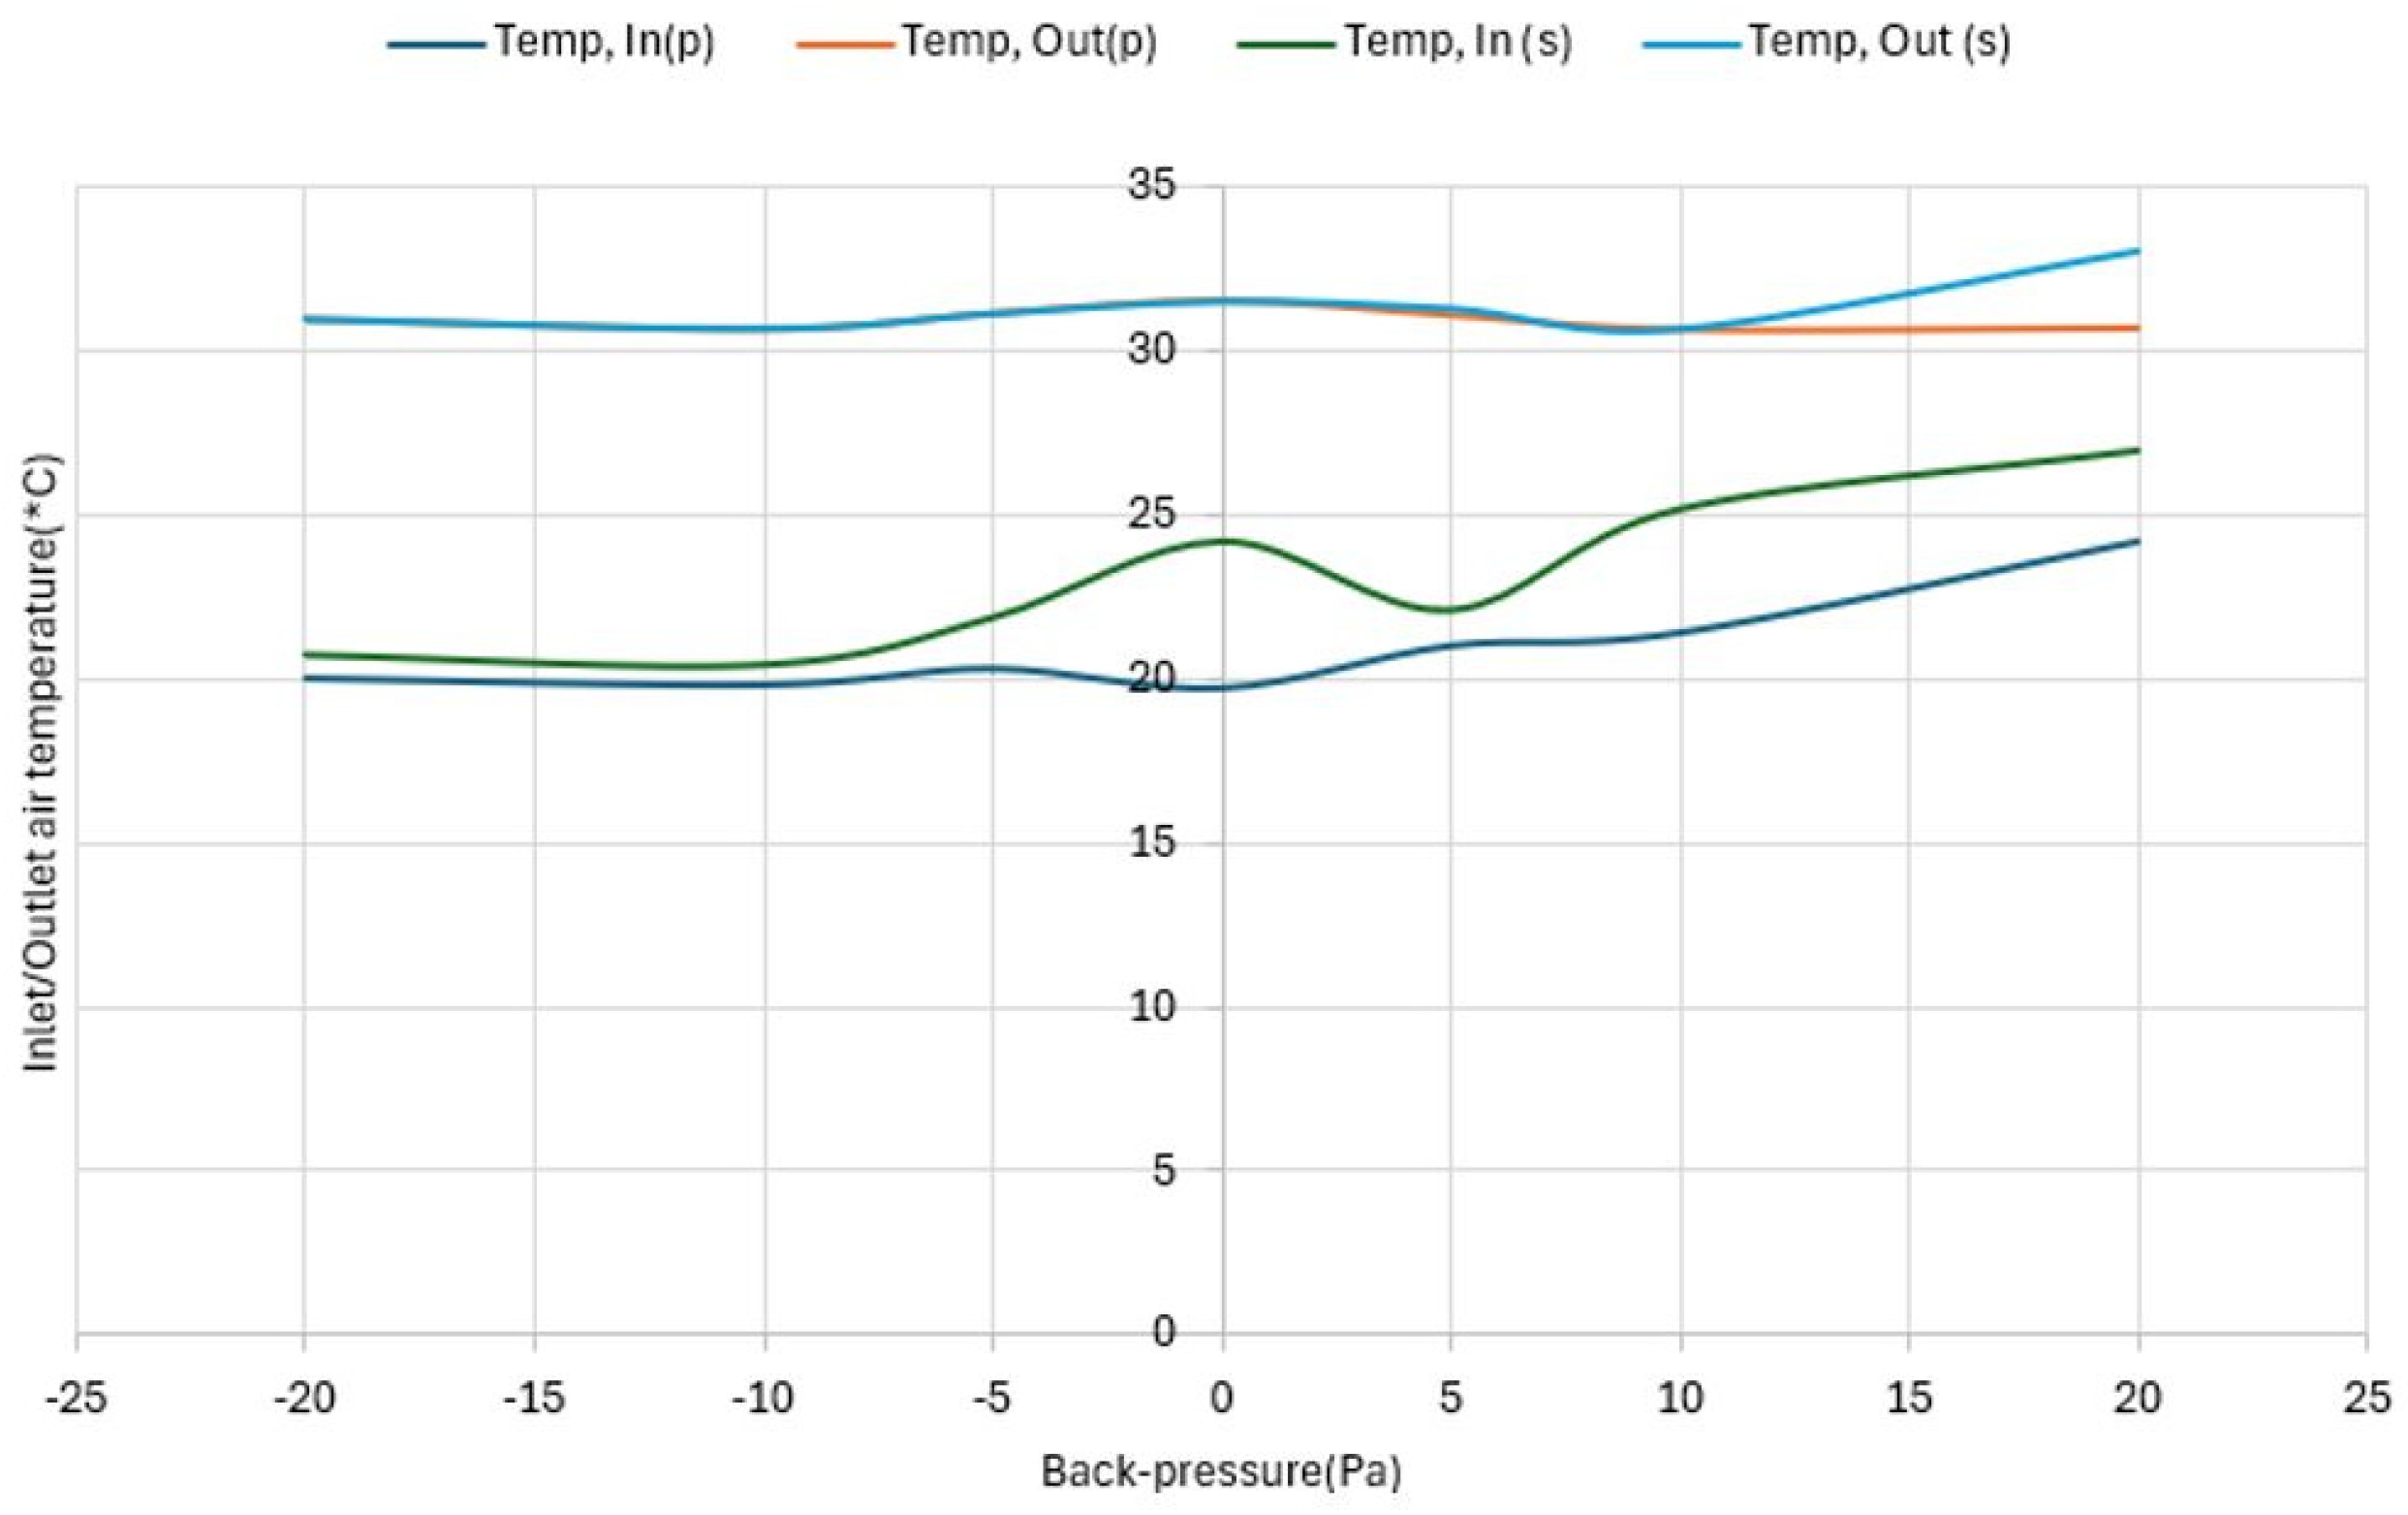
The server inlet air temperature is a good indicator of hotspots within the server. The temperature must remain within the allowable range of the server, as recommended by ASHRAE. The initial boundary condition for the server was 20 °C, and it was operated with a series of fan arrangements. The series fan system server experienced higher inlet air temperature and lower air change in temperature, when compared to the parallel fan system server, as shown in Figure 15 and Table 5. This symbolizes an increase in hot air recirculation and poor cooling effectiveness even though there is an evident increase in system available pressure. The series fan system server experiences a 19% increase in inlet air temperature, which is way higher than the rest of the data points. This increase reaches the same level as the parallel fan system server at the inlet temperature at 20 °C.

4.3. Airflow Distribution: Fan Configuration

The server cooling fans were designed to produce sufficient static pressure to overcome the pressure drop across the server unit. The cooling fans ramped up and down in response to the temperature changes of the server CPU, RAM, SAS, and other thermal components. The server airflow is a function of the fan-set static pressure. Consequently, an increase in system impedance decreases the airflow across the server. A parallel fan system is commonly used in conventional server units, where a set of server fans and other server components are optimized as a system. The design approach does not consider the server discharge pressure condition, which affects the server airflow and the overall cooling performance. The ideal parallel server fan set provides a high airflow at a low system impedance, whereas the series configuration provides a low airflow with a high static pressure. A higher static pressure is required to overcome the resistance of the system, which includes the back pressure. It was established that a positive net system pressure does not necessarily result in the elimination of hot-air recirculation. Figure 15 shows a positive system pressure, but the server inlet supply temperature continued to increase with an increase in the back pressure.

5. Conclusions

A detailed computational fluid dynamics model for the Dell 2950 2U server was built, calibrated, and validated using the existing experimental test results. Furthermore, the model was used to evaluate the formation of the hot-air recirculation phenomenon at the server level and the methods to eliminate it. The server fan system was reconfigured to a series fan arrangement by adding four more server fans in the series to the original fan system. The following conclusions were drawn:
  • The server-supply inlet temperature was used to validate the CFD model based on the experimental results. Based on the results, there was an average of 3% between the experimental data and CFD model results under similar environmental and operational conditions. This study represents a significant advancement towards real-life modeling of complex configurations.
  • The use of a compact fan (virtual disk model) to simulate the fans did not affect the accuracy of the simulation results. The model was validated against experimental results, with results within a 3% accuracy. Utilization of this feature shortens the computation time.
  • Increasing the server fan head does not address the issue of hot air recirculation in the server, which aggravates the situation. The server inlet air temperature increased by an average of ~5% from −20 Pa to −5 Pa back pressure, and by 19% at the free delivery point (0 Pa). The inlet air temperature was further increased by 10% at back pressures of 5–20 Pa. The outlet air temperature decreased by 1%, signifying poor cooling effectiveness owing to high static pressure.
  • This also highlights the importance of correctly sizing the server fans, which can significantly impact the overall server thermal performance, even under low-load conditions. It was established that a positive net system pressure does not necessarily result in the elimination of hot-air recirculation. Server fan sizing or fan set configuration should be dictated by the required server component temperature, i.e., CPU.
  • The current work serves as a base for integrating liquid and air-cooling systems to form hybrid cooling systems for high-density racks in legacy data centers, where in-row CDU(L2A) is used in conjunction with CRAH/CRAC as the cooling source. Future work in this area can include rearranging the high thermal components and placing them down towards the discharge section of the server. Different types of cooling fluids should be considered to cool the components.

Author Contributions

Conceptualization, N.B.M. and T.J.K.; methodology, N.B.M.; software, validation, N.B.M.; formal analysis, T.J.K.; investigation, N.B.M.; resources, T.J.K.; data curation, N.B.M.; writing—original draft preparation, N.B.M.; writing—review and editing, T.J.K.; visualization, supervision, T.J.K.; project administration, T.J.K. All authors have read and agreed to the published version of the manuscript.

Funding

This research received no external funding.

Informed Consent Statement

Not applicable.

Data Availability Statement

The raw data supporting the conclusions of this article will be made available by the authors on request.

Acknowledgments

The authors acknowledge the help of the Mechanical and Industrial Engineering Technology Department of the University of Johannesburg. Special acknowledgment is directed towards the Center for High-Performance Computing (CHPC) for using a cluster supercomputer called Lengau.

Conflicts of Interest

The authors declare no conflicts of interest.

Nomenclature

CPUCentral Processing Unit
CRAHComputer Room Air Handler
CRACComputer Room Air Conditioning
CHPCCenter for High-Performance Computing
CDUCoolant Distribution Unit
L2ALiquid to Air
ITInformation Technology
ITEInformation Technology Equipment
CFDComputational Fluid Dynamics
3DThree Dimensional
QFlowrate
RAMRandom-Access Memory
SASSerial Attached SCSI
STPStandard for Exchange of Product
CADComputer Aided Design
TDPThermal Design Power
LESLarge-Eddy Simulation
ρ Density
u Filtered Velocity
μMolecular Viscosity
τStress Tensor
p Filtered Pressure
μ t Eddy Viscosity
C S Smagorinsky Constant
JAdvance Ratio
KtThrust
KqTorque
GCIGrid Convergence Index
tTimestep
xGrid size
RpmRevolution Per Minute
Inch wcInches Water Column
EADMExtended Actuator Disk Model
REEADMReverse-Engineered Empirical Actuator Disk Model
IPMI IATIntelligent Platform Management Interface inlet air temperature

References

  1. Azari, R.; Rashed-Ali, H. Research Methods in Building Science and Technology; Springer Nature: Cham, Switzerland, 2021. [Google Scholar] [CrossRef]
  2. Wu, C.; Buyya, R. Cloud Data Centers and Cost Modeling: A Complete Guide to Planning, Designing and Building a Cloud Data Center, 1st ed.; Morgan Kaufmann Publishers Inc.: San Francisco, CA, USA, 2015. [Google Scholar]
  3. Alkharabsheh, S.A.; Sammakia, B.G.; Shrivastava, S.K. Experimentally Validated Computational Fluid Dynamics Model for a Data Center With Cold Aisle Containment. J. Electron. Packag. 2015, 137, 21010. [Google Scholar] [CrossRef]
  4. Koomey, J.; Berard, S.; Sanchez, M.; Wong, H. Implications of Historical Trends in the Electrical Efficiency of Computing. IEEE Ann. Hist. Comput. 2011, 33, 46–54. [Google Scholar] [CrossRef]
  5. Zhou, R.; Wang, Z.; Bash, C.E.; McReynolds, A. Modeling and Control for Cooling Management of Data Centers with Hot Aisle Containment. In Proceedings of the ASME 2011 International Mechanical Engineering Congress and Exposition, Denver, CO, USA, 11–17 November 2011; pp. 739–746. [Google Scholar] [CrossRef]
  6. Wang, L.; Khan, S.U.; Dayal, J. Thermal aware workload placement with task-temperature profiles in a data center. J. Supercomput. 2012, 61, 780–803. [Google Scholar] [CrossRef]
  7. Capozzoli, A.; Primiceri, G. Cooling systems in data centers: State of art and emerging technologies. Energy Procedia 2015, 83, 484–493. [Google Scholar] [CrossRef]
  8. Khalili, S.; Alissa, H.; Nemati, K.; Seymour, M.; Curtis, R.; Moss, D.; Sammakia, B. Impact of server thermal design on the cooling efficiency: Chassis design. J. Electron. Packag. Trans. ASME 2019, 141, 1–11. [Google Scholar] [CrossRef]
  9. Shah, A.J.; Carey, V.P.; Bash, C.E.; Patel, C.D. Exergy Analysis of Data Center Thermal Management Systems. J. Heat. Transfer 2008, 130, 383–446. [Google Scholar] [CrossRef]
  10. Khalili, S.; Alissa, H.; Nemati, K.; Seymour, M.; Curtis, R.; Moss, D.; Sammakia, B. Impact of Internal Design on the Efficiency of IT Equipment in a Hot Aisle Containment System: An Experimental Study. In Proceedings of the ASME 2018 International Technical Conference and Exhibition on Packaging and Integration of Electronic and Photonic Microsystems, San Francisco, CA, USA, 27–30 August 2018. [Google Scholar] [CrossRef]
  11. Zhao, R.; Du, Y.; Yang, X.; Zhou, Z.; Wang, W.; Yang, X. A critical review on the thermal management of data center for local hotspot elimination. Energy Build. 2023, 1–16, 297. [Google Scholar] [CrossRef]
  12. Kodama, Y.; Itoh, S.; Shimizu, T.; Sekiguchi, S.; Nakamura, H.; Mori, N. Imbalance of CPU temperatures in a blade system and its impact for power consumption of fans. Cluster Comput. 2013, 16, 27–37. [Google Scholar] [CrossRef]
  13. Khalili, S.; Tradat, M.; Sammakia, B.; Alissa, H.; Chen, C. Impact of Fans Location on the Cooling Efficiency of IT Servers. In Proceedings of the 2019 18th IEEE Intersociety Conference on Thermal and Thermomechanical Phenomena in Electronic Systems (ITherm), Las Vegas, NV, USA, 28–31 May 2019; pp. 1266–1274. [Google Scholar] [CrossRef]
  14. Heydari, A.; Gharaibeh, A.; Tradat, M.; Soud, Q.; Manaserh, Y.; Radmard, V.; Eslami, B.; Rodriguez, J.; Sammakia, B. Experimental evaluation of direct-to-chip cold plate liquid cooling for high-heat-density data centers. Appl. Therm. Eng. 2024, 239, 122122. [Google Scholar] [CrossRef]
  15. Wilkinson, M.B.; Louw, F.G.; van der Spuy, S.J.; von Backström, T.W. A Comparison of Actuator Disc Models for Axial Flow Fans in Large Air-Cooled Heat Exchangers. In Proceedings of the ASME Turbo Expo 2016: Turbomachinery Technical Conference and Exposition, Seoul, Republic of Korea, 13–17 June 2016; pp. 1–13. [Google Scholar] [CrossRef]
  16. Kusyumov, A.; Kusyumov, S.; Mikhailov, S.; Romanova, E.; Phayzullin, K.; Lopatin, E.; Barakos, G. Main rotor-body action for virtual blades model. EPJ Web Conf. 2018, 180, 02050. [Google Scholar] [CrossRef]
  17. Barakos, G.N.; Fitzgibbon, T.; Kusyumov, A.N.; Kusyumov, S.A.; Mikhailov, S.A. CFD simulation of helicopter rotor flow based on unsteady actuator disk model. Chin. J. Aeronaut. 2020, 33, 2313–2328. [Google Scholar] [CrossRef]
  18. Chu, W.-X.; Wang, C.-C. A review on airflow management in data centers. Appl. Energy 2019, 240, 84–119. [Google Scholar] [CrossRef]
  19. Pardey, Z.M.; Demetriou, D.W.; Erden, H.S.; VanGilder, J.W.; Khalifa, H.E.; Schmidt, R.R. Proposal for standard compact server model for transient data center simulations. ASHRAE Trans. 2015, 121, 413–421. [Google Scholar]
  20. Vangilder, J.; Vaishnani, Y.; Tian, W.; Condor, M. A Compact Rack Model for Data Center CFD Modeling. In Proceedings of the 2020 19th IEEE Intersociety Conference on Thermal and Thermomechanical Phenomena in Electronic Systems (ITherm), Orlando, FL, USA, 21–23 July 2020; IEEE: Piscataway, NJ, USA, 2020; pp. 350–356. [Google Scholar] [CrossRef]
  21. Vangilder, J.; Healey, C.; Pardey, Z.; Zhang, X. A compact server model for transient data center simulations. ASHRAE Trans. 2013, 119, 358–370. [Google Scholar]
  22. Wang, C. Noise source analysis for two identical small axial-flow fans in series under operating condition. Appl. Acoust. 2018, 129, 13–26. [Google Scholar] [CrossRef]
  23. Roda-Casanova, V.; Sanchez-Marin, F. An adaptive mesh refinement approach for solving non-Hertzian elastic contact problems. Meccanica 2018, 53, 2013–2028. [Google Scholar] [CrossRef]
  24. Korpela, S.A. Principles of Turbomachinery; John Wiley & Sons: New York, NY, USA, 2019. [Google Scholar]
  25. Yang, Z. Large-eddy simulation: Past, present and the future. Chin. J. Aeronaut. 2015, 28, 11–24. [Google Scholar] [CrossRef]
  26. Veloudis, I.; Yang, Z.; McGuirk, J.J. LES of wall-bounded flows using a new subgrid scale model based on energy spectrum dissipation. J. Appl. Mech. Trans. ASME 2008, 75, 0210051–02100511. [Google Scholar] [CrossRef]
  27. Leishman, J.G. Aerodynamics of horizontal axis wind turbines. In Advances in Wind Energy Conversion Technology; Springer: Berlin, Heidelberg, 2011; pp. 1–69. [Google Scholar] [CrossRef]
  28. Helma, S. Surprising Behaviour of the Wageningen B-Screw Series Polynomials. J. Mar. Sci. Eng. 2020, 8, 211. [Google Scholar] [CrossRef]
  29. Ramayee, L.; Supradeepan, K. Grid convergence study on flow past a circular cylinder for beginners. AIP Conf. Proc. 2021, 2317, 030020. [Google Scholar] [CrossRef]
  30. Teschner, T.-R. Grid Convergence Study {pyGCS}. 2021, PyPI: pyGCS 0.2.0. Mar. 10, 2021, PyPI: pyGCS 0.2.0. Available online: https://pypi.org/project/pyGCS/0.2.0/ (accessed on 1 September 2024).
  31. Celik, I.B.; Ghia, U.; Roache, P.J.; Freitas, C.J.; Coleman, H.; Raad, P.E. Procedure for estimation and reporting of uncertainty due to discretization in CFD applications. J. Fluids Eng. Trans. ASME 2008, 130, 0780011–0780014. [Google Scholar] [CrossRef]
  32. Roache, P.J. Persperctive: A method for uniform reporting of grid refinement studies. J. Fluid Eng. 1994, 116, 405–413. [Google Scholar] [CrossRef]
  33. Ahmadi, M.; Ghaderi, A.; Nezhad, H.M.; Kuriqi, A.; Di Francesco, S. Numerical investigation of hydraulics in a vertical slot fishway with upgraded configurations. Water 2021, 13, 2711. [Google Scholar] [CrossRef]
  34. Chetverushkin, B.; Saveliev, A.; Saveliev, V. Kinetic consistent MHD algorithm for incompressible conductive fluids. Comput. Fluids 2023, 255, 105724. [Google Scholar] [CrossRef]
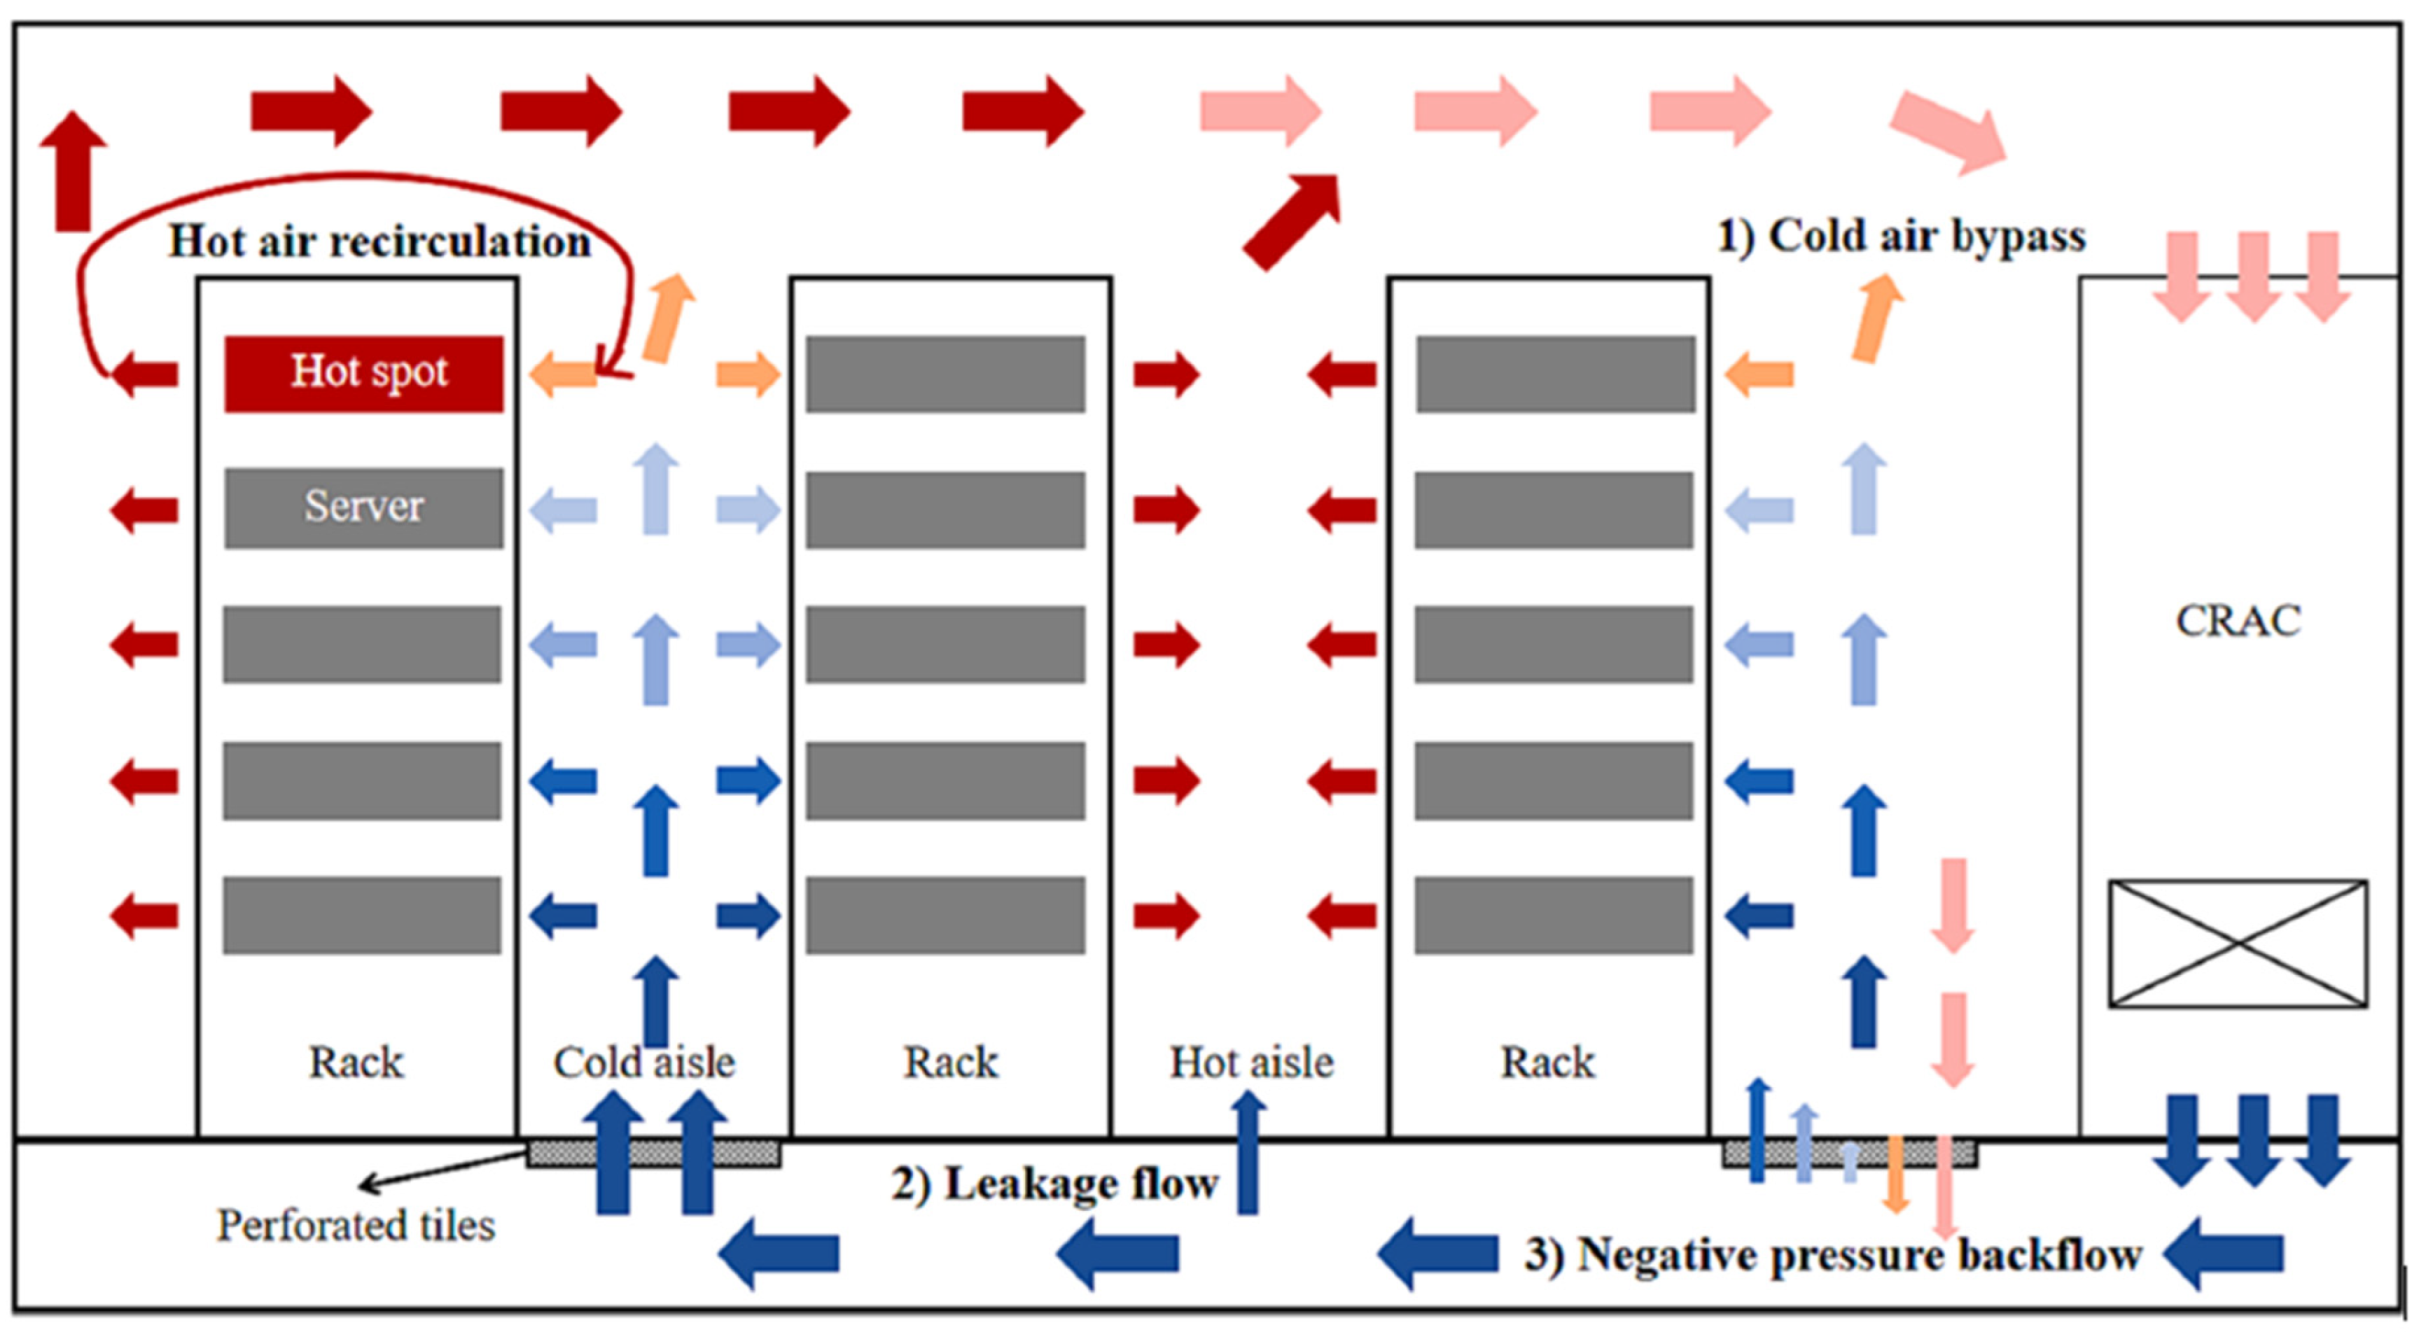
Figure 1. Formation of hotspots in air-cooled data centers; permissions republished with permission from Zhao et al. Elsevier (2023) published a critical review of the thermal management of data centers for local hotspot elimination was published by Elsevier (2023) [11].
Applsci 14 07904 g001
Figure 2. (a) Hardware setup and scanner calibration and (b) pressure-flow distribution curve of series and parallel axial fans. Permissions were republished with permission from Wang C. A noise source analysis of two identical small axial flow fans in series under operating conditions was published by Elsevier (2017) [22].
Applsci 14 07904 g002
Figure 3. Scanning in progress (data quality indicators).
Applsci 14 07904 g003
Figure 4. Meshing and data editing.
Applsci 14 07904 g004
Figure 5. Meshed model.
Applsci 14 07904 g005
Figure 6. (a) Isometric external view of the CAD model (detailed in Autodesk) and (b) isometric internal view without a cover of the CAD model (detailed in Autodesk).
Applsci 14 07904 g006
Figure 7. (a) Local coordinate system for parallel virtual disks and (b) local coordinate system for series virtual disks.
Applsci 14 07904 g007
Figure 8. PyGCS output in a “Markdown format,” indicating the optimal selection of grid 2.
Applsci 14 07904 g008
Figure 9. Hexagonal mesh element of domain at 1,799,871 cells.
Applsci 14 07904 g009
Figure 10. Variation of IPMI IAT for experimental measurements and CFD results against back pressure [10].
Applsci 14 07904 g010
Figure 11. Available system head-pressure comparison between parallel and series fan configuration at 6800 rpm speed and 10 Pa backpressure.
Applsci 14 07904 g011
Figure 12. Available system head-pressure comparison between parallel and series fan configuration at 6800 rpm speed and 0 Pa back pressure.
Applsci 14 07904 g012
Figure 13. (a) Velocity magnitude streamlines comparison between parallel and (b) series fan configurations at 6800 rpm speed and 0 Pa back pressure.
Applsci 14 07904 g013
Figure 14. (a) System pressure for parallel and (b) series fan configuration at 6800 rpm speed and −10 Pa to 20 Pa back pressure.
Applsci 14 07904 g014
Figure 15. Inlet and outlet air temperature comparison between parallel and series fan configurations with variation in back pressure. The server fan system speed is kept at 6800 rpm.
Applsci 14 07904 g015
Table 1. Recommended computer system requirements for running scans.
Operation System HardwareHardware Performance Specification
CPUIntel Core i7-11800H and above
Graphics cardNVIDIA GTX1060 and above
Graphic memory6 GB and above
RAM32 GB and above
USB2.0 and above
Operating systemWindows 10/Windows 11 (both 64-bit only)
Table 2. The main component of thermal design power [10].
ComponentQuantityTDP
[Watt]
Intel Processor-E5345280
DIMM83
Hard drives26
Power supplies283
Table 3. The power flow curve of the fan model.
JKtKqEta
0.010.06140.14960.00019
0.30.04730.13140.013
0.6250.03180.1160.0048
1.55−0.0127−0.0521−0.017
2−0.0343−0.1503−0.03
2.6−0.063−0.2813−0.045
Table 4. Computational grid sensitivity results.
fBase Size
[mm]
Cell Mesh Size
[-]
Outlet Pressure
[Pa]
Fan Thrust
[N]
Error
(Outlet Pressure)
Error
(Fan Thrust)
15.51.220578 × 1062.2541.251 × 10−30.000%0.000%
251.246704 × 1062.1241.231 × 10−35.768%1.599%
34.51.287264 × 1062.1141.223 × 10−30.471%0.650%
441.799871 × 1062.1071.245 × 10−30.331%−1.799%
53.51.962441 × 1062.1301.235 × 10−3−1.092%0.803%
631.989244 × 1062.0951.240 × 10−31.643%−0.405%
Table 5. Series versus parallel fan system configuration impact on inlet and outlet air temperature results.
Back-Pressure PaTemp, Inlet Air °C (Parallel)Temp, Outlet Air °C (Parallel)Temp, Inlet Air °C (Series)Temp, Outlet Air °C (Series)Percentage Difference (IAT)
−202030.9720.730.973%
−1019.830.6820.430.683%
−520.331.1521.8531.147%
019.731.5324.1931.5219%
52131.122.0831.35%
1021.430.6725.1830.6715%
2024.230.7126.9833.0610%
Disclaimer/Publisher’s Note: The statements, opinions and data contained in all publications are solely those of the individual author(s) and contributor(s) and not of MDPI and/or the editor(s). MDPI and/or the editor(s) disclaim responsibility for any injury to people or property resulting from any ideas, methods, instructions or products referred to in the content.