Digital Maturity of Logistics Processes Assessed in the Areas of Technological Support for Performance Measurement, Employees, and Process Management
Abstract
Featured Application
Abstract
1. Introduction
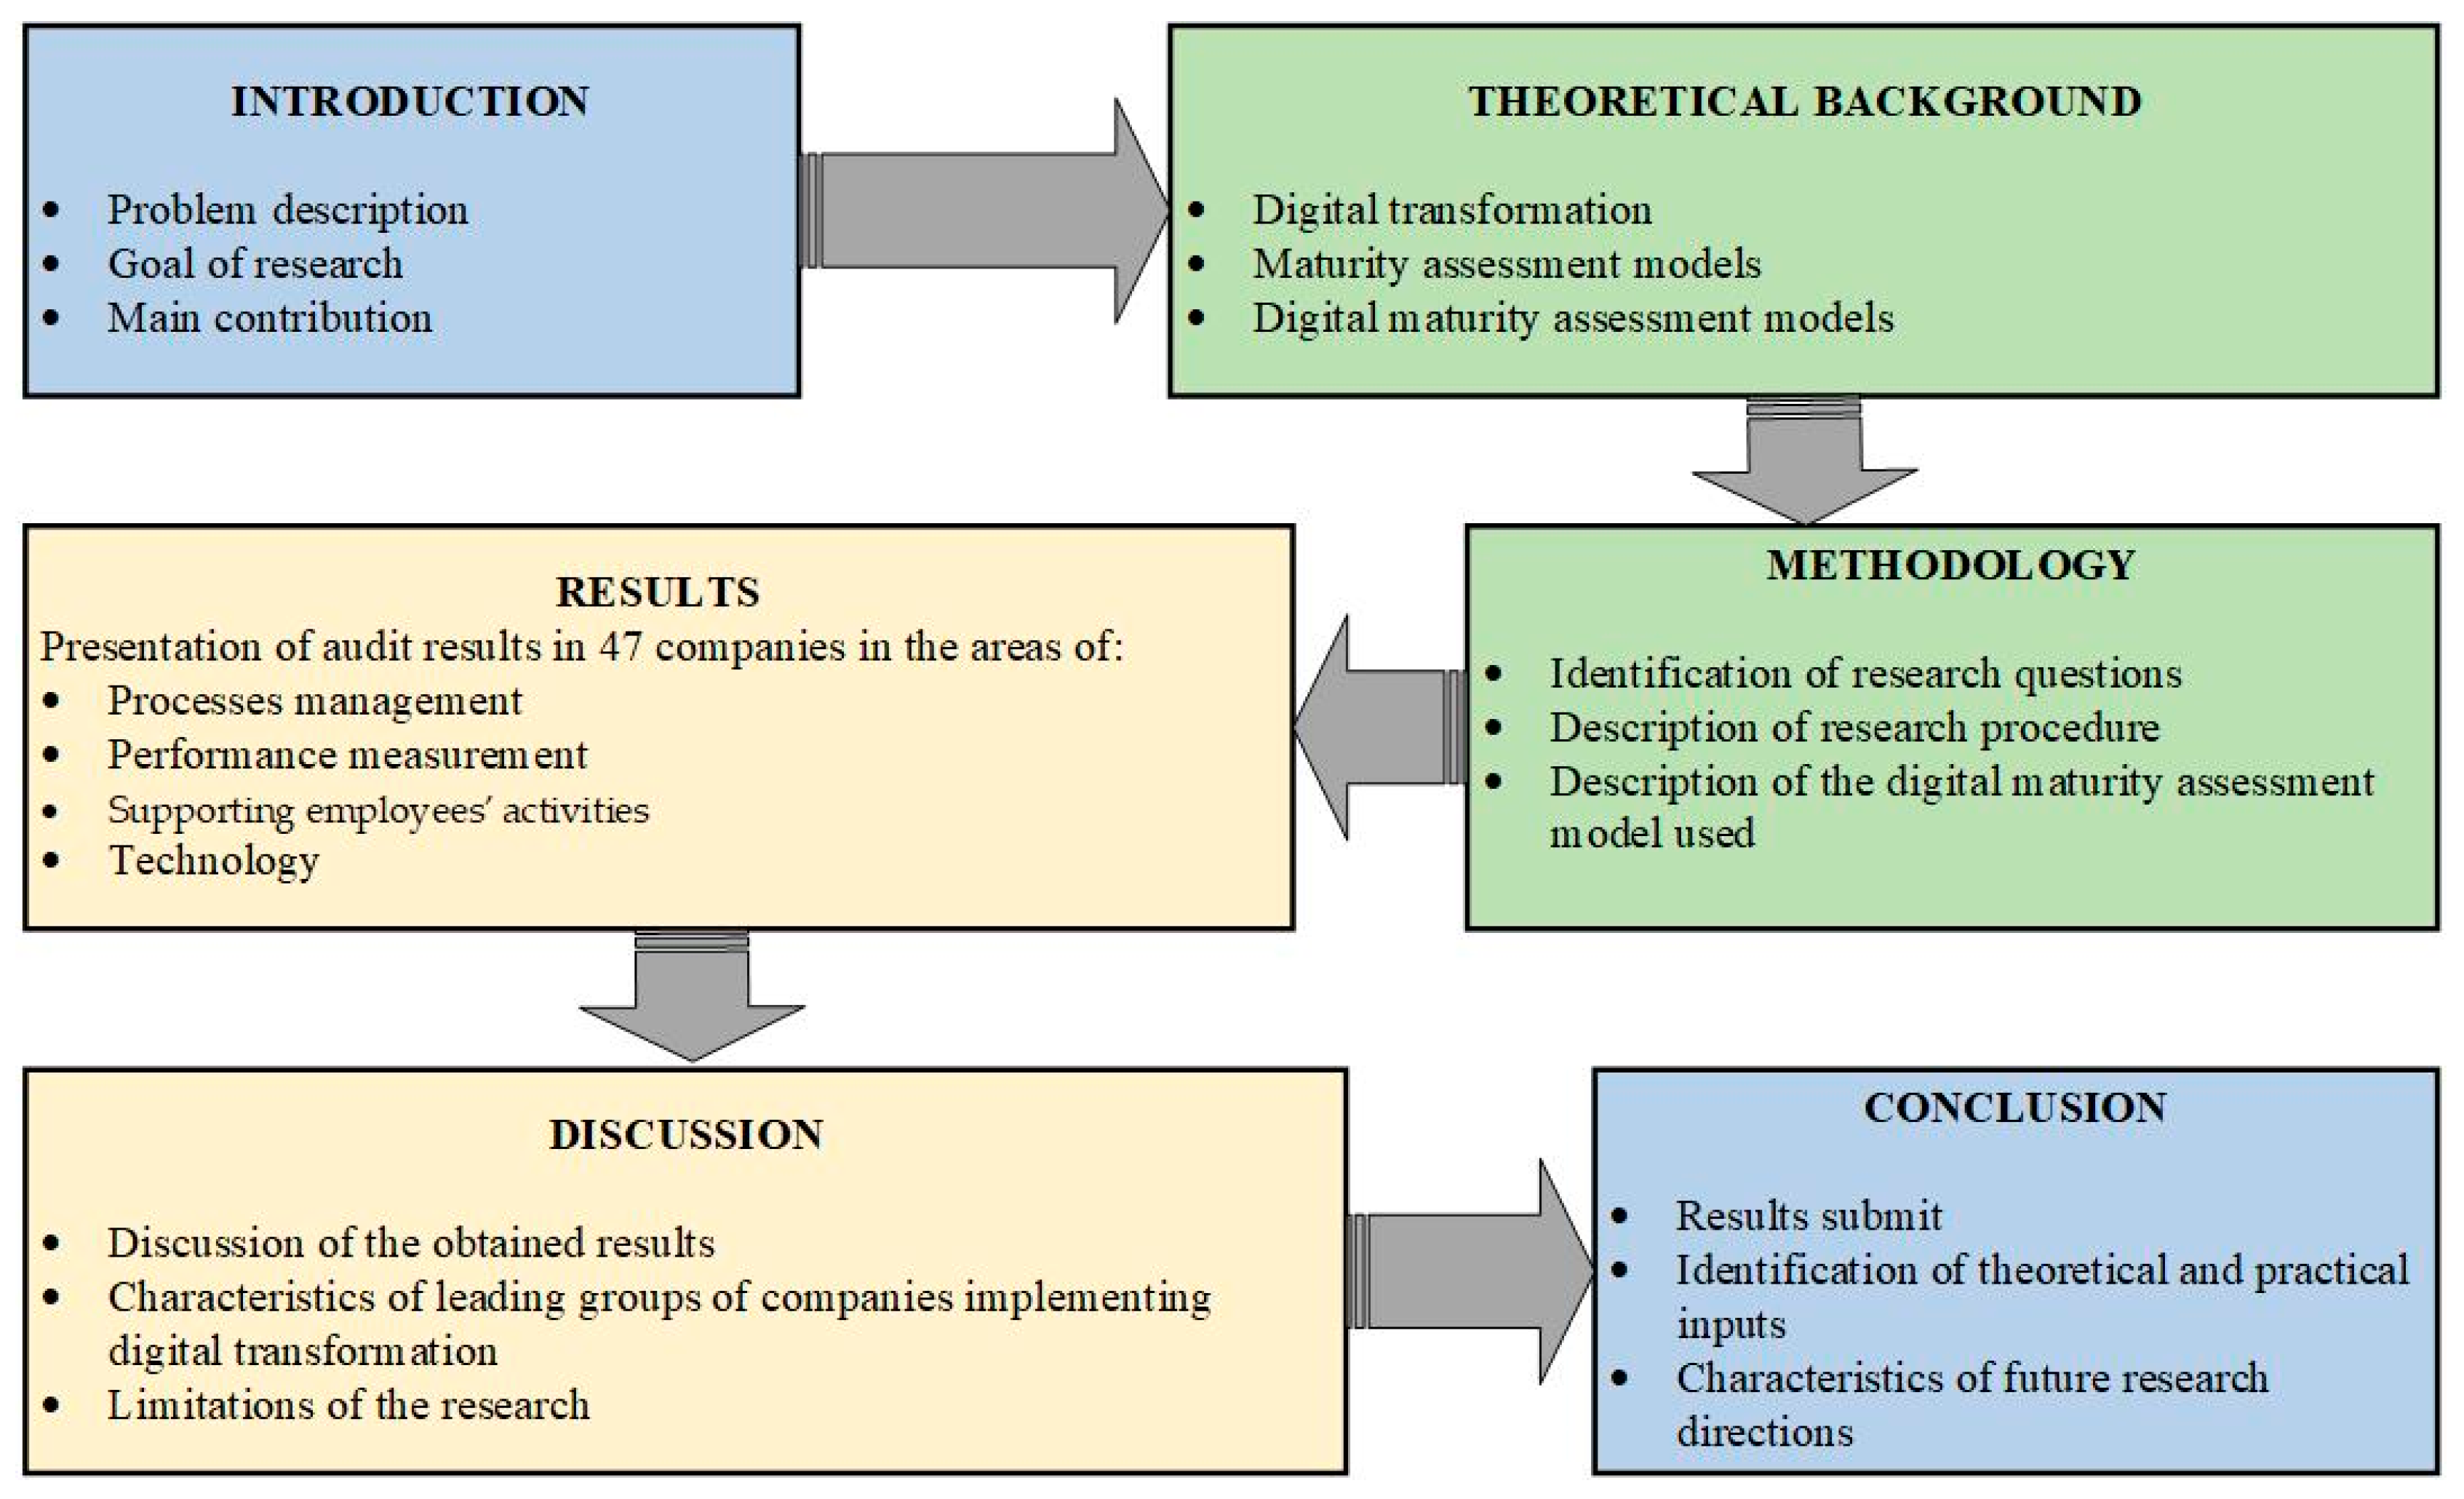
- Identification of the level of digital maturity of logistics processes in performance measurement and process support.
- Cross-analysis of the level of digital maturity of logistics processes, reflecting the diversified level of digital transformation in different types and sizes of companies.
- Identification of the leading areas of digital transformation in the audited companies and identification of the constraints they face related to the implemented Industry 4.0 solutions.
- Identification of the level of implementation of selected technological solutions in Polish enterprises.
- Identifying the leading groups of companies that achieve the highest share of implementation of advanced digital solutions in the area of logistics.
2. Theoretical Background
- Measurement for audit and benchmarking purposes.
- Supporting transformation processes based on the guidelines of successive maturity levels—measuring progress between current and target levels.
- Benchmarking and positioning the company in the market served.
- Understanding the strengths and weaknesses of the enterprise and the opportunities arising from a given development trend.
3. Methodology
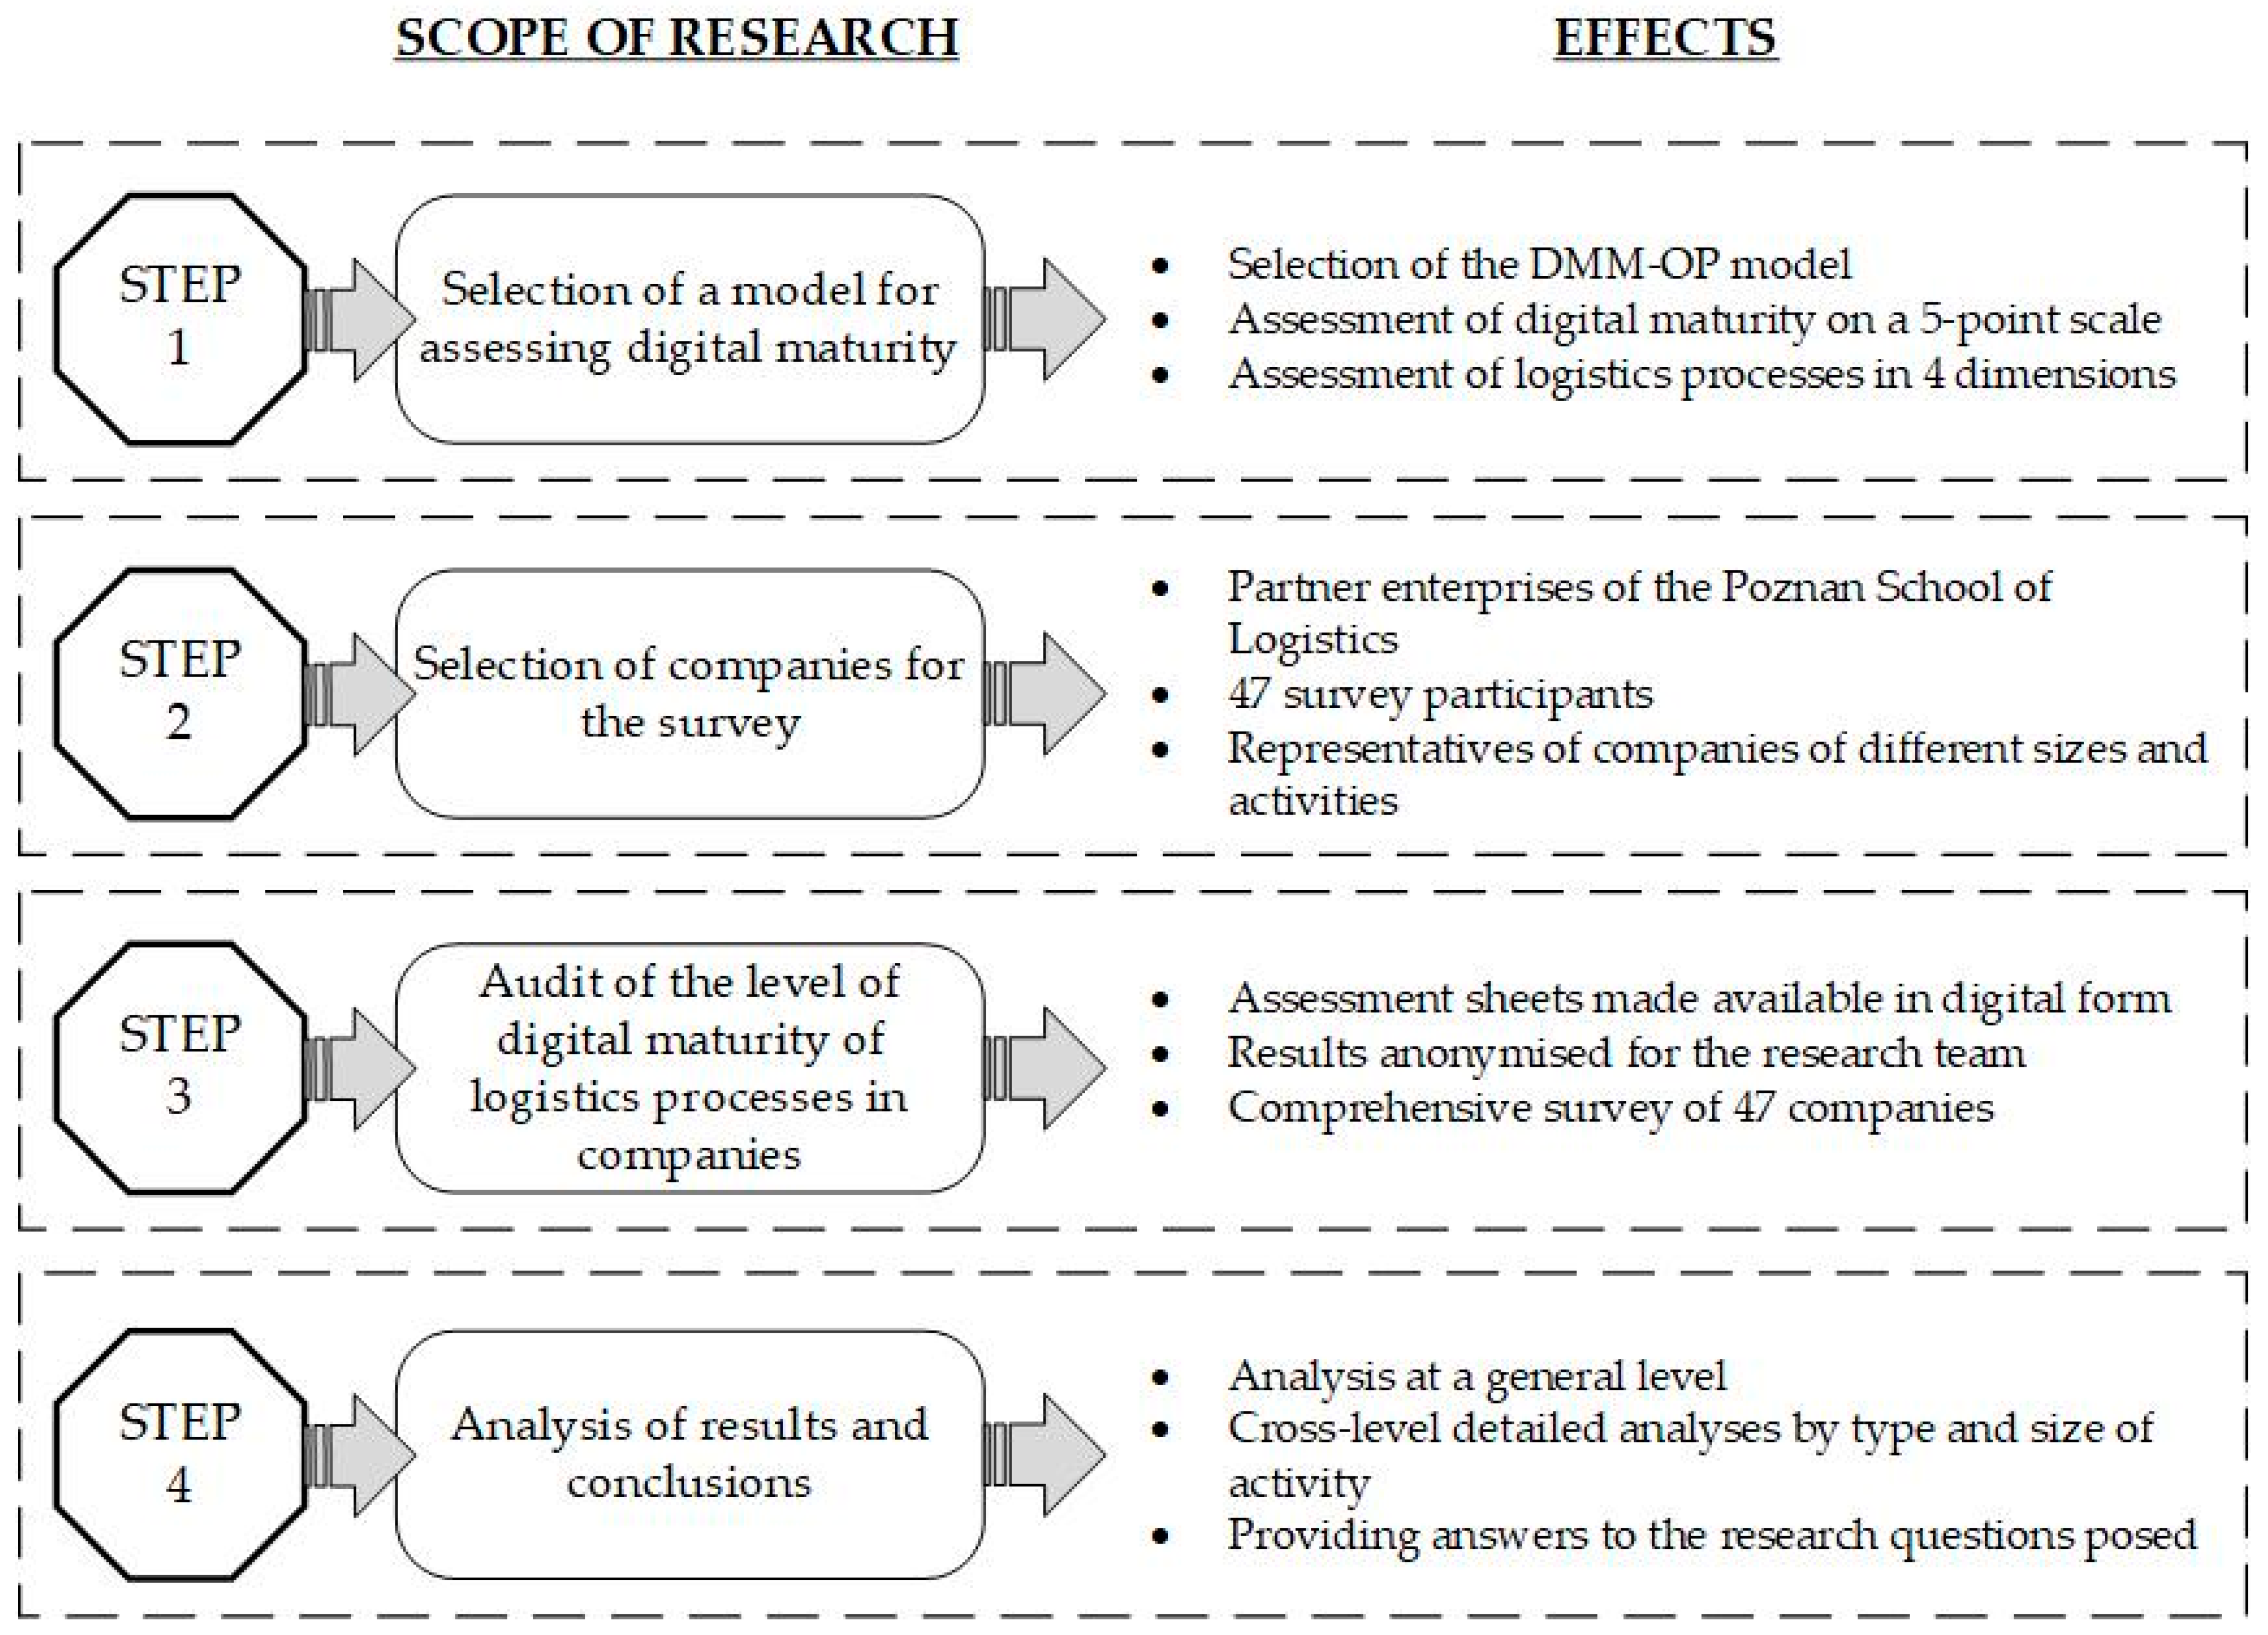
- Q1: How does digital transformation support managing logistics processes in companies?
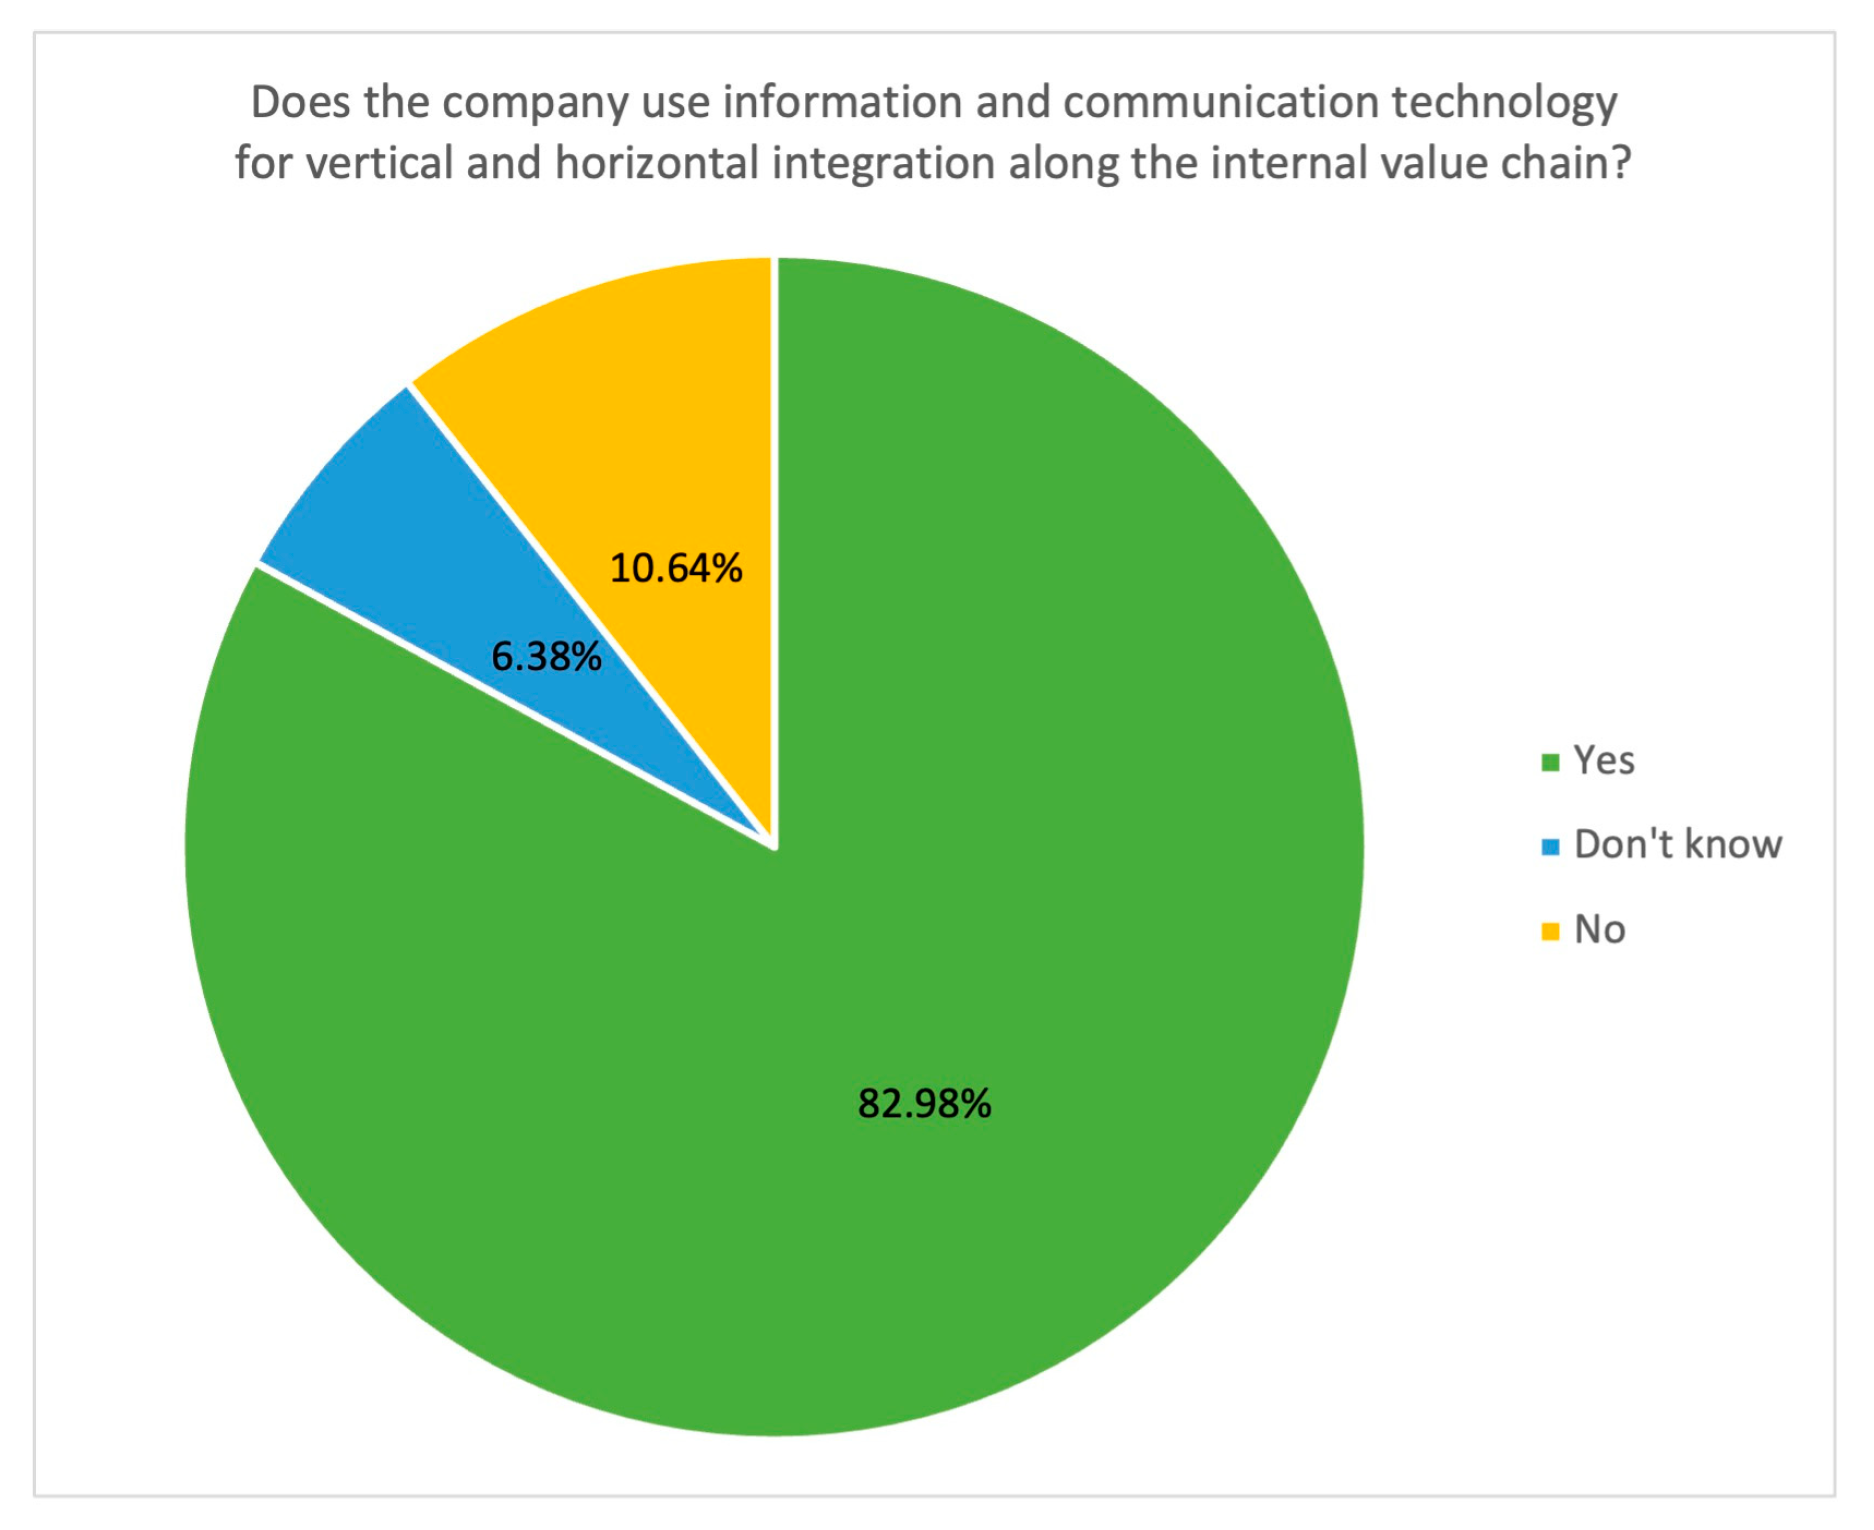
- Q2: How are companies using digital technologies in performance measurement of logistics processes?
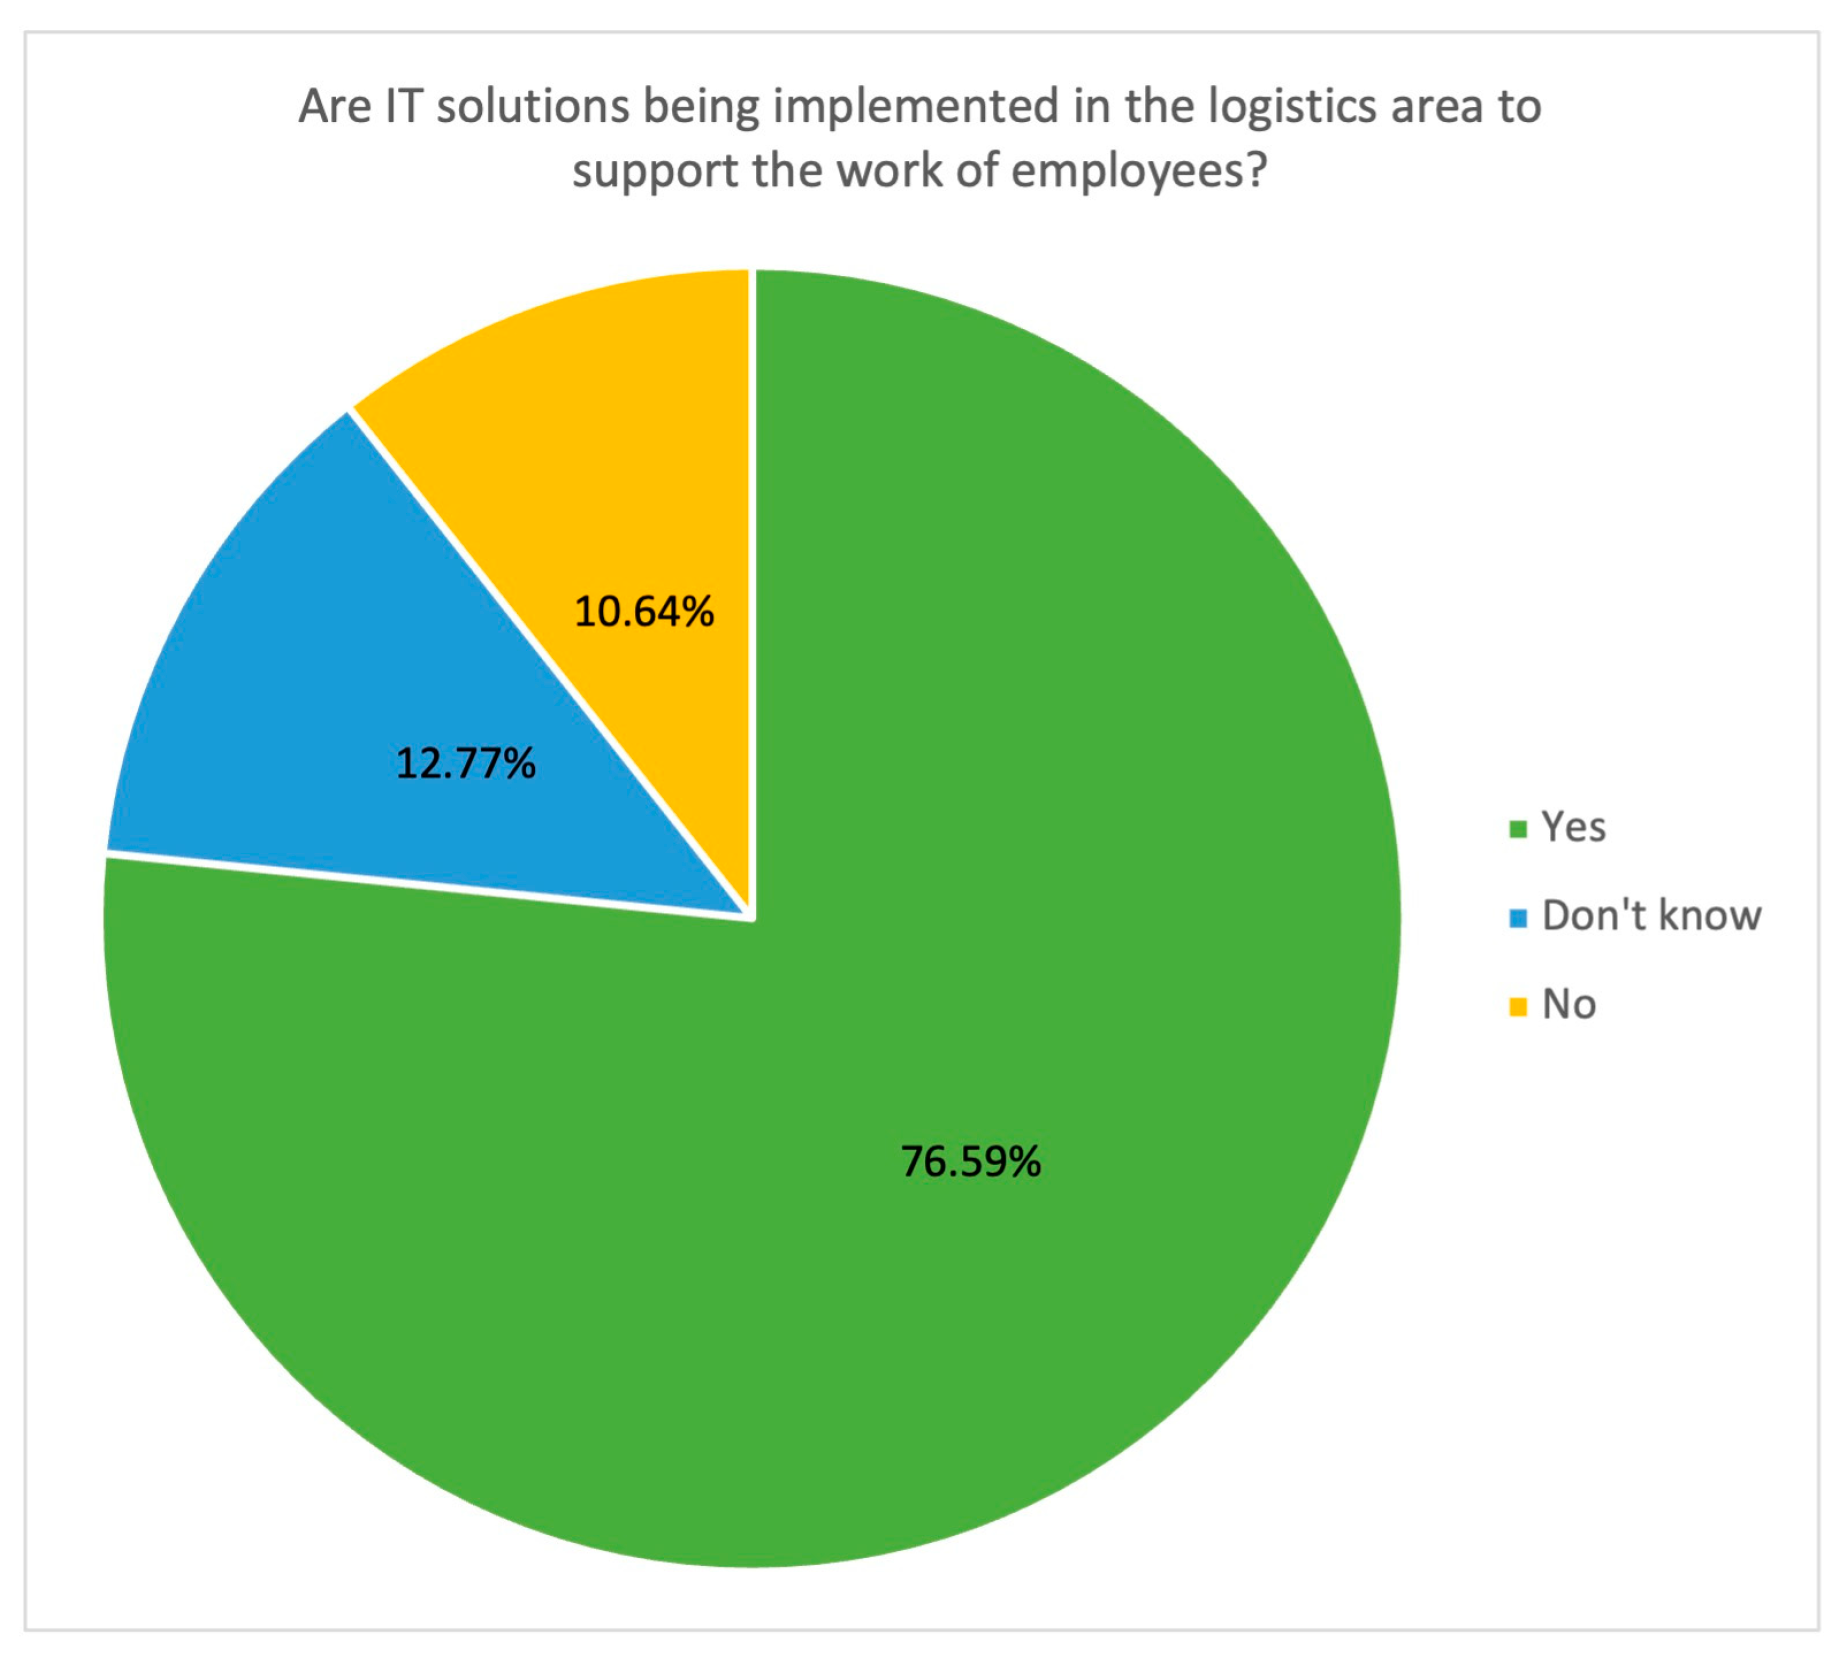
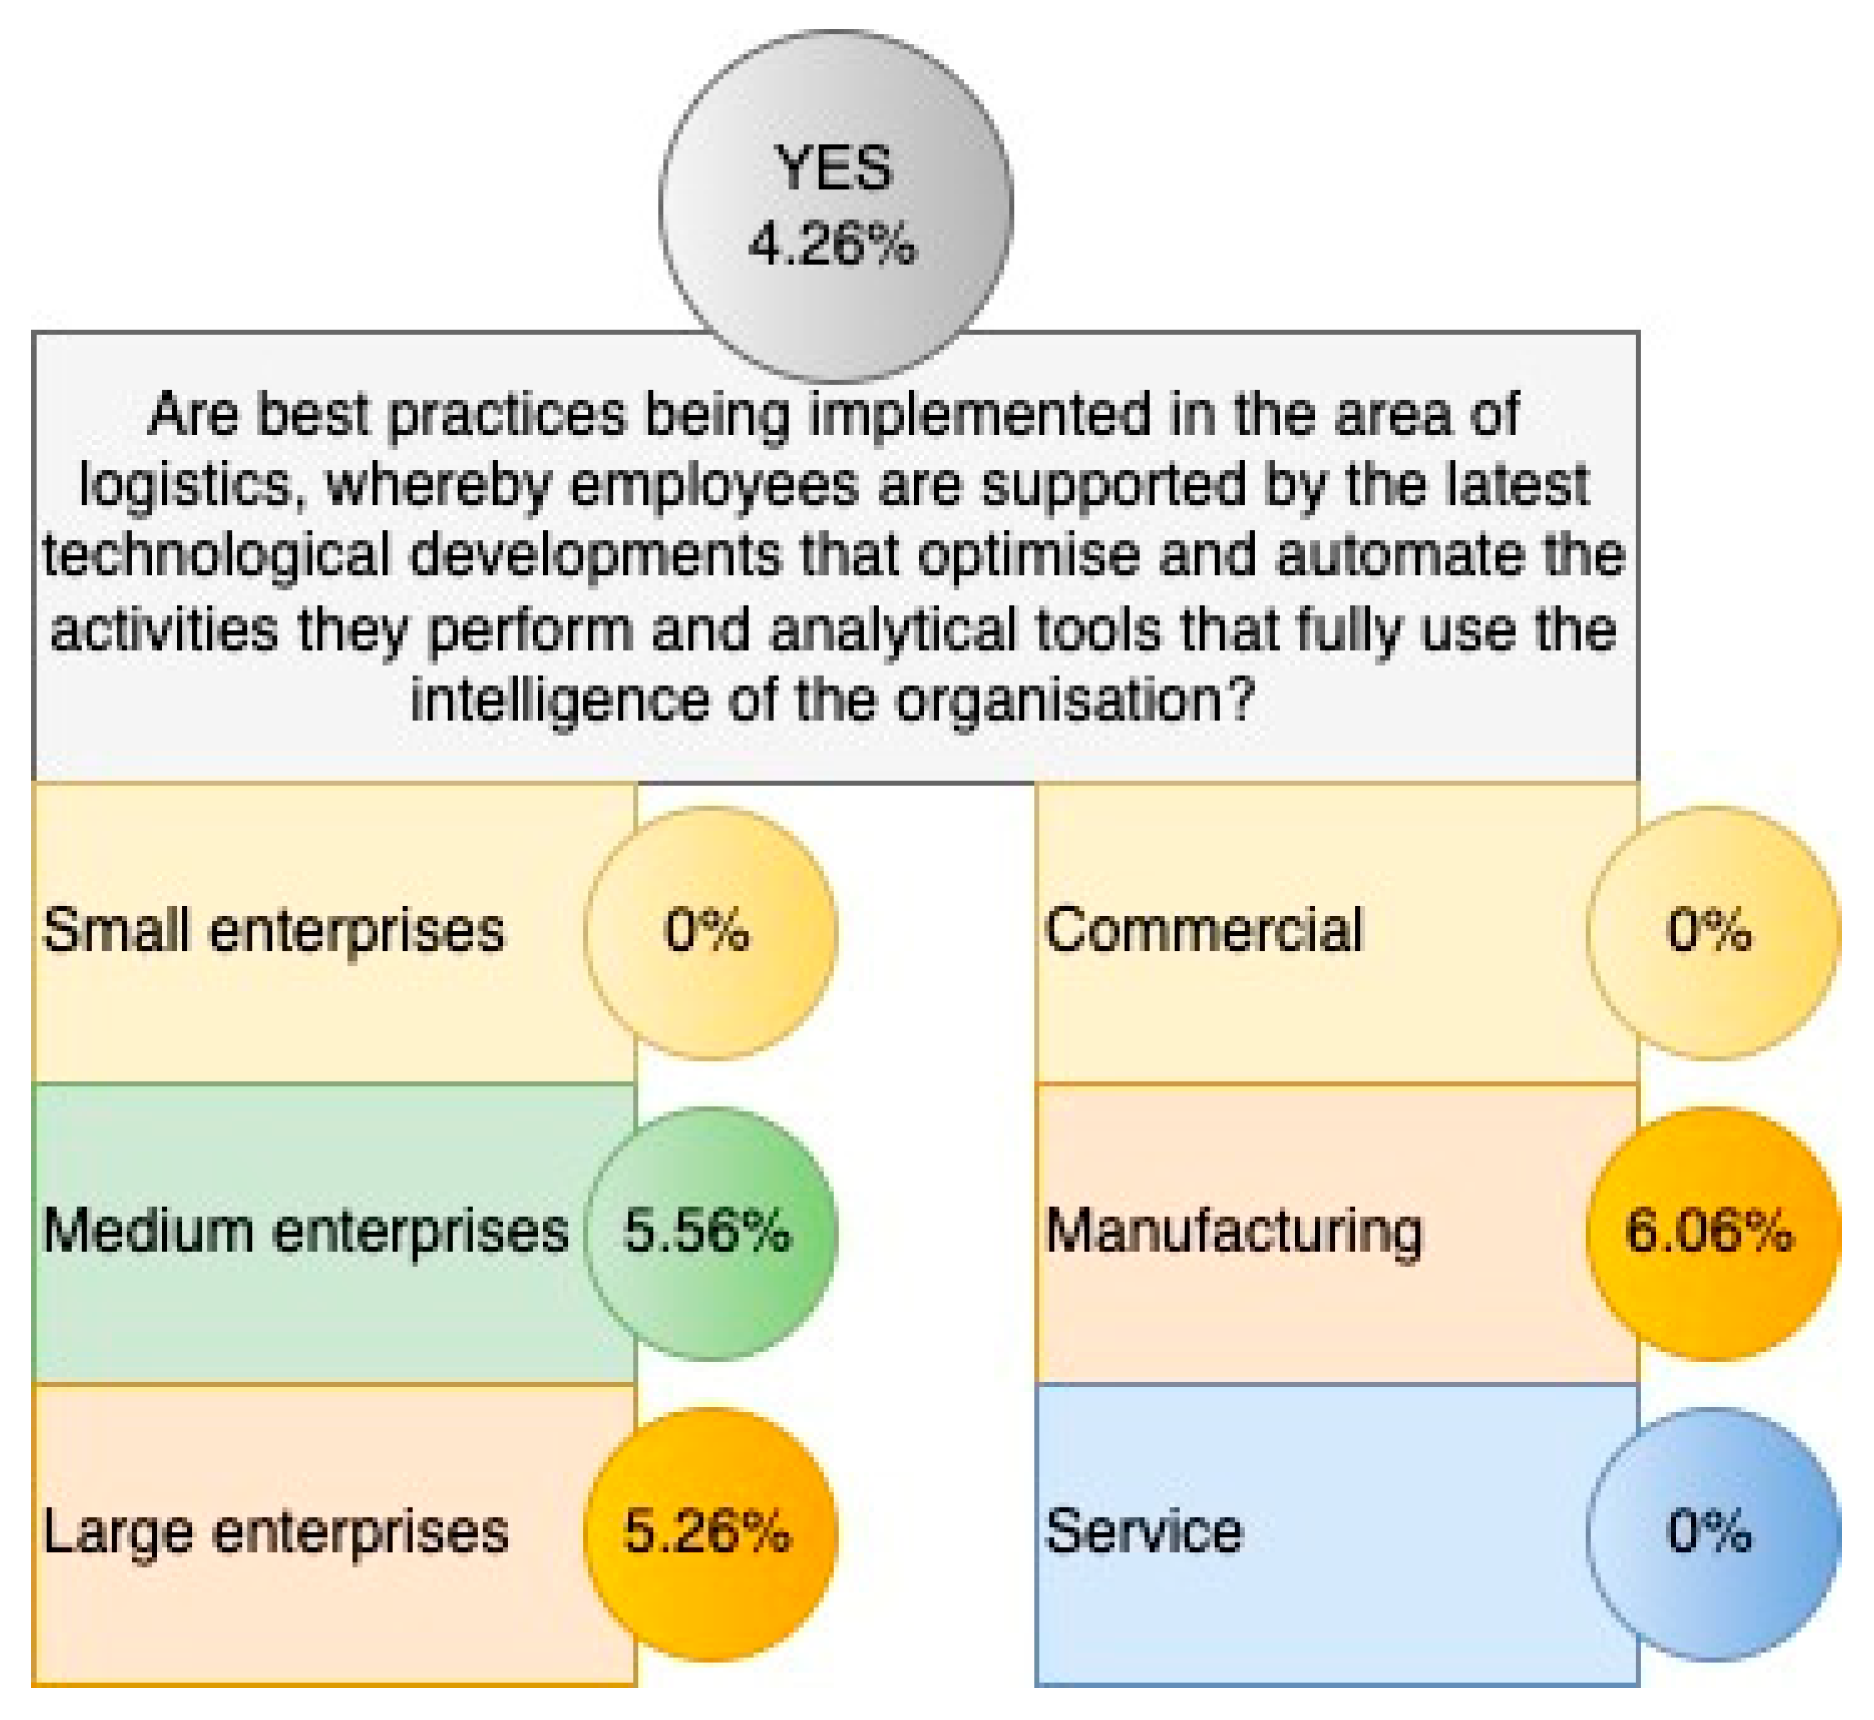
- Q3: What tools do enterprises use to support logistics professionals in their operational activities?
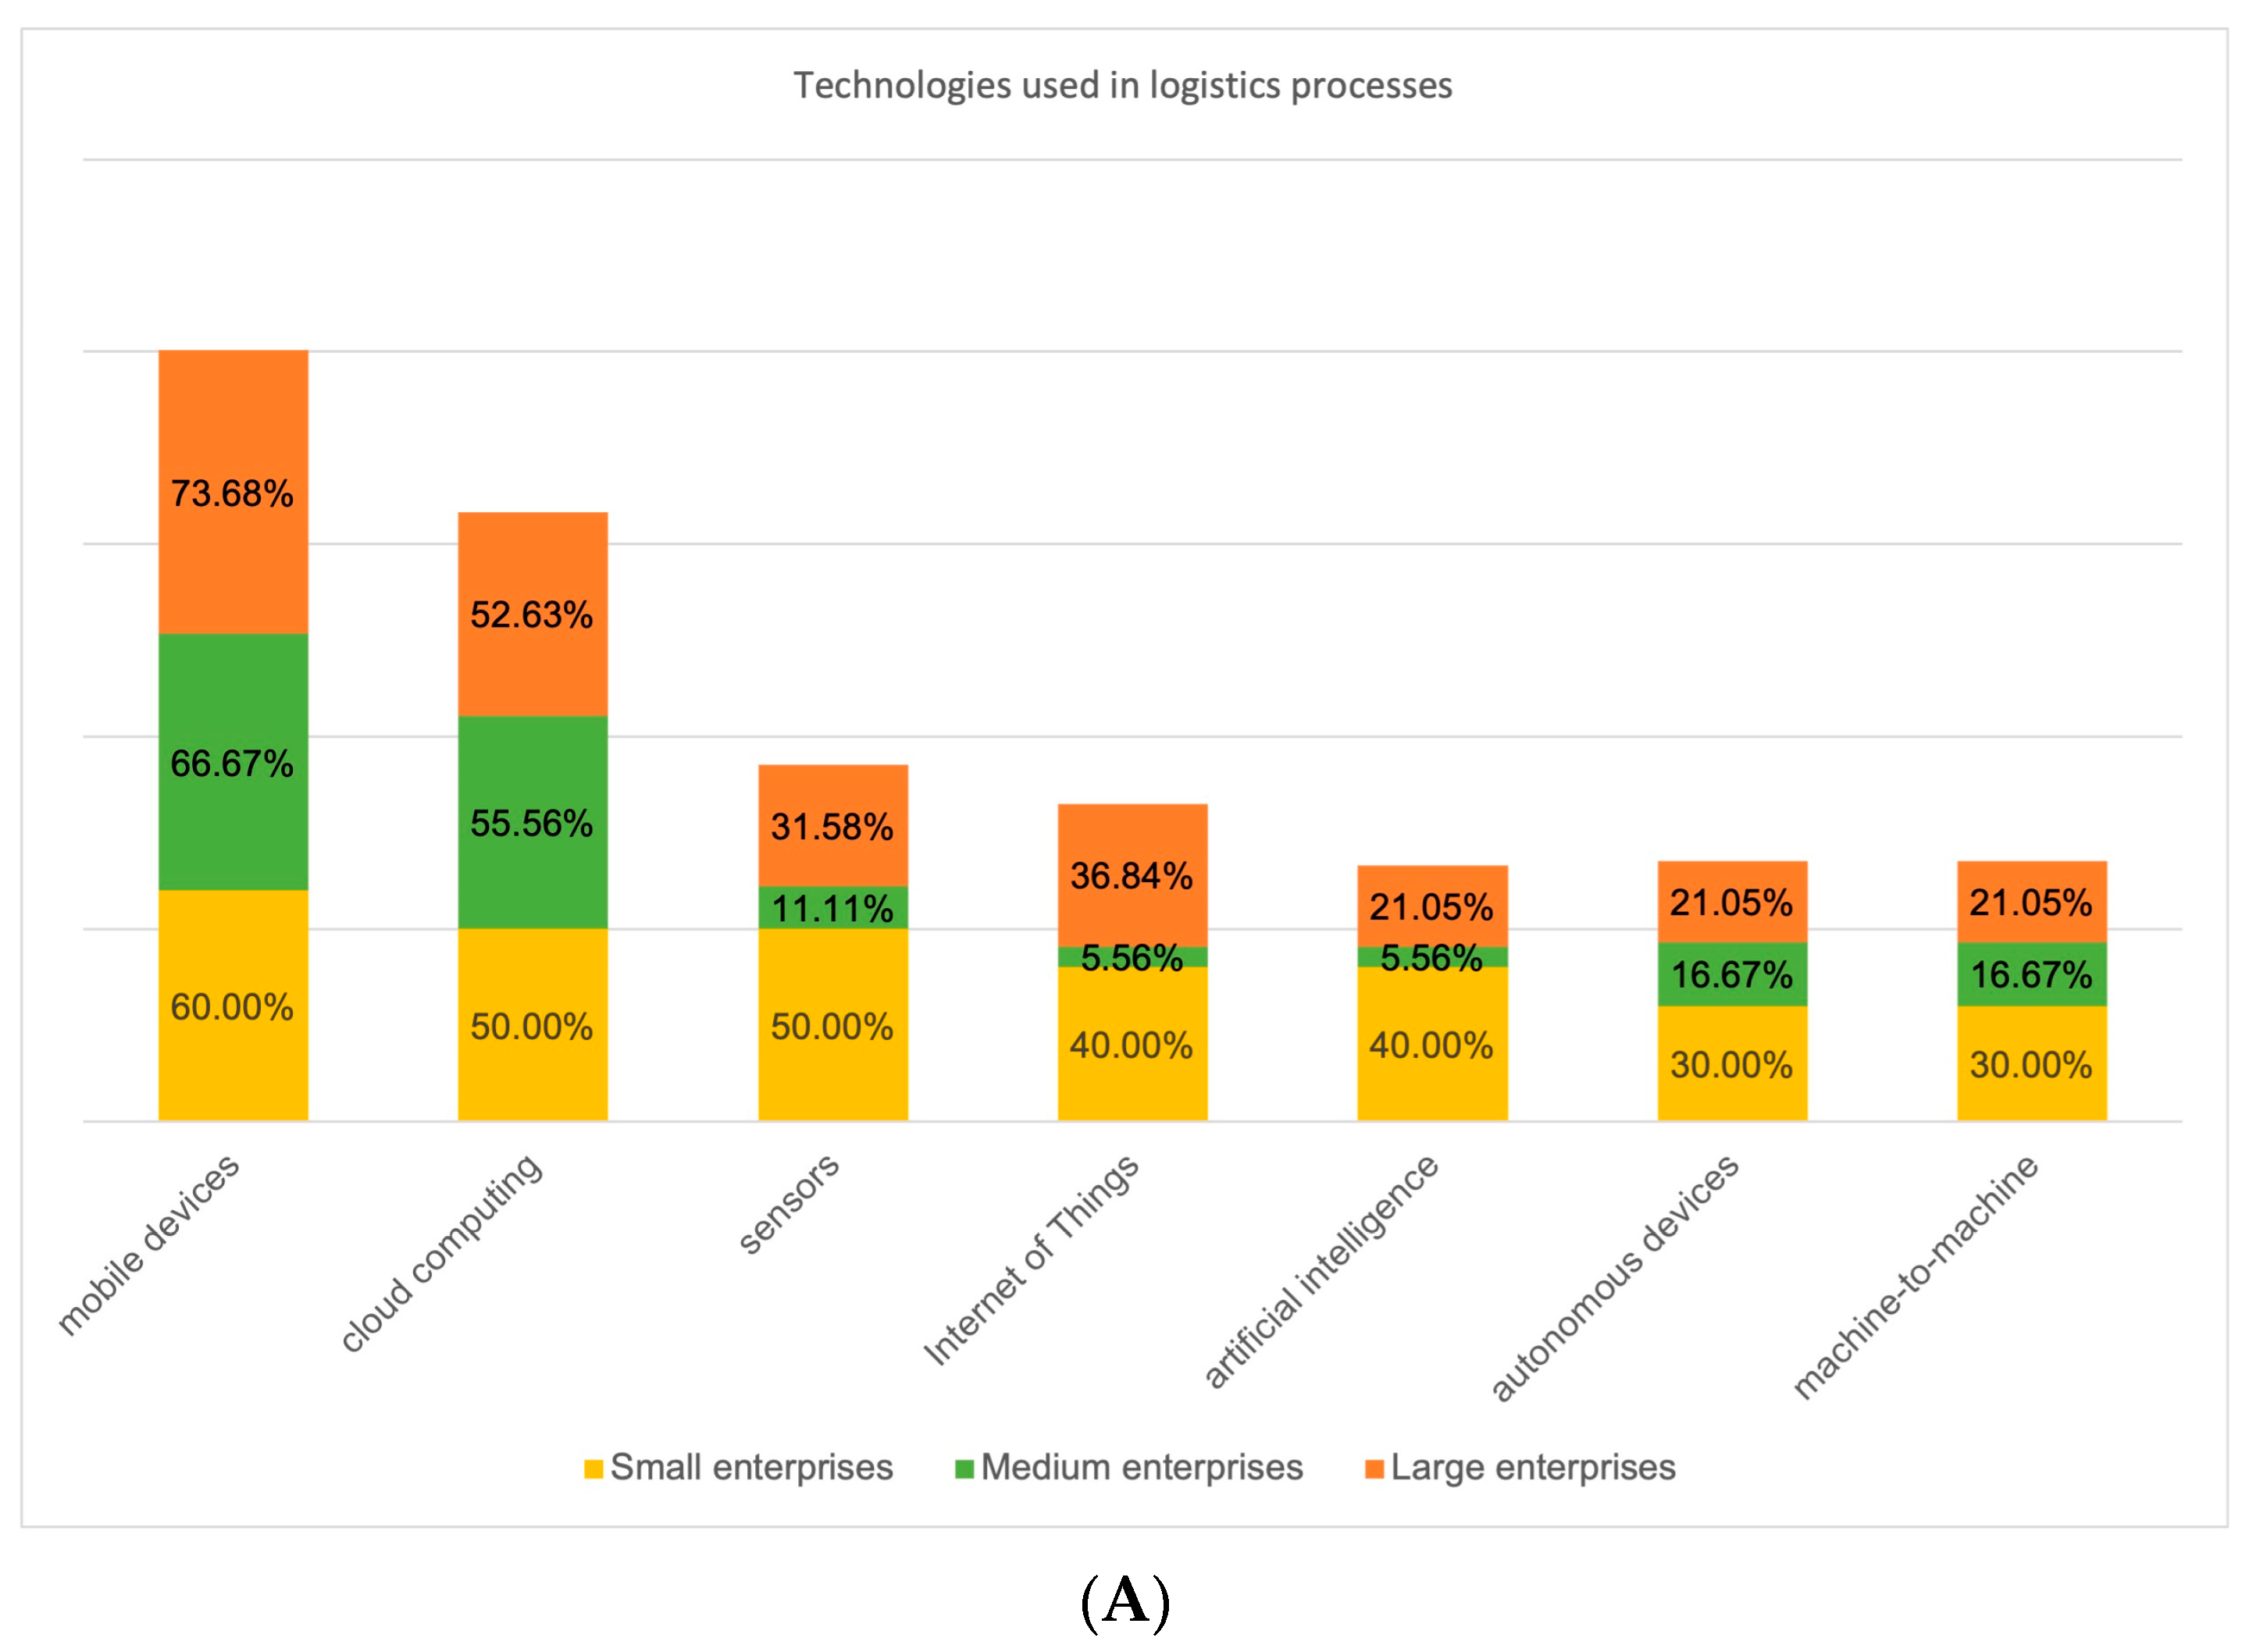
- Q4: Which technological solutions are used in logistics systems, and to what extent?
- Processes—This includes the creation of a framework for value-adding processes for the company and their organization. The level of digitalization, automation, and optimization of operations is assessed in relation to these processes. The analysis includes not only how processes are performed but also the systematization and automation of measurements. It is also essential to use the results of the measurements for analyses aimed at optimizing and proactively managing the implemented processes. Two sub-areas are distinguished in Processes: (1) performance management and (2) process management.
- Employees—Digital maturity assessment models focus primarily on developing an employee’s digital competence. However, an equally critical issue is the resistance to change and the reluctance of people to work with machines, which can effectively block any action aimed at digitalization processes. Employees’ attitudes are influenced by the perceived benefits of the support they receive in their ongoing operations provided by the digital solutions implemented. Therefore, the rationale and scope of the implementation and the potential benefits achieved by the employee using digital technologies in his/her daily duties will determine his/her acceptance of the implemented changes. In the Employees area, the DMM-OP model distinguishes three sub-areas: (1) support of employee activities by digital solutions, (2) employee attitudes, and (3) employee competence development.
- Technology is considered a critical area of digital transformation, focusing primarily on the technical infrastructure, including machine automation, information and communication systems, and network services integration. Due to the assessment of the level of automation and self-driving, many researchers have also included cyber-security management issues in their analyses. However, in the DMM-OP model, this area is restricted to infrastructure issues only.
- % responses—percentage of responses;
- NoR—number of responses;
- NoC—number of all companies surveyed.
- % responses—percentage of responses;
- GNoR—number of responses provided by respondents from the distinguished enterprise group;
- GNoC—number of respondents representing the enterprise group.
4. Results
4.1. Process Management
4.2. Performance Management
4.3. Supporting Employees’ Activities
4.4. Technology
5. Discussion
6. Conclusions
Author Contributions
Funding
Institutional Review Board Statement
Informed Consent Statement
Data Availability Statement
Acknowledgments
Conflicts of Interest
References
- Matt, D.T.; Pedrini, G.; Bonfanti, A.; Orzes, G. Industrial Digitalization. A Systematic Literature Review and Research Agenda. Eur. Manag. J. 2023, 41, 47–78. [Google Scholar] [CrossRef]
- Legner, C.; Eymann, T.; Hess, T.; Matt, C.; Böhmann, T.; Drews, P.; Mädche, A.; Urbach, N.; Ahlemann, F. Digitalization: Opportunity and Challenge for the Business and Information Systems Engineering Community. Bus. Inf. Syst. Eng. 2017, 59, 301–308. [Google Scholar] [CrossRef]
- Gray, J.; Rumpe, B. Models for the Digital Transformation. Softw. Syst. Model 2017, 16, 307–308. [Google Scholar] [CrossRef]
- Schilling, L.; Seuring, S. Sustainable Value Creation through Information Technology-Enabled Supply Chains in Emerging Markets. Int. J. Logist. Manag. 2022, 33, 1001–1016. [Google Scholar] [CrossRef]
- Parhi, S.; Joshi, K.; Gunasekaran, A.; Sethuraman, K. Reflecting on an Empirical Study of the Digitalization Initiatives for Sustainability on Logistics: The Concept of Sustainable Logistics 4.0. Clean. Logist. Supply Chain 2022, 4, 100058. [Google Scholar] [CrossRef]
- Lee, S.-Y. Sustainable Supply Chain Management, Digital-Based Supply Chain Integration, and Firm Performance: A Cross-Country Empirical Comparison between South Korea and Vietnam. Sustainability 2021, 13, 7315. [Google Scholar] [CrossRef]
- Kayikci, Y. Sustainability Impact of Digitization in Logistics. Procedia Manuf. 2018, 21, 782–789. [Google Scholar] [CrossRef]
- How COVID-19 Has Pushed Companies over the Technology Tipping Point—And Transformed Business Forever. 2020. Available online: https://www.mckinsey.com/capabilities/strategy-and-corporate-finance/our-insights/how-covid-19-has-pushed-companies-over-the-technology-tipping-point-and-transformed-business-forever#/ (accessed on 3 February 2023).
- Frank, A.G.; Dalenogare, L.S.; Ayala, N.F. Industry 4.0 Technologies: Implementation Patterns in Manufacturing Companies. Int. J. Prod. Econ. 2019, 210, 15–26. [Google Scholar] [CrossRef]
- Vial, G. Understanding Digital Transformation: A Review and a Research Agenda. J. Strateg. Inf. Syst. 2019, 28, 118–144. [Google Scholar] [CrossRef]
- Abdallah, Y.O.; Shehab, E.; Al-Ashaab, A. Towards Managing Digital Transformation in Manufacturing Industry: Theoretical Framework. Adv. Transdiscipl. Eng. 2021, 15, 21–26. [Google Scholar] [CrossRef]
- Alsufyani, N.; Gill, A.Q. Digitalisation Performance Assessment: A Systematic Review. Technol. Soc. 2022, 68, 101894. [Google Scholar] [CrossRef]
- Plekhanov, D.; Franke, H.; Netland, T.H. Digital Transformation: A Review and Research Agenda. Eur. Manag. J. 2023, 41, 821–844. [Google Scholar] [CrossRef]
- Autio, E.; Nambisan, S.; Thomas, L.D.W.; Wright, M. Digital Affordances, Spatial Affordances, and the Genesis of Entrepreneurial Ecosystems. Strateg. Entrep. J. 2018, 12, 72–95. [Google Scholar] [CrossRef]
- Guha Majumder, M.; Dutta Gupta, S.; Paul, J. Perceived Usefulness of Online Customer Reviews: A Review Mining Approach Using Machine Learning & Exploratory Data Analysis. J. Bus. Res. 2022, 150, 147–164. [Google Scholar] [CrossRef]
- Warner, K.S.R.; Wäger, M. Building Dynamic Capabilities for Digital Transformation: An Ongoing Process of Strategic Renewal. Long Range Plan. 2019, 52, 326–349. [Google Scholar] [CrossRef]
- Meng, F.; Wang, W. Research on the Mechanism of Digitalization to the Improvement of Manufacturing Enterprises Performance Based on Mediating Effect. In Proceedings of the 2020 6th International Conference on Information Management (ICIM), London, UK, 27–29 March 2020; pp. 122–126. [Google Scholar]
- Hein-Pensel, F.; Winkler, H.; Brückner, A.; Wölke, M.; Jabs, I.; Mayan, I.J.; Kirschenbaum, A.; Friedrich, J.; Zinke-Wehlmann, C. Maturity Assessment for Industry 5.0: A Review of Existing Maturity Models. J. Manuf. Syst. 2023, 66, 200–210. [Google Scholar] [CrossRef]
- Thordsen, T.; Murawski, M.; Bick, M. How to Measure Digitalization? A Critical Evaluation of Digital Maturity Models. In Responsible Design, Implementation and Use of Information and Communication Technology; I3E 2020. Lecture Notes in Computer Science; Hattingh, M., Matthee, M., Smuts, H., Pappas, I., Dwivedi, Y., Mäntymäki, M., Eds.; Springer: Berlin/Heidelberg, Germany, 2020; Volume 12066, pp. 358–369. [Google Scholar]
- Hellweg, F.; Lechtenberg, S.; Hellingrath, B.; Thomé, A.M.T. Literature Review on Maturity Models for Digital Supply Chains. Braz. J. Oper. Prod. Manag. 2021, 18, 1–12. [Google Scholar] [CrossRef]
- Becker, J.; Knackstedt, R.; Pöppelbuß, J. Developing Maturity Models for IT Management. Bus. Inf. Syst. Eng. 2009, 1, 213–222. [Google Scholar] [CrossRef]
- Werner-Lewandowska, K.; Kosacka-Olejnik, M. Logistics 4.0 Maturity in Service Industry: Empirical Research Results. Procedia Manuf. 2019, 38, 1058–1065. [Google Scholar] [CrossRef]
- Angreani, L.S.; Vijaya, A.; Wicaksono, H. Systematic Literature Review of Industry 4.0 Maturity Model for Manufacturing and Logistics Sectors. Procedia Manuf. 2020, 52, 337–343. [Google Scholar] [CrossRef]
- Schumacher, A. Development of a Maturity Model for Assessing the Industry 4.0 Maturity of Industrial Enterprises; Vienna University of Technology: Wien, Austria, 2015. [Google Scholar]
- Carrijo, P.; Alturas, B.; Pedrosa, I. Similarities and Differences Between Digital Transformation Maturity Models: A Literature Review. In Intelligent Systems in Digital Transformation; Lecture Notes in Networks and, Systems; Kahraman, C., Haktanır, E., Eds.; Springer: Berlin/Heidelberg, Germany, 2023; Volume 549, pp. 33–52. [Google Scholar]
- Proença, D.; Borbinha, J. Maturity Models for Information Systems—A State of the Art. Procedia Comput. Sci. 2016, 100, 1042–1049. [Google Scholar] [CrossRef]
- Sándor, Á.; Gubán, Á. A Measuring Tool for the Digital Maturity of Small and Medium-Sized Enterprises. Manag. Prod. Eng. Rev. 2021, 12, 133–143. [Google Scholar] [CrossRef]
- Jochem, R.; Geers, D.; Heinze, P. Maturity Measurement of Knowledge-intensive Business Processes. TQM J. 2011, 23, 377–387. [Google Scholar] [CrossRef]
- Comuzzi, M.; Patel, A. How Organisations Leverage Big Data: A Maturity Model. Ind. Manag. Data Syst. 2016, 116, 1468–1492. [Google Scholar] [CrossRef]
- Oleśków-Szłapka, J.; Stachowiak, A. The Framework of Logistics 4.0 Maturity Model. In Intelligent Systems in Production Engineering and Maintenance; ISPEM 2018. Advances in Intelligent Systems and Computing; Burduk, A., Chlebus, E., Nowakowski, T., Tubis, A., Eds.; Springer: Berlin/Heidelberg, Germany, 2019; Volume 835, pp. 771–781. [Google Scholar]
- Facchini, F.; Oleśków-Szłapka, J.; Ranieri, L.; Urbinati, A. A Maturity Model for Logistics 4.0: An Empirical Analysis and a Roadmap for Future Research. Sustainability 2019, 12, 86. [Google Scholar] [CrossRef]
- Oleśków-Szłapka, J.; Wojciechowski, H.; Domański, R.; Pawłowski, G. Logistics 4.0 Maturity Levels Assessed Based on GDM (Grey Decision Model) and Artificial Intelligence in Logistics 4.0 -Trends and Future Perspective. Procedia Manuf. 2019, 39, 1734–1742. [Google Scholar] [CrossRef]
- Zoubek, M.; Simon, M. Evaluation of the Level and Readiness of Internal Logistics for Industry 4.0 in Industrial Companies. Appl. Sci. 2021, 11, 6130. [Google Scholar] [CrossRef]
- Schumacher, A.; Erol, S.; Sihn, W. A Maturity Model for Assessing Industry 4.0 Readiness and Maturity of Manufacturing Enterprises. Procedia CIRP 2016, 52, 161–166. [Google Scholar] [CrossRef]
- Rojko, A. Industry 4.0 Concept: Background and Overview. Int. J. Interact. Mob. Technol. 2017, 11, 77. [Google Scholar] [CrossRef]
- Tubis, A.A. Digital Maturity Assessment Model for the Organizational and Process Dimensions. Sustainability 2023, 15, 15122. [Google Scholar] [CrossRef]
- Tubis, A.A.; Grzybowska, K. In Search of Industry 4.0 and Logistics 4.0 in Small-Medium Enterprises—A State of the Art Review. Energies 2022, 15, 8595. [Google Scholar] [CrossRef]


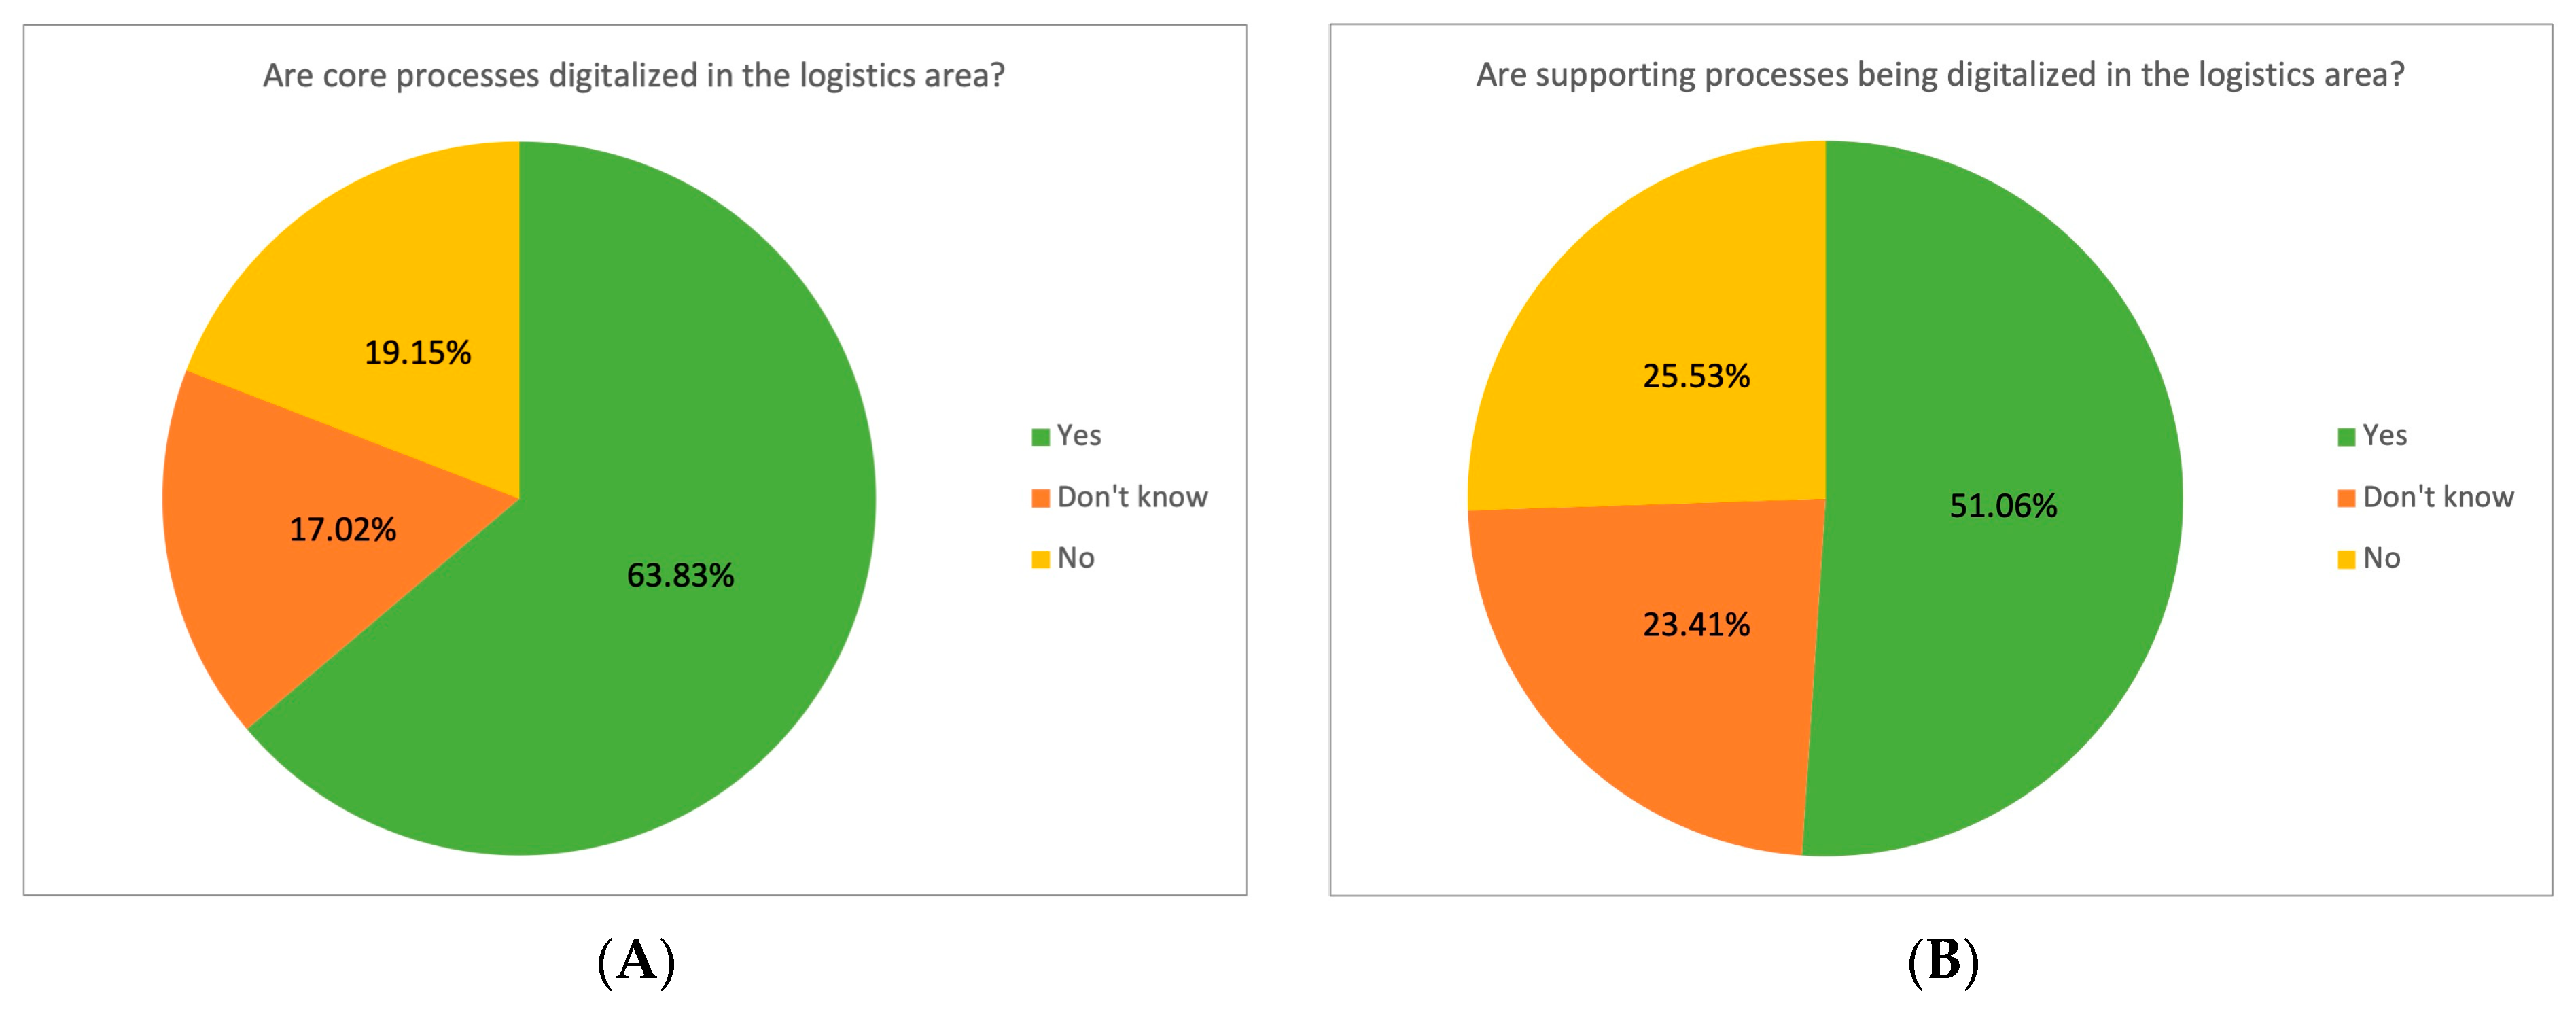

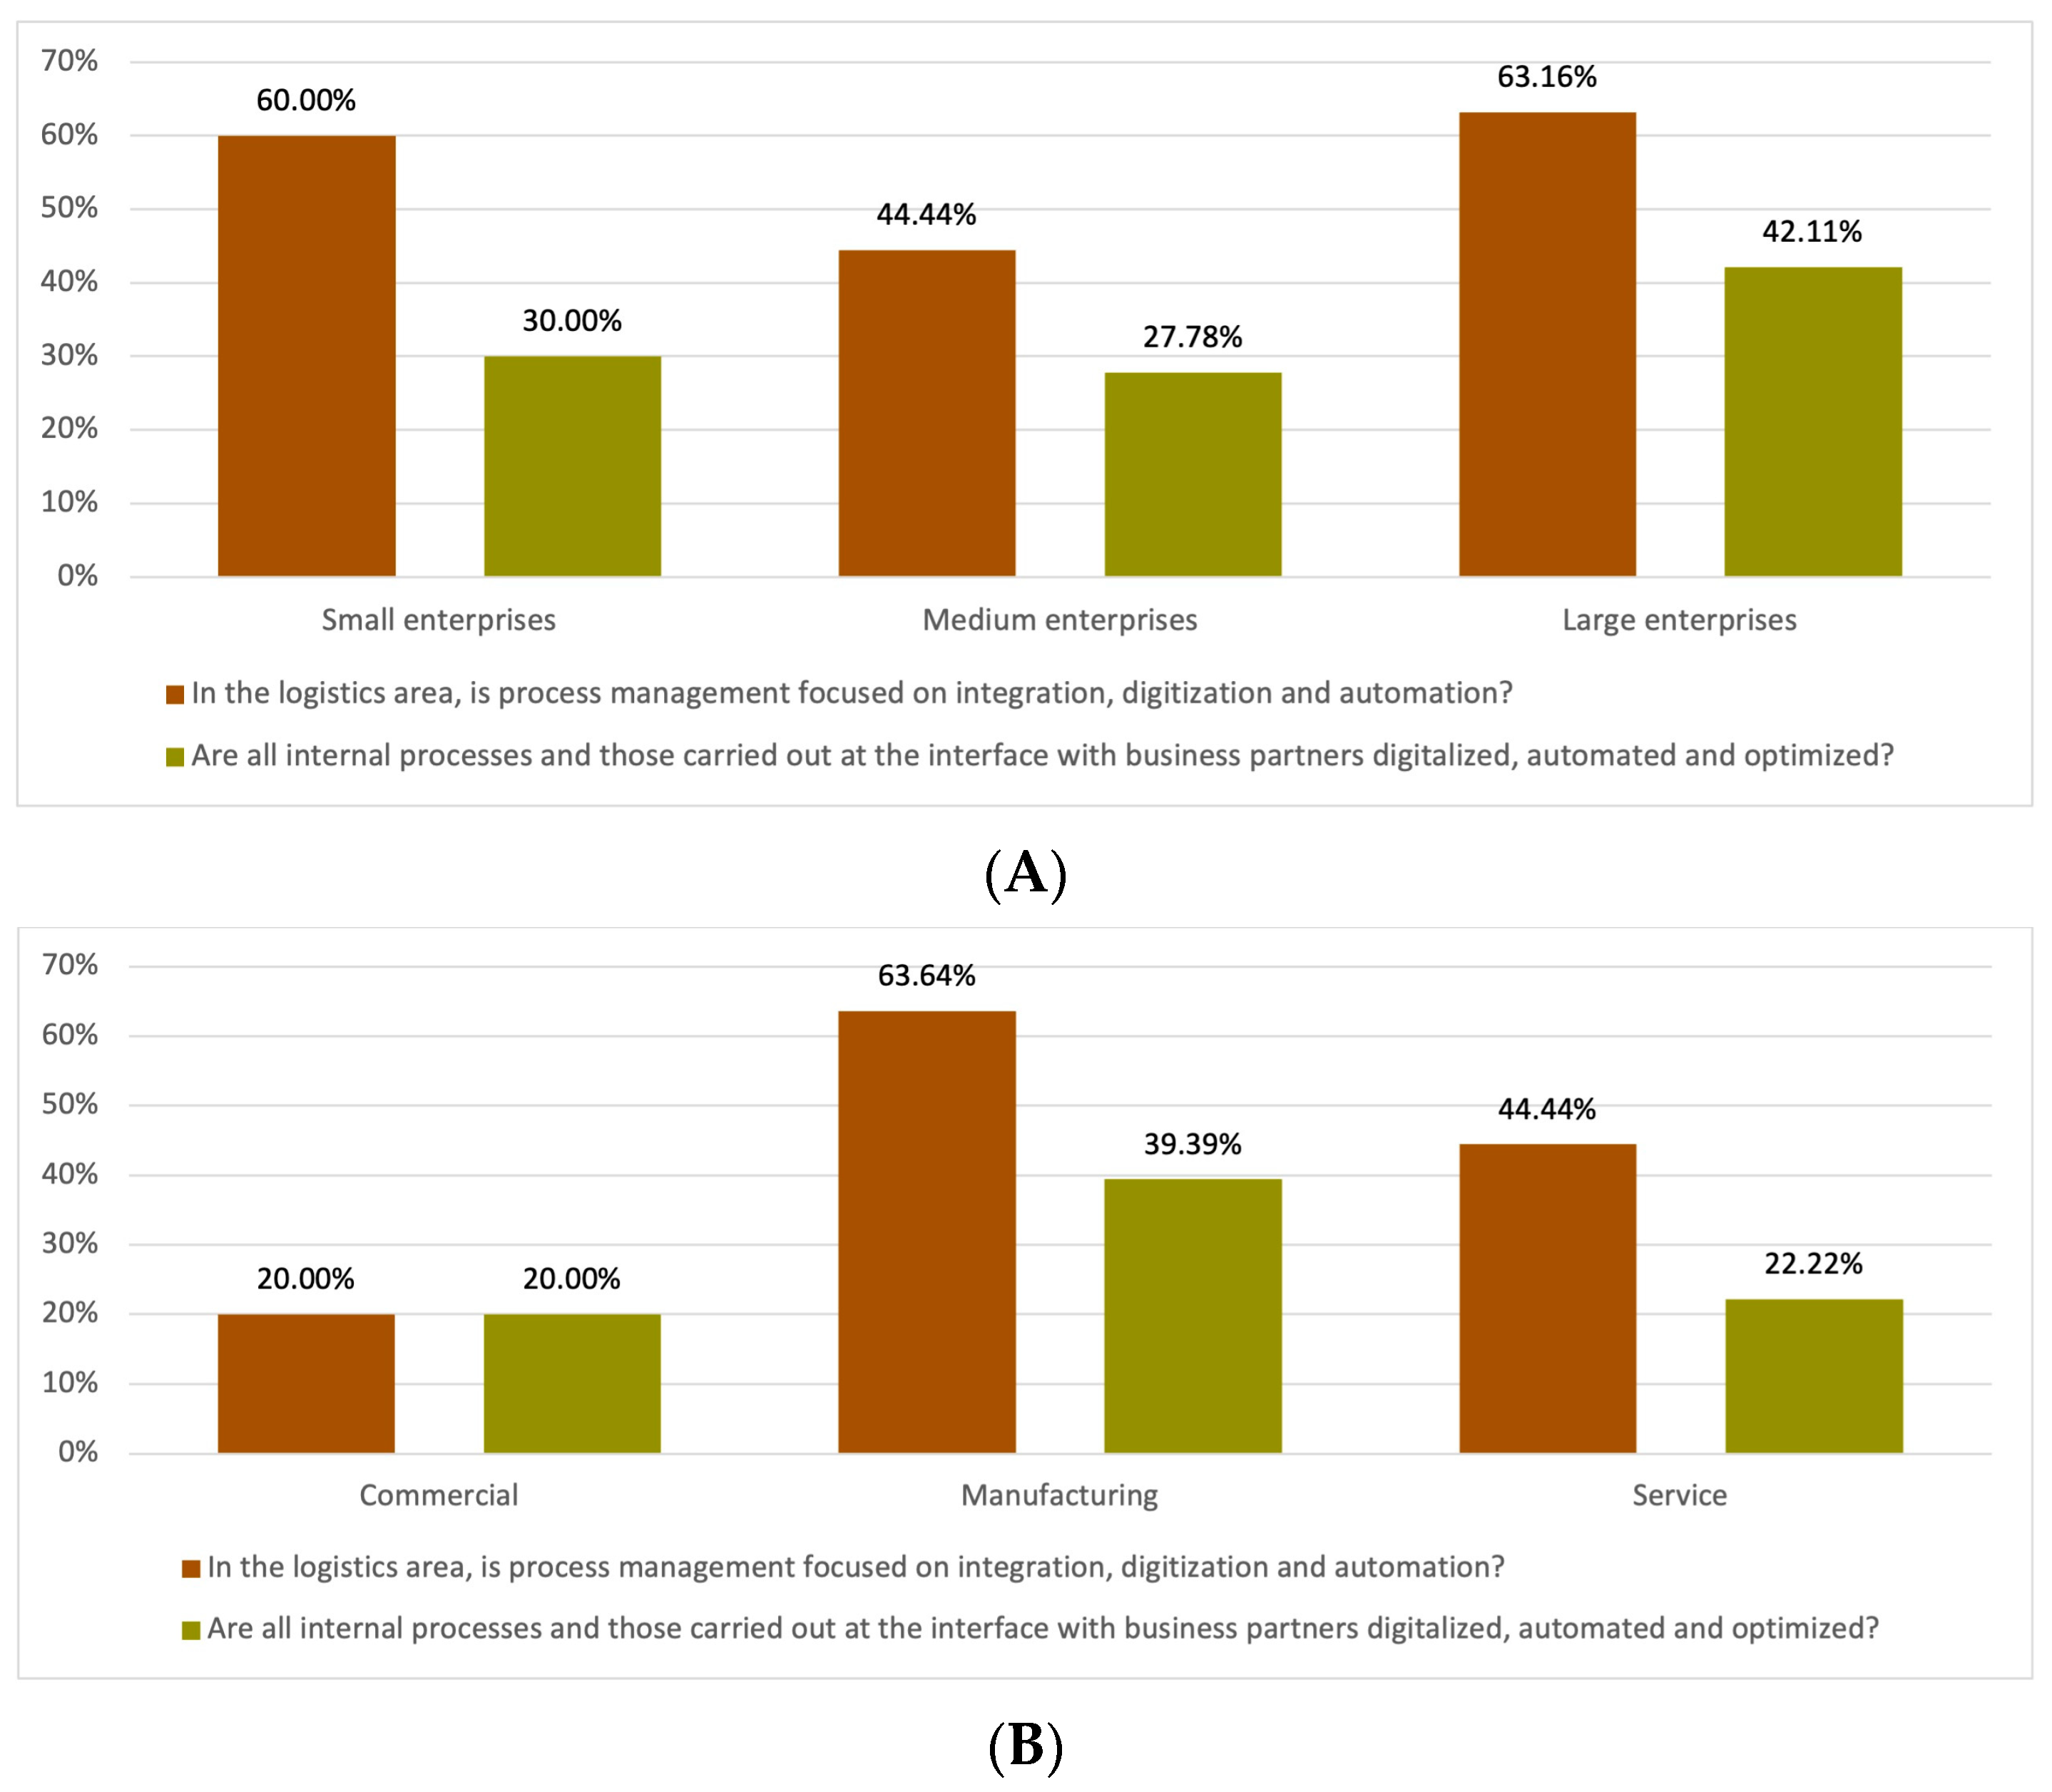
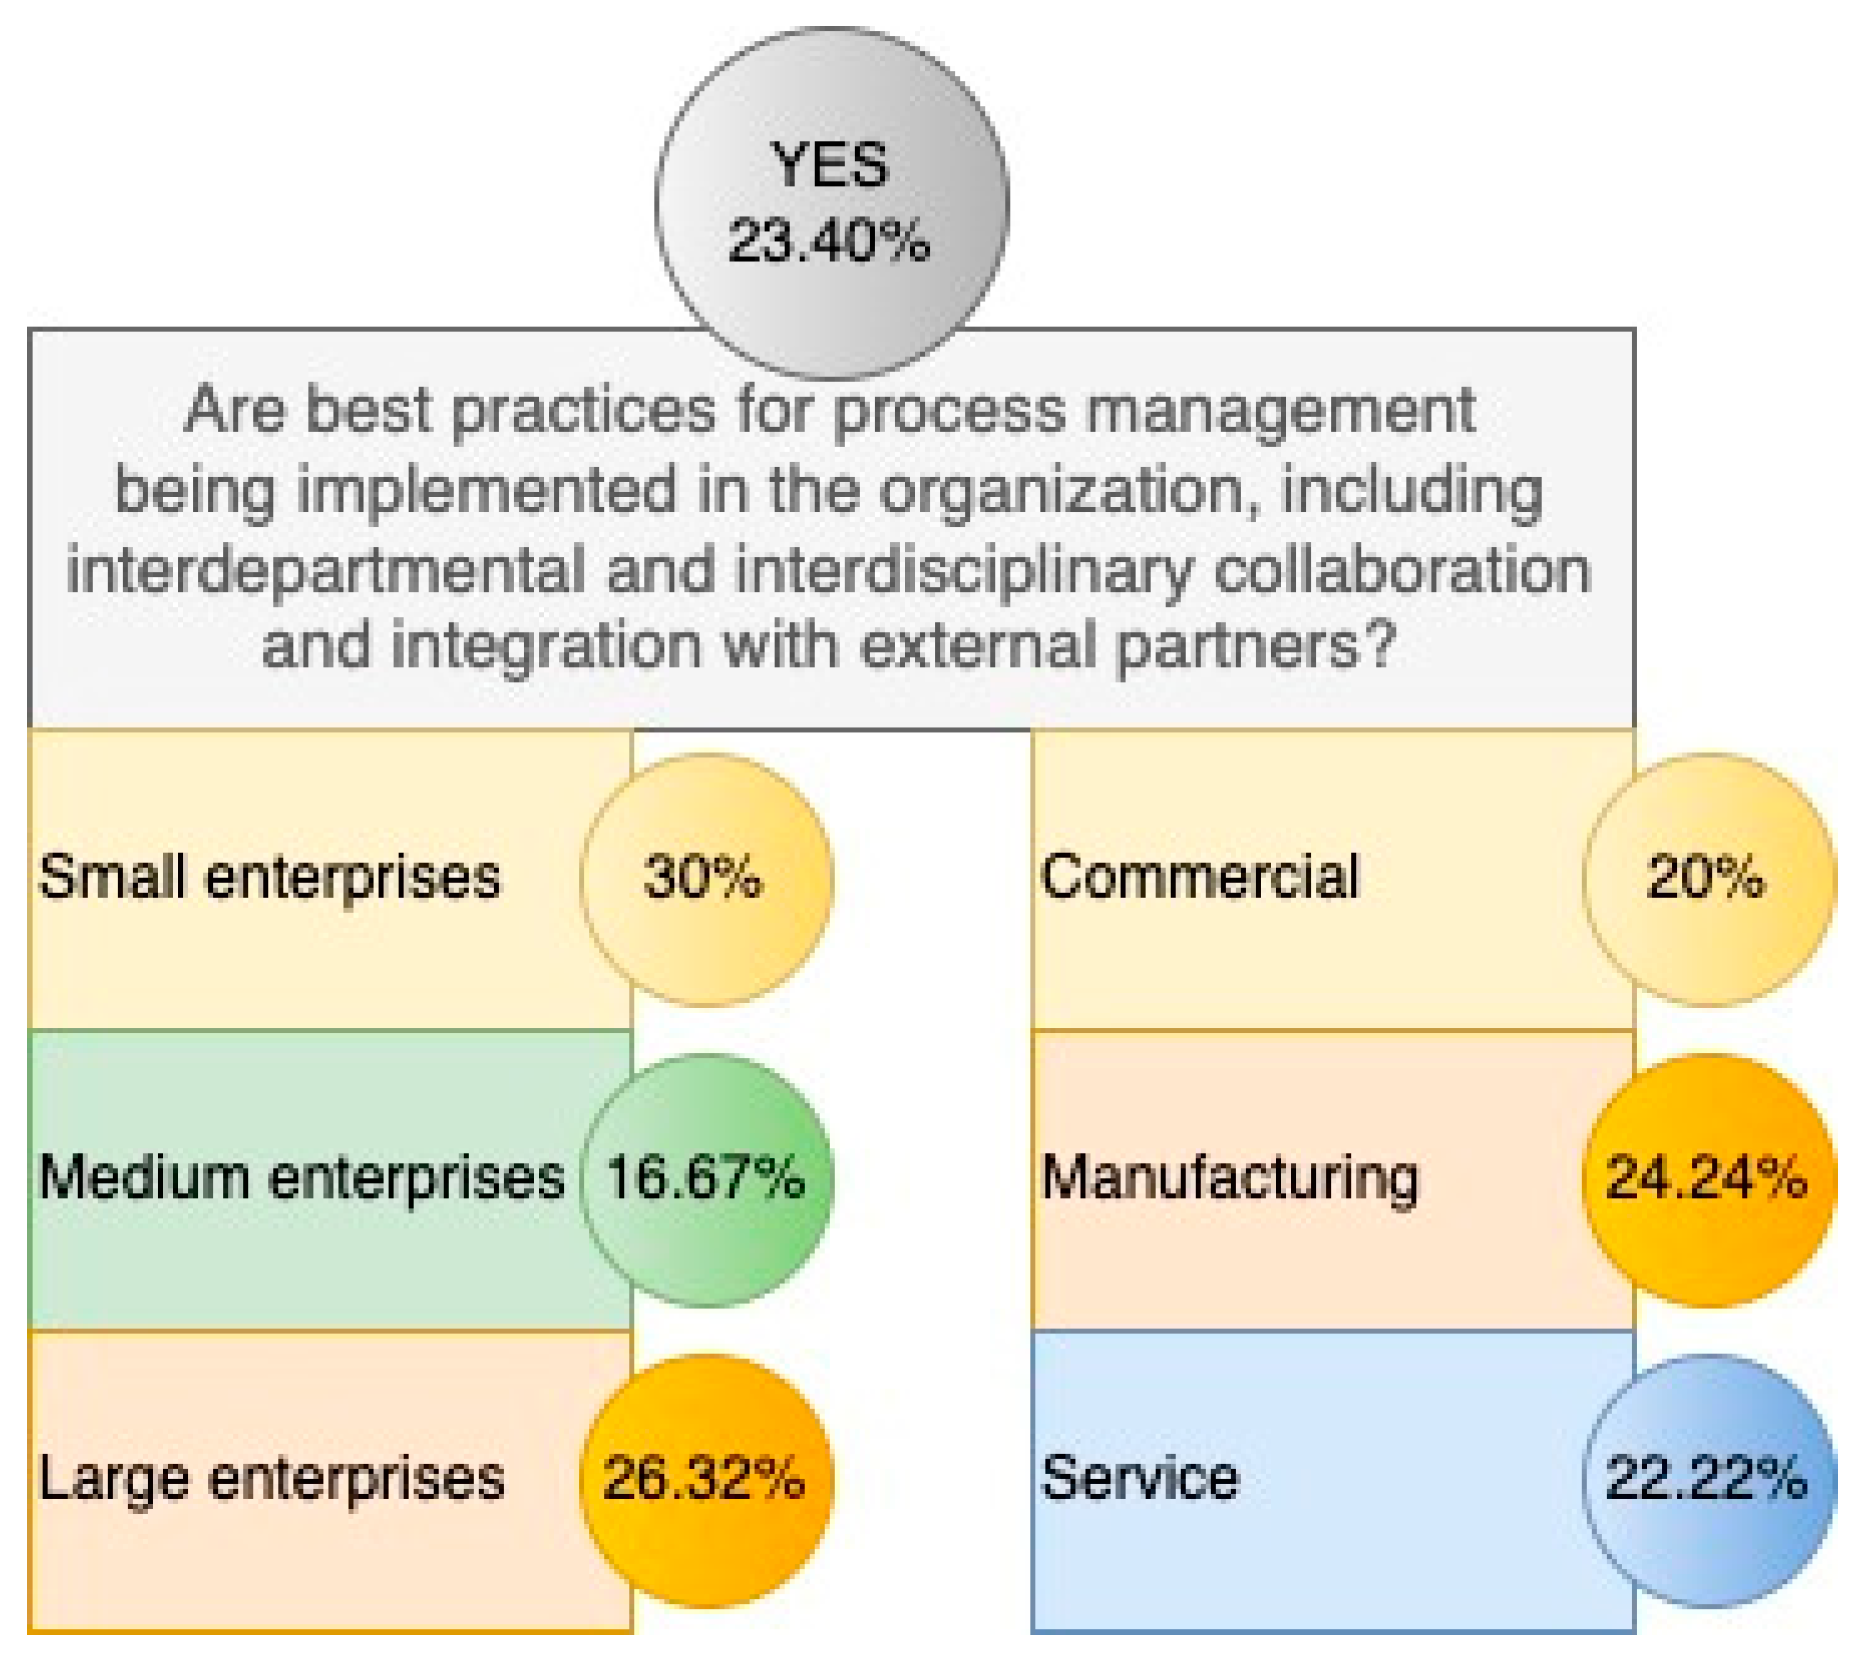
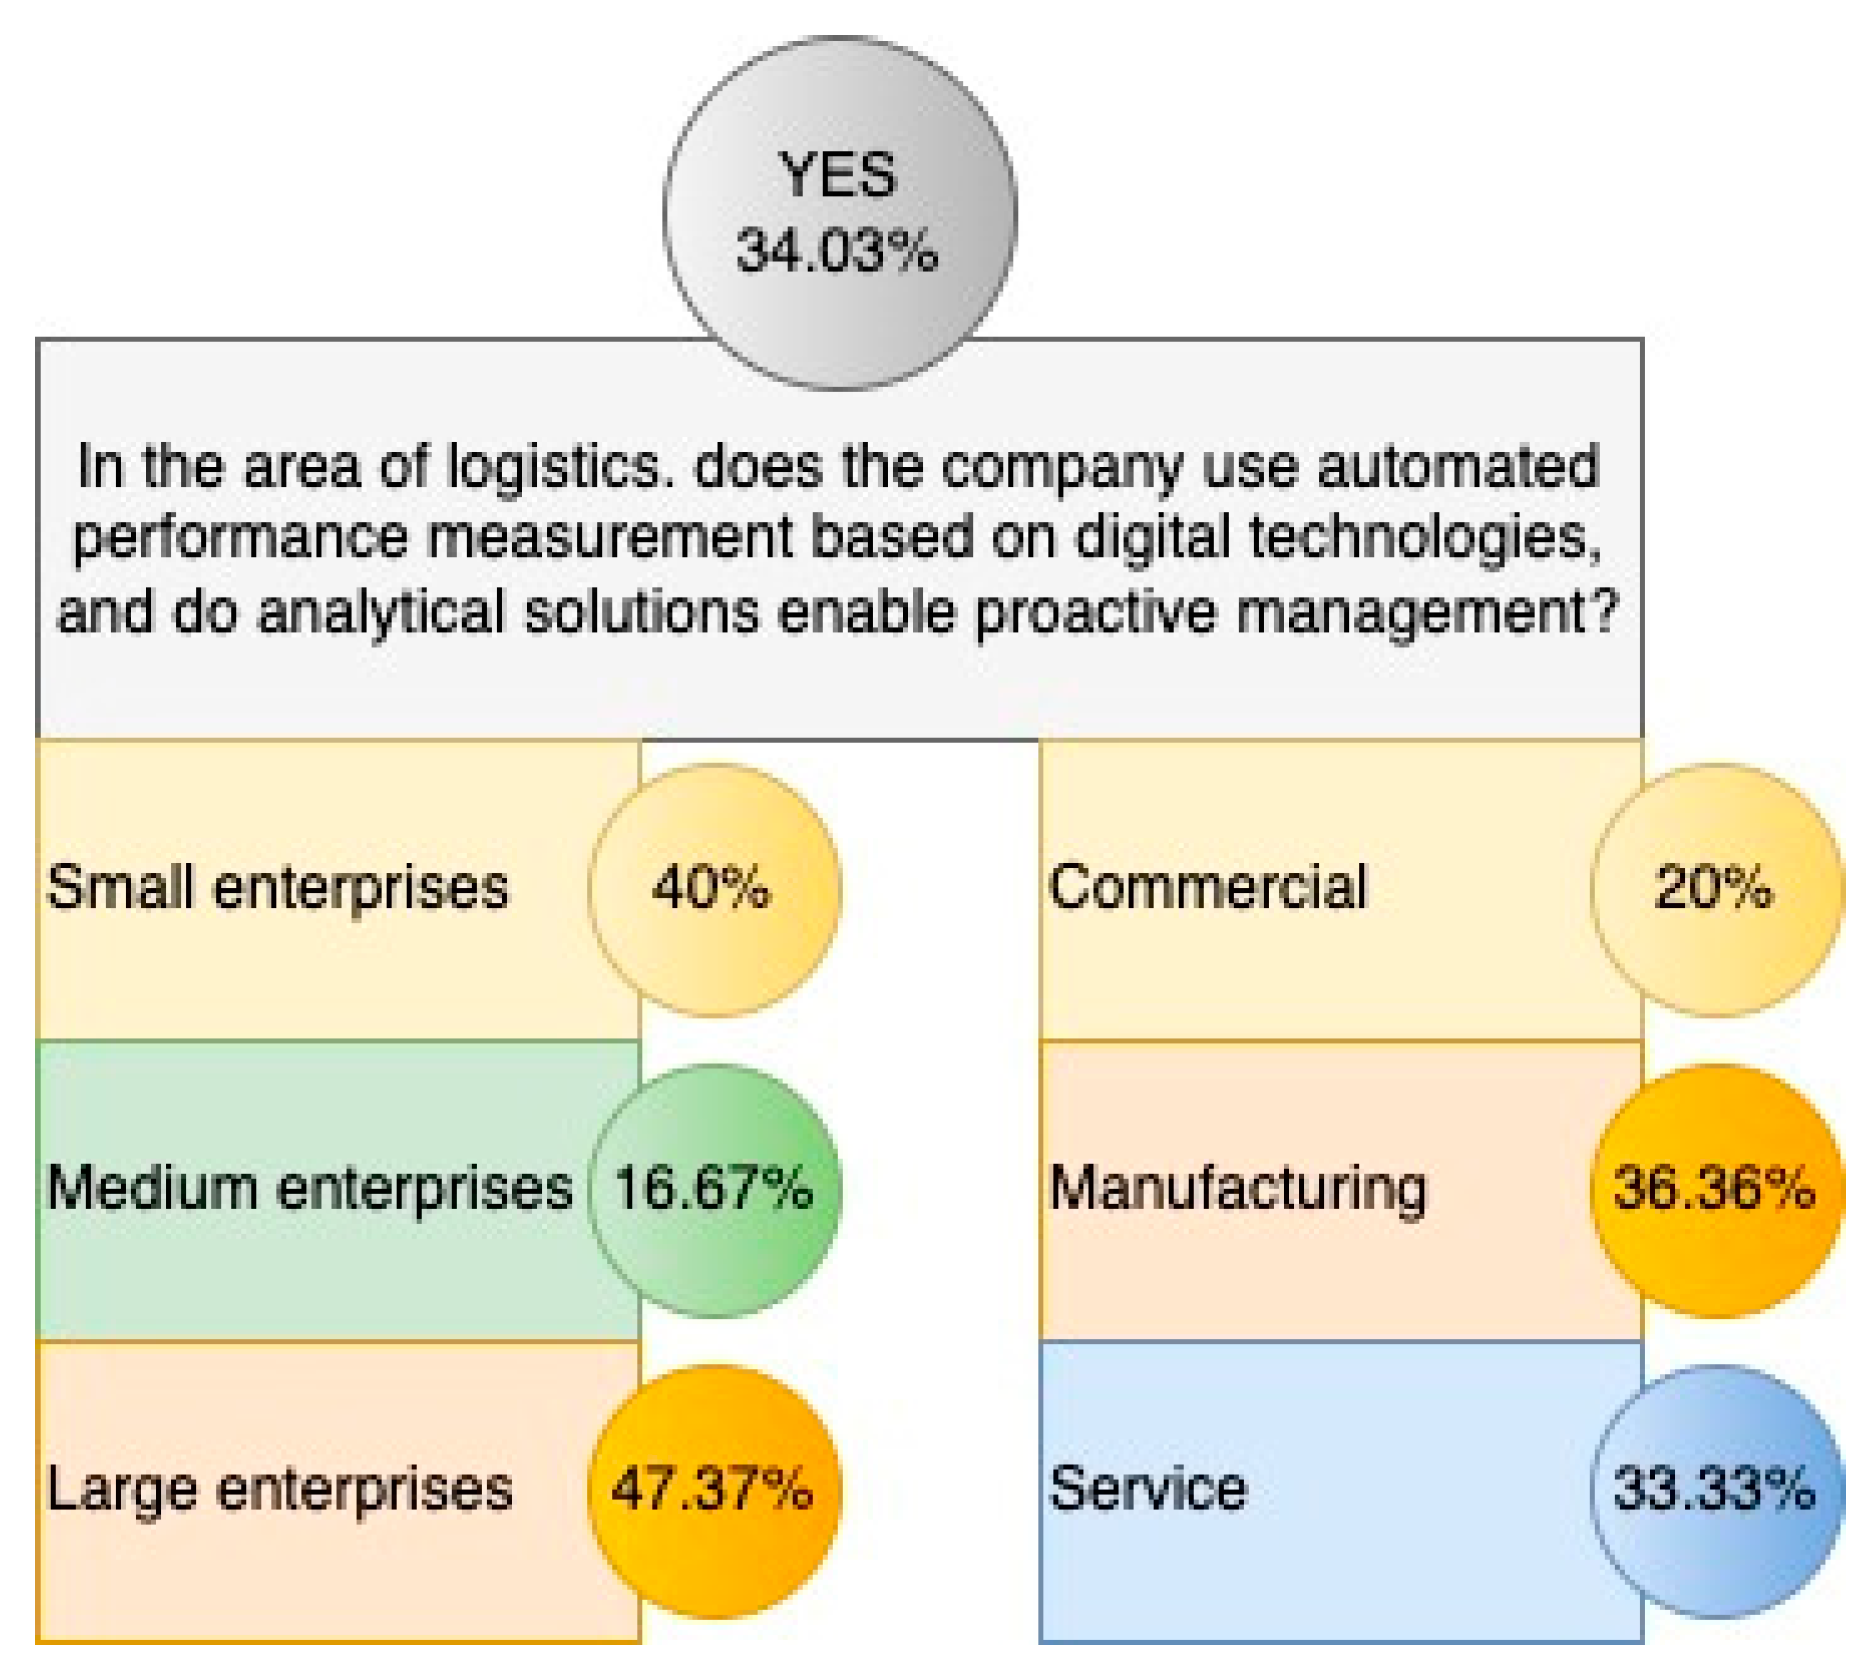





| Small Enterprise | Medium Enterprise | Large Enterprise | |
|---|---|---|---|
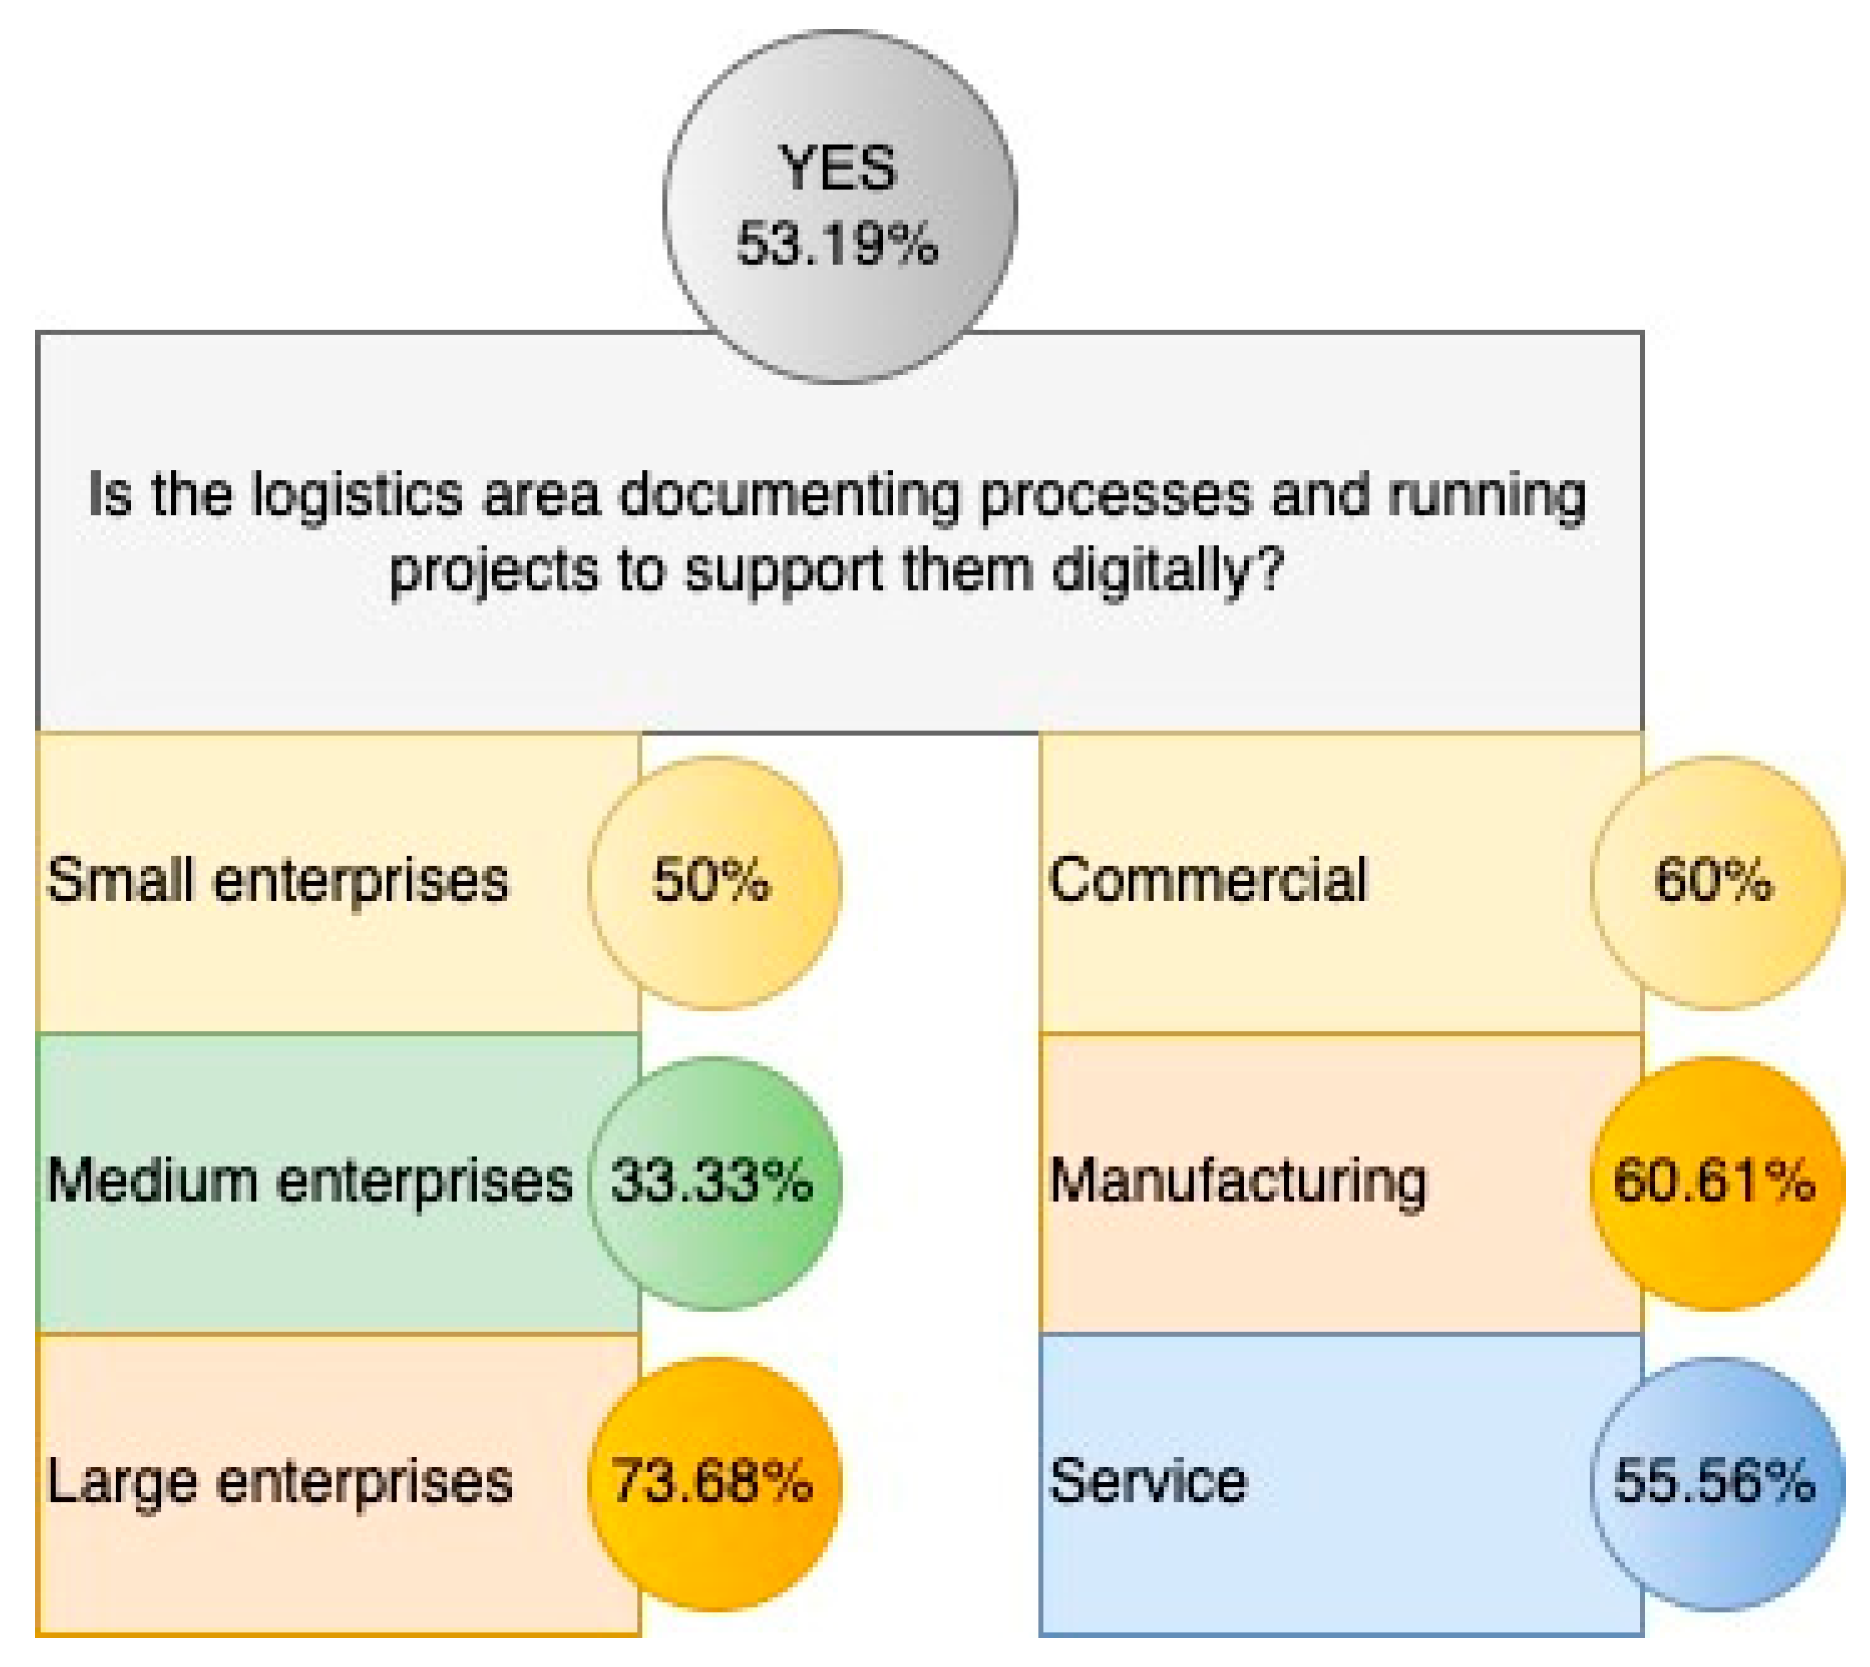
| Level 1—Basic | 70.00% | 50.00% | 73.68% |
| Level 2—Discovery | 40.00% | 33.33% | 73.98% |
| Level 3—Developed | 60.00% | 44.44% | 63.16% |
| Level 4—Integrated | 30.00% | 27.78% | 42.11% |
| Level 5—Leadership | 30.00% | 16.67% | 26.32% |
| Commercial | Manufacturing | Service | |
|---|---|---|---|
| Level 1—Basic | 60.00% | 63.64% | 66.67% |
| Level 2—Discovery | 20.00% | 54.55% | 55.56% |
| Level 3—Developed | 20.00% | 63.64% | 44.44% |
| Level 4—Integrated | 20.00% | 39.39% | 22.22% |
| Level 5—Leadership | 20.00% | 24.24% | 22.22% |
| Response “YES” (Total) | Small Enterprise | Medium Enterprise | Large Enterprise | |
|---|---|---|---|---|
| Does the enterprise measure process performance based on defined procedures, indicators and targets in the logistics area? | 66% | 60.00% | 55.56% | 78.95% |
| Does the company use digital technologies to measure process performance in the logistics area? | 51% | 50.00% | 27.78% | 73.68% |
| Response “YES” (Total) | Commercial | Manufacturing | Service | |
|---|---|---|---|---|
| Does the enterprise measure process performance based on defined procedures, indicators and targets in the logistics area? | 66% | 60.00% | 63.64% | 66.67% |
| Does the company use digital technologies to measure process performance in the logistics area? | 51% | 60.00% | 54.55% | 33.33% |
| Response “YES” (Total) | Small Enterprise | Medium Enterprise | Large Enterprise | |
|---|---|---|---|---|
| Does the company use process performance measurement with integrated data provided in real-time from various sources (including business partners) in the area of logistics? | 29.79% | 50.00% | 11.11% | 36.84% |
| Does the company use optimized process performance measurement that incorporates data from business partners in the area of logistics? | 27.66% | 30.00% | 22.22% | 31.58% |
| Response “YES” (Total) | Commercial | Manufacturing | Service | |
|---|---|---|---|---|
| Does the company use process performance measurement with integrated data provided in real-time from various sources (including business partners) in the area of logistics? | 29.79% | 20.00% | 30.30% | 33.33% |
| Does the company use optimized process performance measurement that incorporates data from business partners in the area of logistics? | 27.66% | 40.00% | 27.27% | 22.22% |
| Small Enterprise | Medium Enterprise | Large Enterprise | |
|---|---|---|---|
| Level 1—Basic | 60.00% | 55.56% | 78.95% |
| Level 2—Discovery | 50.00% | 27.78% | 73.68% |
| Level 3—Developed | 40.00% | 16.67% | 47.37% |
| Level 4—Integrated | 50.00% | 11.11% | 36.84% |
| Level 5—Leadership | 30.00% | 22.22% | 31.58% |
| Commercial | Manufacturing | Service | |
|---|---|---|---|
| Level 1—Basic | 60.00% | 63.64% | 66.67% |
| Level 2—Discovery | 60.00% | 54.55% | 33.33% |
| Level 3—Developed | 20.00% | 36.36% | 33.33% |
| Level 4—Integrated | 20.00% | 30.30% | 33.33% |
| Level 5—Leadership | 40.00% | 27.27% | 22.22% |
| Small Enterprise | Medium Enterprise | Large Enterprise | |
|---|---|---|---|
| Level 1—Basic | 80.00% | 72.22% | 78.95% |
| Level 2—Discovery | 50.00% | 22.22% | 21.05% |
| Level 3—Developed | 30.00% | 11.11% | 31.58% |
| Level 4—Integrated | 20.00% | 5.56% | 15.79% |
| Level 5—Leadership | 0.00% | 5.56% | 5.26% |
| Commercial | Manufacturing | Service | |
|---|---|---|---|
| Level 1—Basic | 80.00% | 75.76% | 77.78% |
| Level 2—Discovery | 0.00% | 24.24% | 55.56% |
| Level 3—Developed | 0.00% | 21.21% | 44.44% |
| Level 4—Integrated | 0.00% | 15.15% | 11.11% |
| Level 5—Leadership | 0.00% | 6.06% | 0.00% |
| Small Enterprise | Medium Enterprise | Large Enterprise | |
|---|---|---|---|
| Level 1—Basic | 60.00% | 66.67% | 73.68% |
| Level 2—Discovery | 50.00% | 55.56% | 52.63% |
| Level 3—Developed | 40.00% | 5.56% | 36.84% |
| Level 4—Integrated | 40.00% | 5.56% | 21.05% |
| Level 5—Leadership | 30.00% | 16.67% | 21.05% |
| Commercial | Manufacturing | Service | |
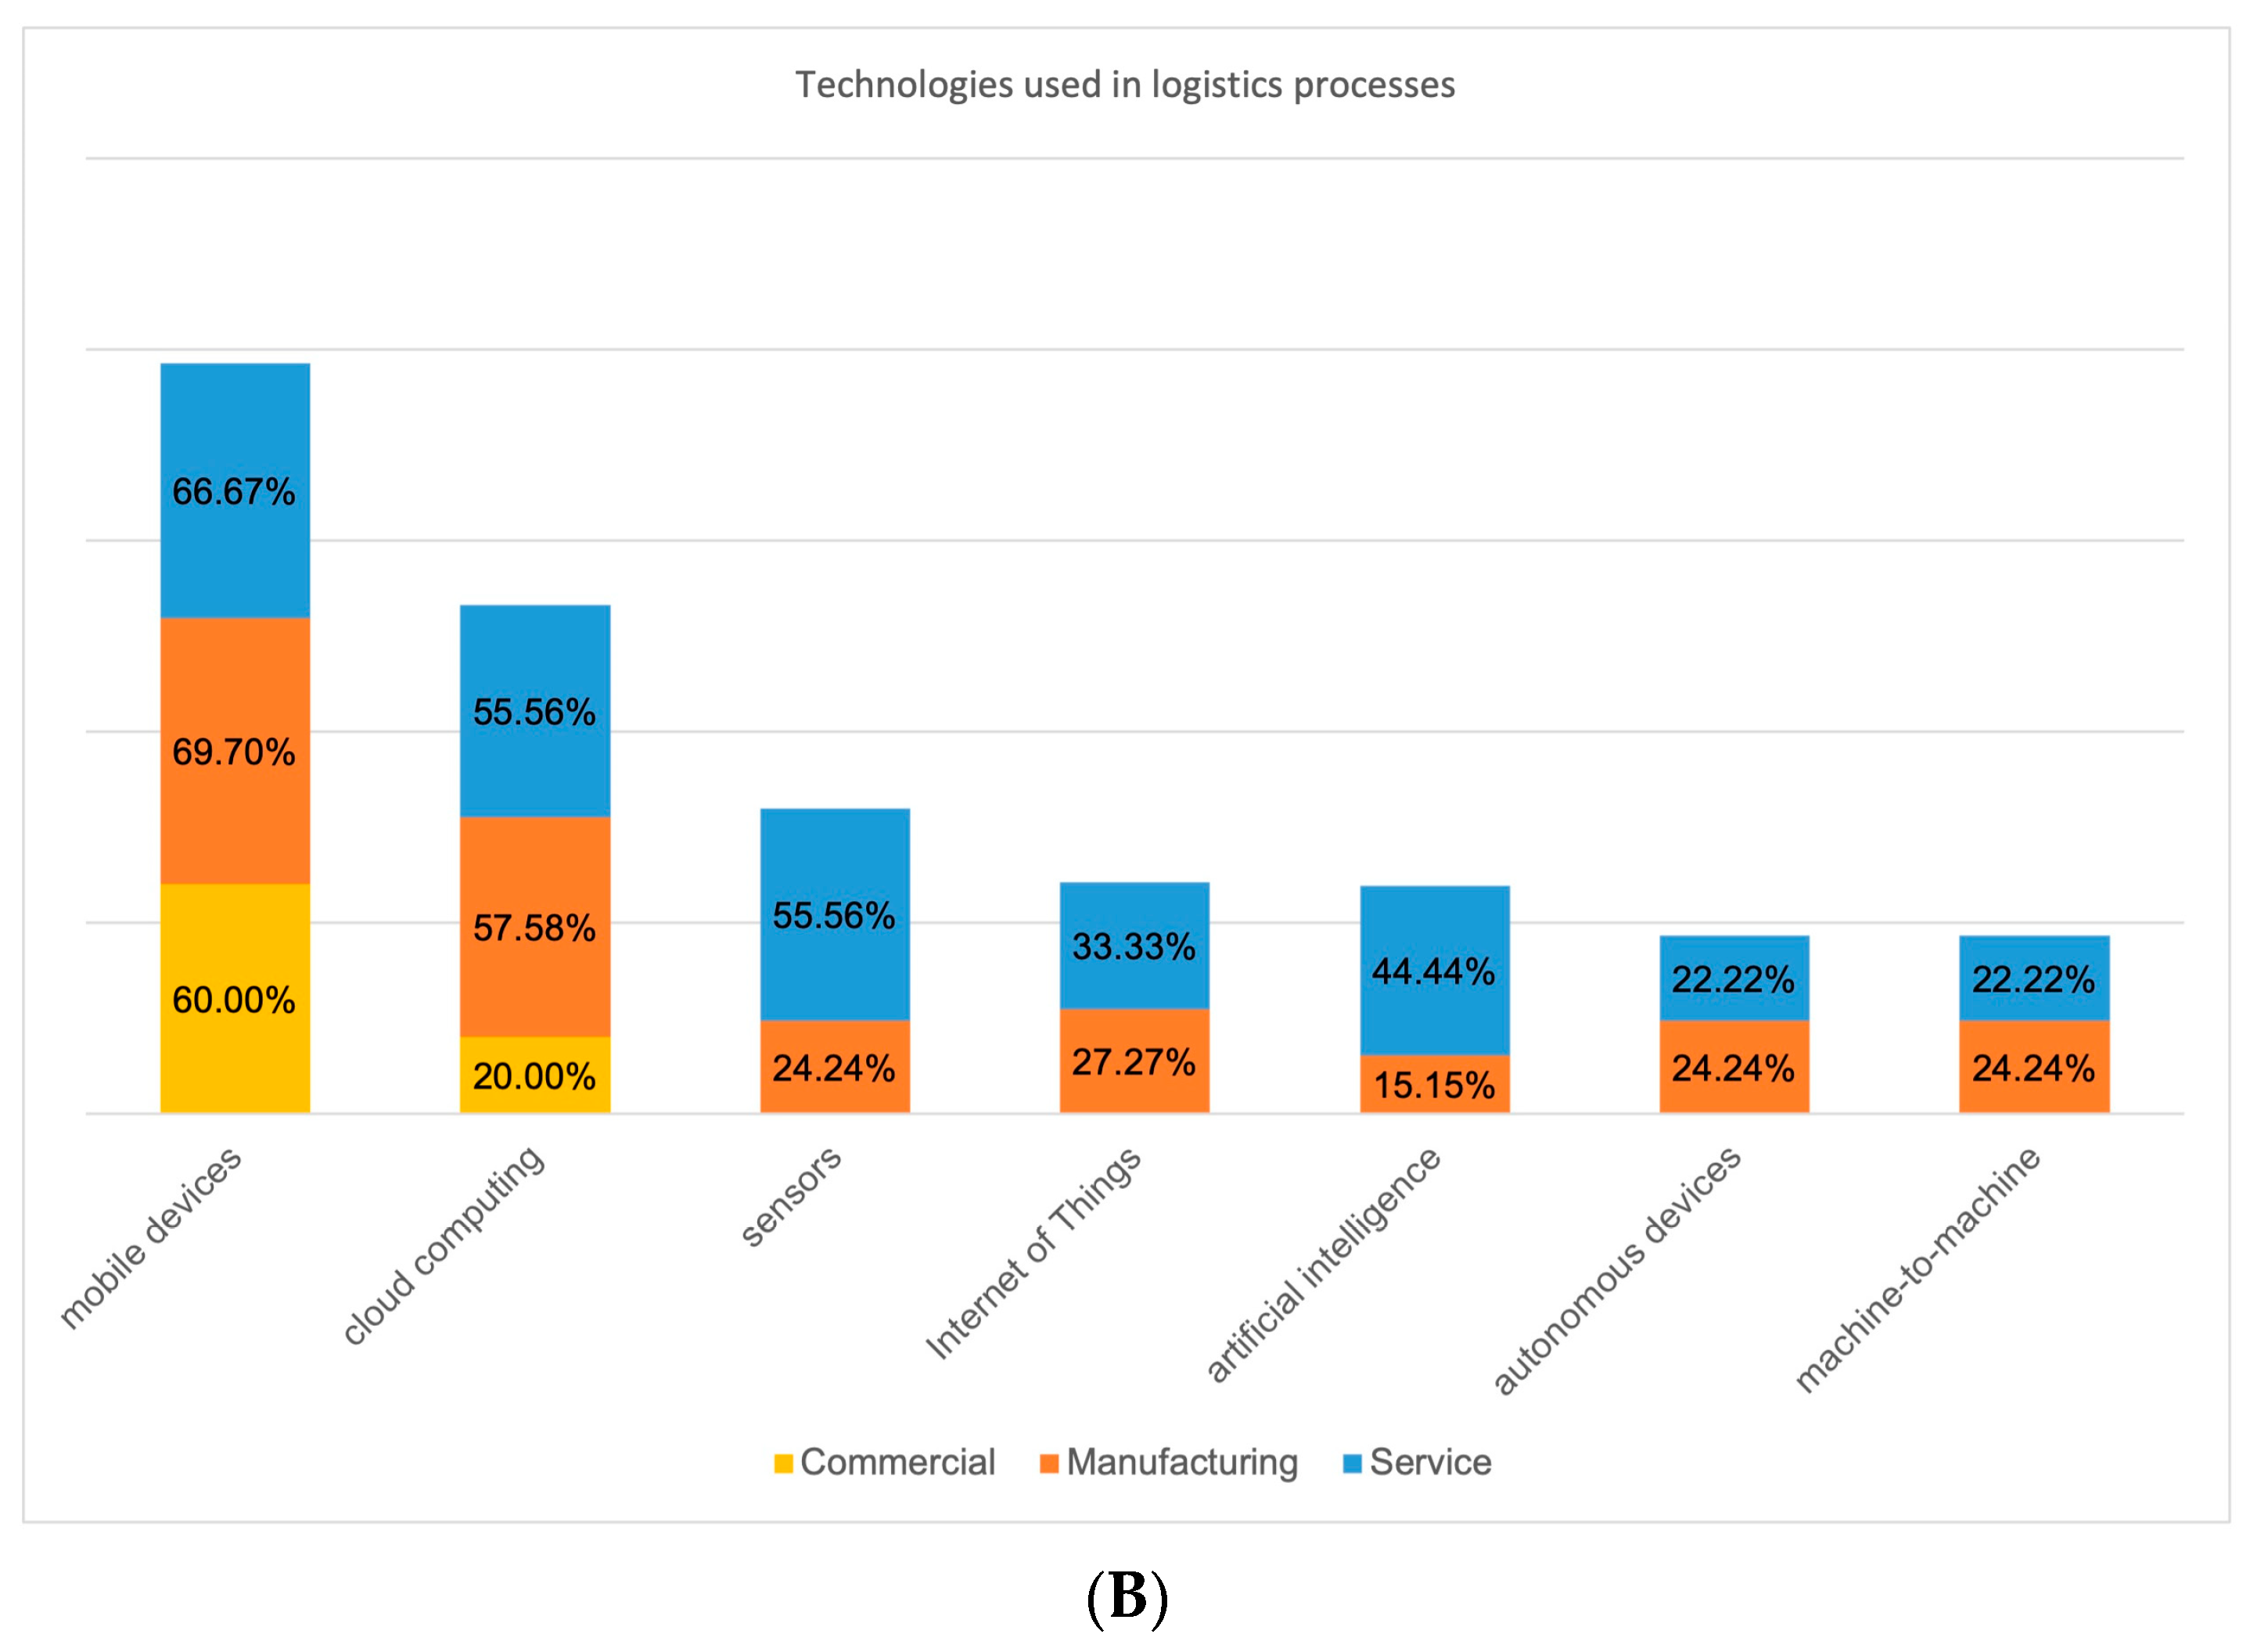
|---|---|---|---|
| Level 1—Basic | 60.00% | 69.70% | 66.67% |
| Level 2—Discovery | 20.00% | 57.58% | 55.56% |
| Level 3—Developed | 0.00% | 27.27% | 33.33% |
| Level 4—Integrated | 0.00% | 15.15% | 44.44% |
| Level 5—Leadership | 0.00% | 24.24% | 22.22% |
Disclaimer/Publisher’s Note: The statements, opinions and data contained in all publications are solely those of the individual author(s) and contributor(s) and not of MDPI and/or the editor(s). MDPI and/or the editor(s) disclaim responsibility for any injury to people or property resulting from any ideas, methods, instructions or products referred to in the content. |
© 2024 by the authors. Licensee MDPI, Basel, Switzerland. This article is an open access article distributed under the terms and conditions of the Creative Commons Attribution (CC BY) license (https://creativecommons.org/licenses/by/4.0/).
Share and Cite
Tubis, A.A.; Koliński, A.; Poturaj, H. Digital Maturity of Logistics Processes Assessed in the Areas of Technological Support for Performance Measurement, Employees, and Process Management. Appl. Sci. 2024, 14, 7893. https://doi.org/10.3390/app14177893
Tubis AA, Koliński A, Poturaj H. Digital Maturity of Logistics Processes Assessed in the Areas of Technological Support for Performance Measurement, Employees, and Process Management. Applied Sciences. 2024; 14(17):7893. https://doi.org/10.3390/app14177893
Chicago/Turabian StyleTubis, Agnieszka A., Adam Koliński, and Honorata Poturaj. 2024. "Digital Maturity of Logistics Processes Assessed in the Areas of Technological Support for Performance Measurement, Employees, and Process Management" Applied Sciences 14, no. 17: 7893. https://doi.org/10.3390/app14177893
APA StyleTubis, A. A., Koliński, A., & Poturaj, H. (2024). Digital Maturity of Logistics Processes Assessed in the Areas of Technological Support for Performance Measurement, Employees, and Process Management. Applied Sciences, 14(17), 7893. https://doi.org/10.3390/app14177893


