
Game Analysis of Different Transportation Modes in a Corridor Considering Carbon Emission Costs


Abstract
:1. Introduction
- A comprehensive utility function that integrates five key factors: transportation cost, speed, safety, reliability, and convenience.
- The introduction of carbon emission tax as a crucial component of transportation costs, with a quantitative analysis of its impact on transportation mode selection.
- Empirical validation of the model’s effectiveness, providing theoretical support for policymakers and logistics enterprises.
2. Problem
3. Game Model
3.1. Shipper’s Payoff
- (1)
- Freight rate: represents the freight rate of mode . The freight rate is the actual cost that the shipper needs to pay when choosing the transportation service. In this paper, freight rate is used as a decision variable in the game between various modes of transportation, and in the game between the shipper and various modes of transportation.
- (2)
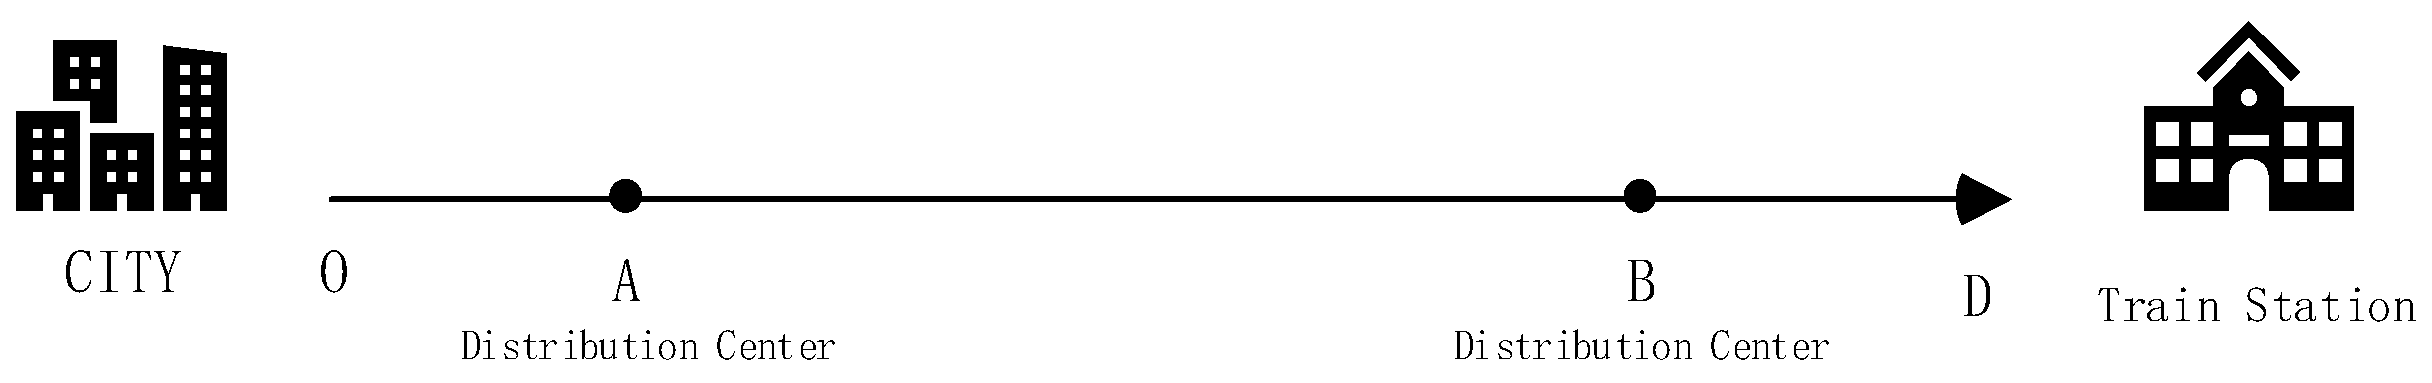
- Timeliness: represents the timeliness index of mode . In this paper, the total transportation time refers to the time from the collection of express goods to the arrival of express goods at their destination. As shown in the diagram in Figure 1.
- (3)
- Safety: represents the safety index of the transportation mode . The safe delivery of goods means minimizing the rate of damaged goods and the rate of transportation accidents. Therefore, the rate of intact goods and the rate of transportation accidents are used to quantify the safety index:where represents the rate of intact goods by mode . And represents the accident rate by mode .
- (4)
- Reliability: represents the reliability index of the transportation mode . According to the above analysis, weather is the factor that has the greatest influence on transportation modes from the outside world. This paper mainly discusses the influence of weather changes on the transportation process and uses the punctuality rate of the transportation mode to quantify the reliability index.
- (5)
- Convenience: represents the convenience index of the transportation mode . The convenience index will be quantified according to the data obtained from the survey of shippers.
3.2. Payoff of Four Modes of Transportation
3.3. Dynamic Game Model
- (1)
- All participants, including modes of transport and consignors, are presumed to be rational in the economic sense, engaging in competition with the primary aim of maximizing their personal benefits.
- (2)
- Acting on rational grounds, the consignor selects the transportation mode that promises the highest utility, disregarding influences from non-utility factors, such as previous engagements with any other transport mode.
- (3)
- The transport capacity available from various modes within the express delivery corridor exceeds the total demand from consignors.
3.4. Discussion of Equilibrium
4. Model Application
4.1. Case Description
4.2. Index Calculation of Generalized Income of Four Transportation Modes
4.3. Calculation Model Equilibrium Solution
4.4. Equilibrium Solution Analysis
5. Conclusions
Author Contributions
Funding
Institutional Review Board Statement
Informed Consent Statement
Data Availability Statement
Conflicts of Interest
References
- Fu, Y.; Liu, H.; Zhang, S. Caculation Method for Carbon Dioxide Emission in the Life Cycle of high-speed railway. China Railw. Sci. 2013, 24, 5. [Google Scholar]
- D’Alfonso, T.; Jiang, C.; Bracaglia, V. Air transport and high-speed rail competition: Environmental implications and mitigation strategies. Transp. Res. Part A Policy Pract. 2016, 92, 261–276. [Google Scholar] [CrossRef]
- Wang, Y.; Guan, Z.; Zhang, Q. Railway opening and carbon emissions in distressed areas: Evidence from China’s state-level poverty-stricken counties. Transp. Policy 2023, 130, 55–67. [Google Scholar] [CrossRef]
- Doyme, K.; Dray, L.; O’Sullivan, A.; Schäfer, A. Simulating airline behavior: Application for the Australian domestic market. Transp. Res. Rec. 2019, 2673, 104–112. [Google Scholar] [CrossRef]
- Talebian, A.; Zou, B. A multi-stage approach to air-rail competition: Focus on rail agency objective, train technology and station access. J. Rail Transp. Plan. Manag. 2016, 6, 48–66. [Google Scholar] [CrossRef]
- Raturi, V.; Verma, A. Competition between High Speed Rail and Conventional Transport Modes: Market Entry Game Analysis on Indian Corridors. Netw. Spat. Econ. 2019, 19, 763–790. [Google Scholar] [CrossRef]
- Arencibia, A.I.; Feo-Valero, M.; García-Menéndez, L.; Román, C. Modeling mode choice for freight transport using advanced choice experiments. Transp. Res. Part A Policy Pract. 2015, 75, 252–267. [Google Scholar] [CrossRef]
- Gutiérrez-Hita, C.; Ruiz-Rua, A. Competition in the railway passenger market: The challenge of liberalization. Compet. Regul. Netw. Ind. 2019, 20, 178359171985873. [Google Scholar] [CrossRef]
- Sun, B.; Xu, Z.; Wei, M. Evolutionary Game Model of Civil Aviation and High-Speed Rail Interaction Strategies Based on the Passenger Ticket and Carbon Trading Prices. J. Adv. Transp. 2023, 2023, 7675900. [Google Scholar] [CrossRef]
- Yang, L.; Zhang, C.; Wu, X. Multi-Objective Path Optimization of Highway-Railway Multimodal Transport Considering Carbon Emissions. Appl. Sci. 2023, 13, 4731. [Google Scholar] [CrossRef]
- Namoun, A.; Tufail, A.; Mehandjiev, N.; Alrehaili, A.; Akhlaghinia, J.; Peytchev, E. An Eco-Friendly Multimodal Route Guidance System for Urban Areas Using Multi-Agent Technology. Appl. Sci. 2021, 11, 2057. [Google Scholar] [CrossRef]
- Yang, H.; Zhang, A. Effects of high-speed rail and air transport competition on prices, profits and welfare. Transp. Res. Part B Methodol. 2012, 46, 1322–1333. [Google Scholar] [CrossRef]
- Liu, T. Selection of Logistical Transportation Mode Based on Game Model and Its Application. Master’s Thesis, Wuhan University of Technology, Wuhan, China, 2008. [Google Scholar]
- Zhu, F.; Wu, X.; Cao, C. High-speed rail and air transport competition under high flight delay conditions in China: A case study of the Beijing-Shanghai corridor. Util. Policy 2021, 71, 101233. [Google Scholar] [CrossRef]
- Luo, J.; Chen, Y. Research on mode selection of freight transport based on risk preference theory. Int. J. Adv. Comput. Technol. 2012, 4, 138–146. [Google Scholar]
- Luo, J. Research on Model of Freight Transportation Mode Choice Based on Behavior Analysis. Ph.D. Dissertation, Wuhan University of Technology, Wuhan, China, 2012. [Google Scholar]
- Ma, J.; Wang, Y.; Jiang, X.; Wei, L. Revenue distribution models of air-rail intermodal transport based on game theory. J. Transp. Syst. Eng. Inf. Technol. 2021, 21, 23. [Google Scholar]
- Wang, H.; Meng, Q.; Zhang, X. Game-theoretical models for competition analysis in a new emerging liner container shipping market. Transp. Res. Part B Methodol. 2014, 70, 201–227. [Google Scholar] [CrossRef]
- Tian, W.; Zhou, X.; Zhang, Y.; Fang, Q.; Yang, M. Collaborative Allocation Method of En-Route Network Resources Based on Stackelberg Game Model. Appl. Sci. 2023, 13, 13292. [Google Scholar] [CrossRef]
- Guan, H.; Nishii, K. Study on Estimation of the Time Value in Freight Transport. J. Highw. Transp. Res. Dev. 2000, 17, 107–110. [Google Scholar]
- Wang, H.; Zhou, W.; Wang, Y.Q. Research on Methods for Value of Time Determination for Freight Transport. J. Highw. Transp. Res. Dev. 2004, 21, 131–133. [Google Scholar]
- He, Y.Q.; Mao, B.H.; Chen, T.S.; Yang, J. Mode share model of the high-speed passenger railway line and its application. J. China Railw. Soc. 2006, 28, 18–21. [Google Scholar]
- Zhang, W.Y. Game and Information Theory; Shanghai People’s Publishing House: Shanghai, China, 2004. [Google Scholar]
- Yang, Z. A Game Theoretical Model of Passenger Traffic Sharing Among Different Modes of Transport in Comprehensive Transportation Corridor. Master’s Thesis, Lanzhou Jiaotong University, Lanzhou, China, 2014. [Google Scholar]
- Xie, T.R. Comparative Research on carbon emission of transportation industry. China Transp. Rev. 2011, 08, 20–24. [Google Scholar]


| General-Speed Railway | HSR | Air | Highway | |
|---|---|---|---|---|
| Transportation mileage (km) | 676 | 570 | 550 | 650 |
| Average operating speed (km/h) | 100 | 200 | 800 | 70 |
| Distance from cargo distribution center to urban area (km) | Lanzhou 0 Xi’an 0 | Lanzhou 0 Xi’an 0 | Lanzhou 70 Xi’an 30 | Lanzhou 0 Xi’an 0 |
| 0 | 0 | 0.6 | 0 | |
| 0 | 0 | 1.1 | 0 | |
| 99.7% | 99.7% | 99.54% | 91.9% | |
| 85% | 93% | 75% | 50% | |
| 0.5 | 0.8 | 0.9 | 0.6 |
| 1 | 2 | 3 | 4 | |
|---|---|---|---|---|
| 7.705 | 18.282 | 21.834 | 5.609 |
| 1 | 2 | 4 | 3 | 5 | |
| 1/2 | 1 | 1 | 2 | 4 | |
| 1/4 | 1 | 1 | 2 | 4 | |
| 1/3 | 1/2 | 1/2 | 1 | 5 | |
| 1/5 | 1/4 | 1/4 | 1/5 | 1 |
| 1 | 2 | 3 | 4 | 5 | |
|---|---|---|---|---|---|
| 0.434 | 0.204 | 0.183 | 0.134 | 0.045 |
| k | 1 | 2 | 3 | 4 |
|---|---|---|---|---|
| 0.510 | 3.672 | 3.508 | 0.670 |
| Parameter | 1 | 2 | 3 | 4 |
|---|---|---|---|---|
| 15,000,000 | 25,000,000 | 45,450,000 | 30,000 | |
| 30 | 42 | 95 | 210 | |
| [25] | 0.217 | 0.150 | 14.336 | 1.218 |
| 1 | 2 | 3 | 4 | |
|---|---|---|---|---|
| Freight rate (CNY/ton) | 2000 | 1200 | 2800 | 250 |
| Transportation Modes | Initial Tariff Strategy Set (CNY/Ton) |
|---|---|
| HSR | [1200,1400,1600,1800,2000,2200,2400,2600,2800] |
| Highway | [720,840,960,1080,1200,1320,1440,1560,1680] |
| Air | [1680,1960,2240,2520,2800,3080,3360,3640,3920] |
| General-speed railway | [150,175,200,225,250,275,300,325,350] |
| Optimal Solution | (CNY) | (CNY) | (%) | |
|---|---|---|---|---|
| High-speed railway | 1964.6 | 1964.1 | 48 | 21,307 |
| Expressway | 1395 | 1394.3 | 6 | 1707 |
| Transport aviation | 2591.5 | 2590.7 | 42 | 24,225 |
| General railway | 234.76 | 234.66 | 4 | 190 |
| Transportation Modes | Initial Tariff Strategy Set (CNY/ton) |
|---|---|
| High-speed railway | [1000,1200,1400,1600,1800,2000,2200, 2400,2600,2800,3000] |
| Expressway | [600,720,840,960,1080,1200,1320,1440,1560,1680,1800] |
| Transport aviation | [1400,1680,1960,2240,2520,2800,3080,3360,3640,3920,4200] |
| General railway | [125,150,175,200,225,250,275,300,325,350,375] |
Disclaimer/Publisher’s Note: The statements, opinions and data contained in all publications are solely those of the individual author(s) and contributor(s) and not of MDPI and/or the editor(s). MDPI and/or the editor(s) disclaim responsibility for any injury to people or property resulting from any ideas, methods, instructions or products referred to in the content. |
© 2024 by the authors. Licensee MDPI, Basel, Switzerland. This article is an open access article distributed under the terms and conditions of the Creative Commons Attribution (CC BY) license (https://creativecommons.org/licenses/by/4.0/).
Share and Cite
Xian, Y.; Li, Y.; Ma, C.; Wu, Z. Game Analysis of Different Transportation Modes in a Corridor Considering Carbon Emission Costs. Appl. Sci. 2024, 14, 6495. https://doi.org/10.3390/app14156495
Xian Y, Li Y, Ma C, Wu Z. Game Analysis of Different Transportation Modes in a Corridor Considering Carbon Emission Costs. Applied Sciences. 2024; 14(15):6495. https://doi.org/10.3390/app14156495
Chicago/Turabian StyleXian, Yong, Yinzhen Li, Changxi Ma, and Zichao Wu. 2024. "Game Analysis of Different Transportation Modes in a Corridor Considering Carbon Emission Costs" Applied Sciences 14, no. 15: 6495. https://doi.org/10.3390/app14156495
APA StyleXian, Y., Li, Y., Ma, C., & Wu, Z. (2024). Game Analysis of Different Transportation Modes in a Corridor Considering Carbon Emission Costs. Applied Sciences, 14(15), 6495. https://doi.org/10.3390/app14156495