Article

Aerodynamic Optimization and Characterization of a Ducted Tail for a Box-Launched Aircraft

1
The Institute of Engineering Thermophysics, Chinese Academy of Sciences, Beijing 100190, China
2
University of Chinese Academy of Sciences, Beijing 100049, China
*
Author to whom correspondence should be addressed.
Appl. Sci. 2024, 14(15), 6496; https://doi.org/10.3390/app14156496
Submission received: 15 June 2024 / Revised: 16 July 2024 / Accepted: 19 July 2024 / Published: 25 July 2024
(This article belongs to the Special Issue Applications of Aerodynamics in Aeronautical Engineering)

Abstract

:
The tail wing of box-launched aircraft needs to be folded in the launch box, which can easily cause malfunctions during flight deployment. This article presents a ducted tail wing aircraft that does not require folding of the tail wing. To address the nonlinear problem of lift coefficient in the ducted tail, an aerodynamic optimization method for ducted tails based on the sparrow search algorithm with back-propagation (SSA-BP) neural network approximate model and multi-objective genetic algorithm fusion is proposed, with the goal of improving the lift-to-drag ratio and linearization degree of the lift curve. The linearization degree of the optimized tail lift coefficient curve is significantly improved, and the lift-to-drag ratio is significantly improved under cruising conditions. Based on this optimization result, the shape of the tail wing and fuselage combination was optimized, and the optimal configuration of the ducted tail wing aircraft was selected, providing a reference for the design of ducted tail wing aircraft.

1. Introduction

Box-launched aircraft have the advantages of storage and transportation integration and modularization, which can greatly save storage space. A single launch platform can load multiple aircraft for flexible launch, which greatly improves the combat effectiveness of the aircraft. However, in order to be stored in the launch box, the aircraft’s main and tail wings need to be folded, and they need to be quickly unfolded after launch to provide sufficient lift and control torque. The main and tail wings are prone to mechanical failure during the unfolding process, and the aerodynamic force on the aircraft exhibits a nonlinear change process, which is not favorable to flight control of the aircraft. At the same time, there is a step gap at the joint of the folding structure, which is not conducive to the stealth characteristics of the aircraft [1,2,3]. Therefore, in order to improve the comprehensive performance of folding-wing aircraft, it is of great significance to optimize the design of aerodynamics, structure and control of folding-wing aircraft.
Folded-wing aircraft often exhibit non-constant and non-linear aerodynamic characteristics during morphing, and traditional computational fluid dynamics (CFD) methods are unable to quickly obtain accurate aerodynamic parameters of the aircraft, which causes difficulties in flight control [4,5]. Ref. [4] takes a folded-wing aircraft with variable sweep-back angle as the research object, and proposes a cross-prediction model based on the fusion of deep learning and multi-task optimization methods, which takes the angle of attack, time, and sweep-back angle as the input variables, and outputs the non-constant force and moment coefficients through multi-layer nonlinear mapping, so that the non-constant aerodynamic parameters can be obtained in a few seconds for any angle of attack and any morphing state. Ref. [5] takes the coupling effect between aircraft aerodynamic performance and control capability as a design constraint, takes a barrel-launched aircraft as a research object, and proposes an optimal design method for the aerodynamic layout of a folded-wing aircraft considering the coupling of multiple control surfaces and control capability. Multi-objective optimization based on the alternative model matrix was carried out using the neighborhood cultivation algorithm, which resulted in a 28.36% increase in the lift-to-drag ratio of the aircraft and a 164.29% increase in the space of handling moments, and provided a reference for the aerodynamic layout design of barrel-launched aircraft. Ref. [6] designed an aircraft with simultaneously varying wingspan and swept-back angle, investigated the lift-drag characteristics of the aircraft in five different flight modes, performed finite element analysis of the approximate pressure on the aircraft wing under load and specific boundary conditions, and made a comprehensive assessment of aerodynamic performance and structural reliability in the transition phase. Refs. [7,8,9,10,11] proposed a reinforcement learning (RL)-based strategy for autonomous morphing aircraft. The proposed morphing strategy focuses on the sparse reward unreferenced decision problem induced by terminal performance goals and remote tasks, and establishes a two-layer variant flight control framework that decouples the design of the morphing strategy from the flight controller, resulting in an optimal morphing decision for the aircraft. Ref. [12] proposed a nonlinear control model for a morphing aircraft based on an adaptive neural network. A nonlinear model with six degrees of freedom is established, and a first-order smooth mode differentiator (FSMD) is used in the control scheme to avoid the “differential explosion” problem. A radial basis function neural network is introduced to estimate the model’s uncertainty and external disturbances, and an adaptive neural network controller is proposed based on this design. The stability of the proposed nonlinear neural network controller is demonstrated by Lyapunov theory, and the effectiveness and robustness of the method are verified by numerical simulation and hardware-in-the-loop simulation. In the research field of folded wing and morphing aircraft structure design, refs [1,2,3,13,14,15,16,17,18] and others designed a new type of wing-folding scheme, investigated the influence of wing thickness, hinge structure and other factors on the aerodynamic load distribution and hinge moment of folded wing aircraft, and proposed a structural design correction strategy based on the results of computational fluid dynamics and the structural strength of the coupling, to provide a basis for the optimal design of the structure of folded wing and morphing aircraft. Ref. [19] proposed an approximate global modal method (AGMM) to deal with complex boundary conditions, and analyzed the nonlinear flutter vibration of a folded wing composed of independent rectangular plates. A high-precision low-dimensional dynamic model of the folded wing is established, and the modal results of the AGMM model are compared and analyzed with those of the equivalent finite element model, and verified by forced vibration response experiments. On this basis, an AGMM model of aerodynamic loads for supersonic flight of a folded wing aircraft is further established. The critical flutter velocity and the aeroelastic response at different folding angles are comprehensively investigated by model-based simulation. Refs. [20,21] designed a folding wing based on inflatable and bionic elements, and based on the analysis of mechanical and geometric properties of flexible structure, the structural dynamics and even aeroelastic performance of the folding wing were improved through optimized design.
The tail of the box-launched aircraft must be folded, and this complex structural design can easily cause mechanical failure. Therefore, it is important to design a box-type launch aircraft without folding tail based on the size constraints of the launch box and the aerodynamic optimization method. There are few studies on the aerodynamic optimization of the tail of a box-launched aircraft. However, the academic community has done a lot of research in the field of aircraft aerodynamic optimization, which provides research ideas for this paper. Refs. [22,23,24,25] took the flying wing layout aircraft as a research object, and based on the free-form deformation (FFD) method, computational fluid dynamics (CFD), sequential quadratic programming (SQP) algorithm, and multidisciplinary design optimization (MDO), they carried out a comprehensive optimization of the aerodynamic and stealth performance of a flying wing layout aircraft, and achieved remarkable results. Refs. [26,27,28] developed a fully automated framework specifically for high-fidelity multidisciplinary design optimization of aircraft wings. The framework employs an approximate-model-based optimization strategy, and the reliability of the optimization framework is investigated through a high-speed airliner wing design optimization case study. Ref. [29] parametrically modeled a horizontal tail and optimized its aerodynamic performance using a multi-objective genetic algorithm to improve the cruise performance while designing the optimal horizontal tail that can meet safety requirements such as civil aviation regulations. Refs. [30,31] investigated the influence of the wing on the wake flow field in subsonic flow, and proposed an analytical subsonic flow model based on the response surface method to calculate the lift characteristics of the wake in the vicinity of a low aspect ratio swept-back wing. The experimental wind tunnel data are compared with the data predicted by the model to verify the accuracy of the analytical model of the main wing’s effect on the tail flow field. Ref. [32] optimizes the V-tail pitch angle of a supersonic missile with stealth characteristics and safe flight as the comprehensive optimization objectives, and uses an improved annealing algorithm to determine the optimal solution of the V-tail pitch angle. Refs. [33,34,35,36] took a distributed power wing design method with chordwise loop volume as a distributed objective, compared and analyzed the influence of the power wing ducted wall length and chordwise position on the design results under the conditions of maintaining lift and pitching moment, and optimized the power wing shape based on a multi-objective genetic algorithm; the results showed that the optimization results of the optimization method had an average relative error compared with the design objective of only 5%, which verifies the effectiveness of the method.
The above literature represents much research on the aerodynamics, structure, control, and aerodynamic optimization of folding wing and morphing aircrafts, but there is little research on the new non-folding tail and its aerodynamic optimization. In this paper, a ducted-tailed aircraft with a tail that does not need to be folded is designed, its tail is aerodynamically optimized, and the overall aerodynamic characteristics of the aircraft are analyzed. The specific contributions are as follows.
(1) A ducted tail is designed, which does not need to be folded in the launch box and does not need to be unfolded after launch from the box; the lift generated by the ducted effect can be utilized to improve the static stability of the aircraft, and at the same time improve the reliability of the structure.
(2) In order to improve the degree of linearization of the lift coefficient curve of the ducted tail, the relative positions of the tail and the fuselage are optimized. Based on the parametric model of the ducted tail and fuselage combination, the aerodynamic data set of the sample model is generated by the computational fluid dynamics method. Then, the SSA-BP approximate model between the design parameters and the lift-drag curve is established, and the design parameters are optimized based on the multi-objective genetic algorithm to achieve the best relative position of the ducted tail and fuselage.
(3) Based on the optimization results of the multi-objective genetic algorithm, the combination of ducted tail and fuselage is refined to generate two optimized configurations, and the optimal configuration of this ducted tail aircraft is determined by means of aerodynamic characteristic analysis, which significantly improves the lift-to-drag ratio and static stability compared with the basic configuration.
The remainder of this paper is organized as follows. In Section 2, the research object and problem concerned in this paper are stated. Section 3 states parametric modeling and numerical simulation methods for the research object. In Section 4, the general aerodynamic optimization framework of the ducted tail is described, along with the experimental design and approximate model selection. Then, the supportive optimization results are presented and discussed in Section 5. Finally, Section 6 summarizes this work and gives some conclusions.

2. Research Object and Problem Description

As shown in Figure 1a, in order to perform a maneuverable and flexible strike mission, a typical aircraft needs to fold its wings and tail in order to be stored in a launch box for launching; the wings and tail are then deployed to perform the mission, which can result in malfunctions during the deployment process. Especially for the tail, debris scattered during the launching process are more likely to hit the tail, thus making the deployment structure of the tail ineffective, resulting in the tail not being able to deploy smoothly, and leading to mission failure. Therefore, the aircraft studied in this paper avoids a folding-tail design. As shown in Figure 1b, the tail wing adopts a ducted configuration; the purpose of this design is that the tail wing of the aircraft does not need to be folded in the launch box nor unfolded after launching from the box, and the lift generated by the ducted effect can be utilized to improve the static stability of the aircraft’s pitching. As shown in Figure 1c, the aircraft tail also eliminates the traditional mechanical rudder, and an active jet virtual rudder is designed at the trailing edge of the ducted-type tail to realize pitch control of the aircraft, which can effectively improve the stealth performance of the aircraft.
However, there are two typical shortcomings in the above design. The ducted tail is located around the fuselage and there is airflow coupling with the fuselage. There will be a lift coefficient nonlinearity problem under different angles of attack, which is not favorable to linear control of the aircraft. Meanwhile, the space of the ducted tail structure is limited, the arrangement of a traditional mechanical deflection rudder will increase the complexity of structural design, and it is not conducive to the stealth performance of the aircraft. Therefore, with the goal of improving the aerodynamic performance of the ducted tail, optimizing the optimal relative position between the tail and fuselage and the shape of the duct based on the design space constraints to achieve linear static stability of the aircraft is one of the focuses of this paper. Another key research element is to evaluate the effectiveness of the active jet virtual control rudder surface, so that the ducted tail can control pitching maneuvers of the aircraft. In this paper, only the aerodynamic optimization and aerodynamic characteristic analysis of the ducted tail is studied.

3. Parametric Modeling and Numerical Simulation Methods

3.1. Parametric Modeling

The relative position of the ducted tailplane to the fuselage is used as the basis for parametric modeling. As shown in Figure 1, the airfoil of the tail is NACA (National Advisory Committee for Aeronautics)-0012. On the premise that the total fuselage length, fuselage forward section (fuselage section corresponding to L1 and L2), tail chord length, installation angle, and fuselage sections cross-section are fixed values, parametric modeling is carried out for the vertical distance between the ducted-type tail and fuselage, horizontal distance, and dimensions of fuselage sections. A list of design parameters is generated, and the range of parameters is specified, so as to facilitate the subsequent test and design. The selection of Latin square samples and aerodynamic analysis calculation in the design are optimized. The relative position parameters of the ducted tail to the fuselage are shown in Table 1.

3.2. Numerical Simulation and Mesh-Independent Analysis

3.2.1. CFD Method Validation

In this paper, CFD calculations are performed using the commercial numerical simulation software FLUENT-2021, and the spatial discretization is calculated using the Riemann-Oreskovich-Eager (ROE) format of second-order windward MUSCL (Monotone Upstream Centered Scheme for Conservation Laws) interpolation. The temporal discretization and advancement are performed using the implicit AF (Approximate Factorization) method. The coupled Shear-Stress Transport ( k ω SST) turbulence model is used to solve the Reynolds-Averaged Navier-Stokes (RANS) equations for the problem of coupling the internal flow of the ducted wake with the external flow of the fuselage. Among them, the k ω SST turbulence model is a two-equation hybrid model that has been widely used in engineering, which uses the standard k ω model for calculations in the pure turbulence region away from the wall, and retains the robustness of the Wilcox k ω model in the near-wall region using a variety of pressure gradient boundary layer problems.

3.2.2. Mesh-Independent Analysis

In order to verify that the meshing and the numerical simulation methods in this paper are independent of each other, 2 models were chosen for validation, the clean NACA0012 wing model and the ducted tail model. Figure 2a shows the mesh model of a NACA0012 wing, which adopts Poly-Hexcore unstructured hybrid mesh, and the thickness of the first layer of mesh on the surface of the wall is 5 × 10⁻⁶ m, which satisfies the requirements of viscous computation. The local mesh encryption is carried out on the leading and trailing edges of the NACA0012 wing model; the computational domain is square, and the dimensions of the computational domain are 10 times of the length of the feature. The computational region boundary condition is pressure far field, and the wall is bounded by no-slip mesh. Figure 2b shows the mesh model of the ducted tail, using Poly-Hexcore unstructured hybrid mesh. The thickness of the first layer of mesh on the surface of the tail is 3 × 10⁻⁶ m, which meets viscous calculation requirements. The ducted tail model locally encloses the mesh in the coupling region between the rear of the fuselage and the tail, the computational domain is square, and the dimensions of the computational domain are 10 times the length of the features. The computational region boundary condition is pressure far field, the wall is bounded by no-slip mesh, and in order to simulate the effect of the engine jet on the ducted tail, the fuselage tail is set as the velocity inlet boundary condition.
Due to the strong coupling relationship between the ducted tail and the fuselage, the efficiency and accuracy of numerical computation need to be considered comprehensively when performing the meshing. Therefore, the NACA0012 model selected for the tail, and the model before optimization of the ducted tail and fuselage assembly, are used to establish computational mesh models with different sparsity degrees, and to carry out the validation of mesh-independence and the assessment of numerical simulation accuracy. The basic information of the mesh is shown in Table 2, and the main differences are reflected in the first boundary layer meshes height, refined area meshes scale, and surface meshes scale settings.
As shown in Figure 3a, the NACA0012 airfoil is firstly selected for CFD calculation. The lift coefficient (CL) is 1.0034 when the meshes number is 210,000, the altitude is H = 0 m, the reference chord length is c r e f = 0.1   m , the Reynolds number is Re = 10 6 , and the angle of attack is 10°, and tends to be stable with the increase of the meshes number. In order to further verify the accuracy of the CFD calculation, as in Figure 3b, the CL value is simulated and calculated when the attack angle is −4°~16°, and compared with the wind tunnel test data [37]. In Figure 3b, the CL numerical simulation results match well with the wind tunnel data, the overall trend of the two groups of data is consistent, and the maximum error between numerical simulation and wind tunnel test data is ≤15%, so the numerical simulation accuracy meets the calculation requirements.
On the premise that the CFD calculation method of the NACA0012 airfoil meets the mesh-independence and calculation accuracy, the independence of the mesh of the ducted tail and fuselage combination base configuration is further verified. Typical working conditions are selected for checking, specifically altitude H = 0 m, incoming flow velocity 0.35 Ma, reference area S = 0.01 m2, reference chord length c r e f = 0.1   m , reference spread length 0.1 m, and angle of attack α = 0°. Table 3 shows the aerodynamic characteristic parameters calculated by different precision meshes. Taking the refined meshes calculation results as a benchmark, the medium meshes calculation error of the lift coefficient is very small, within 6%. However, the drag coefficient error is larger, reaching 23.6%, which is related to the large gap between the meshes height of its boundary layer and the meshes scale of the refined area. Considering the computational efficiency, this paper selects the medium meshes as the subsequent computational meshes.

4. Aerodynamic Optimization

4.1. General Optimization Framework

The general framework of ducted tail aerodynamic optimization is shown in Figure 4, which starts with parametric modeling and computational meshing of the ducted tail and fuselage combination of the aircraft, followed by design of experiments using optimized Latin-square sampling and using the acquired sample model lift-drag characteristics as the training parameter set. The SSA-BP approximate model is utilized to predict the lift-drag characteristics and generate the full sample space. Then, a multi-objective genetic algorithm is utilized to find the Pareto frontier solution in the full sample space and select the relative optimal solution from it. Finally, the optimal solutions in the previous step are refined and the optimization results are verified.
Especially for step 5 in Figure 4, since the traditional CFD calculation method consumes a large amount of computation time, an approximate modeling approach is needed to quickly obtain the aerodynamic characteristics of the aircraft under different geometric parameters. The approximate model proposed in this paper is based on the BP neural network and incorporates the SSA parameter optimization module to generate an SSA-BP high-precision approximate model, which solves the overfitting and local distortion problems of the BP neural network approximate model. The specific principles of the SSA-BP approximate model are detailed in Section 4.3.

4.2. Design of the Experiment

Design of experiments (DOE) uses optimized Latin square sampling [38,39], which has the distinctive feature of constructing a high-precision analytical model that is as close as possible to the actual model with fewer experimental samples, greatly reducing the amount of computation.
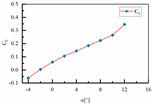
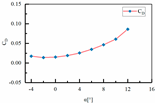
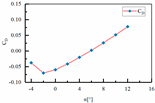
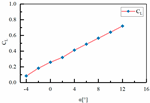
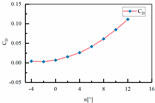
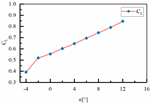
The basic number of tests required by the optimized Latin square method is (n + 1)(n + 2)/2, where n represents the number of parameters that are not related to each other, and there are four parameters for the relative position of the ducted tail and fuselage assembly, which should result in 15 tests. Two times the number of models is chosen to make the results more accurate, so the number of model sample points is 30, and the lift coefficient and drag coefficient in the range of −4~12° of the attack angle are calculated by the CFD method using these 30 sets of models. All the sample data are not listed one by one. Table 4 lists the aerodynamic data of eight groups of sample models.

4.3. Approximate Model Selection

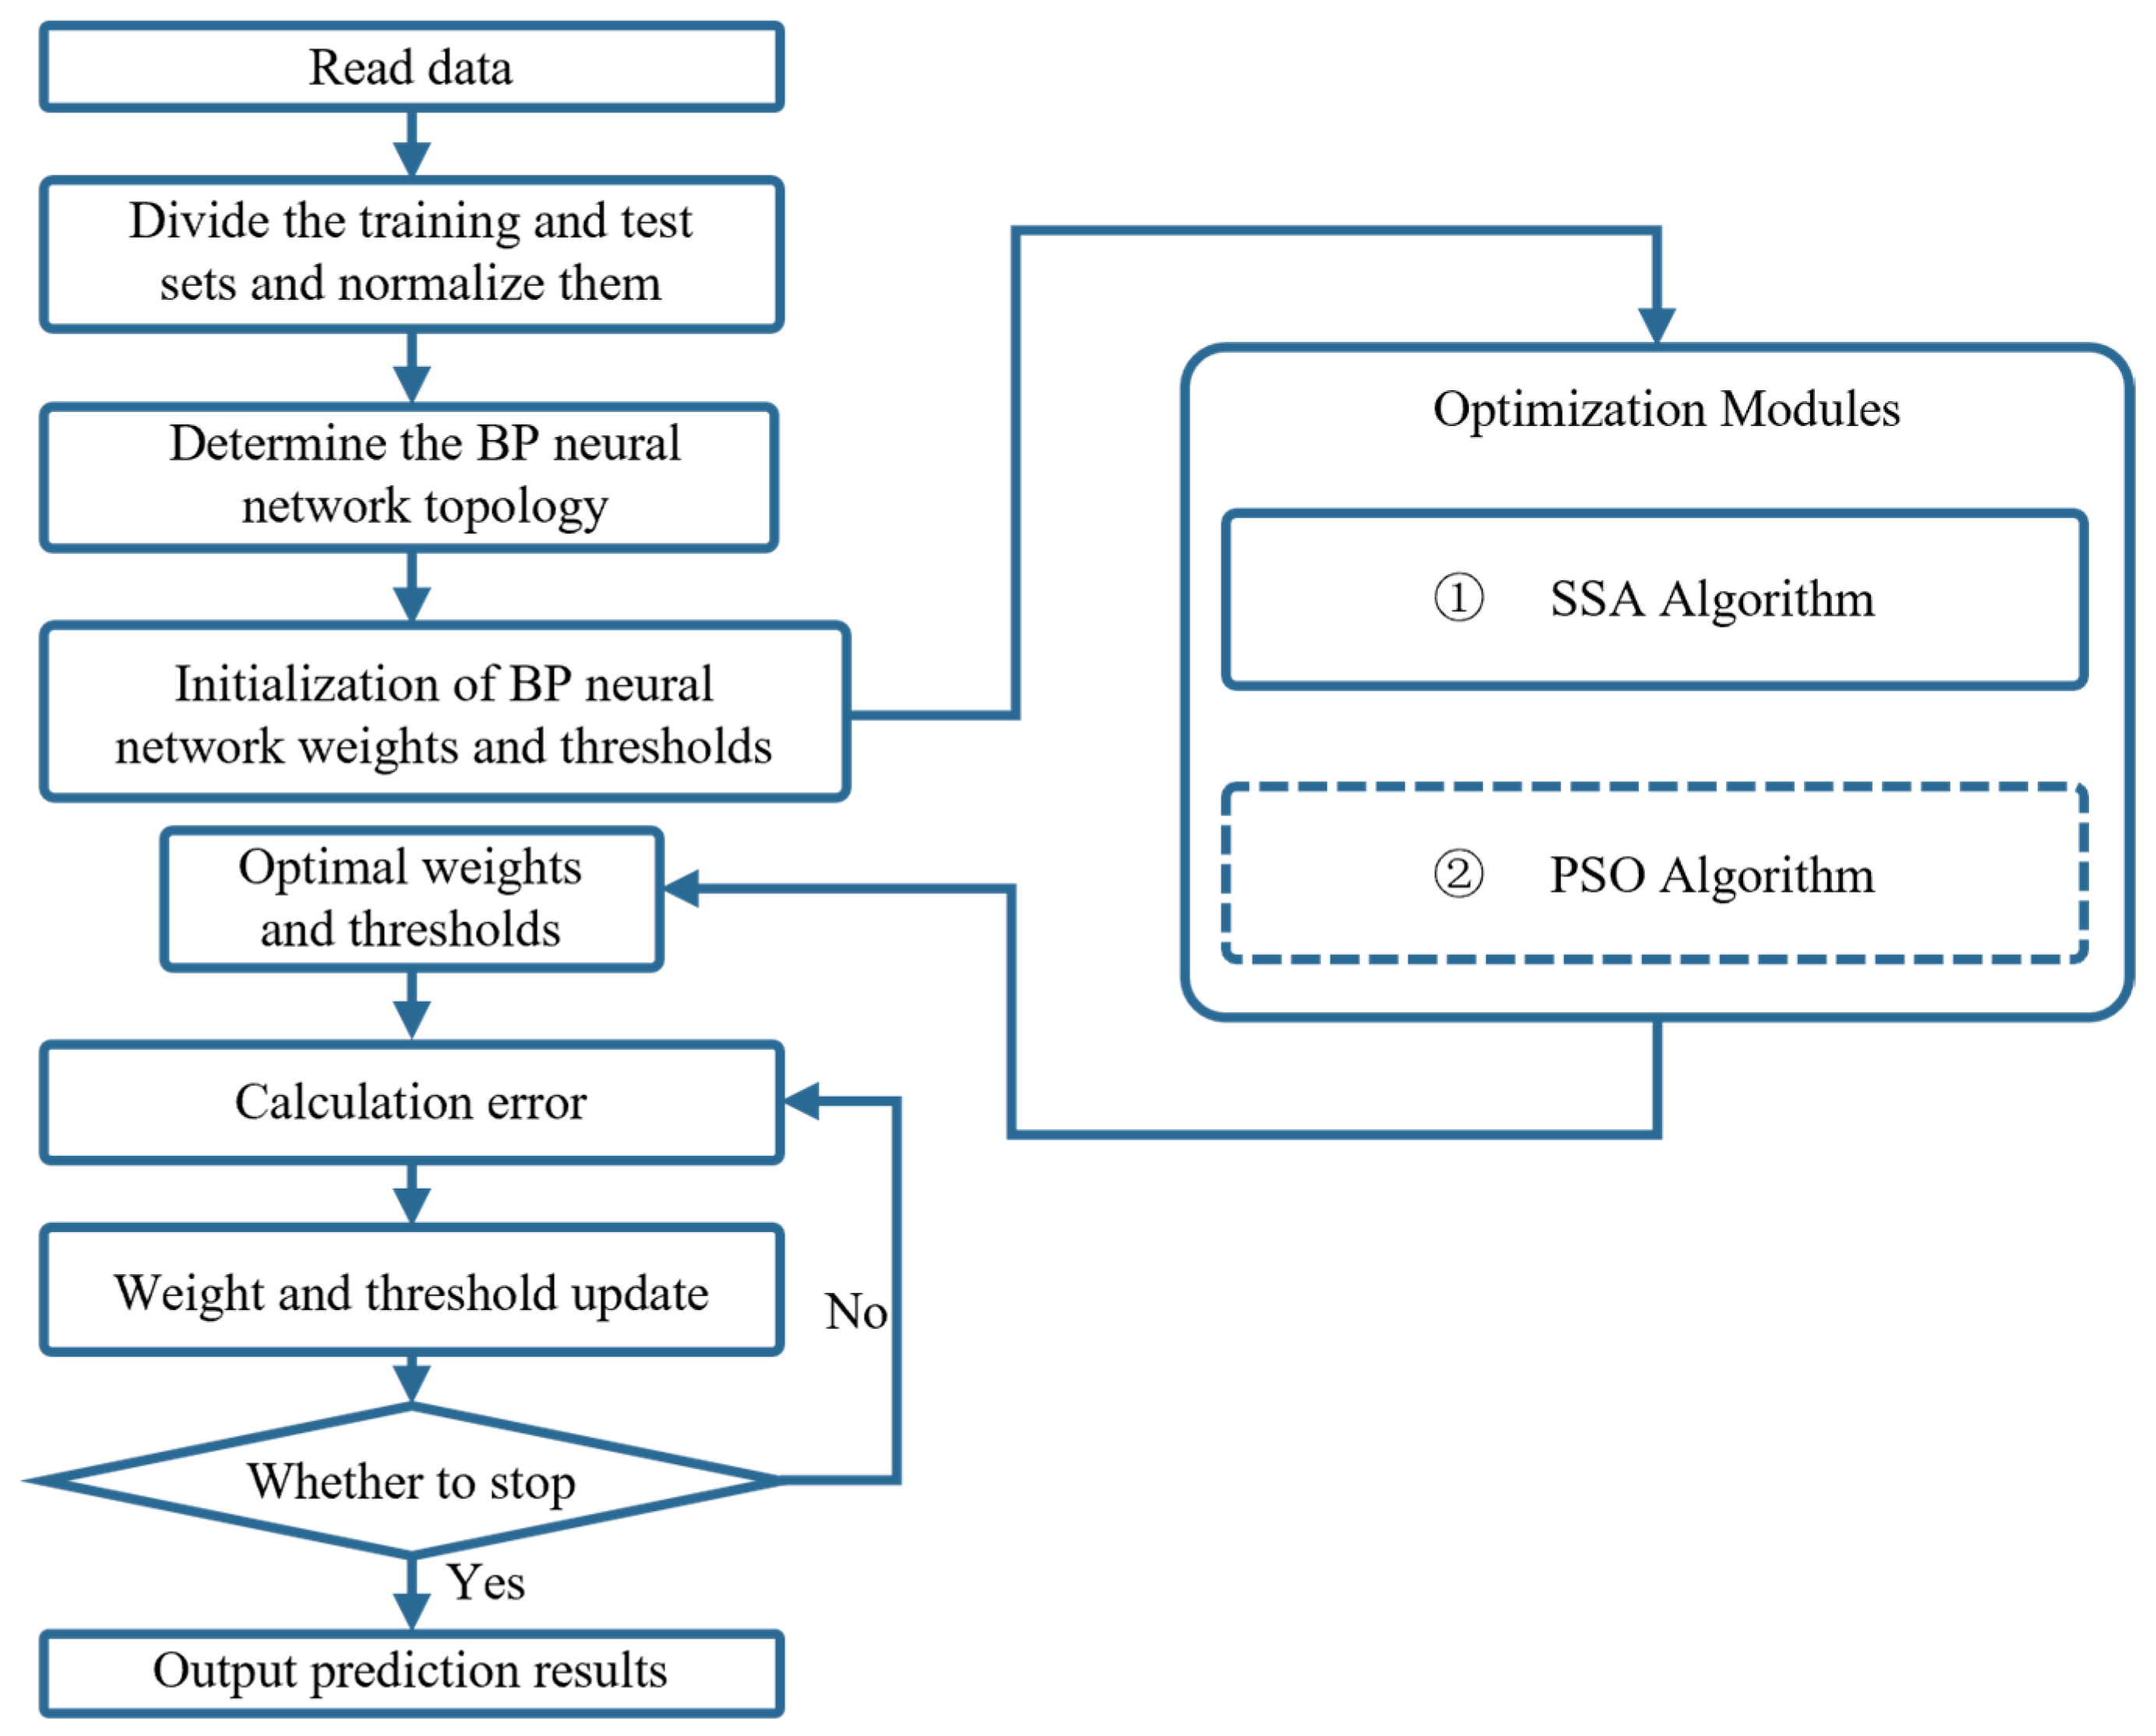
The SSA algorithm, proposed by Xue [40] in 2020, is a bionic intelligent algorithm modeled after the predatory and anti-predatory behaviors of sparrows, which has a higher performance compared with the Particle Swarm Algorithm (PSO) [41,42,43]. The BP neural network is a commonly used approximation model, but in a BP neural network each neuron transfer parameter needs to rely on weights and thresholds, so the assignment of the weights and thresholds directly determines the robustness of the BP neural network. Therefore, in order to improve the accuracy of the BP neural network approximate model, this paper fuses the SSA algorithm with the BP neural network approximate model. The SSA-BP approximate model is proposed as shown in Figure 5, and the PSO algorithm module is also introduced for comparison.
The predator, joiner, and vigilante position update functions in the SSA algorithm are as follows:
X i j t + 1 = X i j t . exp i a . N , R 2 L < S T X i j t + Q . L , R 2 > S T
X i j t + 1 = Q . exp X w o r s t t X i j t i 2 , i > n / 2 X P t + 1 + X i j t X P t + 1 . A + . L , i n / 2
X i j t + 1 = X b e s t t + β . X i j t X b e s t t , f i > f b e s t X i j t + K X i j t X w o r s t t f i f w o r s t + ε , f i = f b e s t
In the above equation, Q is a normally distributed random number; L is a unit row vector; a is a random number between [0, 1]; ε = 0 , β are step parameters; A + is a row vector consisting of 1 and −1; K is a random number between [−1, 1]; X i j t + 1 is the position information of the i sparrow in the j dimension after the t iteration; X p is the current discoverer position; X w o r s t is the global worst position; X b e s t is the current global optimal position; N and t are the maximum number of iterations and the current number of iterations; R 2 and S T are the warning value and safety value; f i , f b e s t , f w o r s t are the individual fitness, the global optimal fitness, and the global worst fitness, respectively.
In order to verify the superiority of the SSA-BP neural network approximate model, and to comprehensively compare the prediction errors of BP, SSA-BP, and PSO-BP approximate models on the lift-drag characteristic parameters of the ducted tail, the following tests were performed. Among the 30 sample models, 20 sample models are selected as the training set and 10 sample models are selected as the test set, and the sets of lift-drag coefficients of the sample models at different angles of attack are calculated for sample training and testing.
The BP neural network adopts a typical 3-layer topology. The logsig function is used for the hidden layer activation function, the pureline function is used for the output layer activation function, and the learning rate is set to be 0.015. The number of iterations is 1500, and the training expectation error is 0.000001. Based on this, the initial parameter settings of the SSA-BP and PSO-BP are shown in Table 5.
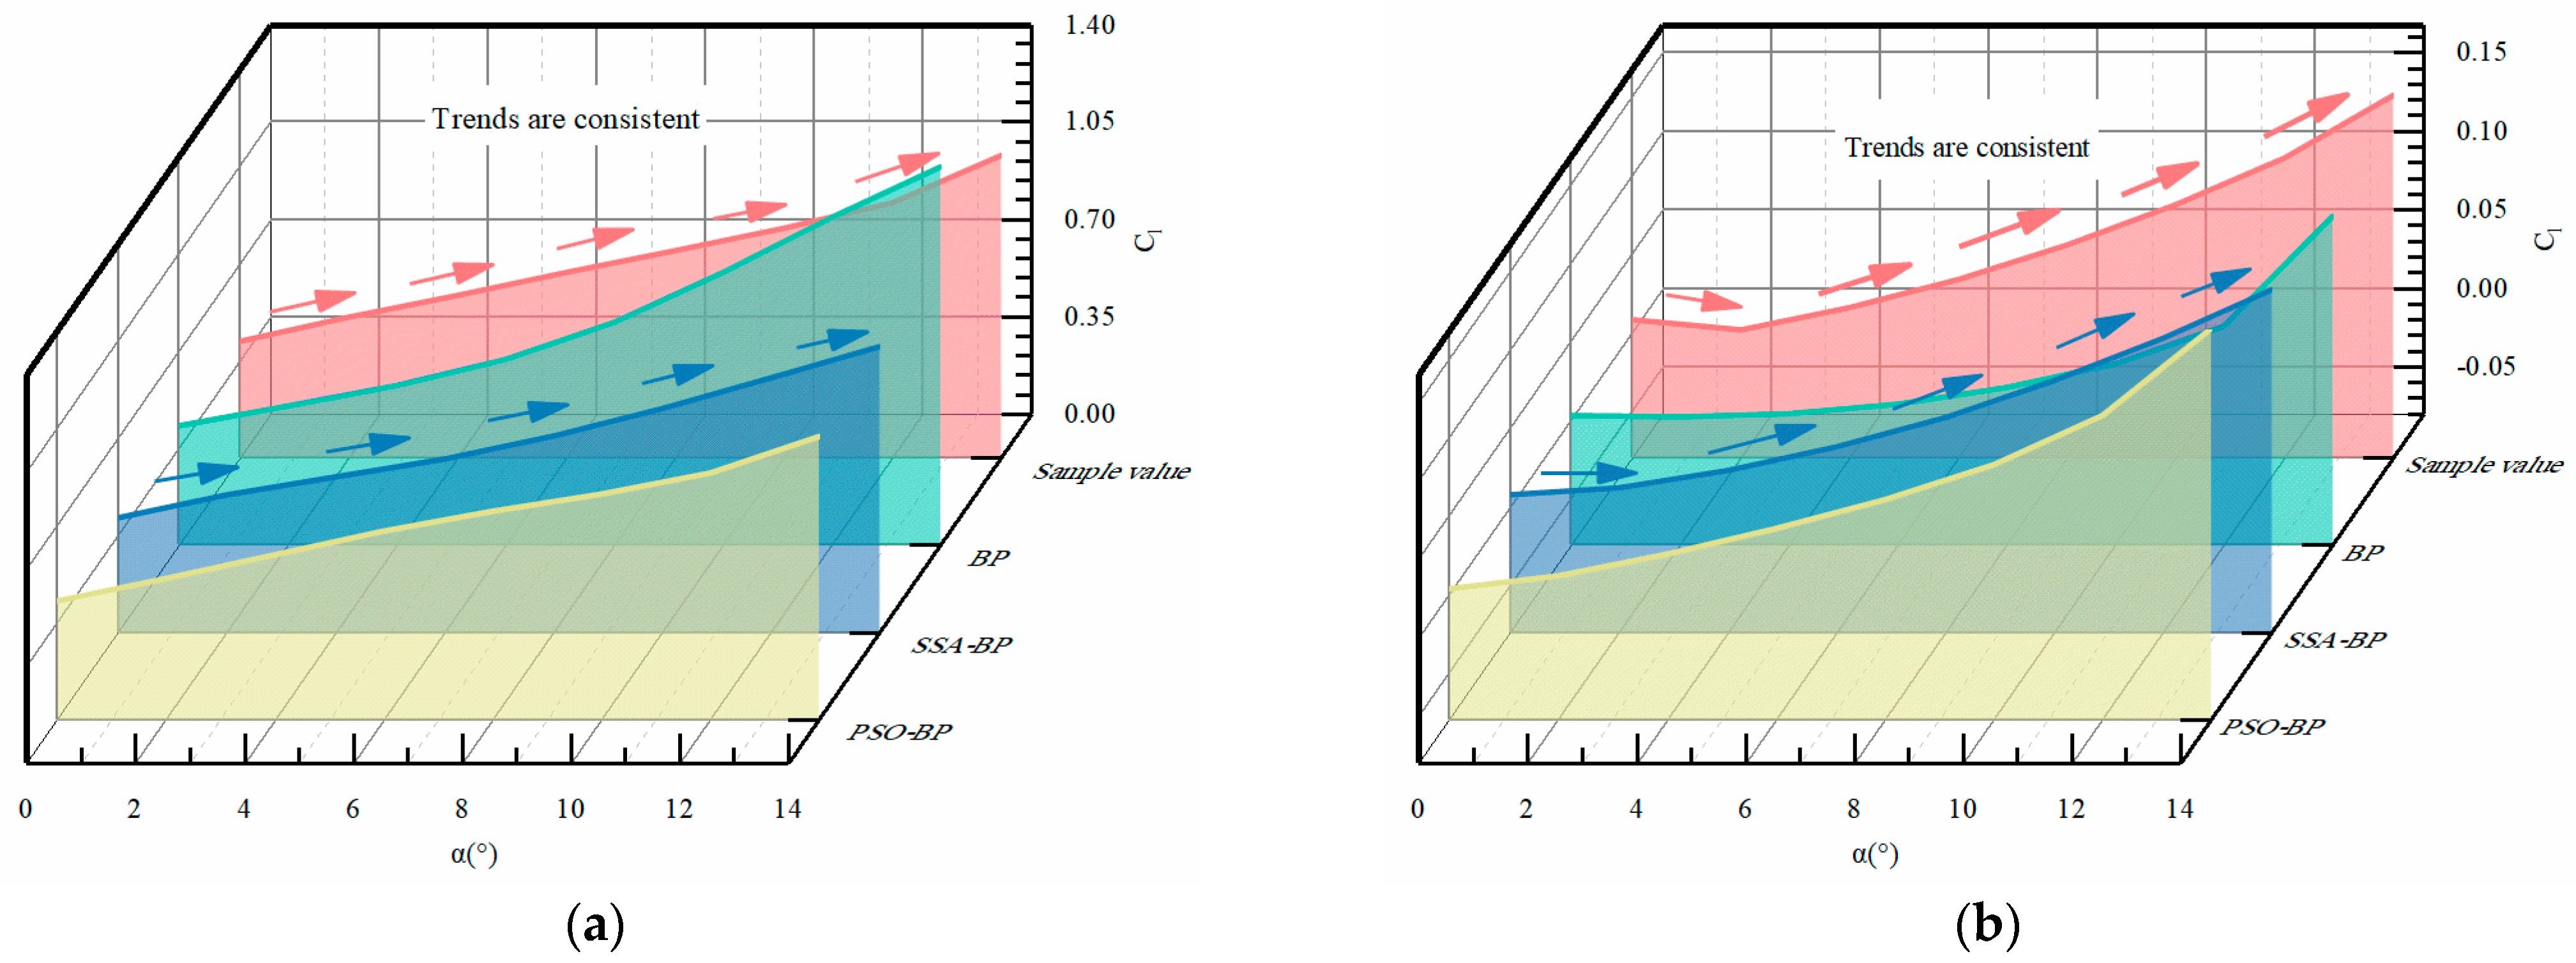
Based on the above approximate models and parameter settings, 10 sets of sample models are selected as test samples. The lift-drag characteristics of the ducted tail at an incoming flow velocity of 0.35 Ma and the attack angle of 0~14° are simulated and predicted by BP, SSA-BP, and PSO-BP under given constraints such as H1/L3/L4. The prediction data of one test model is randomly selected, as shown in Figure 6. For the prediction of lift coefficients, the predicted values generated by the SSA-BP approximation model have the same trend of change compared to the sample values. However, the predicted values generated by the BP and PSO-BP approximation models are locally distorted due to the fact that the weights and thresholds on which the neuron transmission parameters depend are not optimal. The predicted values generated by the BP approximation model gradually deviated from the sample values as the attack angle increased, and the predicted values generated by the PSO-BP approximation model had a larger local distortion at an attack angle of 12°. Regarding the prediction of the drag coefficients, the same phenomenon exists, and the predicted values generated by the BP and PSO-BP approximation models have a larger error compared to the sample values due to the higher degree of discretization of the drag coefficients. Initially, the SSA-BP approximation model is judged to have a higher accuracy in approximating the lift and drag coefficients.
The above results only qualitatively analyze the parameter approximation results and lack quantitative assessment guidelines. To comprehensively assess the accuracy of the approximation model, the absolute error (MAE), the mean percentage error (MAPE), and the root mean square error (RMSE) were found for the parameter approximation results according to the following formulas. Here, n represents the number of test samples, and y , y ^ are the actual and predicted values, respectively.
E M A E = 1 n i = 1 n y y ^
E M A P E = 1 n i = 1 n y y ^ y
E R M S E = 1 n i = 1 n y y ^ 2
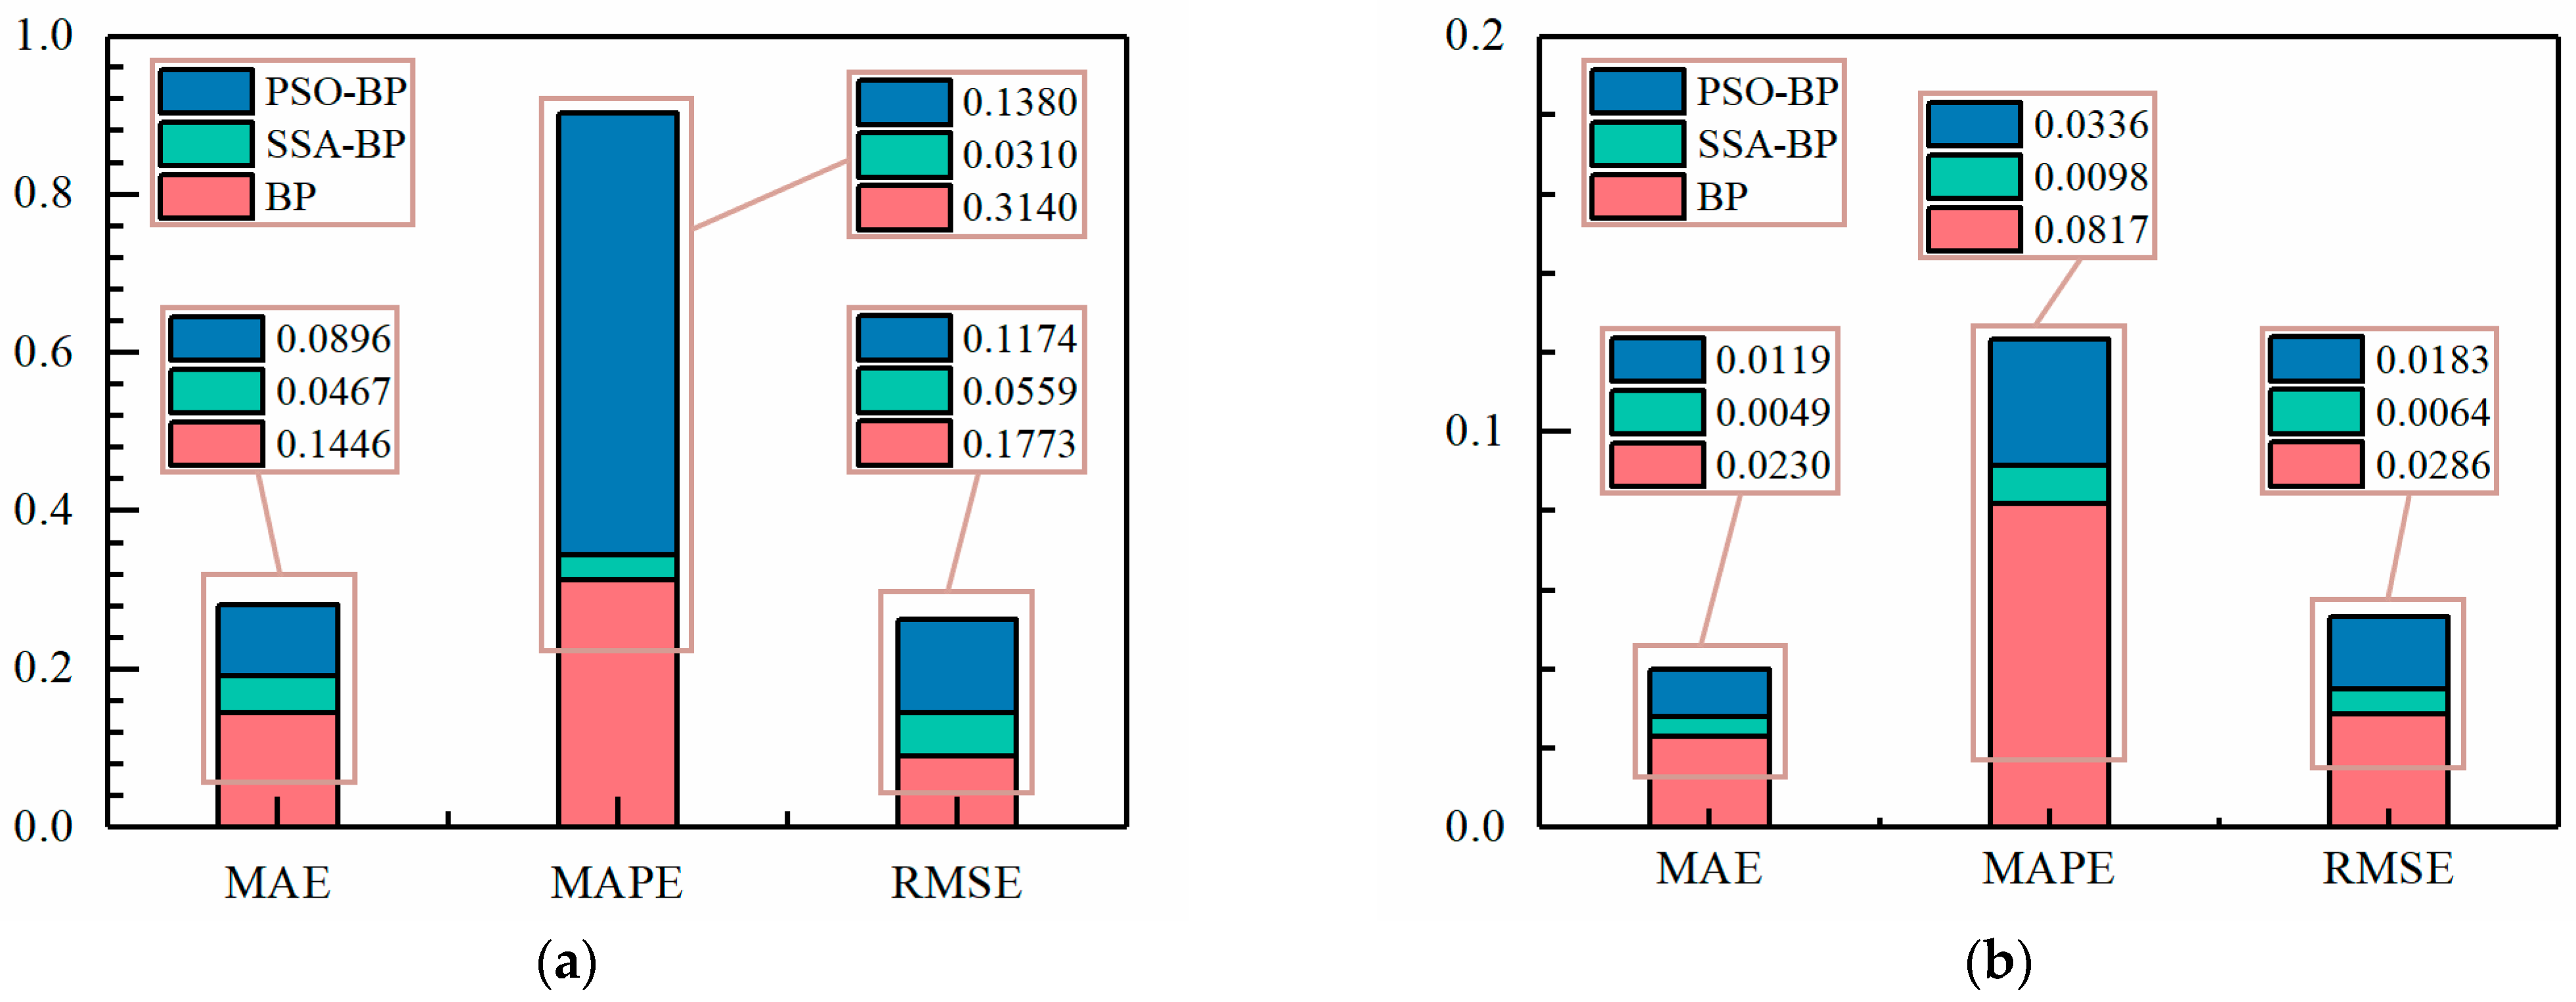
Figure 7 shows the approximate values of SSA-BP compared with the sample values. The approximate values of the lift coefficient corresponded to MAE = 0.0467, MAPE = 0.0310, RMSE = 0.0559; the approximate values of the drag coefficient corresponded to MAE = 0.0049, MAPE = 0.0098, RMSE = 0.0064. Comparing the approximate values of PSO-BP with the sample values, the approximate values of the lift coefficient corresponded to MAE = 0.0896, MAPE = 0.1380, RMSE = 0.1174; the approximate values of the drag coefficient corresponded to MAE = 0.0119, MAPE = 0.0336, RMSE = 0.0183. Comparing the approximate values of BP with the sample values, the approximate values of the lift coefficient corresponded to MAE = 0.1446, MAPE = 0.3140, RMSE = 0.1773; the approximate values of the drag coefficient corresponded to MAE = 0.0230, MAPE = 0.0817, RMSE = 0.0286. Compared with the PSO-BP approximation model, the prediction errors of the SSA-BP approximation model for the lift coefficient were reduced by 47.87% for MAE, 77.54% for MAPE, and 52.39% for RMSE; in the prediction errors for the drag coefficient, the MAE was reduced by 58.82%, 70.83% for MAPE, and 65.03% for RMSE. Compared with the BP approximation model, the SSA-BP approximation model reduced the prediction errors of the lift coefficient by 67.70% for MAE, 90.13% for MAPE, and 68.47% for RMSE; and in the prediction errors of the drag coefficient, the MAE was reduced by 48.26%, 88.00% for MAPE, and 77.62% for RMSE. In the comprehensive comparison, the SSA-BP approximate model has the smallest MAE, MAPE, and RMSE, and the SSA-BP approximate model has the best approximation of the lift-drag characteristics under the comprehensive error evaluation criterion. In summary, SSA-BP is selected as the approximate model in this paper.

4.4. Optimization Design Method Based on Multi-Objective Genetic Algorithm

In the process of optimizing the relative position of the ducted tail, the multi-objective genetic algorithm NSGA-II (Non-dominated Sorting Genetic Algorithm II) is used. NSGA-II is a non-dominated sequential genetic algorithm [44]. This genetic algorithm is characterized by fast acquisition of the Pareto peaks and the ability to search for optimality on a global scale.
The optimization sample model is increased to 100 by the SSA-BP approximate model, and the relative position of the ducted tail is optimized according to the following constraint objectives with the maximum tail lift-to-drag ratio at the cruise state at the attack angle of 6° and the maximum slope of the lift line as the optimization objectives, so as to obtain the qualified Pareto front. Where x i = { H 1 i , L 3 i , L 4 i } , x i meets the design constraints of the launch box size, and K is the slope of the lift line of the ducted tail.
f i n d X = x 1 , x 2 , x 3 , x n max { C L / C D , K } s t . x min x i x max C L / C D C L 0 / C D 0 K K 0

5. Optimization Result Analysis

5.1. Discussion of Optimization Results for Ducted Tail Position

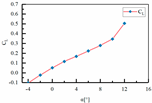
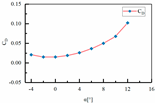
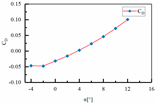
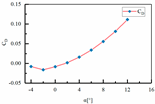
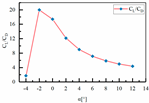
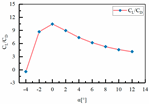
The model parameters and the sets of lift coefficients and drag coefficients at angles of attack from −4° to 12° for the 30 sample spaces obtained by DOE are shown in Table 4 (due to space constraints, only eight sets of data are sampled in Table 4). The dimensionality and number of sample data in Table 4 are expanded by using the SSA-BP approximate model in Section 4.3, and finally, the multi-objective genetic algorithm in Section 4.4 is utilized to optimize the ducted tail’s relative position, with the Pareto solution being obtained by optimization. Due to the similarity of the aerodynamic characteristics of the ducted tail, as shown in Table 6, the aerodynamic characteristics parameters of the original model and some of the corresponding models of the Pareto solution are listed in the sample.
As shown in the above table, compared with the original model, the effect of parameter L3 variation on the lift coefficient of the ducted tail is relatively concentrated, mainly depending on the variation of parameters H1 and L4. All parameters of sample model 2 are selected as basic parameters, parameter L4 of sample 3, parameter H1 of sample 5, and parameters H1 and L4 of sample 6. Control variables are applied to the above parameters to generate three sets of comparison samples. Compare samples 2 and 3 to analyze the effect of L4 on the aerodynamic characteristics of the tail. Comparison samples 2 and 5 analyze the effect of H1 on the aerodynamic characteristics of the tail. Comparison samples 2 and 6 analyze the effects of parameters H1 and L4 on the aerodynamic characteristics of the tail after the optimization of the multi-objective genetic algorithm, and illustrate the flow principle of optimizing the position of the tail to improve its aerodynamic performance.

5.1.1. Effect of L4 on Tail Aerodynamic Performance

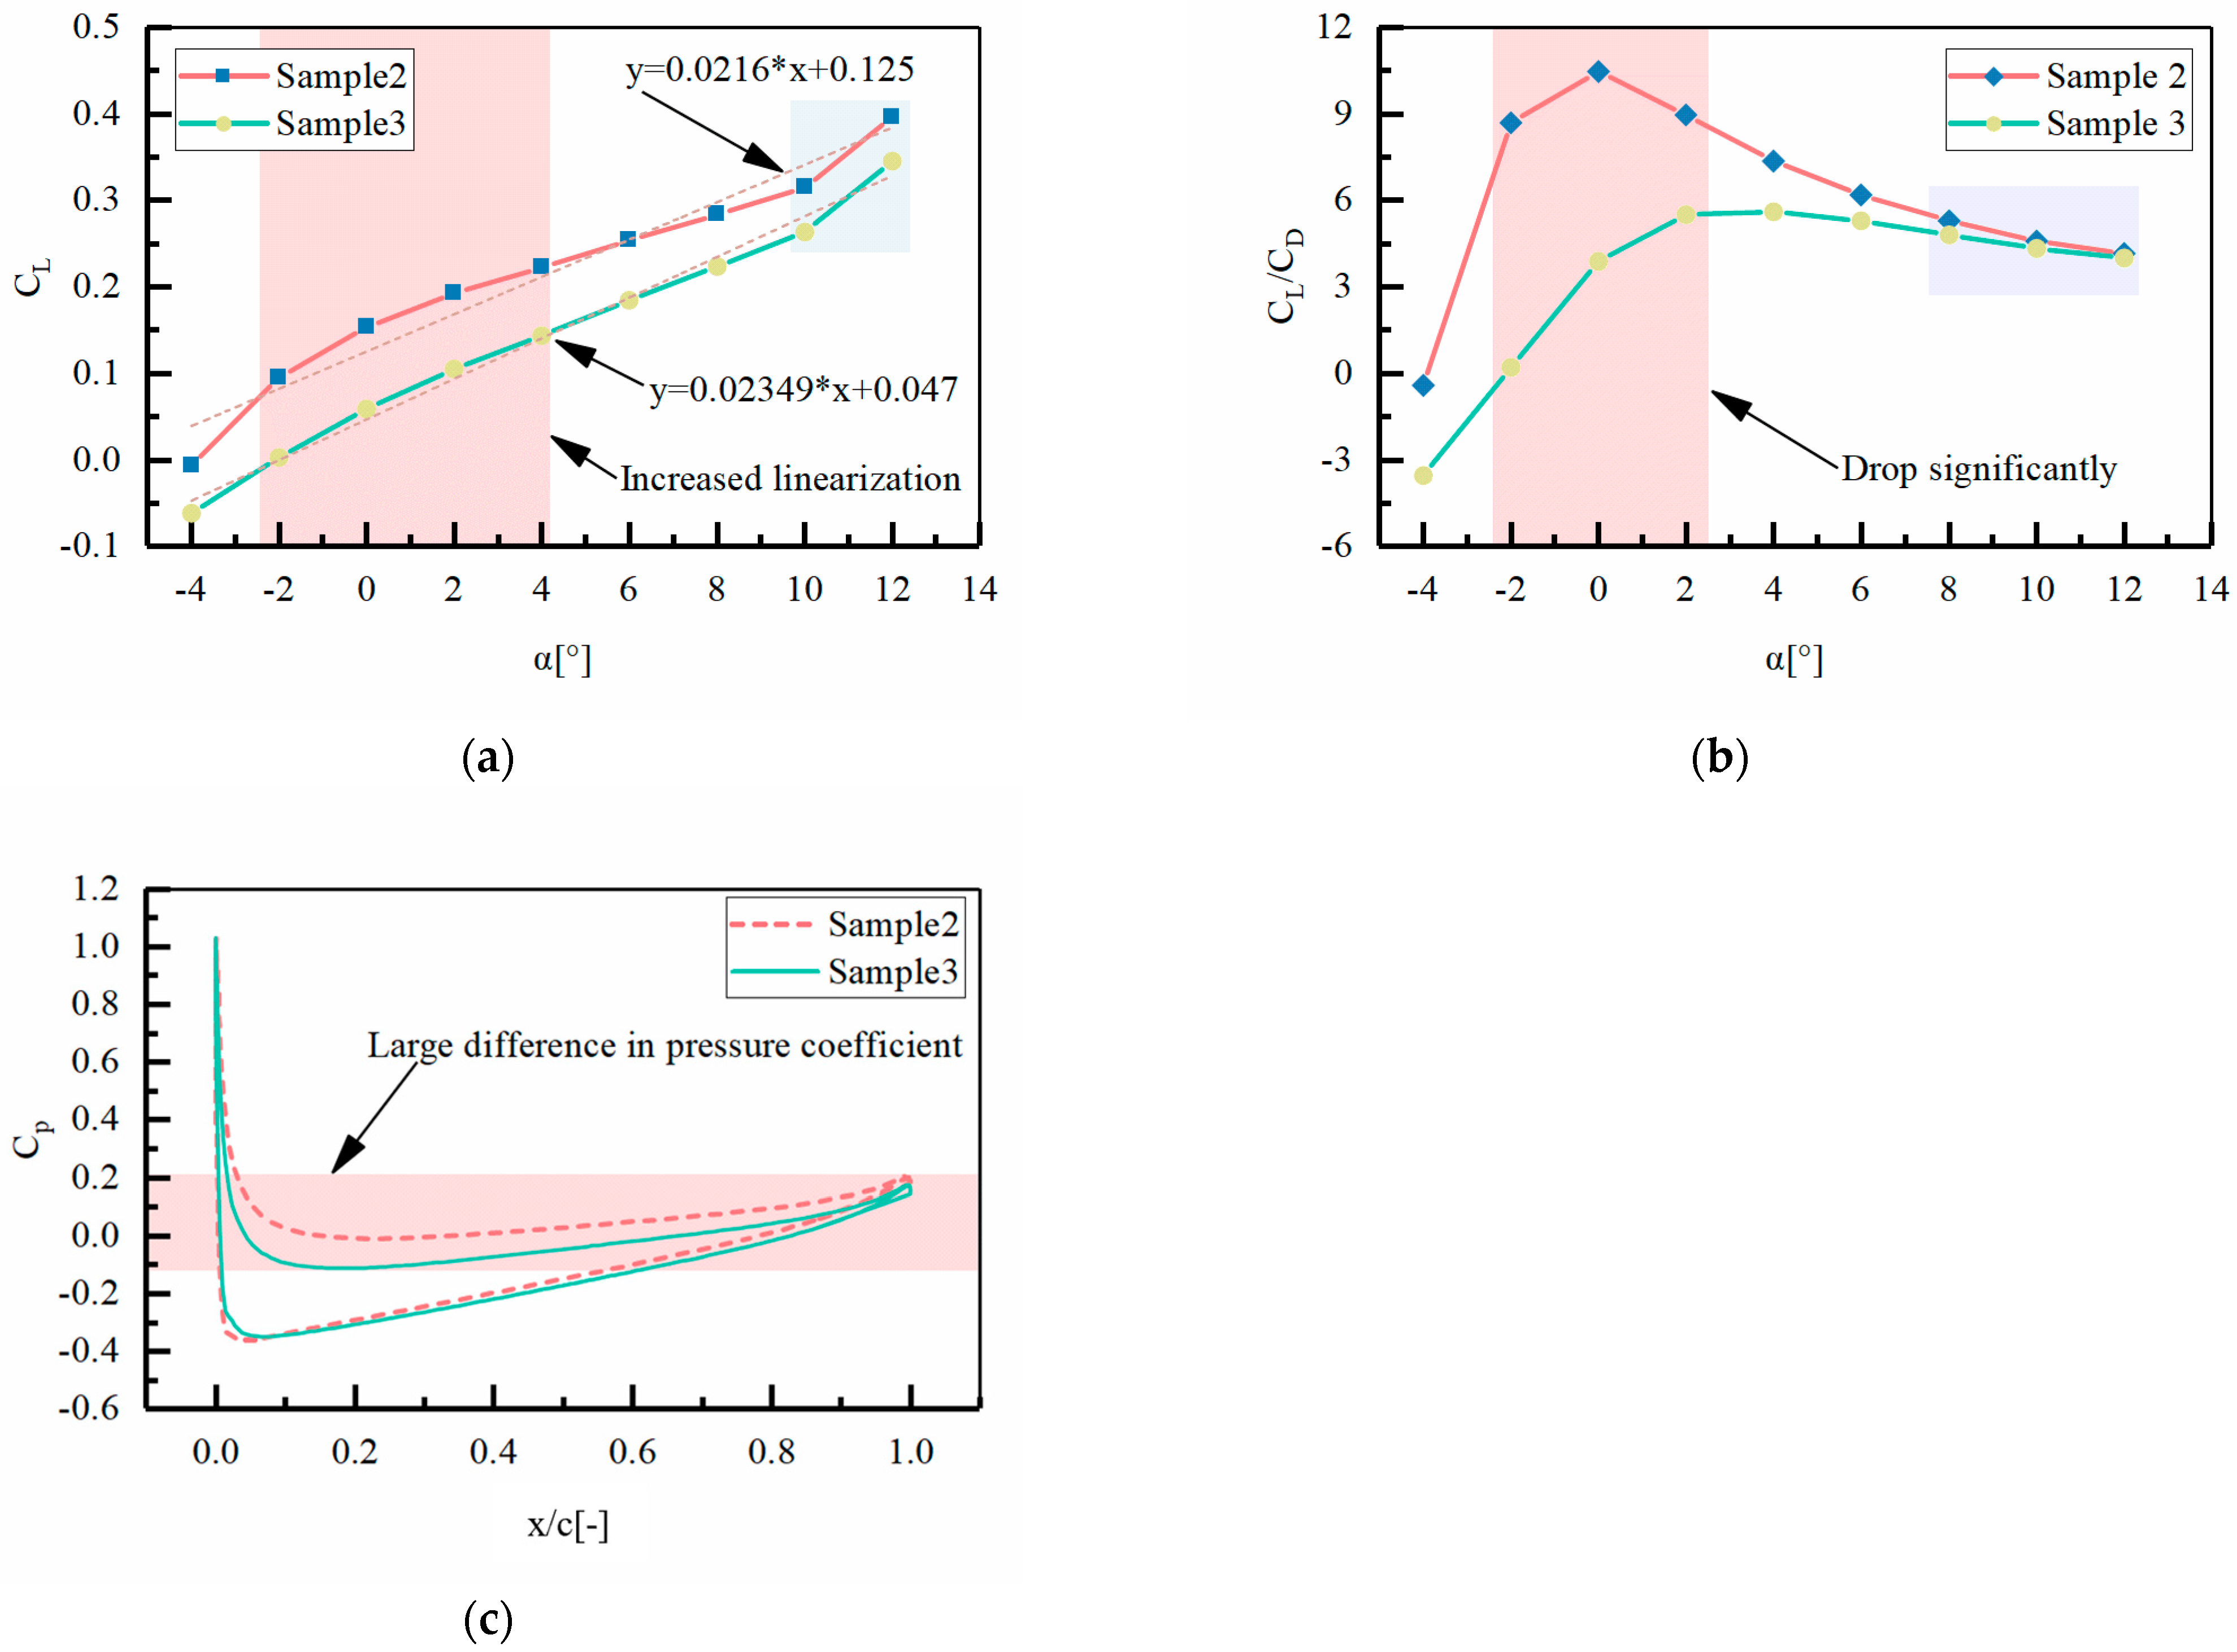
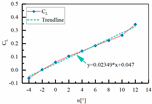
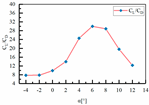
The effect of L4 on the aerodynamic performance of the tail is shown in Figure 8. From Figure 8a, as L4 increases, we can see the shielding effect of the fuselage on the airflow decreases and the airflow coupling zone between the fuselage and the tail shortens. Thus, it can be seen that the linearity of the tail lift coefficient curve increases with the increase of L4. Especially in the interval of −2°~4° angle of attack, the effect of airflow coupling on the tail lift coefficient is more sensitive, resulting in a poor degree of tail lift coefficient linearization. As L4 increases, the airflow coupling is weakened, and the linearization degree of the tail lift coefficient is significantly improved in this interval. However, as the angle of attack increases above 10°~12°, the effect of attenuating airflow coupling by increasing L4 diminishes, resulting in a less pronounced increase in the linearization of the tail lift coefficient in this interval. In addition, as the L4 parameter increases, the accelerating effect of the duct on the airflow is weakened due to the shortening of the duct region formed by the tail and the fuselage, resulting in a decrease in the value of the tail’s chordwise loops and an overall decrease in the value of the lift coefficient.
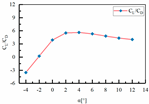
In addition, Figure 8b further shows that as L4 increases, the acceleration effect of the duct on the airflow is weakened due to the shortening of the duct region formed by the tail and the fuselage, resulting in a decrease in the value of the tail chordal loops, and the lift-to-drag ratio of the tail decreases rapidly in the airflow-coupling-sensitive region between −2° and −4°. Figure 8c avoids the airflow coupling sensitive interval, and the pressure coefficients of the upper and lower surfaces of the tailplane at 6° attack angle are selected for analysis. It can be seen that the pressure coefficient difference is mainly concentrated in the upper surface of the tail, and the pressure coefficient of the upper surface of the tail decreases with the increase of L4, which further verifies that due to the shortening of the duct region, the acceleration effect of the duct on the airflow is weakened, and the chordal loop volume flowing through the upper surface of the tail is reduced, resulting in the reduction of the pressure coefficient of the upper surface and the reduction of the lift coefficient value.

5.1.2. Effect of H1 on Tail Aerodynamic Performance

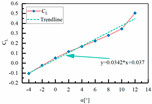
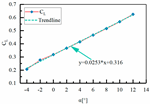
The effect of H1 on the aerodynamic performance of the tailplane is shown in Figure 9. From Figure 9a, it can be seen that with the increase of H1, the air duct formed by the tail and the fuselage becomes wider, the value of the chordal loop volume flowing through the tail increases, the decelerating effect of the fuselage tail appendage layer on the tail flow is weakened, and the coefficient of lift of the tail is obviously increased. In addition, as the H1 parameter increases, the linearity of the tail lift line is not significantly weakened because the tail and fuselage form a wider duct region, and the fuselage’s interference with the tail airflow is reduced by increasing the distance in the height direction. However, in the region of −4°~−2° angle of attack, the linearity of the tail lift coefficient is not significantly improved in this interval because the fuselage’s shading of the tail airflow cannot be improved by increasing H1.
From Figure 9b, it can be seen that with the increase of H1, due to the widening of the duct region formed by the tail and the fuselage, the fuselage appendage layer weakened its effect on the tail, and the accelerating effect in the duct region was not weakened by the widening of the duct, which resulted in the increase of the value of chordal loops flowing through the tail, and the lift-to-drag ratio of the tail increased rapidly between 2° and 10°. However, in the −4° to 2° angle of attack interval, due to the fuselage shading, which is in the airflow coupling sensitive area, the lift-to-drag ratio of the tail has not been significantly improved.
Figure 9c avoids the airflow coupling sensitive interval, and the pressure coefficients on the upper and lower surfaces of the tailplane at the 6° attack angle condition are selected for analysis. As H1 increases, the pressure coefficient difference between the upper and lower surfaces of the trailing edge increases with the increase of H1 due to the widening of the air duct. In particular, the pressure coefficient difference between the upper and lower surfaces increases significantly in the interval of 0~30% at the leading edge, which further verifies the contribution of the widened duct region to the lift coefficient.

5.1.3. Effect of L4 and H1 on Tail Aerodynamic Performance

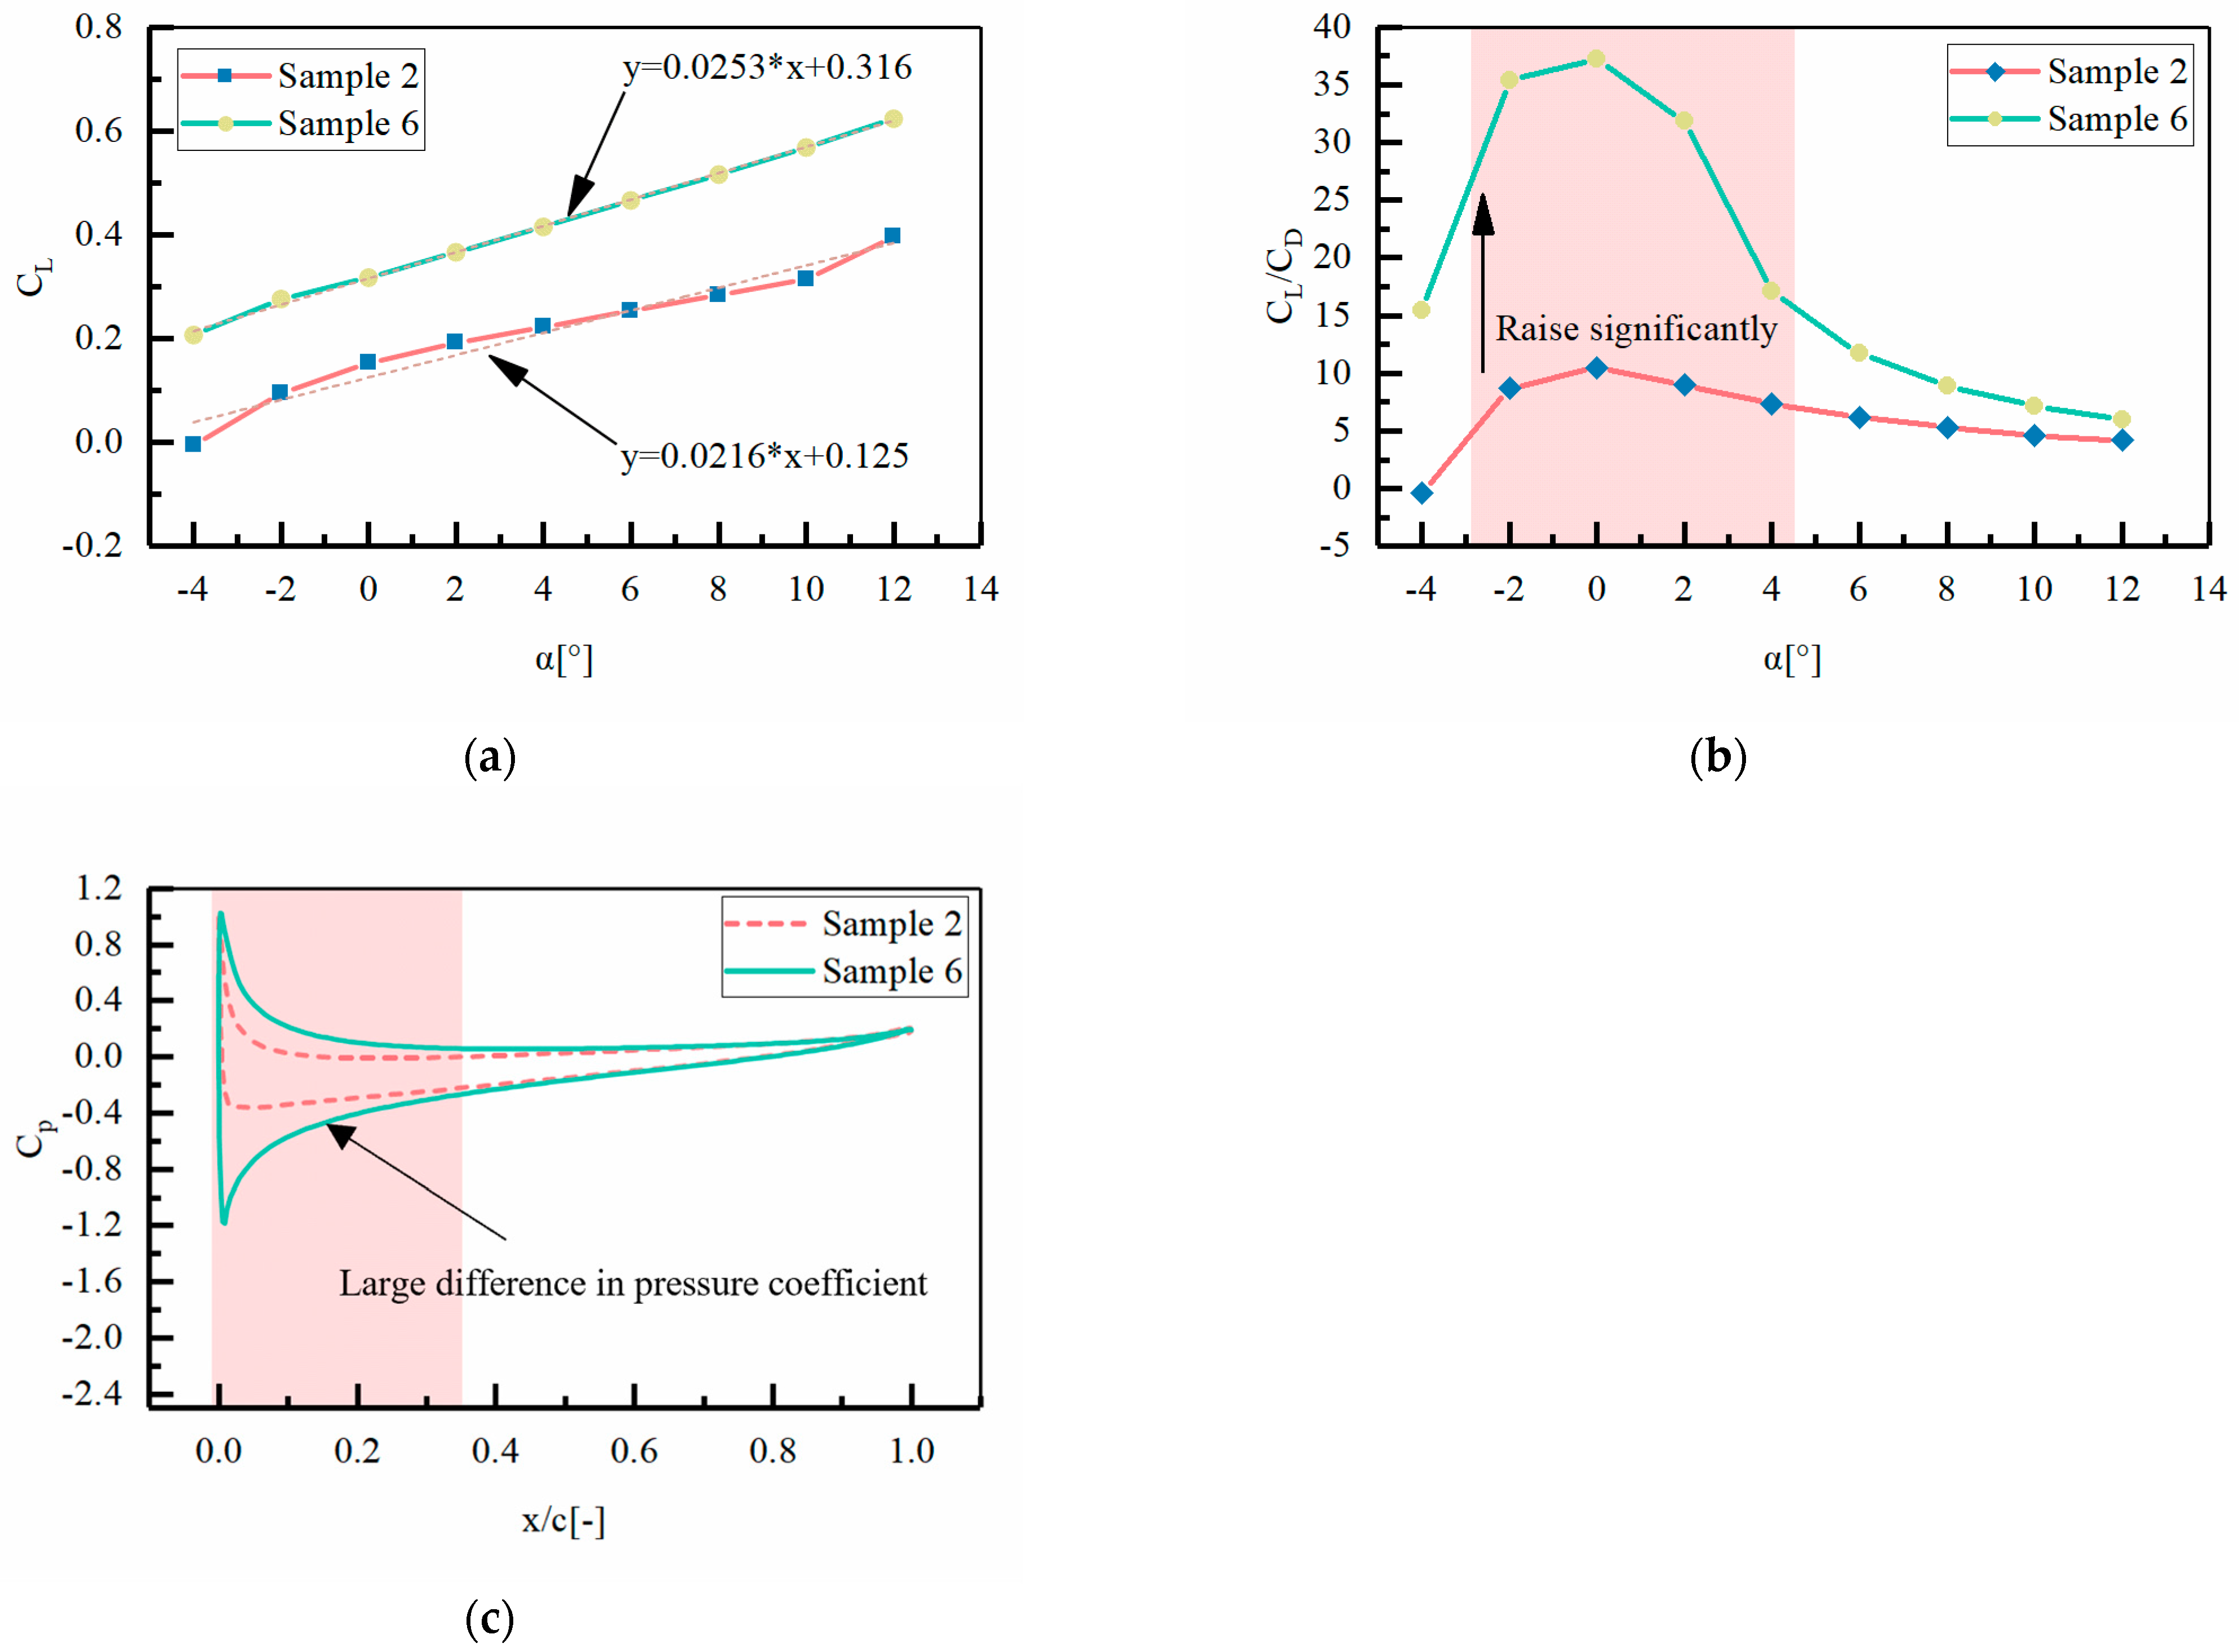
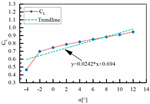
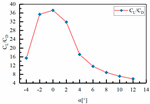
The effects of the preferred parameters on the aerodynamic performance of the tailplane are shown in Figure 10. It can be seen that the multi-objective genetic optimization algorithm proposed in this paper has carried out comprehensive optimization of parameters H1 and L4. It preferred the H1/L4 combination parameters and made a compromise between parameters H1 and L4, which both shortened the length of the air ducts and increased the width of the air ducts, which resulted in the enhancement of lift coefficients of the tail, and the linearization of lift coefficients has been significantly improved. From Figure 10a, it can be seen that with the simultaneous increase of parameters L4 and H1, the interference of the fuselage on the tail airflow is reduced due to the shortening and widening of the ducted area formed by the tail and the fuselage, and the degree of linearization of the tail lift line is improved with an increase in the slope. Meanwhile, the increase of parameter H1 leads to the increase of the tail chordwise loop value, which effectively suppresses the decrease of the lift coefficient due to the shortening of the duct area and effectively improves the tail lift coefficient.
From Figure 10b, it can be seen that with the simultaneous increase of H1 and L4, the duct area is shortened and widened, the airflow obstruction inside the duct is weakened, the airflow interference from the fuselage to the tailplane is reduced, the chordal annulus flowing through the tailplane increases, and the lift-to-drag ratio of the tailplane is significantly improved, especially in the interval of the angle of attack from −2° to 4°; the lift-to-drag ratio is more obviously improved. From Figure 10c, it can be seen that the pressure coefficient difference between the upper and lower surfaces of the tail at the 6° angle of attack is obviously increased after parameter optimization, which further verifies that the degree of linearization of the tail lift coefficient, the lift-to-drag ratio, and the lift value are effectively improved after the parameter optimization due to the weakening of the airflow disturbance and the increase in the tail chordwise loop volume.
As shown in Figure 11, comparing and analyzing the pressure cloud of sample 2 and sample 6 on the symmetry plane, due to the smaller relative parameter H1/L4 of the tail and fuselage in sample 2 which results in a narrow and long duct area, the fuselage’s interference effect on the tail airflow is strengthened with the increase of the angle of attack. This is prone to form airflow obstructions, and there is no obvious change to the low-pressure area in the upper airfoil of sample 2. On the other hand, due to the improvement of the duct area, the low-pressure area on the upper airfoil of sample 6 is obviously larger than that of sample 2, and the range of the low-pressure area gradually increases, which makes the pressure difference between the upper and lower airfoils of sample 6 larger than that of sample 2. In addition, where the tilted section of the tail intersects with the horizontal section, the sudden change in the shape leads to the emergence of a dead zone in the airflow, and a high-pressure region is found to exist, which is coupled with the upper airfoil of the tail wing; this is unfavorable to the enhancement of the tail lifting force.
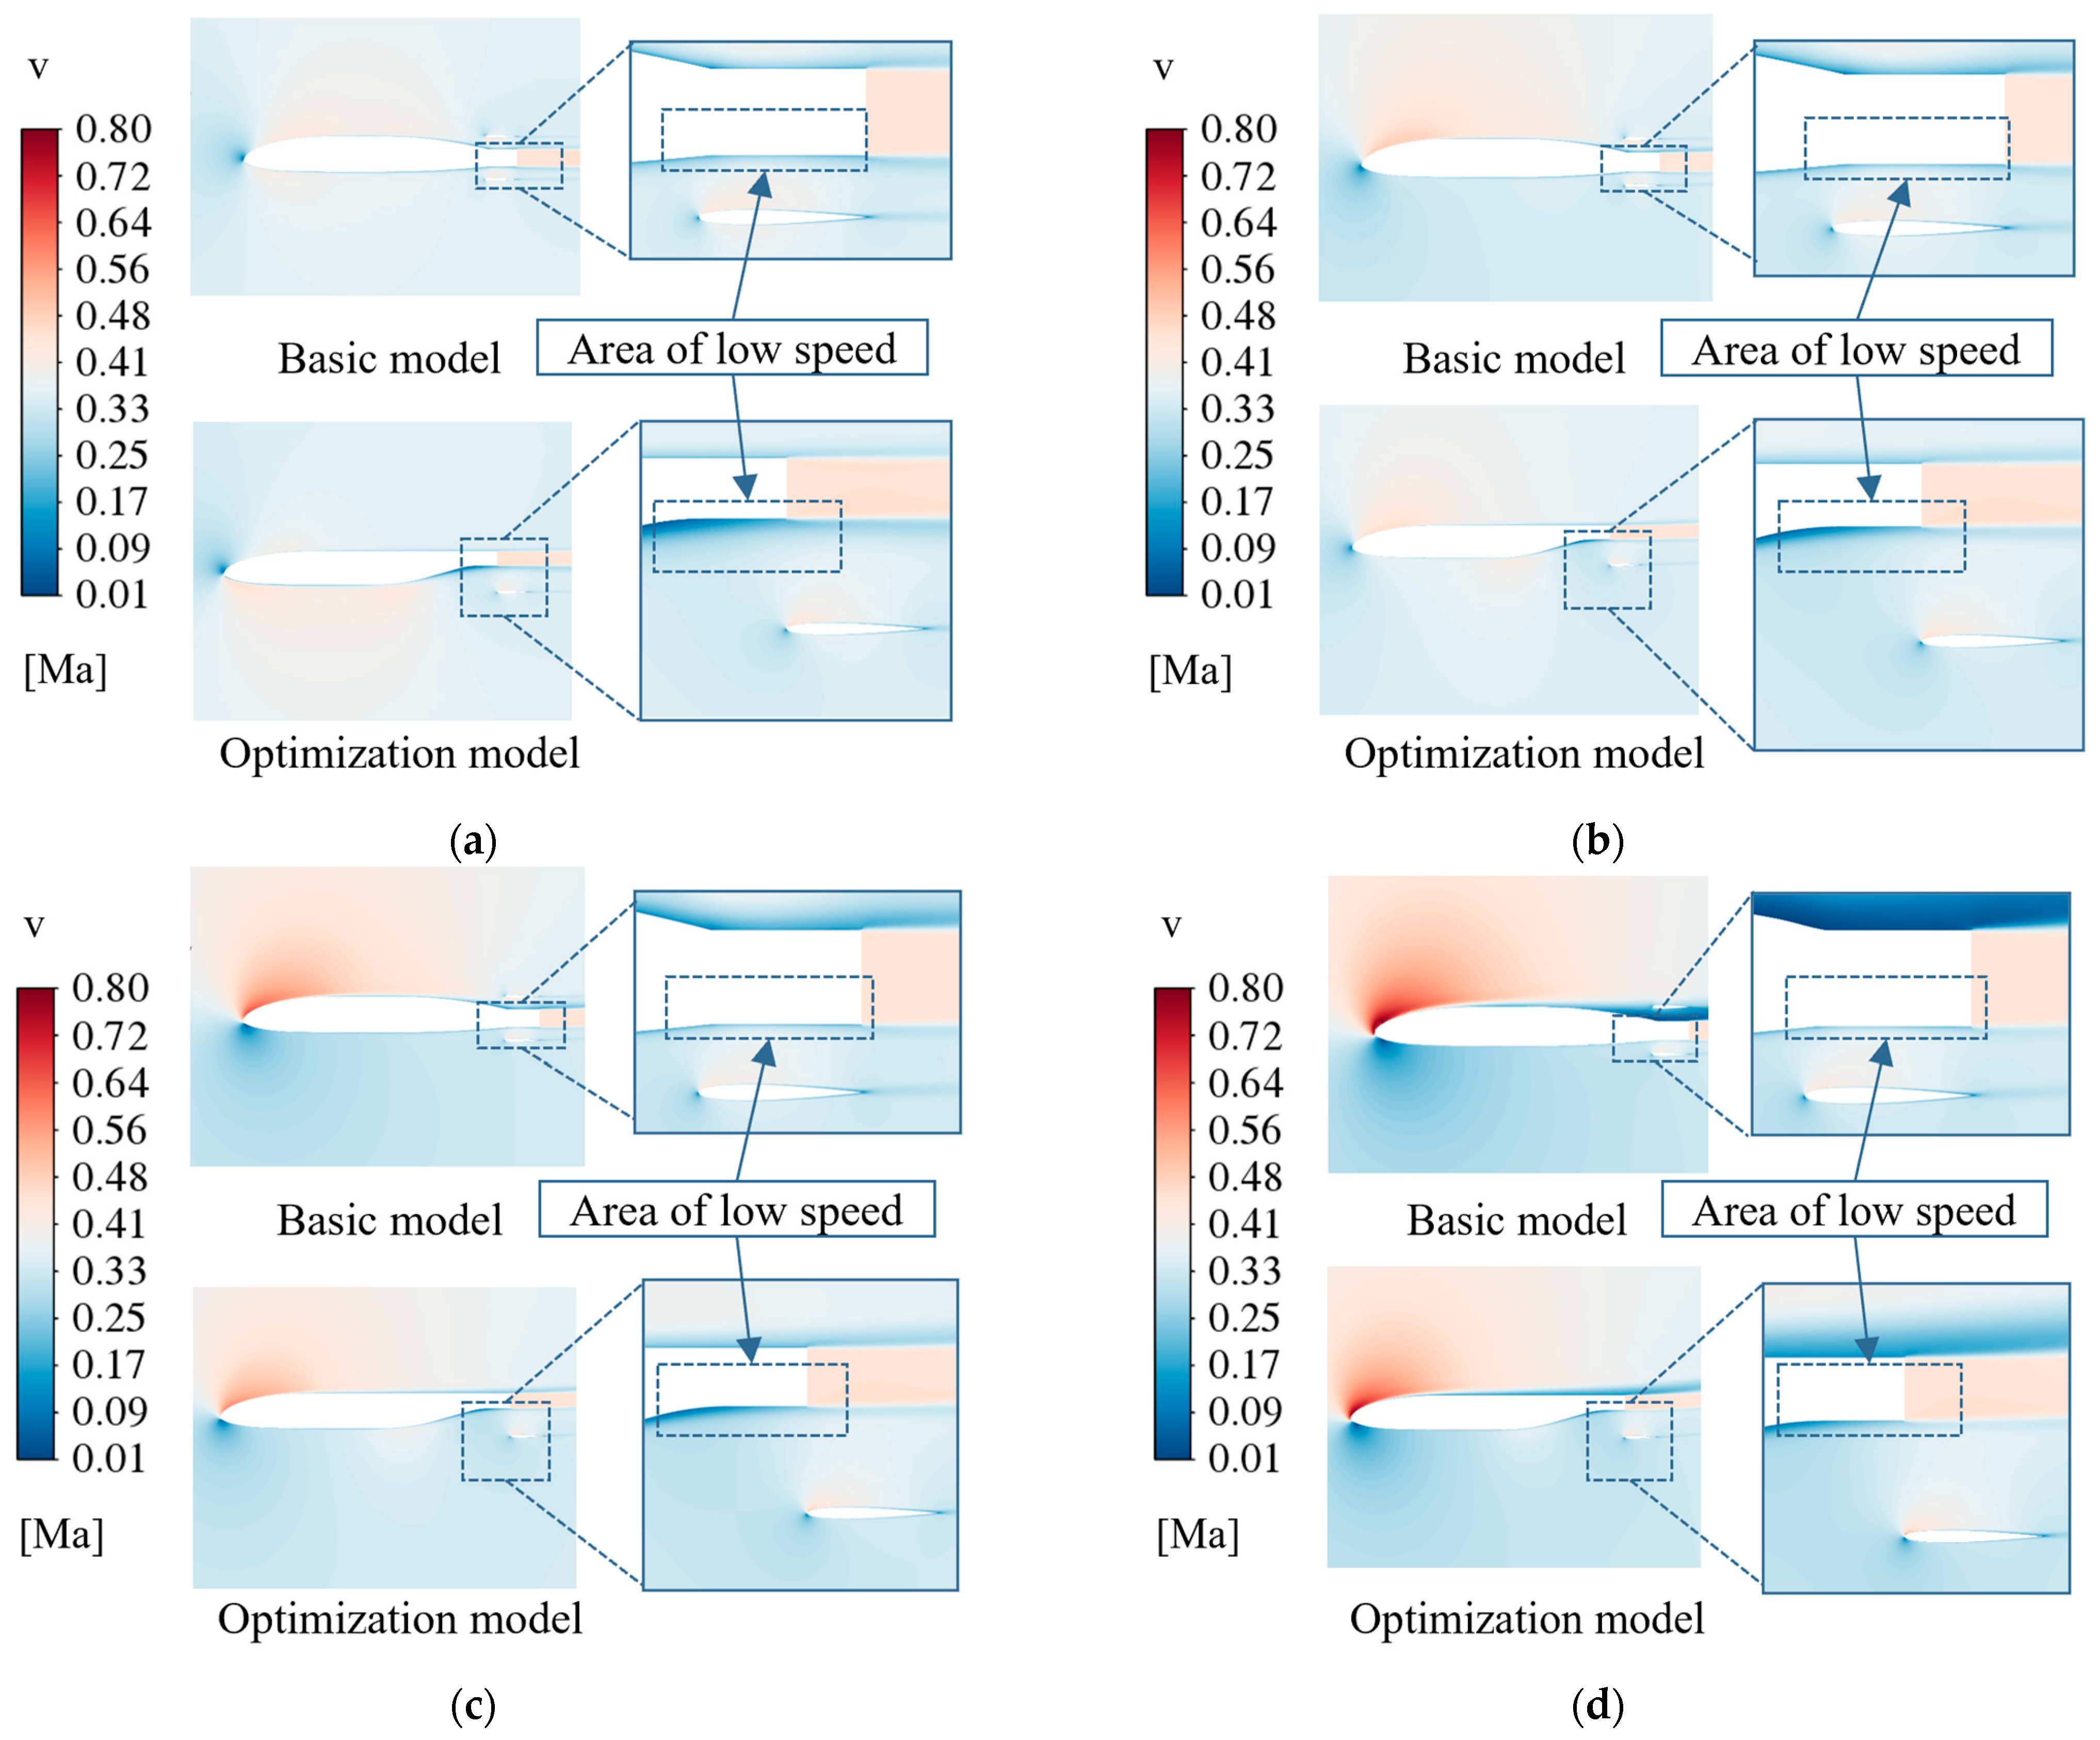
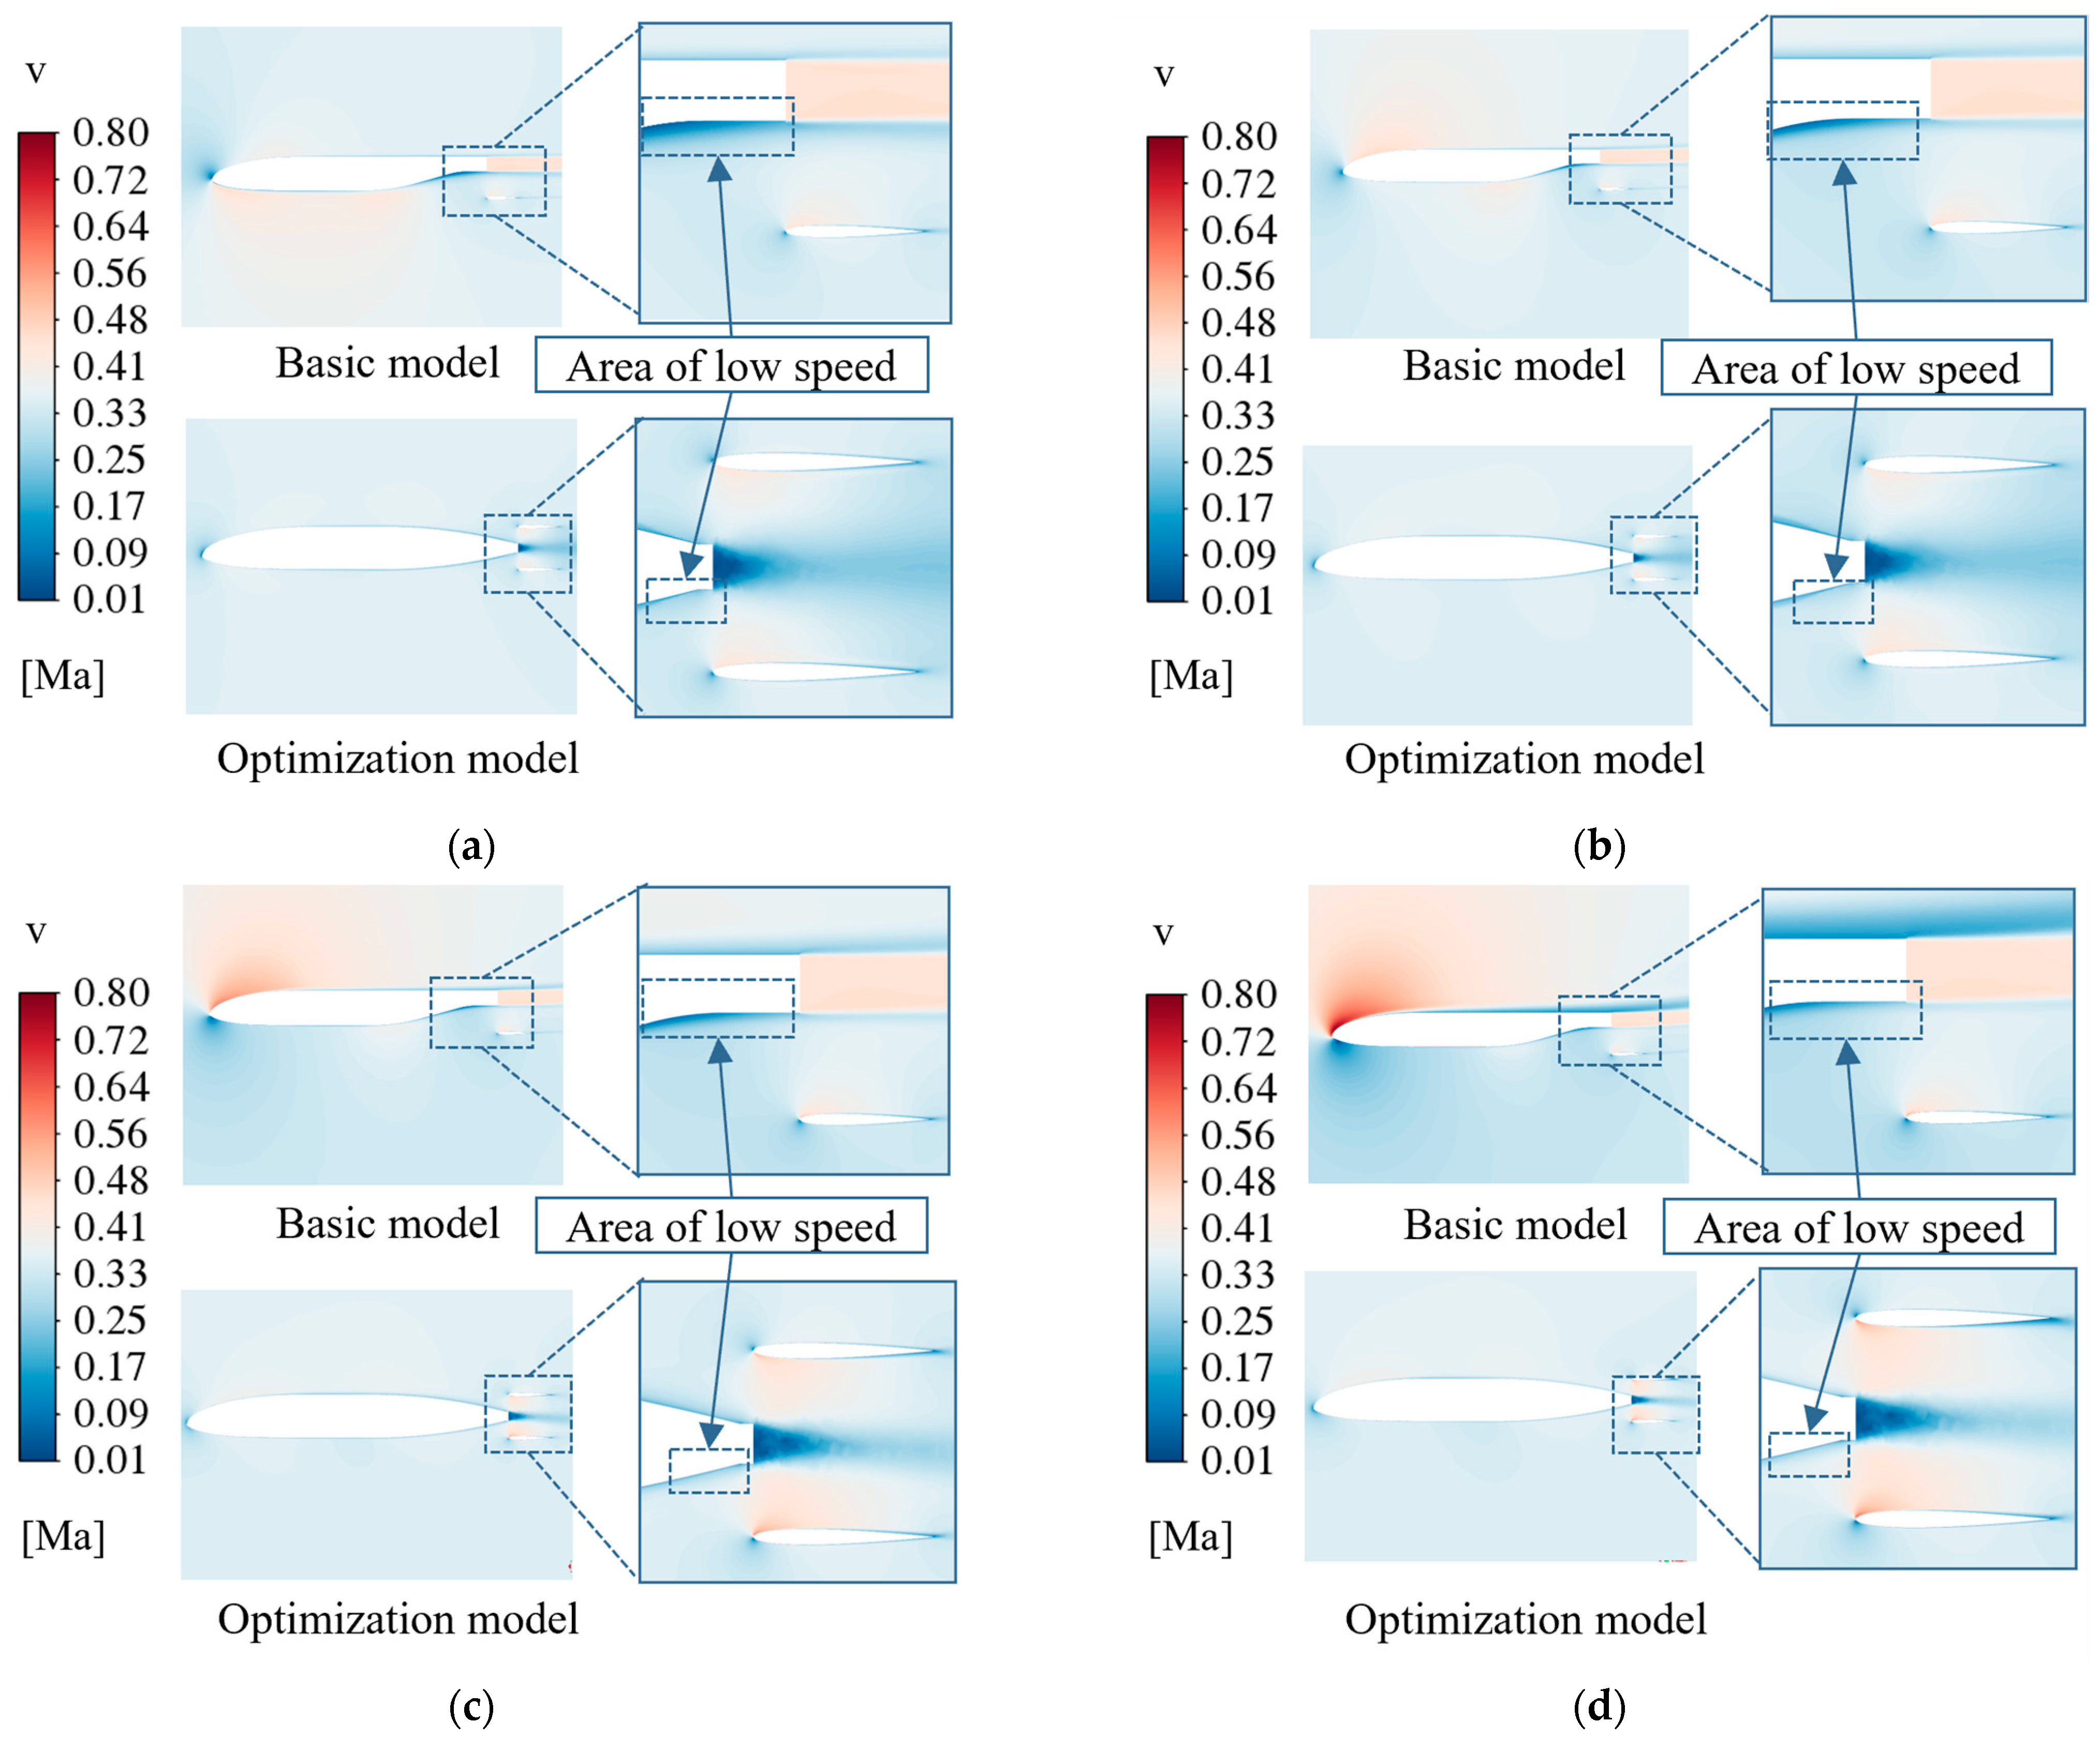
As shown in Figure 12, the velocity cloud diagrams of sample 2 and sample 6 on the symmetry plane are compared and analyzed. Since the horizontal and vertical distances between the tail and the fuselage are larger than that of sample 2, the duct area formed by the fuselage and the tail becomes shorter and wider. Under the acceleration effect of the duct, the natural incoming airflow can flow smoothly through the tail area, which results in the airflow velocity of sample 6 through the tail increasing with the increase of the angle of attack. This is conducive to the formation of a larger pressure difference between the upper and lower surfaces of the tail. It makes the lift coefficient of the tail increase.
The positive effect of H1 and L4 enlargement on tail lift enhancement is verified by the above comparison of the cloud diagrams. Further comparing the pressure and velocity cloud diagrams of Sample 2 and Sample 6, we can see that due to the sudden change in the shape of the transition region connecting the tilted and horizontal sections of the fuselage tail of Sample 6, as well as the influence of the fuselage appendage layer, the naturally incoming flow, after being rectified by the fuselage, will have a low-speed region, or even a dead zone of speed, in the fuselage tail region. This will lead to the existence of a certain high-pressure region in the fuselage tail, affecting the spread of the low-pressure region in the upper airfoil surface of the tail. This is not conducive to lift enhancement of the tail. Therefore, it is necessary to further optimize the fuselage and tail combination.

5.2. Discussion of Aerodynamic Optimization Results for Tail Trimming

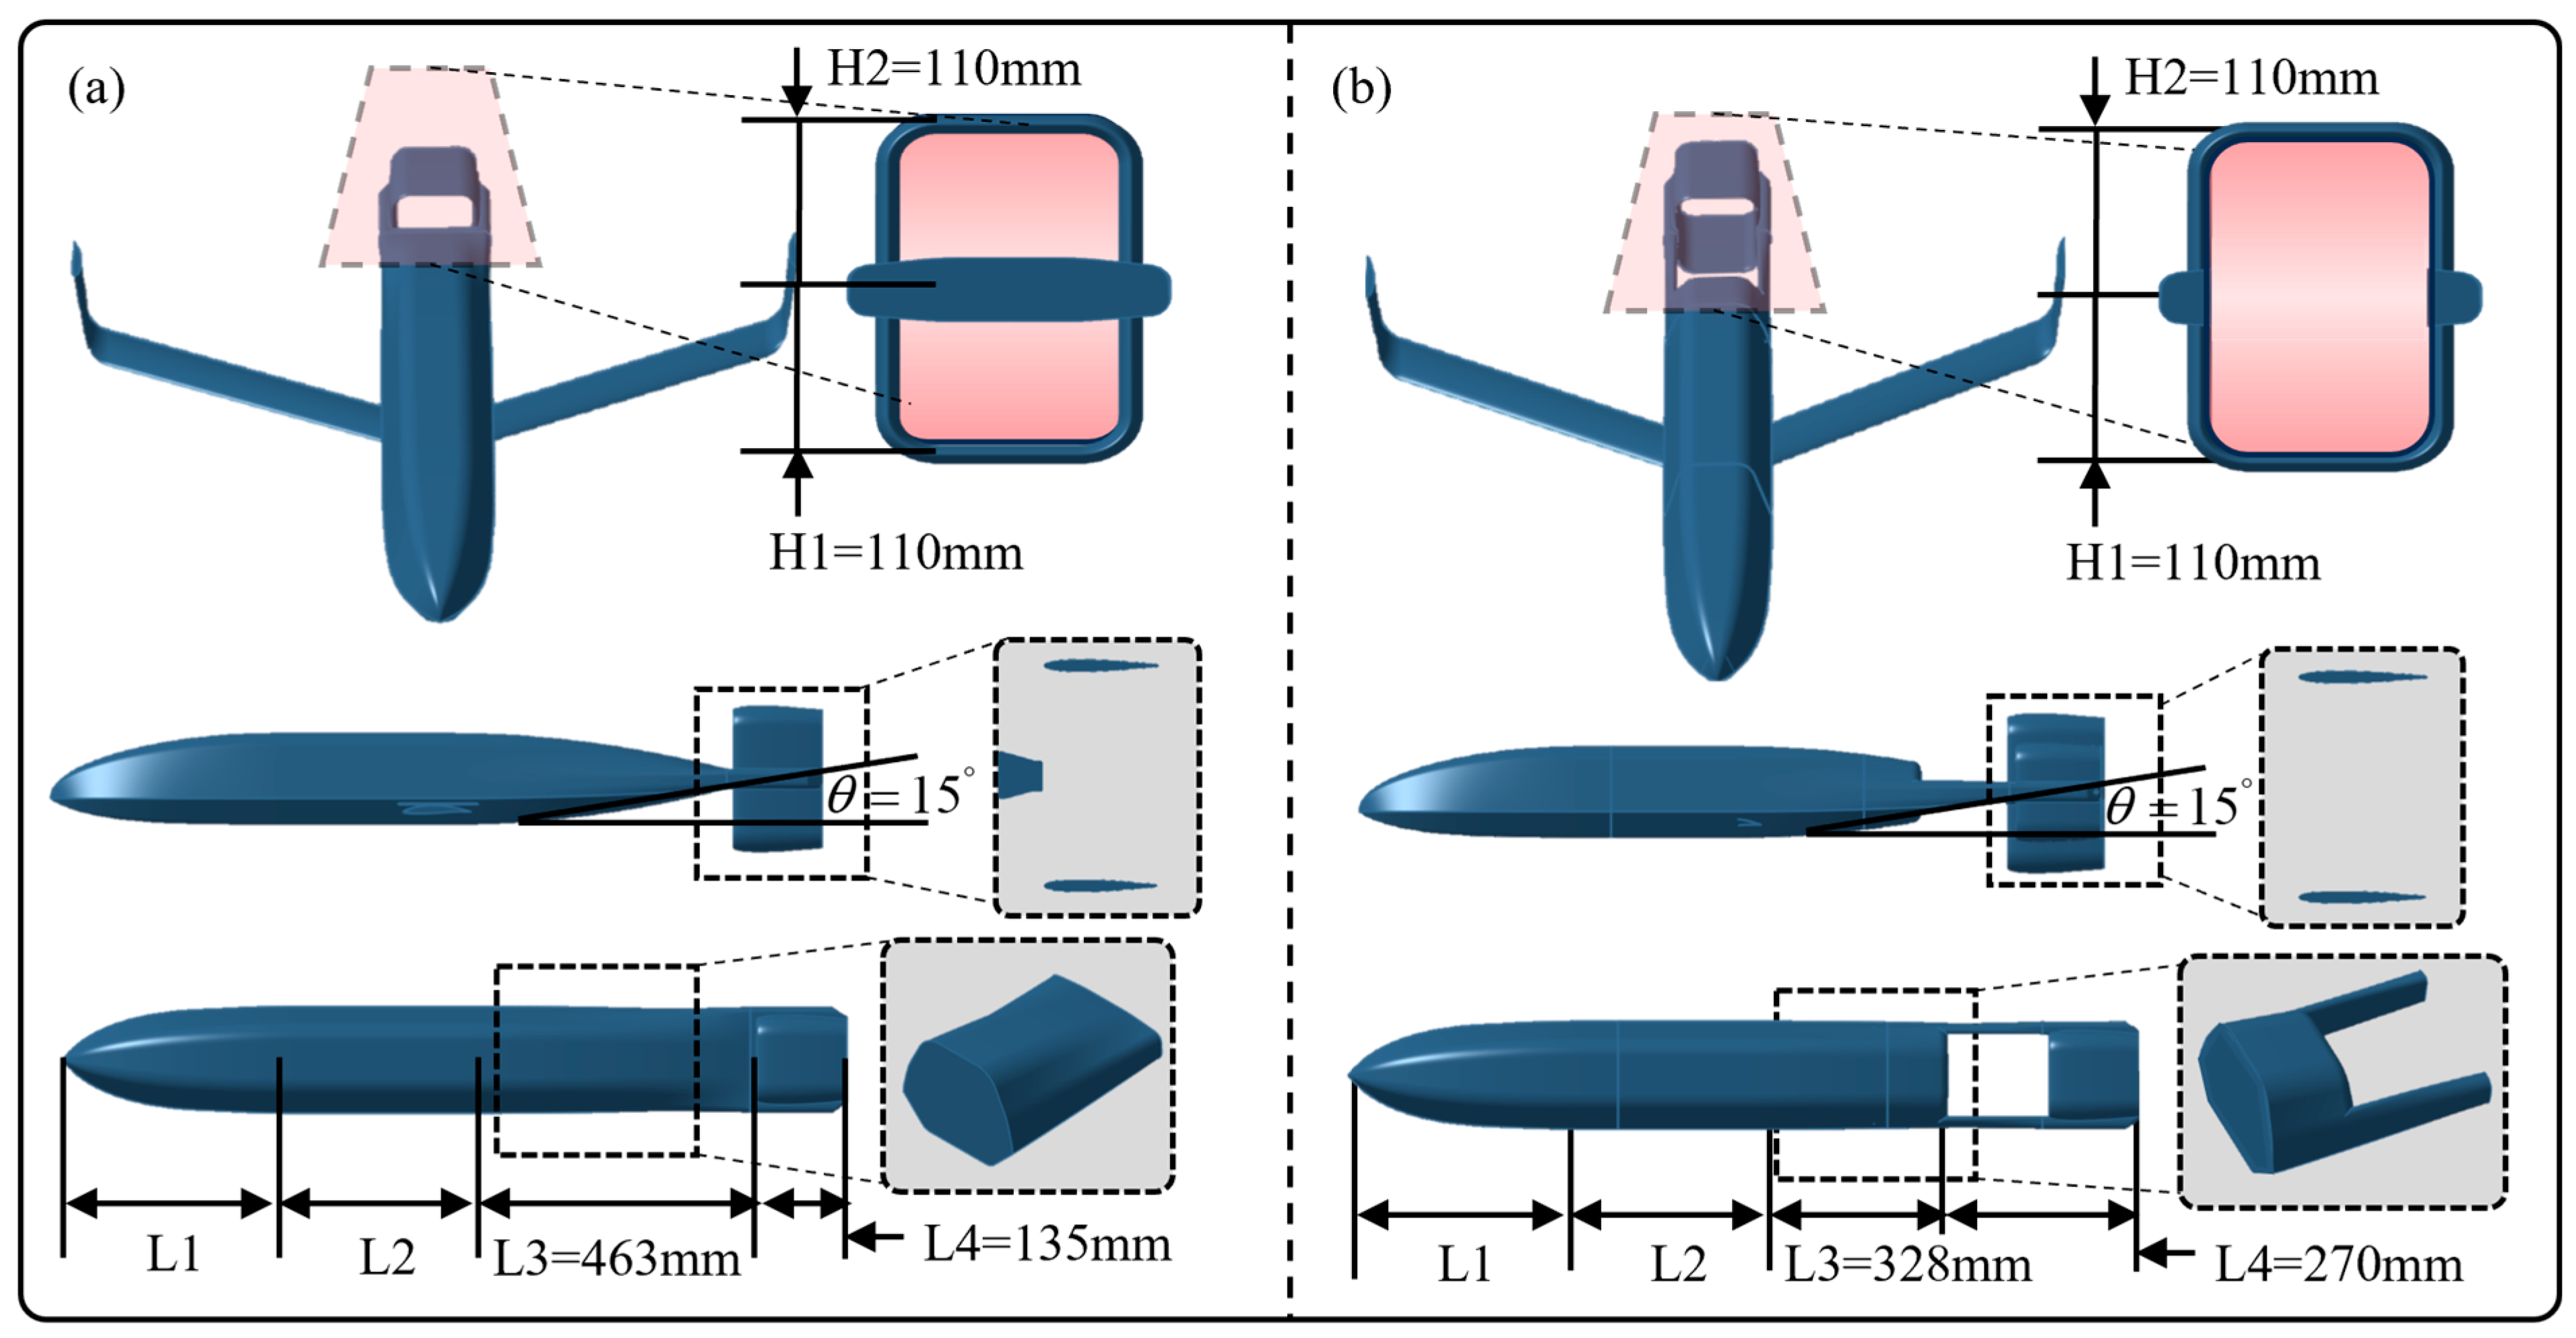
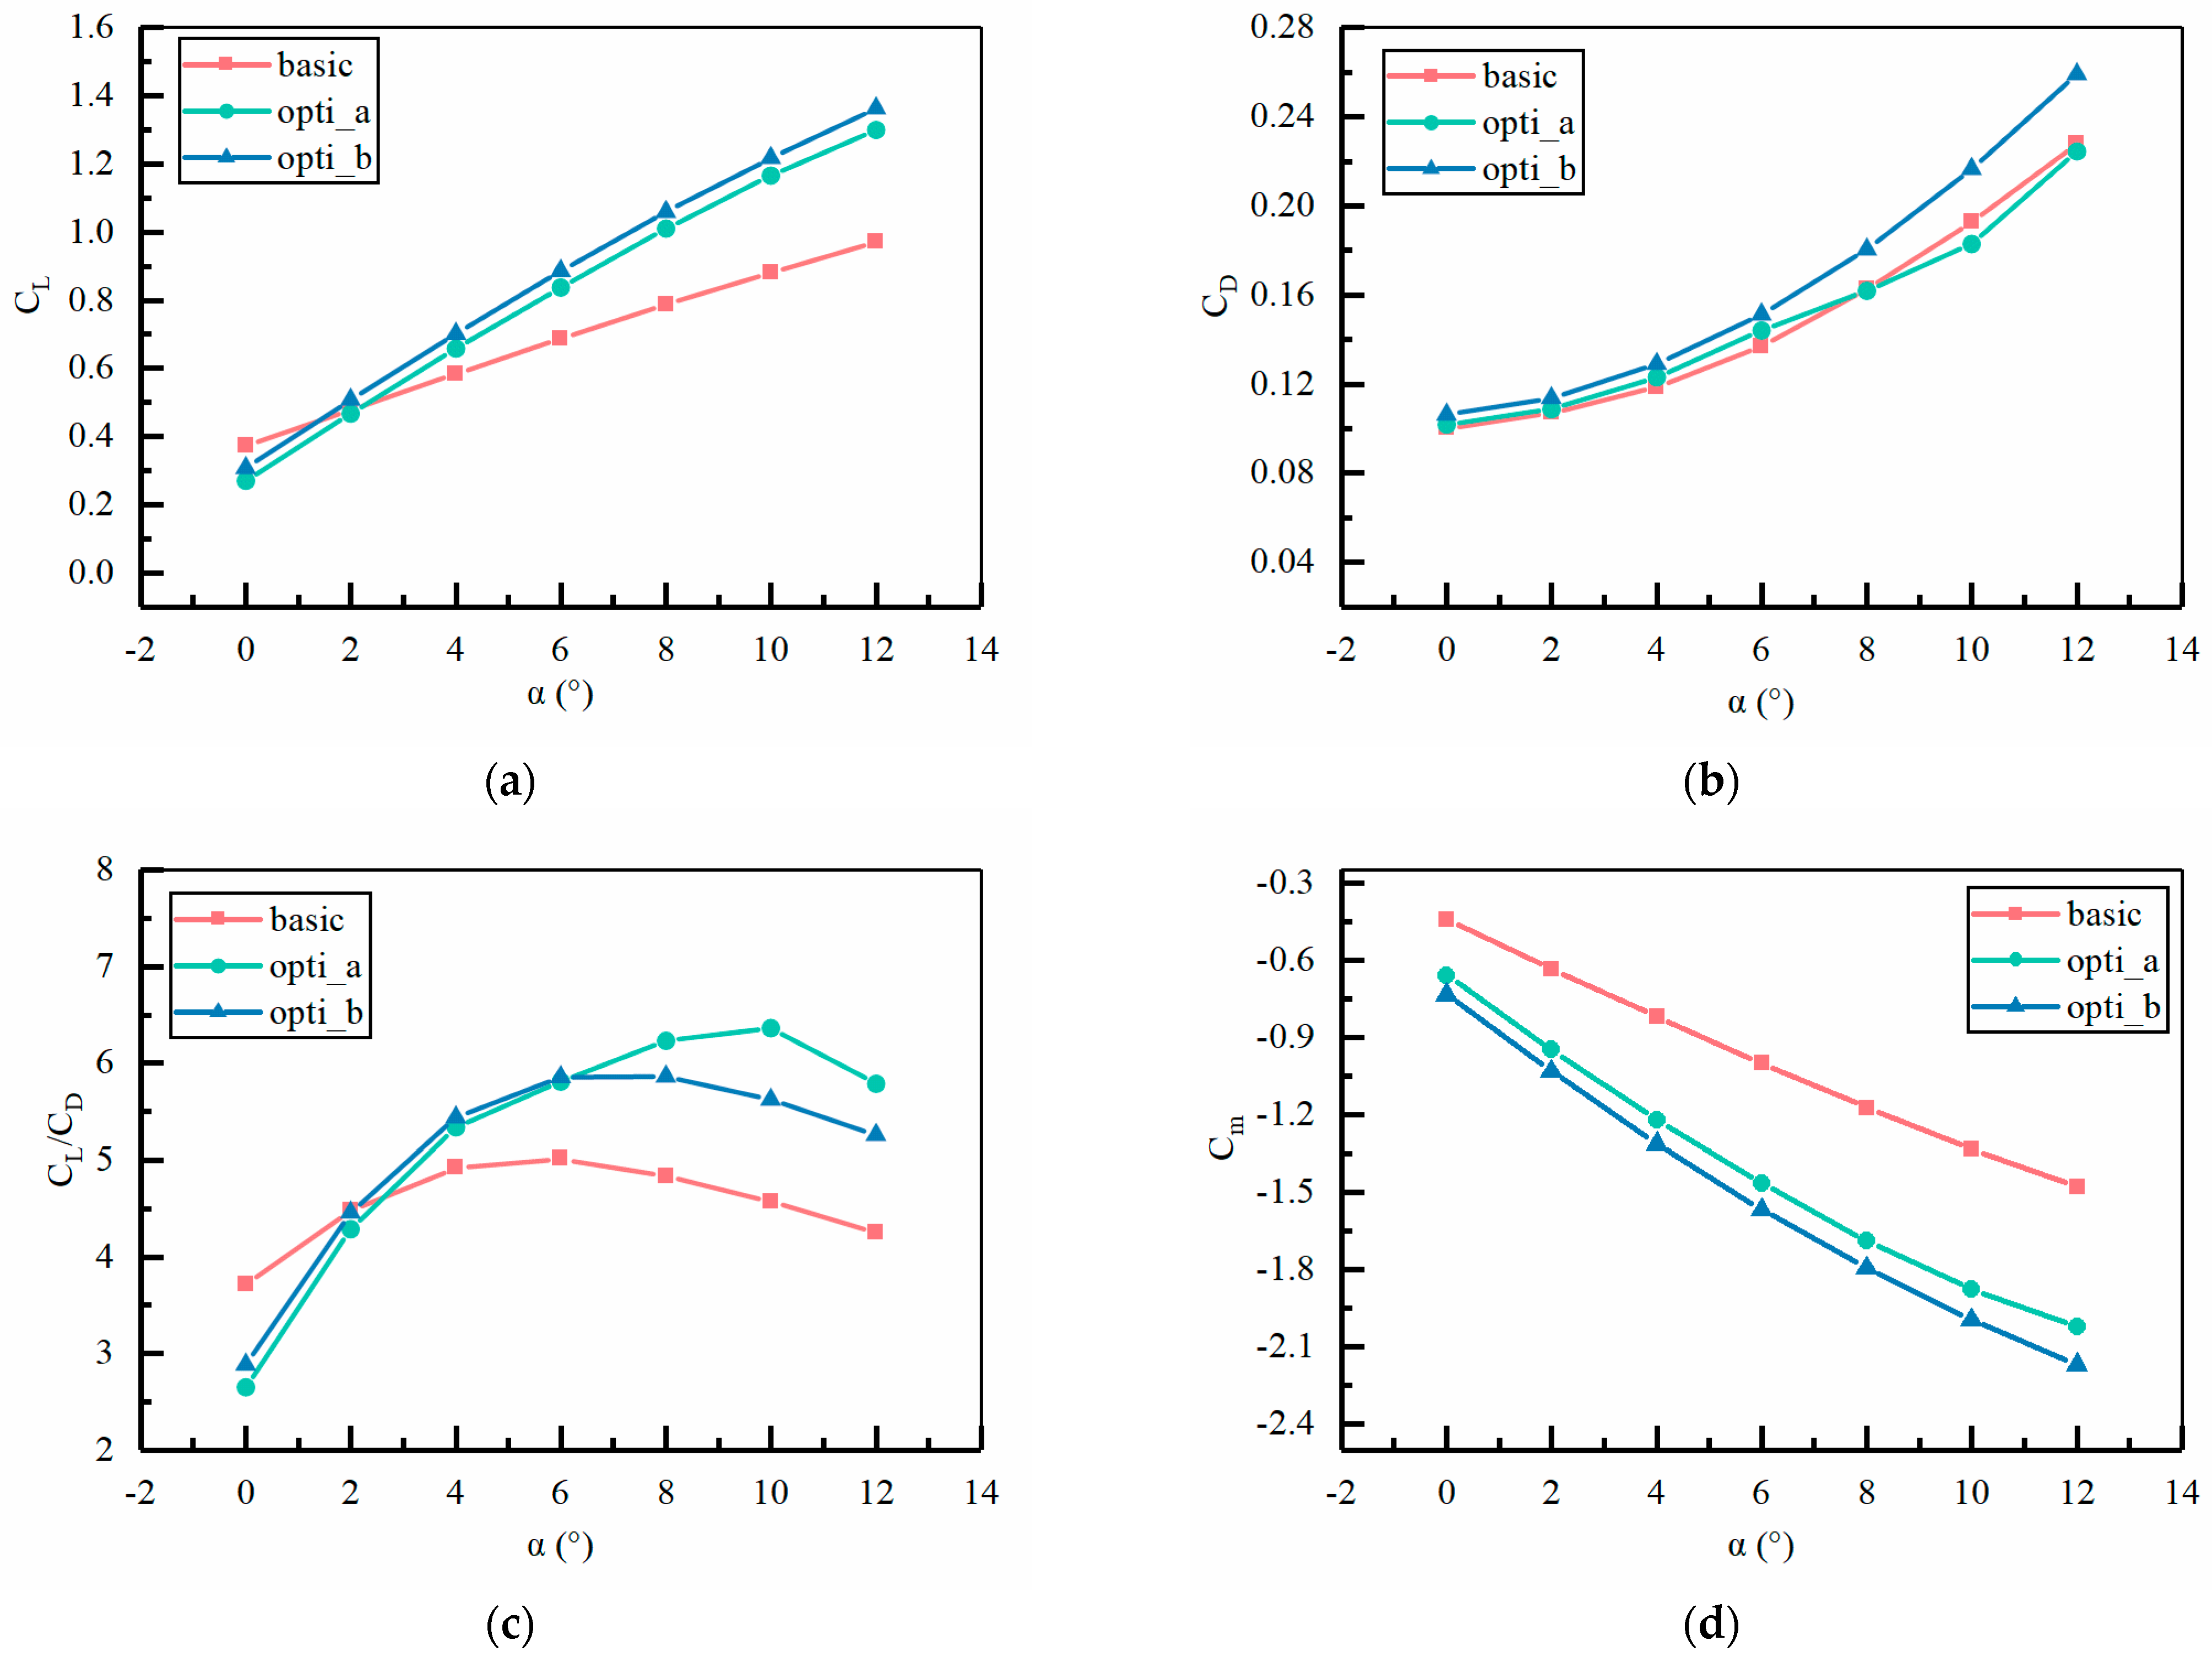
To reduce the adverse effects caused by the abrupt change in the shape of the transition region connecting the inclined and horizontal sections of the fuselage tail, the tail shape of the fuselage was optimized based on Sample 6 by eliminating the horizontal section at the tail of the fuselage, and two optimized configurations as shown in Figure 13 were obtained. Compared with configuration b and configuration a, the rest of the parameters are the same; the main difference is that the fuselage tail is profiled to further increase the distance between the trailing edge of the tailplane and the fuselage tail to reduce the airflow interference from the fuselage to the tail. As shown in Figure 14, the lift drag coefficient, pitching moment coefficient, pressure cloud, and velocity cloud of the two optimized configurations are compared and analyzed with the help of CFD numerical simulation software under the Ma = 0.35 cruise condition to verify the feasibility of the optimization method in this paper.
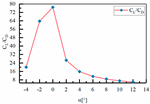
As shown in Figure 14, the two configurations after tail trimming optimization are compared with the lift coefficient curves, drag coefficient curves, lift-to-drag ratio curves, and pitching moment coefficient curves of sample 6. Compared with configuration b, configuration a and sample 6, the lift coefficient is significantly improved, the drag coefficient is slightly increased, the lift-to-drag ratio of configuration b is the largest in the cruise state at 6° angle of attack, and the pitching moment coefficient is the fastest decreasing. This comprehensively determines that the aerodynamic performance of configuration b is the best, and the aircraft’s static stability is the best in the pitching direction. The above conclusions coincide with the analysis in the previous section, which verifies the reasonableness and effectiveness of the integrated optimization of the multi-objective genetic algorithm and fuselage tail trimming for the improvement of aerodynamic performance and static stability of ducted tailed aircraft.
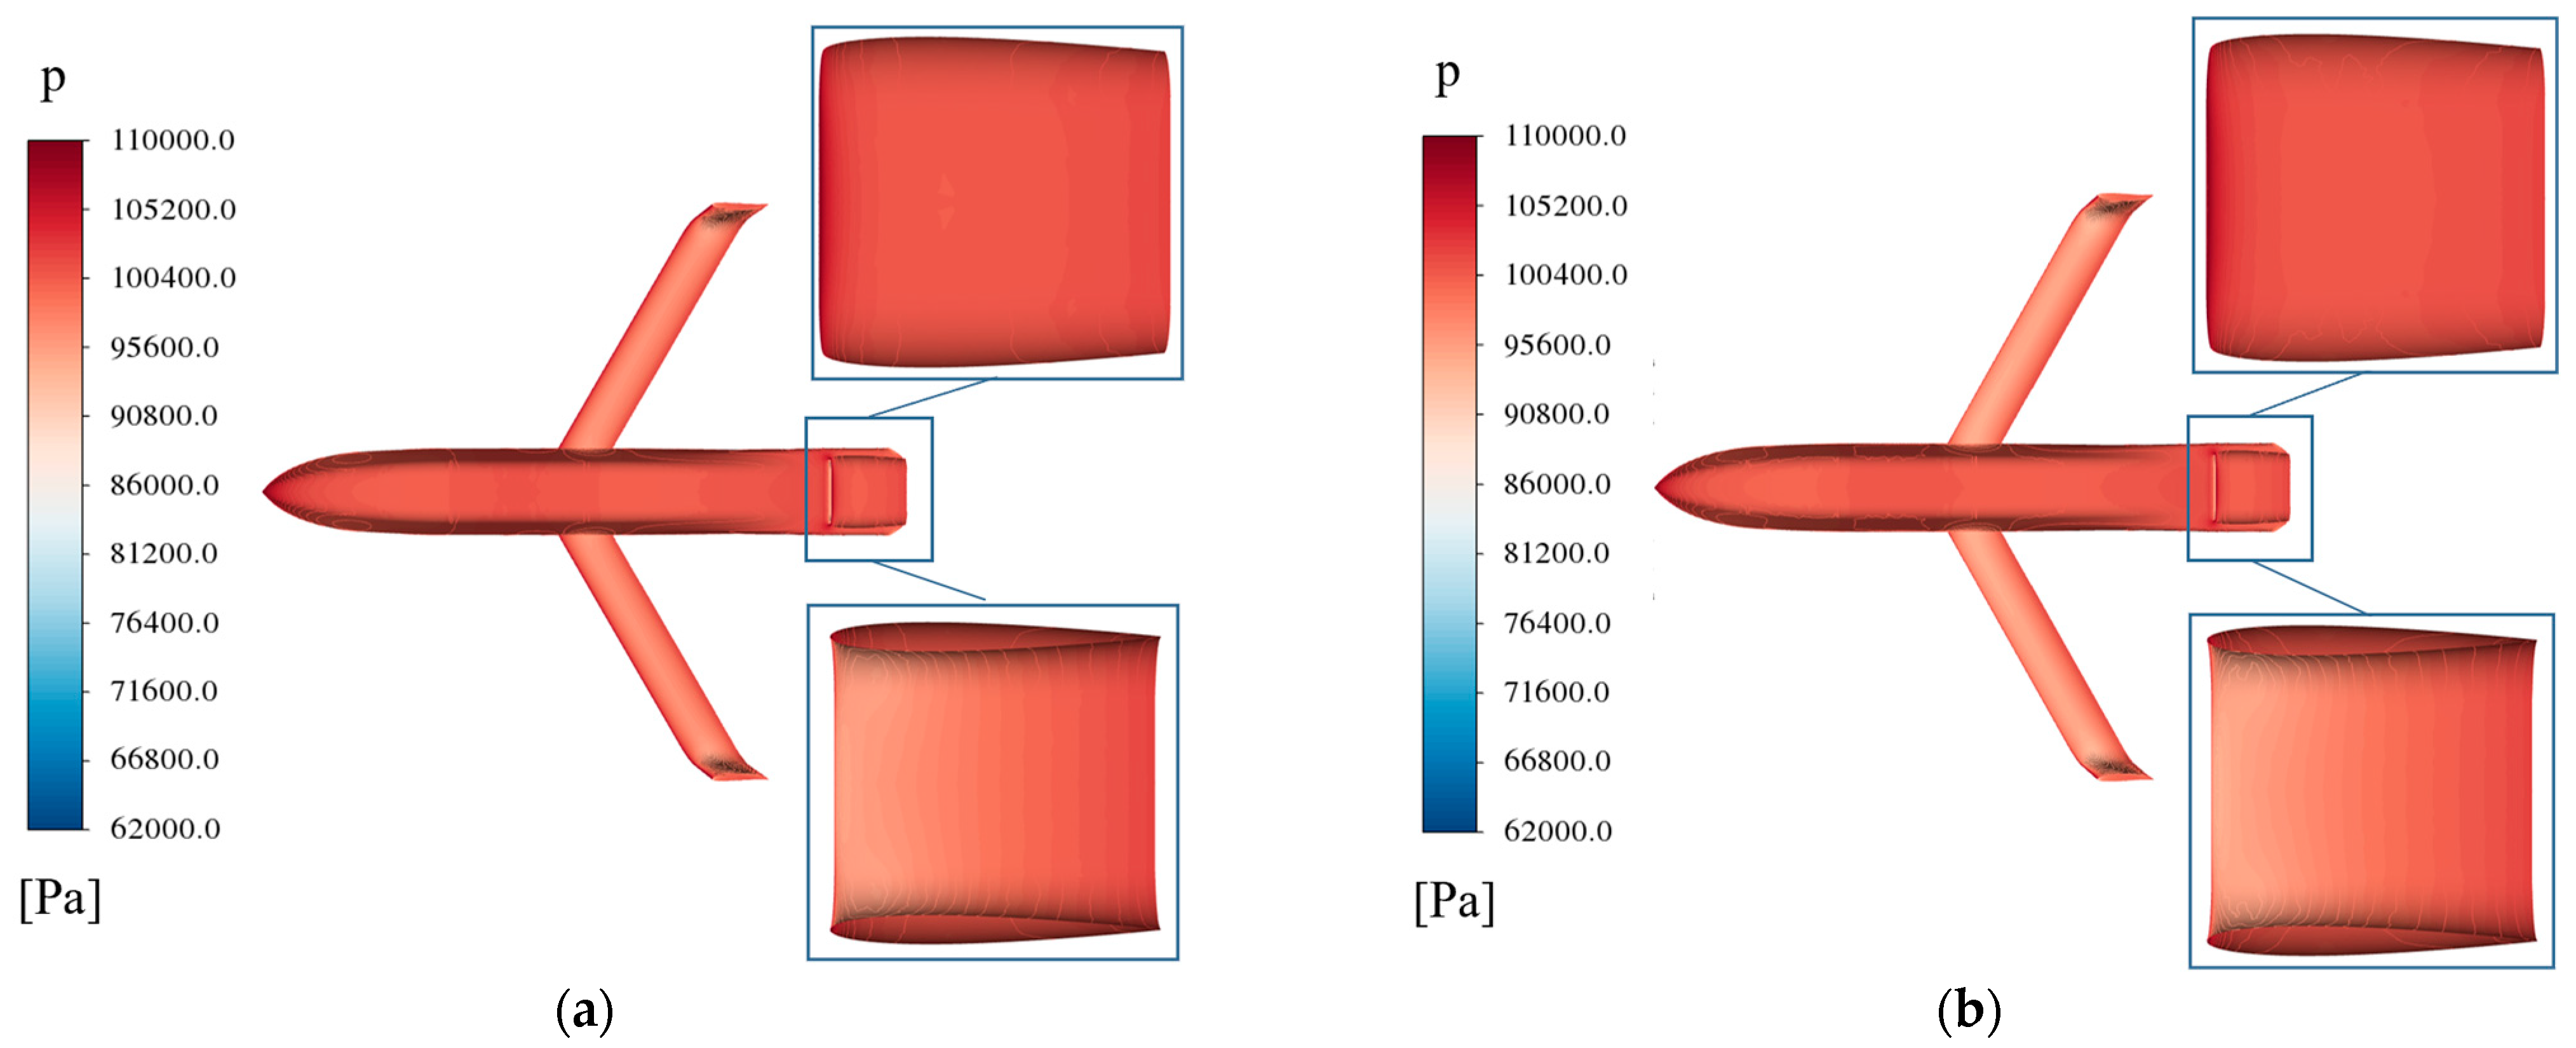
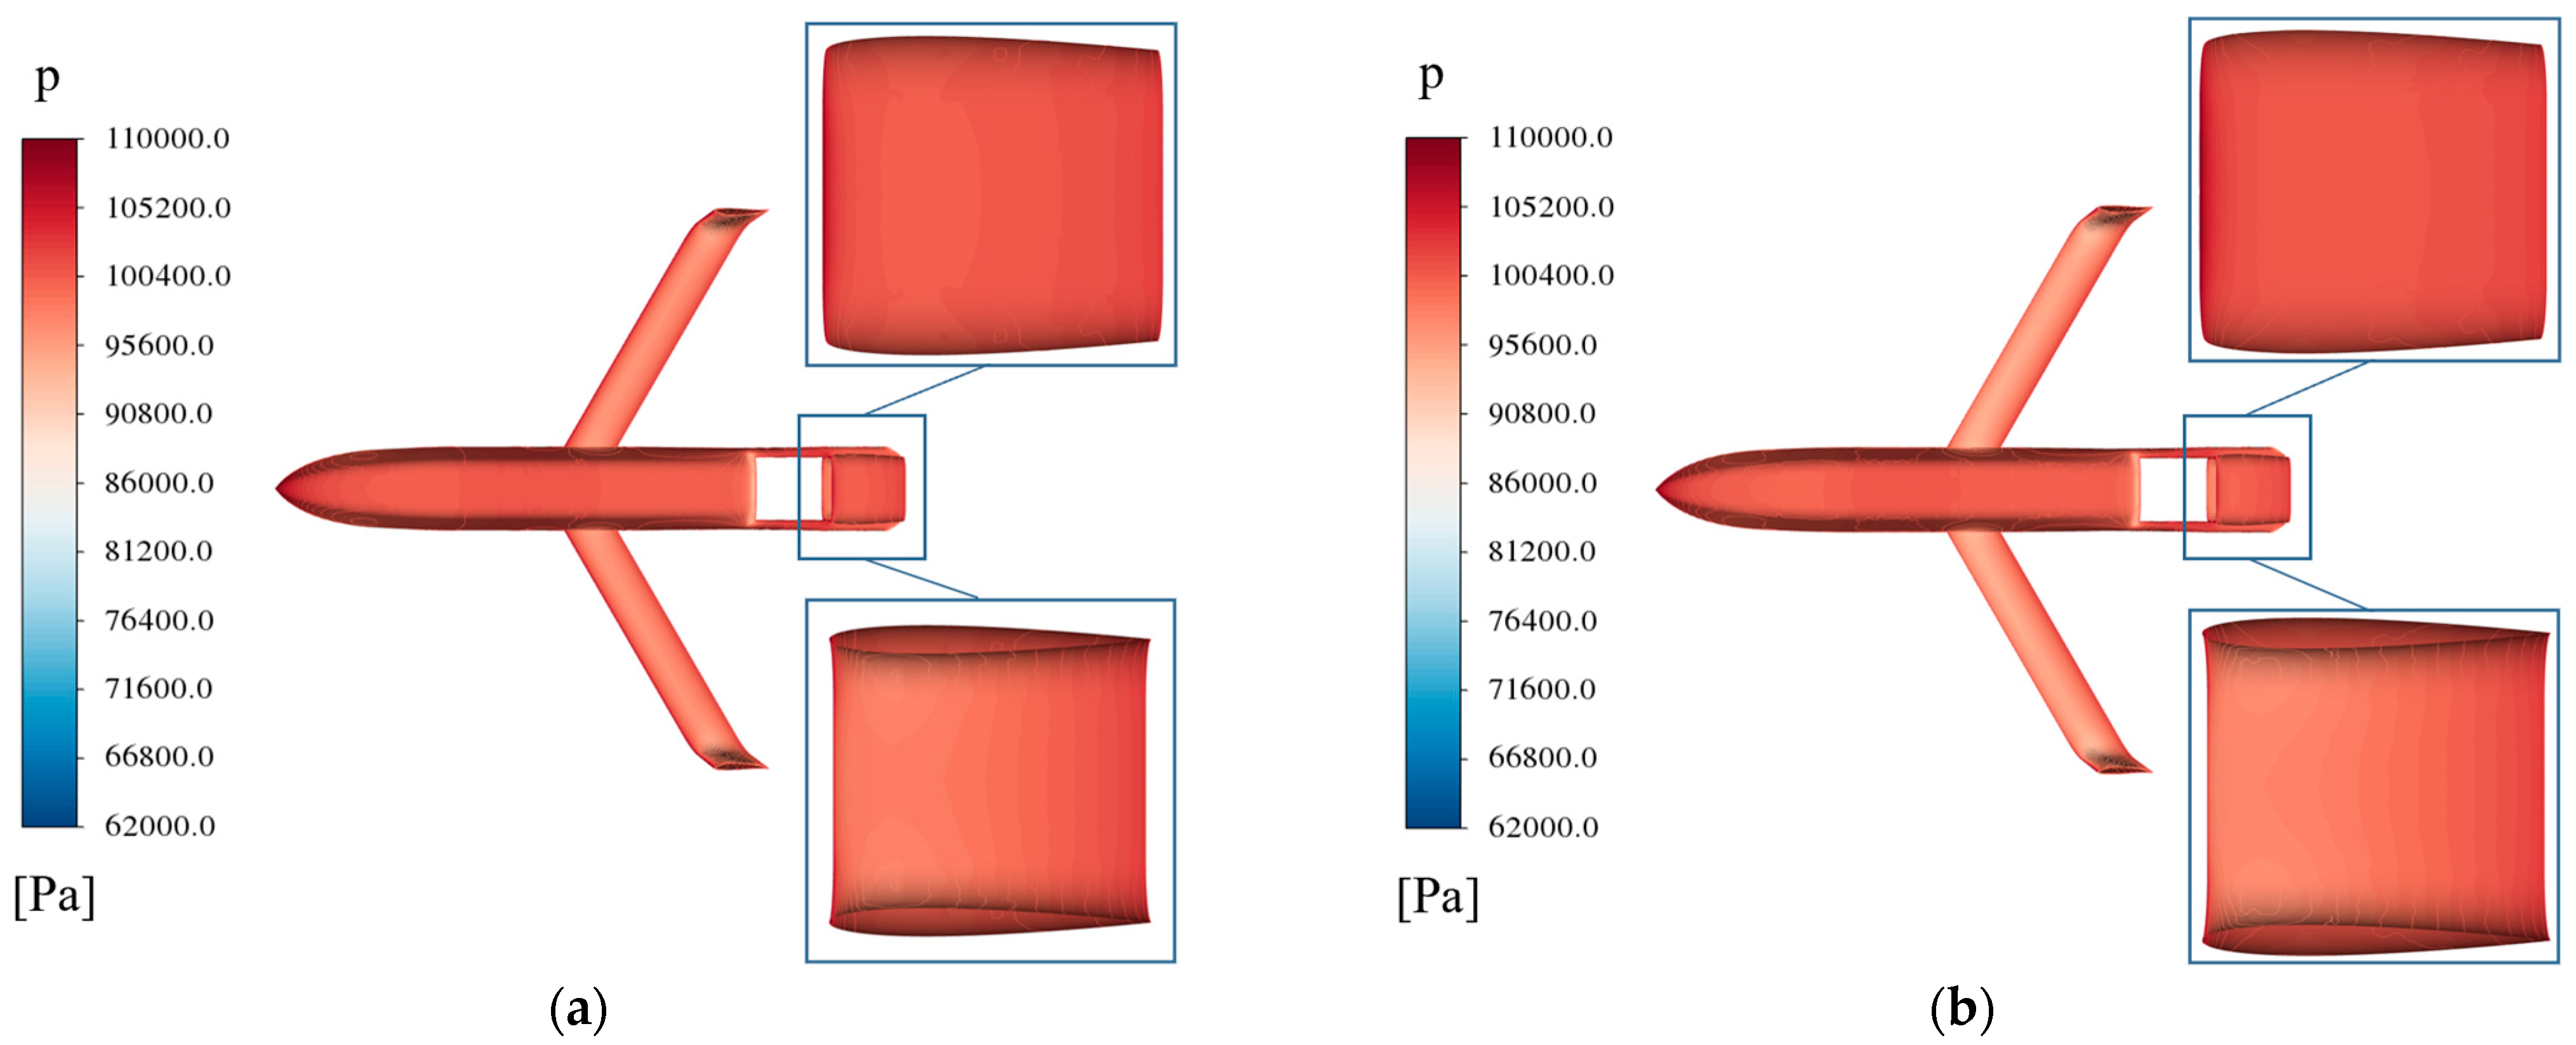
As shown in Figure 15 and Figure 16, which show the pressure cloud diagrams of configuration a and configuration b at Ma = 0.35 cruise state, after optimization, there is a significant pressure difference between the inner and outer surfaces of the duct. As the angle of attack increases from 0° to 12°, the high-pressure region on the outer surface of the duct increases slightly, and the low-pressure region on the inner surface of the duct increases significantly, resulting in an increase in the pressure difference between the inner and outer surfaces of the duct. The pressure clouds are consistent with the results of the aerodynamic characterization, which leads to an increase in the lift coefficient of the tail with the increase in the angle of attack.
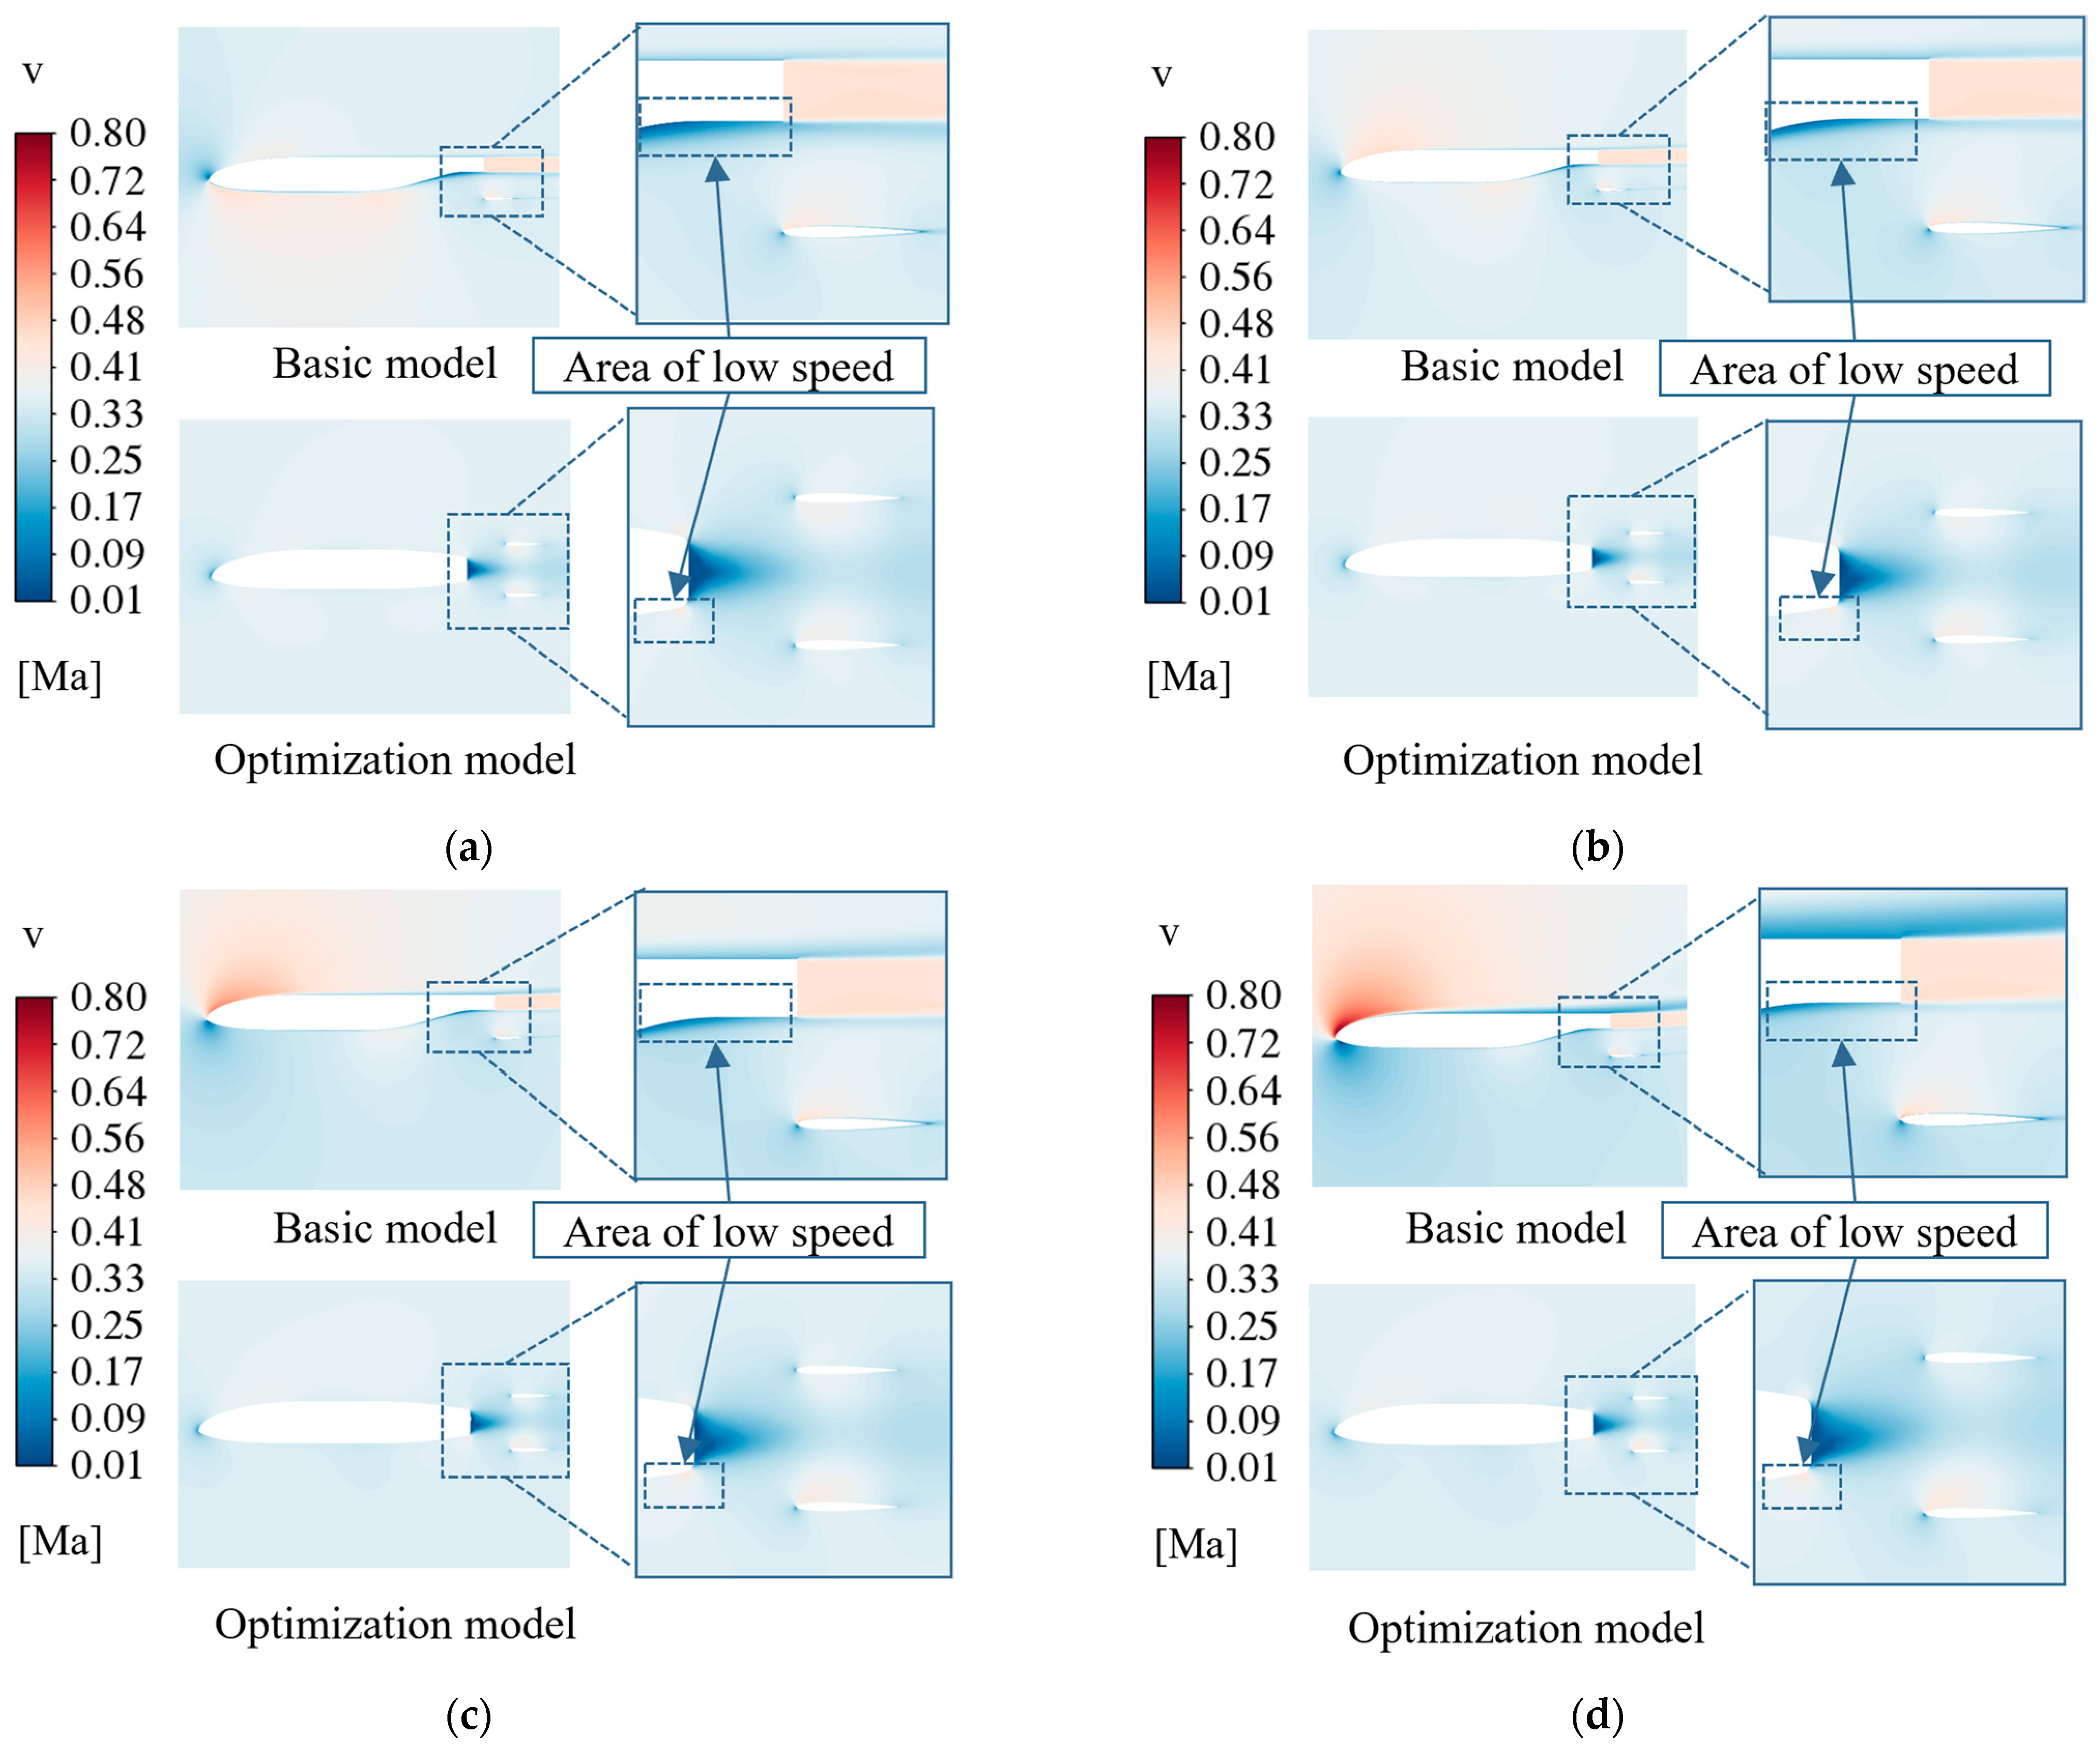
Combined with the comparative analysis results of the pressure clouds, Figure 17 and Figure 18 further analyze the velocity clouds of configuration a and configuration b at Ma = 0.35 cruise state. In order to highlight the improvement effect of the fuselage tail shape optimization on the low-speed region of the fuselage tail, the engine jet boundary condition is not set for the fuselage tail during the numerical simulation. Compared with the optimization results in Section 5.1.3, the low-speed region of the fuselage tail is obviously reduced, and the high-speed region of the inner surface of the duct is obviously larger than the comparison model. It shows that by reducing the fuselage tail profile mutation, the fuselage perturbation to the natural incoming flow can be effectively slowed down, the low-speed dead zone of the fuselage tail can be effectively reduced, the initial state of the airflow through the ducted tail is improved, and the chordal ring volume of the ducted tail is made to increase, which makes the lift of the ducted tail further increase.

6. Conclusions

In this paper, a ducted-tailed aircraft with a tail that does not need to be folded is designed, and the aerodynamic optimization and characterization of the ducted tail for a box-launched aircraft is carried out with respect to the airflow coupling between the ducted tail and the fuselage, which results in the nonlinearities of the coefficients of lift and other problems. A ducted tail aerodynamic optimization method based on the fusion of the SSA-BP approximate model and multi-objective genetic algorithm is proposed, and the effectiveness of the method is verified by numerical simulation. On the basis of this optimization result, the ducted tail and fuselage combination body is further optimized, and the optimal configuration of this ducted tail aircraft is determined through comprehensive aerodynamic analysis. Through the above research, the following conclusions are obtained:
(1) Based on the parametric design method, a box-launched ducted tail aircraft is designed, which avoids the need for the tail to be folded in the launching box and unfolded after launching; the lift generated by the ducted effect can be utilized to improve the pitch static stability of the aircraft in the process of flight. To effectively solve the box-launch aircraft tail folding mechanism is complex, and mechanical failure can easily be caused. Meanwhile, the parametric design of the ducted tail aircraft also provides parametric model input for subsequent aerodynamic optimization.
(2) There is airflow coupling between the ducted tail and the fuselage, and there will be lift coefficient nonlinearity and aircraft nonlinear control problems at different angles of attack. In this paper, the relative positions of the ducted tail and fuselage are optimized by combining the SSA-BP approximate model and multi-objective genetic algorithm with the objective of improving the cruise state lift-to-drag ratio of the ducted tail and the degree of linearization of the lift-to-drag curve. After the relative position of the ducted tail and fuselage is optimized, the degree of linearization of the lift coefficient curve of the tail is significantly improved, and the lift-to-drag ratio in the cruise state is significantly improved.
(3) On the basis of the above optimization, the influence of key parameters on the aerodynamic performance of the tail was analyzed by comparing the lift-drag curve, pressure cloud diagram and velocity cloud diagram. It is found that the sudden change in the shape of the transition area of the fuselage tail will cause the existence of a high-pressure area and velocity dead zone in the fuselage tail, which is not favorable to tail lift. The combination of the ducted tail and the fuselage is further shaped to generate two optimized configurations, and the optimal configuration of the ducted tail aircraft is determined by means of aerodynamic performance analysis. Compared with the basic configuration, the high-pressure area and velocity dead zone of the fuselage tail are significantly improved after the trimming optimization, and the lift-to-drag ratio and static stability of the aircraft are significantly improved, which provides a reference for the design of ducted-tailed aircraft.

Author Contributions

Conceptualization, H.J. and H.Z. (Huilong Zheng); methodology, H.J.; validation, H.J. and H.Z. (Hong Zhou); formal analysis, H.J. and Q.Z.; investigation, Q.Z.; resources, H.J.; data curation, H.J.; writing original draft preparation, H.J.; writing—review and editing, H.J. and H.Z. (Huilong Zheng); visualization, H.J.; supervision, H.J. All authors have read and agreed to the published version of the manuscript.

Funding

This research was funded by the Special Research Assistant Program (E3290C0101).

Institutional Review Board Statement

Not applicable.

Informed Consent Statement

Not applicable.

Data Availability Statement

The data presented in this study are available on request from the corresponding author due to privacy.

Conflicts of Interest

The authors declare no conflicts of interest.

References

  1. Chang, M.; Sun, Y.; Bai, J. Aerodynamic Design Optimization of Twice Folding Wing for Tube-Launched UAV Constrained by Flat-Angle Rotation Mechanism. ACTA Aeronaut. Astronaut. Sin. 2022, 43, 526331. [Google Scholar] [CrossRef]
  2. UAVs: Launch and Recovery. Air Space Eur. 1999, 1, 59–62. [CrossRef]
  3. Devi, P.A.; Priyadarsini, C.I.; Avvari, C. Design of Folded Wing Mechanism for Unmanned Aerial Vehicle (UAV). Mater. Today Proc. 2022, 62, 4117–4125. [Google Scholar] [CrossRef]
  4. Zhao, J.; Zeng, L.; Shao, X. A Novel Prediction Method for Unsteady Aerodynamic Force on Three-Dimensional Folding Wing Aircraft. Aerosp. Sci. Technol. 2023, 137, 108287. [Google Scholar] [CrossRef]
  5. Zhu, Z.; Guo, H.; Ma, J. Aerodynamic Layout Optimization Design of a Barrel-Launched UAV Wing Considering Control Capability of Multiple Control Surfaces. Aerosp. Sci. Technol. 2019, 93, 105297. [Google Scholar] [CrossRef]
  6. Quintana, A.; Graves, G.; Hassanalian, M.; Abdelkefi, A. Aerodynamic Analysis and Structural Integrity for Optimal Performance of Sweeping and Spanning Morphing Unmanned Air Vehicles. Aerosp. Sci. Technol. 2021, 110, 106458. [Google Scholar] [CrossRef]
  7. Zhang, B.; Guo, J.; Wang, H.; Tang, S. Autonomous Morphing Strategy for a Long-Range Aircraft Using Reinforcement Learning. Aerosp. Sci. Technol. 2024, 148, 109087. [Google Scholar] [CrossRef]
  8. Xu, W.; Li, Y.; Pei, B.; Yu, Z. Coordinated Intelligent Control of the Flight Control System and Shape Change of Variable Sweep Morphing Aircraft Based on Dueling-DQN. Aerosp. Sci. Technol. 2022, 130, 107898. [Google Scholar] [CrossRef]
  9. Chen, X.; Li, C.; Gong, C.; Gu, L.; RONCH, A.D. A Study of Morphing Aircraft on Morphing Rules along Trajectory. Chin. J. Aeronaut. 2021, 34, 232–243. [Google Scholar] [CrossRef]
  10. Wang, E.; Lu, H.; Zhang, J.; Wang, C.; Qiao, J. A Novel Adaptive Coordinated Tracking Control Scheme for a Morphing Aircraft with Telescopic Wings. Chin. J. Aeronaut. 2024, 37, 148–162. [Google Scholar] [CrossRef]
  11. Yan, B.; Dai, P.; Liu, R.; Xing, M.; Liu, S. Adaptive Super-Twisting Sliding Mode Control of Variable Sweep Morphing Aircraft. Aerosp. Sci. Technol. 2019, 92, 198–210. [Google Scholar] [CrossRef]
  12. Qiao, F.; Shi, J.; Qu, X.; Lyu, Y. Hardware-in-Loop Adaptive Neural Control for a Tiltable V-Tail Morphing Aircraft. Def. Technol. 2023, 22, 197–211. [Google Scholar] [CrossRef]
  13. Xu, H.; Han, J.; Yun, H.; Chen, X. Correction Method of Airfoil Thickness Effect in Hinge Moment Calculation of a Folding Wing. Chin. J. Aeronaut. 2020, 33, 922–932. [Google Scholar] [CrossRef]
  14. Guo, X.; Wang, S.; Qu, Y.; Cao, D. Nonlinear Dynamics of Z-Shaped Morphing Wings in Subsonic Flow. Aerosp. Sci. Technol. 2021, 119, 107145. [Google Scholar] [CrossRef]
  15. Mardanpour, P.; Hodges, D.H. Passive Morphing of Flying Wing Aircraft: Z-Shaped Configuration. J. Fluids Struct. 2014, 44, 17–30. [Google Scholar] [CrossRef]
  16. Balatti, D.; Khodaparast, H.H.; Friswell, M.I.; Manolesos, M.; Castrichini, A. Experimental and Numerical Investigation of an Aircraft Wing with Hinged Wingtip for Gust Load Alleviation. J. Fluids Struct. 2023, 119, 103892. [Google Scholar] [CrossRef]
  17. Tian, K.; Wang, Y.; Cao, D.; Yu, K. Approximate Global Mode Method for Flutter Analysis of Folding Wings. Int. J. Mech. Sci. 2024, 265, 108902. [Google Scholar] [CrossRef]
  18. Gu, H.; Healy, F.; Jayatilake, S.; Rezgui, D.; Lowenberg, M.; Cooper, J.; Wilson, T.; Castrichini, A. Flight Dynamics of Aircraft Incorporating the Semi-Aeroelastic Hinge. Aerosp. Sci. Technol. 2024, 147, 109026. [Google Scholar] [CrossRef]
  19. Ma, N.; Liu, L.; Meng, F.; Meng, J. Structural Design and Modal Behaviors Analysis of a New Swept Baffled Inflatable Wing. Def. Technol. 2023, 24, 382–398. [Google Scholar] [CrossRef]
  20. Beguin, B.; Breitsamter, C.; Adams, N. Wake Measurements to Assess the Flow-Structure Interaction of an Elasto-Flexible Morphing Wing Configuration. In New Results in Numerical and Experimental Fluid Mechanics VIII: Contributions to the 17th STAB/DGLR Symposium Berlin, Germany 2010; Dillmann, A., Heller, G., Kreplin, H.-P., Nitsche, W., Peltzer, I., Eds.; Springer Berlin Heidelberg: Berlin, Heidelberg, 2013; pp. 43–50. [Google Scholar] [CrossRef]
  21. Chen, L.; Hu, Q.; Zhang, H.; Tong, B.; Shi, X.; Jiang, C.; Sun, L. Research on Underwater Motion Modeling and Closed-Loop Control of Bionic Undulating Fin Robot. Ocean Eng. 2024, 299, 117400. [Google Scholar] [CrossRef]
  22. Li, M.; Bai, J.; Li, L.; Meng, X.; Liu, Q.; Chen, B. A Gradient-Based Aero-Stealth Optimization Design Method for Flying Wing Aircraft. Aerosp. Sci. Technol. 2019, 92, 156–169. [Google Scholar] [CrossRef]
  23. Song, L.; Yang, H.; Zhang, Y.; Zhang, H.; Huang, J. Dihedral Influence on Lateral–Directional Dynamic Stability on Large Aspect Ratio Tailless Flying Wing Aircraft. Chin. J. Aeronaut. 2014, 27, 1149–1155. [Google Scholar] [CrossRef]
  24. Li, P.; Zhang, B.; Chen, Y.; Yuan, C.; Lin, Y. Aerodynamic Design Methodology for Blended Wing Body Transport. Chin. J. Aeronaut. 2012, 25, 508–516. [Google Scholar] [CrossRef]
  25. Tianyuan, H.; Xiongqing, Y. Aerodynamic/Stealthy/Structural Multidisciplinary Design Optimization of Unmanned Combat Air Vehicle. Chin. J. Aeronaut. 2009, 22, 380–386. [Google Scholar] [CrossRef]
  26. Benaouali, A.; Kachel, S. Multidisciplinary Design Optimization of Aircraft Wing Using Commercial Software Integration. Aerosp. Sci. Technol. 2019, 92, 766–776. [Google Scholar] [CrossRef]
  27. Wu, Y.C.; Sun, G.; Tao, J. Optimization design on the wig of a general aviation airplane based on deep belief network and multi-objective particle swarm optimization algorithm. Acta Aerodyn. Sin. 2023, 41, 16–27. [Google Scholar]
  28. Panagiotou, P.; Yakinthos, K. Aerodynamic Efficiency and Performance Enhancement of Fixed-Wing UAVs. Aerosp. Sci. Technol. 2020, 99, 105575. [Google Scholar] [CrossRef]
  29. Altunkaya, E.C.; Ozkol, I. Multi-Parameter Aerodynamic Design of a Horizontal Tail Using an Optimization Approach. Aerosp. Sci. Technol. 2022, 121, 107310. [Google Scholar] [CrossRef]
  30. Davari, A.R. A Simple Analytical Model to Describe the Impact of Wing on the Flowfield over the Tail in Subsonic Flow. Aerosp. Sci. Technol. 2018, 75, 88–98. [Google Scholar] [CrossRef]
  31. Davari, A.R.; Soltani, M.R.; Askari, F.; Pajuhande, H.R. Effects of Wing Geometry on Wing-Body-Tail Interference in Subsonic Flow. Sci. Iran. 2011, 18, 407–415. [Google Scholar] [CrossRef]
  32. Zhou, Z.; Huang, J. Facilitating Learning Adaptive V-Tail of a Supersonic Missile for Radar Cross-Section Reduction during Interval Flight. Heliyon 2023, 9, e20984. [Google Scholar] [CrossRef]
  33. Kim, H.D.; Brown, G.V.; Felder, J.L. Distributed Turboelectric Propulsion for Hybrid Wing Body Aircraft. In Proceedings of the 2008 International Powered Lift Conference Royal Aeronautical Society, London, UK, 22–24 July 2008. [Google Scholar]
  34. Sun, P.B.; Zhou, Z.; Li, X. Influence analysis and optimization of distribution-propulsion-wing parameters with target aerodynamic characteristics. Acta Aeronaut. Et Astronaut. Sin. 2024, 45, 204–221. [Google Scholar]
  35. Wang, K.; Zhou, Z.; Fan, Z.; Guo, J. Aerodynamic Design of Tractor Propeller for High-Performance Distributed Electric Propulsion Aircraft. Chin. J. Aeronaut. 2021, 34, 20–35. [Google Scholar] [CrossRef]
  36. Schetz, J.A.; Hosder, S.; Dippold, V.; Walker, J. Propulsion and Aerodynamic Performance Evaluation of Jet-Wing Distributed Propulsion. Aerosp. Sci. Technol. 2010, 14, 1–10. [Google Scholar] [CrossRef]
  37. Blackwell, J.A. Aerodynamic Characteristics of an 11-Percent-Thick Symmetrical Supercritical Airfoil at Mach Numbers between 0.30 and 0.85; NASA: Washington, DC, USA, 1969. [Google Scholar]
  38. Hu, J.; Zhou, Q.; Jiang, P.; Xie, T. An Improved Hierarchical Kriging for Variable-Fidelity Surrogate Modeling. In Proceedings of the 2016 International Conference on Cybernetics, Robotics and Control (CRC), Hong Kong, China, 19–21 August 2016; pp. 86–90. [Google Scholar]
  39. Lam, X.; Kim, Y.; Hoang, A.; Park, C. Coupled Aerostructural Design Optimization Using the Kriging Model and Integrated Multiobjective Optimization Algorithm. J. Optim. Theory Appl. 2009, 142, 533–556. [Google Scholar] [CrossRef]
  40. Xue, J.-K.; Shen, B. A Novel Swarm Intelligence Optimization Approach: Sparrow Search Algorithm. Syst. Sci. Control Eng. 2020, 8, 22–34. [Google Scholar] [CrossRef]
  41. Wang, X.; Liu, J.; Hou, T.; Pan, C. The SSA-BP-Based Potential Threat Prediction for Aerialtarget Considering Commander Emotion. Def. Technol. 2021, 18, 2097–2106. [Google Scholar] [CrossRef]
  42. Xin, J.; Chen, J.; Li, C.; Lu, R.; Li, X.; Wang, C.; Zhu, H.; He, R. Deformation Characterization of Oil and Gas Pipeline by ACM Technique Based on SSA-BP Neural Network Model. Measurement 2022, 189, 110654. [Google Scholar] [CrossRef]
  43. Wang, J.; Sheng, Z.; Zhou, B.; Zhou, S. Lightning Potential Forecast over Nanjing with Denoised Sounding-Derived Indices Based on SSA and CS-BP Neural Network. Atmospheric Res. 2014, 137, 245–256. [Google Scholar] [CrossRef]
  44. Ghorani, M.M.; Haghighi, M.H.S.; Riasi, A. Entropy Generation Minimization of a Pump Running in Reverse Mode Based on Surrogate Models and NSGA-II. Int. Commun. Heat Mass Transf. 2020, 118, 104898. [Google Scholar] [CrossRef]
Figure 1. Schematic diagram of the research object. (a) Traditional box launch aircraft; (b) Ducted tail wing aircraft; (c) Parameterization and jet control principles.
Applsci 14 06496 g001
Figure 2. Computational mesh. (a) NACA0012 airfoil; (b) Ducted tail model.
Applsci 14 06496 g002
Figure 3. Meshes—independent and computational accuracy validation. (a) Meshes—independent validation; (b) calculation accuracy validation.
Applsci 14 06496 g003
Figure 4. Schematic diagram of the optimization process.
Applsci 14 06496 g004
Figure 5. Flowchart of SSA-BP approximate model.
Applsci 14 06496 g005
Figure 6. Parameter approximation comparison. (a) Lift coefficient approximation; (b) drag coefficient approximation.
Applsci 14 06496 g006
Figure 7. Comparison of the combined errors. (a) Combined error of lift coefficient; (b) combined error of drag coefficient.
Applsci 14 06496 g007
Figure 8. Effect of L4 on lift and drag characteristics. (a) Lift coefficient comparison; (b) lift-to-drag ratio comparison; (c) pressure coefficient at 6° angle of attack.
Applsci 14 06496 g008
Figure 9. Effect of H1 on lift and drag characteristics. (a) Lift coefficient comparison; (b) lift-to-drag ratio comparison; (c) pressure coefficient at 6° angle of attack.
Applsci 14 06496 g009
Figure 10. Effect of L4 and H1 on lift and drag characteristics. (a) Lift coefficient comparison; (b) lift-to-drag ratio comparison; (c) pressure coefficient at 6° angle of attack.
Applsci 14 06496 g010
Figure 11. Comparison of pressure cloud images between sample 6 and sample 2. (a) AOA = 0°; (b) AOA = 4°; (c) AOA = 8°; (d) AOA = 12°.
Applsci 14 06496 g011aApplsci 14 06496 g011b
Figure 12. Comparison of velocity cloud images between sample 6 and sample 2. (a) AOA = 0°; (b) AOA = 4°; (c) AOA = 8°; (d) AOA = 12°.
Applsci 14 06496 g012
Figure 13. Schematic diagram of optimized configurations. (a) Parameters of configuration a; (b) Parameters of configuration b.
Applsci 14 06496 g013
Figure 14. Aerodynamic performance comparison of optimized configuration. (a) Lift coefficient comparison; (b) drag coefficient comparison; (c) lift-to-drag ratio comparison; (d) pitching moment coefficient comparison.
Applsci 14 06496 g014
Figure 15. Pressure cloud for configuration a. (a) AOA = 0°; (b) AOA = 4°; (c) AOA = 8°; (d) AOA = 12°.
Applsci 14 06496 g015aApplsci 14 06496 g015b
Figure 16. Pressure cloud for configuration b. (a) AOA = 0°; (b) AOA = 4°; (c) AOA = 8°; (d) AOA = 12°.
Applsci 14 06496 g016aApplsci 14 06496 g016b
Figure 17. Comparison of velocity cloud images between sample 6 and configuration a. (a) AOA = 0°; (b) AOA = 4°; (c) AOA = 8°; (d) AOA = 12°.
Applsci 14 06496 g017
Figure 18. Comparison of velocity cloud images between sample 6 and configuration b. (a) AOA = 0°; (b) AOA = 4°; (c) AOA = 8°; (d) AOA = 12°.
Applsci 14 06496 g018
Table 1. List of relative position parameters.
NumberParametersValue Range (mm)
1H150~140
2H250~140
3L1200
4L1350
5L2250
6L3400~600
7L40~363
8 θ 0°~20°
Table 2. Computational mesh information.
ParametersNumber of Coarse MeshesNumber of Medium MeshesNumber of Refined Meshes
NACA0012140,000/210,00050,000/470,000680,000
Ducted tail model340,000690,0001,500,000
Table 3. Comparison of simulation results using different computational meshes.
ParametersNumber of Coarse MeshesNumber of Medium MeshesNumber of Refined Meshes
Lift coefficient of the ducted tail0.18850.19580.1975
Drag coefficient of the ducted tail0.01090.01130.0148
Table 4. Data from selected sample models.
NumberParameters Lift CoefficientDrag Coefficient
1H1 = 50 mm
H2 = 50 mm
L3 = 300 mm
L4 = 27 mm
Applsci 14 06496 i001Applsci 14 06496 i002
2H1 = 67.5 mm
H2 = 50 mm
L3 = 350 mm
L4 = 135 mm
Applsci 14 06496 i003Applsci 14 06496 i004
3H1 = 80 mm
H2 = 50 mm
L3 = 420 mm
L4 = 216 mm
Applsci 14 06496 i005Applsci 14 06496 i006
4H1 = 100 mm
H2 = 00 mm
L3 = 465 mm
L4 = 00 mm
Applsci 14 06496 i007Applsci 14 06496 i008
5H1 = 110 mm
H2 = 00 mm
L3 = 460 mm
L4 = 243 mm
Applsci 14 06496 i009Applsci 14 06496 i010
6H1 = 110 mm
H2 = 00 mm
L3 = 400 mm
L4 = 270 mm
Applsci 14 06496 i011Applsci 14 06496 i012
7H1 = 120 mm
H2 = 00 mm
L3 = 380 mm
L4 = 135 mm
Applsci 14 06496 i013Applsci 14 06496 i014
8H1 = 140 mm
H2 = 00 mm
L3 = 410 mm
L4 = 270 mm
Applsci 14 06496 i015Applsci 14 06496 i016
Table 5. Initial parameter settings of the SSA-BP and PSO-BP.
NumberParametersValue
SSA-BPInitial sparrow population60
Number of iterations100
Warning value0.8
Percentage of discoverers0.4
Percentage of anti-predatory sparrows0.3
PSO-BPInitial population size60
Number of iterations100
Acceleration constant C11.5
Acceleration constant C21.5
Inertial weighting0.8
Table 6. Original model and partial Pareto solution.
NumberParametersLift CoefficientLift-Drag Ratio
Sample 1H1 = 67.5 mm
L3 = 460 mm
L4 = 0 mm
Applsci 14 06496 i017Applsci 14 06496 i018
Sample 2H1 = 67.5 mm
L3 = 457 mm
L4 = 27 mm
Applsci 14 06496 i019Applsci 14 06496 i020
Sample 3H1 = 67.5 mm
L3 = 455 mm
L4 = 135 mm
Applsci 14 06496 i021Applsci 14 06496 i022
Sample 4H1 = 67.5 mm
L3 = 470 mm
L4 = 216 mm
Applsci 14 06496 i023Applsci 14 06496 i024
Sample 5H1 = 140 mm
L3 = 460 mm
L4 = 27 mm
Applsci 14 06496 i025Applsci 14 06496 i026
Sample 6H1 = 110 mm
L3 = 463 mm
L4 = 135 mm
Applsci 14 06496 i027Applsci 14 06496 i028
Sample 7H1 = 110 mm
L3 = 455 mm
L4 = 162 mm
Applsci 14 06496 i029Applsci 14 06496 i030
Sample 8H1 = 110 mm
L3 = 465 mm
L4 = 189 mm
Applsci 14 06496 i031Applsci 14 06496 i032
Disclaimer/Publisher’s Note: The statements, opinions and data contained in all publications are solely those of the individual author(s) and contributor(s) and not of MDPI and/or the editor(s). MDPI and/or the editor(s) disclaim responsibility for any injury to people or property resulting from any ideas, methods, instructions or products referred to in the content.