
Advanced Industrial Fault Detection: A Comparative Analysis of Ultrasonic Signal Processing and Ensemble Machine Learning Techniques


Abstract
1. Introduction
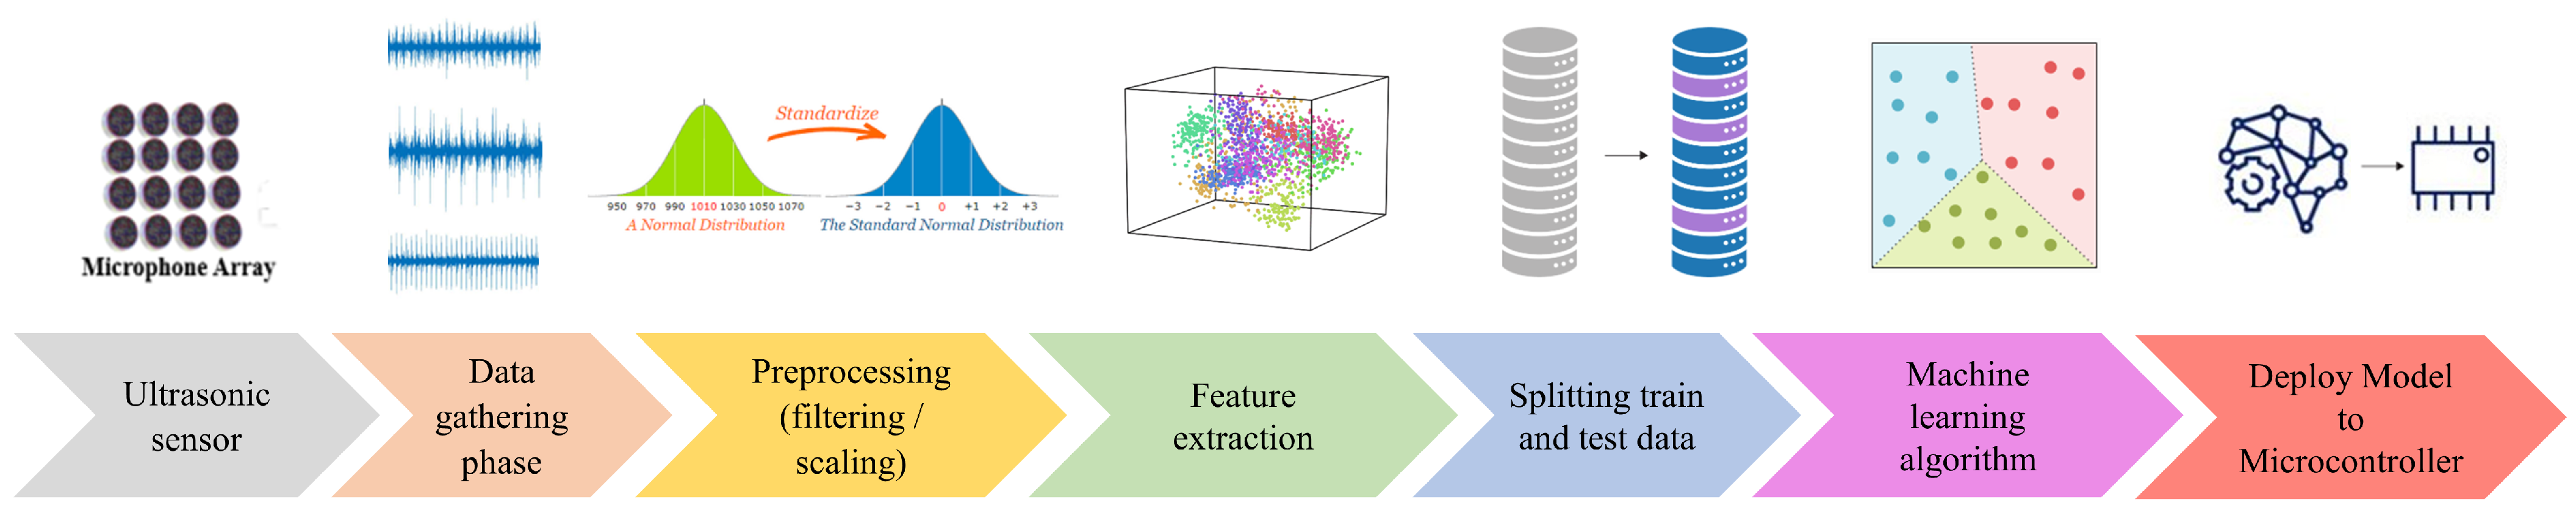
2. Ultrasonic Fault Detection Methodology
2.1. Boosting Technique
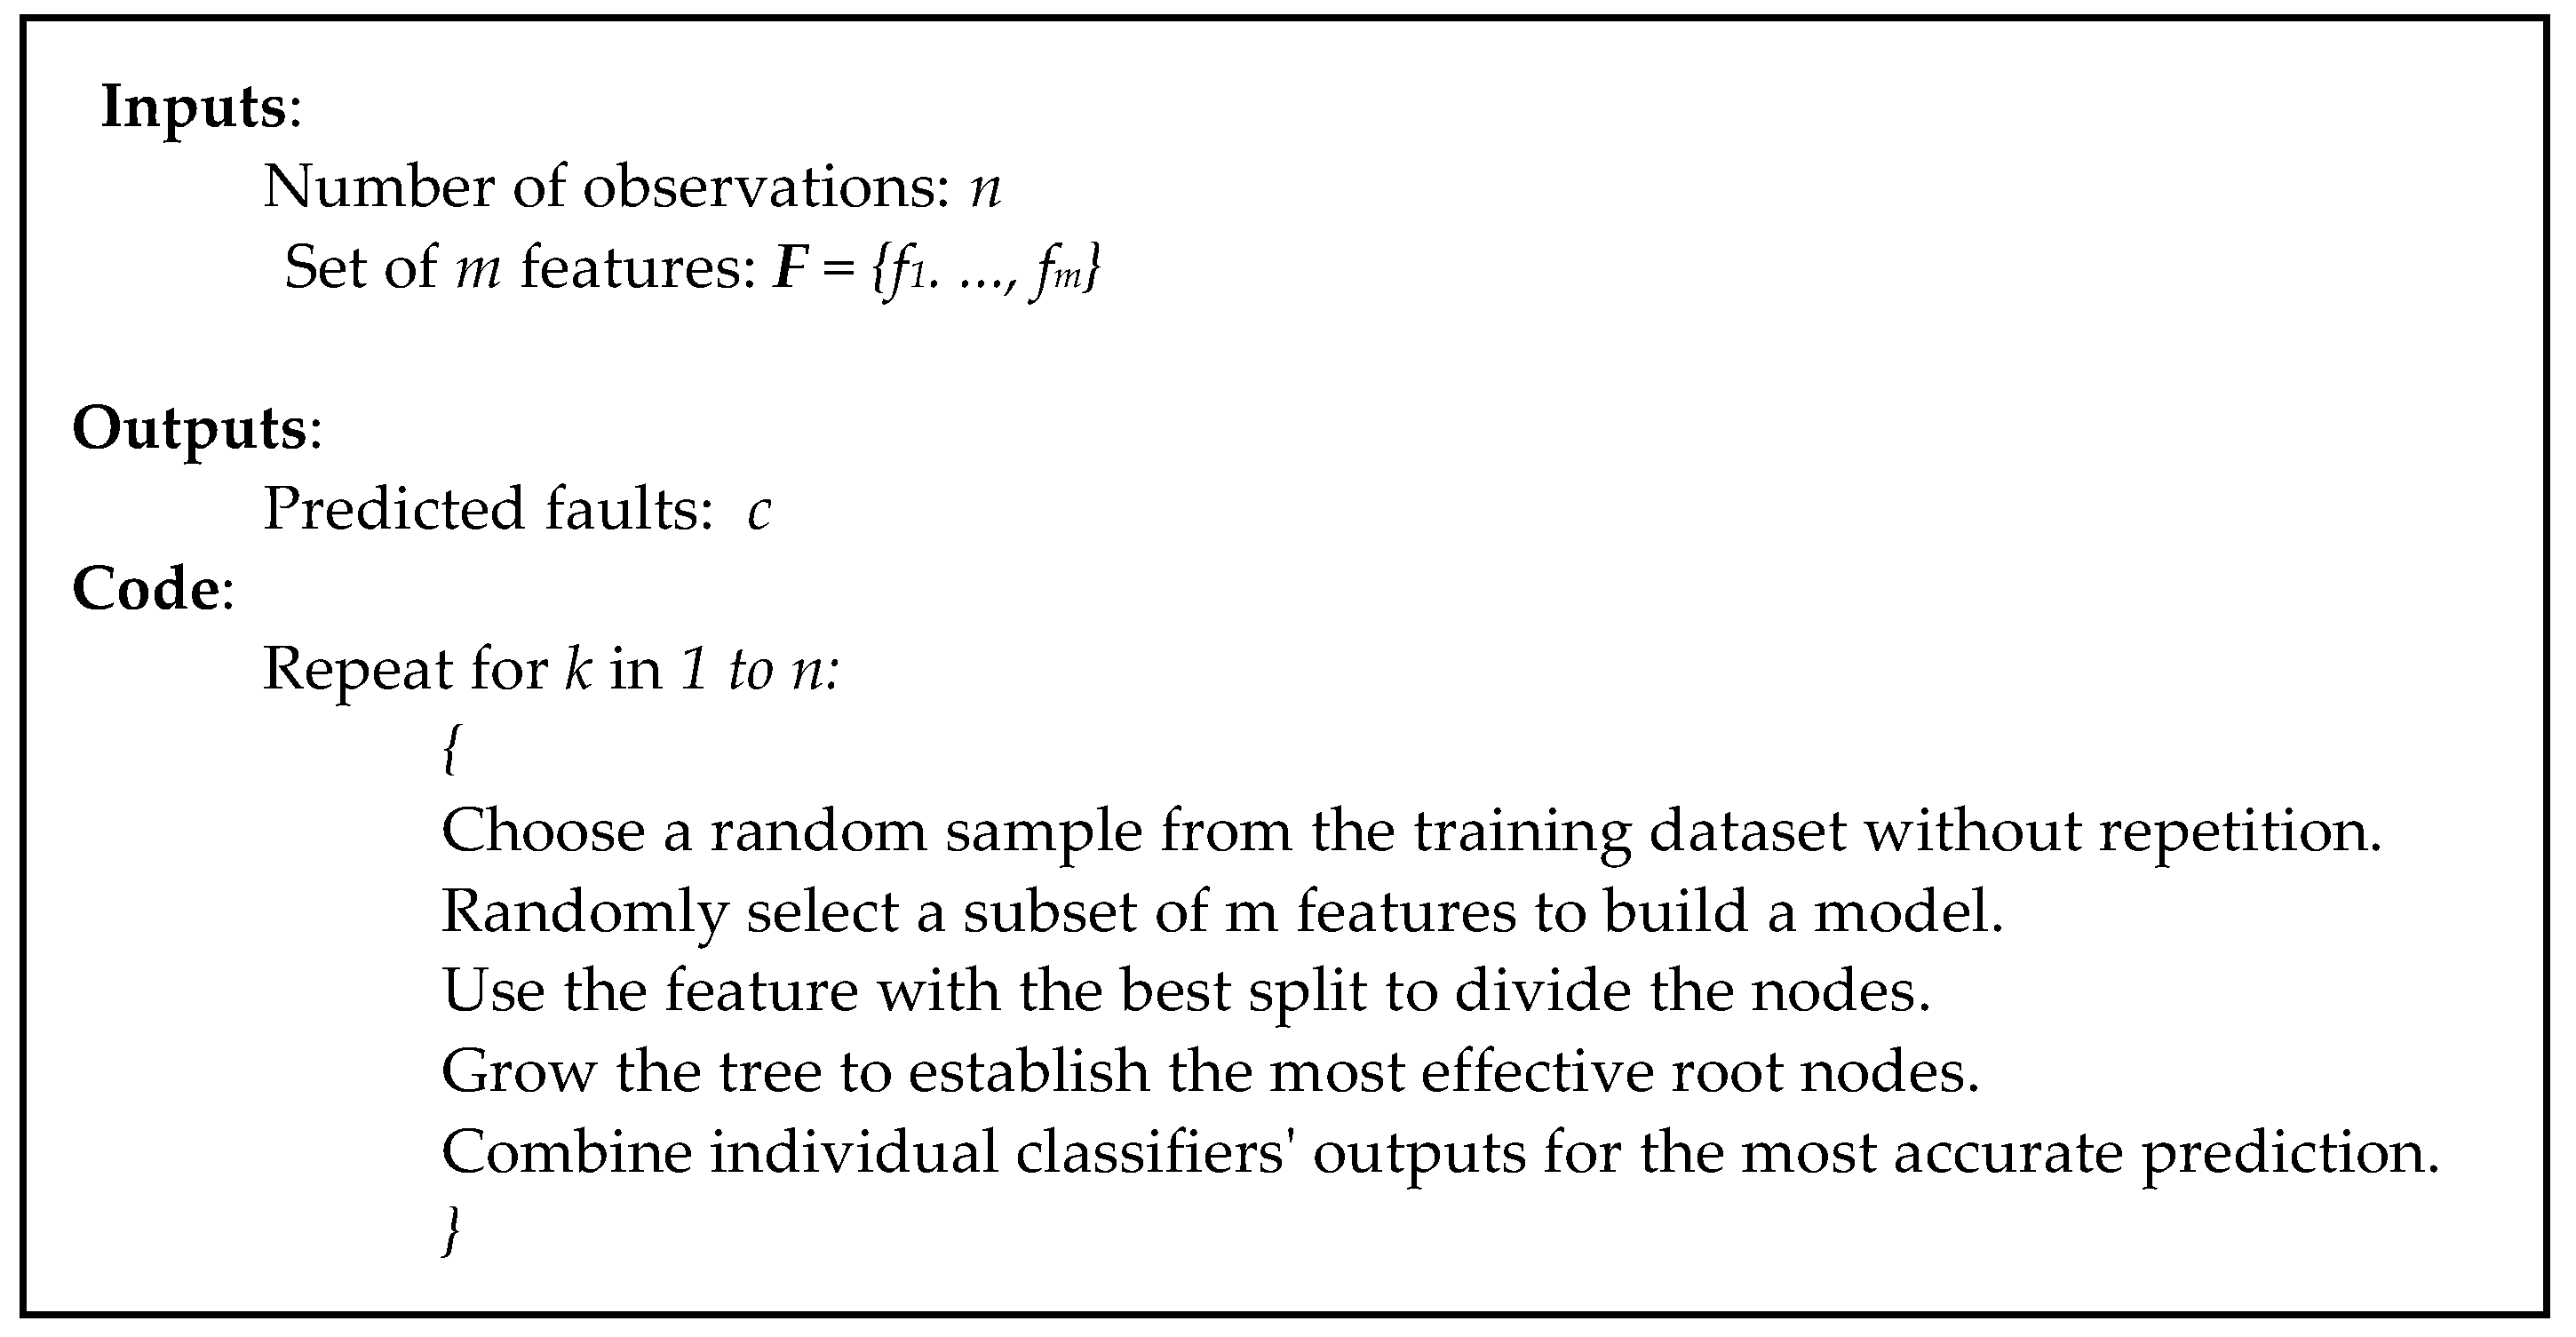
2.2. Bagging Technique
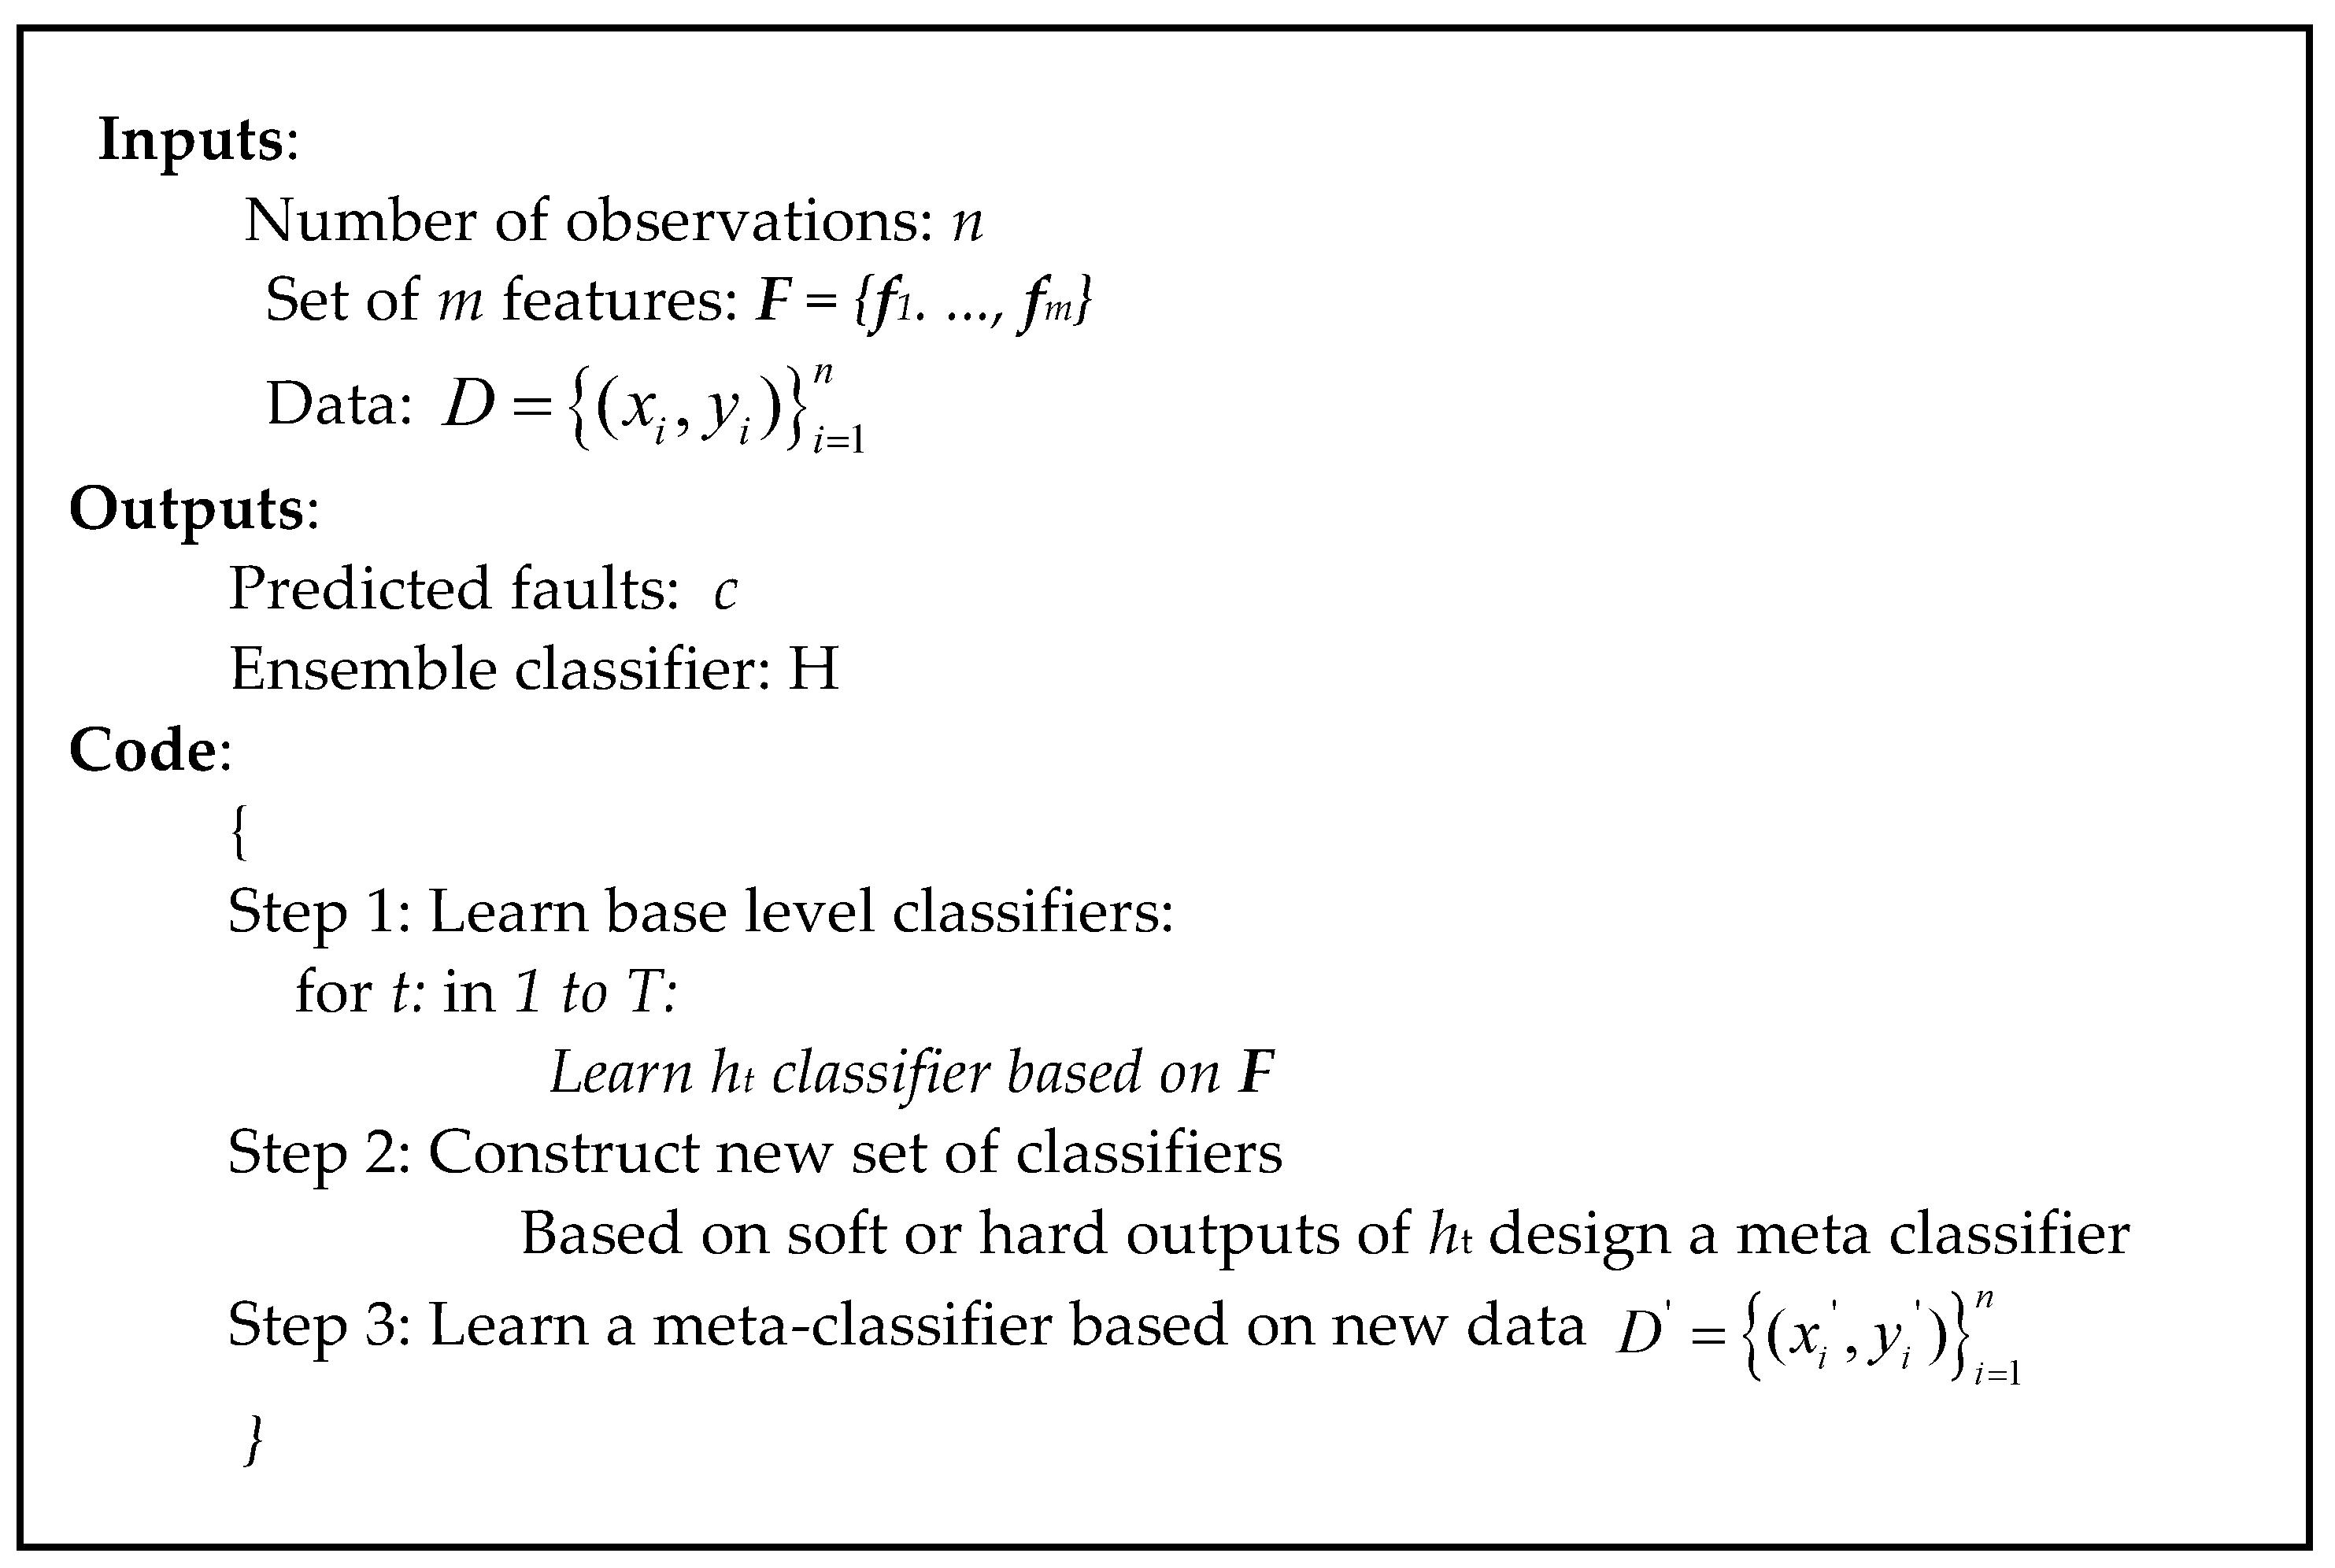
2.3. Stacking Technique
2.4. Evaluating Estimator Performance Using k-Fold Cross-Validation
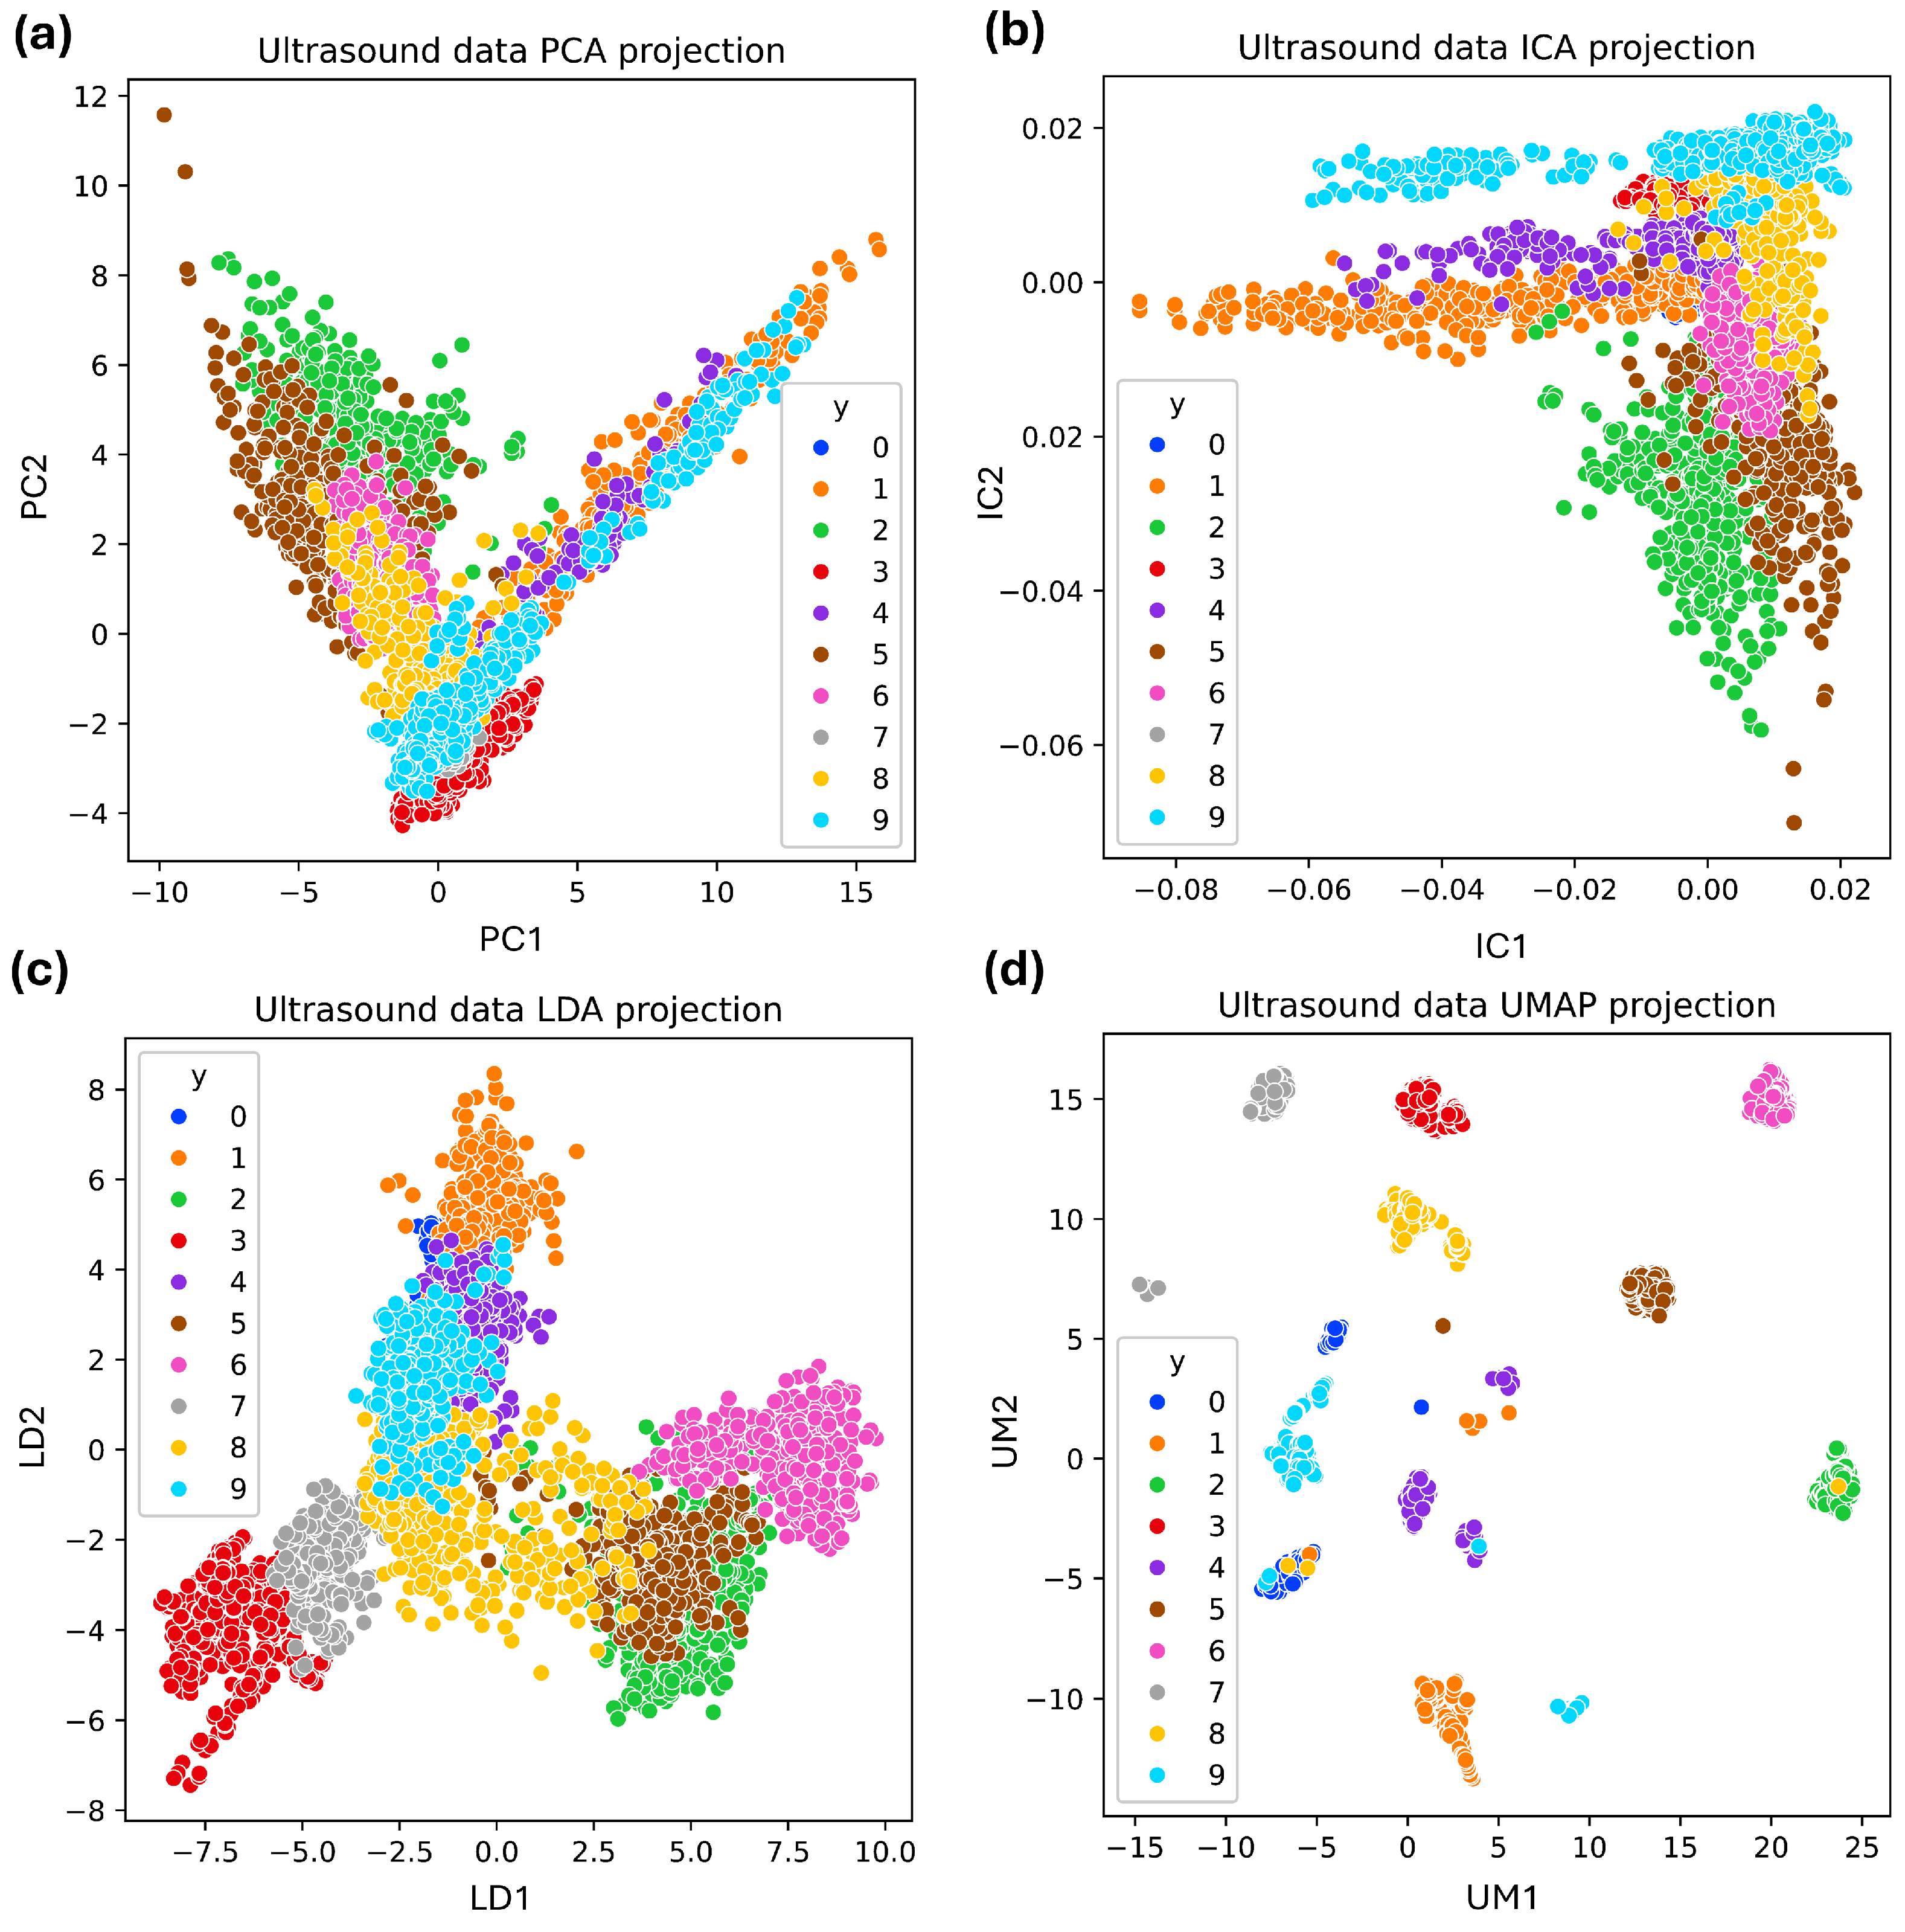
2.5. Ultrasonic Dimensionality Reduction and Visualization Techniques
- Principal component analysis (PCA) reduces the dimensionality of a dataset by transforming it into a set of orthogonal components. These components capture the most variance from the original data [36].
- Independent component analysis (ICA) separates a multivariate signal into independent non-Gaussian components, assuming statistical independence. ICA excels in identifying independent sources and handling non-Gaussian data, making it useful for noise reduction, feature extraction, and source separation [37].
- Uniform manifold approximation and projection (UMAP) preserves the local and global data structure by optimizing a low-dimensional graph to reflect the high-dimensional graph. It is computationally efficient and scalable, suitable for large datasets [38].
- Linear discriminant analysis (LDA): This is a statistical method used in supervised classification problems. LDA aims to find a linear combination of features that best separates industrial faults. It projects high-dimensional acoustic data onto a lower-dimensional space by maximizing the distance between the means of different classes and minimizing the variance within each class [39].
2.6. Evaluation Metrics
3. Results
- Implementation
4. Conclusions
Author Contributions
Funding
Institutional Review Board Statement
Informed Consent Statement
Data Availability Statement
Conflicts of Interest
References
- Soomro, A.A.; Mokhtar, A.A.; Kurnia, J.C.; Lashari, N.; Lu, H.; Sambo, C. Integrity Assessment of Corroded Oil and Gas Pipelines Using Machine Learning: A Systematic Review. Eng. Fail. Anal. 2022, 131, 105810. [Google Scholar] [CrossRef]
- Yang, J.; Li, S.; Wang, Z.; Dong, H.; Wang, J.; Tang, S. Using Deep Learning to Detect Defects in Manufacturing: A Comprehensive Survey and Current Challenges. Materials 2020, 13, 5755. [Google Scholar] [CrossRef] [PubMed]
- Datta, S.; Sarkar, S. A review on different pipeline fault detection methods. J. Loss Prev. Process Ind. 2016, 41, 97–106. [Google Scholar] [CrossRef]
- Becker, V.; Schwamm, T.; Urschel, S.; Antonino-Daviu, J. Fault detection of circulation pumps on the basis of motor current evaluation. IEEE Trans. Ind. Appl. 2021, 57, 4617–4624. [Google Scholar] [CrossRef]
- Al-Sabaeei, A.M.; Alhussian, H.; Abdulkadir, S.J.; Jagadeesh, A. Prediction of Oil and Gas Pipeline Failures through Machine Learning Approaches: A Systematic Review. Energy Rep. 2023, 10, 1313–1338. [Google Scholar] [CrossRef]
- Yu, Y.; Safari, A.; Niu, X.; Drinkwater, B.; Horoshenkov, K.V. Acoustic and Ultrasonic Techniques for Defect Detection and Condition Monitoring in Water and Sewerage Pipes: A Review. Appl. Acoust. 2021, 183, 108282. [Google Scholar] [CrossRef]
- Salunkhe, V.G.; Khot, S.M.; Desavale, R.G.; Yelve, N.P. Unbalance Bearing Fault Identification Using Highly Accurate Hilbert-Huang Transform Approach. J. Nondestruct. Eval. Diagn. Progn. Eng. Syst. 2023, 6, 031005. [Google Scholar] [CrossRef]
- Zhang, M.; Guo, Y.; Xie, Q.; Zhang, Y.; Wang, D.; Chen, J. Defect Identification for Oil and Gas Pipeline Safety Based on Autonomous Deep Learning Network. Comput. Commun. 2022, 195, 14–26. [Google Scholar] [CrossRef]
- Sharma, A. Fault Diagnosis of Bearings Using Recurrences and Artificial Intelligence Techniques. J. Nondestruct. Eval. Diagn. Progn. Eng. Syst. 2022, 5, 031004. [Google Scholar] [CrossRef]
- Moshrefi, A.; Gratuze, M.; Tawfik, H.H.; Elsayed, M.Y.; Nabki, F. Ensemble AI fault diagnosis model using ultrasonic microphone. In Proceedings of the 2023 IEEE International Ultrasonics Symposium (IUS), Montreal, QC, Canada, 3–8 September 2023; pp. 1–3. [Google Scholar]
- Shinde, P.V.; Desavale, R.G. Application of Dimension Analysis and Soft Competitive Tool to Predict Compound Faults Present in Rotor-Bearing Systems. Measurement 2022, 193, 110984. [Google Scholar] [CrossRef]
- Carrera-Avendaño, E.; Urquiza-Beltrán, G.; Trutié-Carrero, E.; Nieto-Jalil, J.M.; Carrillo-Pereyra, C.; Seuret-Jiménez, D. Detection of Crankshaft Faults by Means of a Modified Welch-Bartlett Periodogram. Eng. Fail. Anal. 2022, 132, 105938. [Google Scholar] [CrossRef]
- Lin, H.C.; Ye, Y.C. Reviews of Bearing Vibration Measurement Using Fast Fourier Transform and Enhanced Fast Fourier Transform Algorithms. Adv. Mech. Eng. 2019, 11, 1687814018816751. [Google Scholar] [CrossRef]
- Vishwendra, M.A.; Salunkhe, P.S.; Patil, S.V.; Shinde, S.A.; Shinde, P.V.; Desavale, R.G.; Jadhav, P.M.; Dharwadkar, N.V. A Novel Method to Classify Rolling Element Bearing Faults Using K-Nearest Neighbor Machine Learning Algorithm. ASCE-ASME J. Risk Uncertain. Eng. Syst. Part B Mech. Eng. 2022, 8, 031202. [Google Scholar] [CrossRef]
- Patil, S.M.; Malagi, R.R.; Desavale, R.G.; Sawant, S.H. Fault Identification in a Nonlinear Rotating System Using Dimensional Analysis (DA) and Central Composite Rotatable Design (CCRD). Measurement 2022, 200, 111610. [Google Scholar] [CrossRef]
- Yuan, J.; Mao, W.; Hu, C.; Zheng, J.; Zheng, D.; Yang, Y. Leak Detection and Localization Techniques in Oil and Gas Pipeline: A Bibliometric and Systematic Review. Eng. Fail. Anal. 2023, 146, 107060. [Google Scholar] [CrossRef]
- Korlapati, N.V.S.; Khan, F.; Noor, Q.; Mirza, S.; Vaddiraju, S. Review and Analysis of Pipeline Leak Detection Methods. J. Pipeline Sci. Eng. 2022, 2, 100074. [Google Scholar] [CrossRef]
- Rai, A.; Kim, J.M. A Novel Pipeline Leak Detection Approach Independent of Prior Failure Information. Measurement 2021, 167, 108284. [Google Scholar] [CrossRef]
- Wang, H.; Fan, Z.; Chen, X.; Cheng, J.; Chen, W.; Wang, Z.; Bu, Y. Automated Classification of Pipeline Defects from Ultrasonic Phased Array Total Focusing Method Imaging. Energy 2022, 5, 8272. [Google Scholar] [CrossRef]
- Moshrefi, A.; Tawfik, H.H.; Elsayed, M.Y.; Nabki, F. Industrial fault detection employing meta ensemble model based on contact sensor ultrasonic signal. Sensors 2024, 24, 2297. [Google Scholar] [CrossRef] [PubMed]
- Raišutis, R.; Tumšys, O.; Žukauskas, E.; Samaitis, V.; Draudvilienė, L.; Jankauskas, A. An Inspection Technique for Steel Pipes Wall Condition Using Ultrasonic Guided Helical Waves and a Limited Number of Transducers. Materials 2023, 16, 5410. [Google Scholar] [CrossRef]
- Norli, P.; Frijlink, M.; Standal, Ø.K.-V.; Bjåstad, T.G.; Prieur, F.; Vallée, E. Ultrasonic Detection of Stress Corrosion Cracks in Pipe Samples Using Guided Waves. In Proceedings of the 2018 IEEE International Ultrasonics Symposium (IUS), Kobe, Japan, 22–25 October 2018; pp. 1–4. [Google Scholar] [CrossRef]
- Wei, M.; Miao, Q.; Jiang, L. Feature Extraction Method for Ultrasonic Pipeline Defects Based on Fractional-Order VMD. Nondestruct. Test. Eval. 2024, 39, 1–20. [Google Scholar] [CrossRef]
- Cai, L.; Diao, Z.; Chen, F.; Guan, L.; Xu, G. Identification method of circumferential declination based on amplitude reduction of pipeline ultrasonic internal inspection signals. Nondestruct. Test. Eval. 2024, 37, 1–17. [Google Scholar] [CrossRef]
- Yadavendra, S. A comparative study of breast cancer tumor classification by classical machine learning methods and deep learning method. Mach. Vis. Appl. 2020, 31, 46. [Google Scholar] [CrossRef]
- Dong, X.; Yu, Z.; Cao, W.; Shi, Y.; Ma, Q. A survey on ensemble learning. Front. Comput. Sci. 2020, 14, 241–258. [Google Scholar] [CrossRef]
- Tanha, J.; Abdi, Y.; Samadi, N.; Razzaghi, N.; Asadpour, M. Boosting Methods for Multi-Class Imbalanced Data Classification: An Experimental Review. J. Big Data 2020, 7, 1–47. [Google Scholar] [CrossRef]
- Ju, X.; Salibián-Barrera, M. Robust boosting for regression problems. Comput. Stat. Data Anal. 2021, 153, 107065. [Google Scholar] [CrossRef]
- González, S.; García, S.; Del Ser, J.; Rokach, L.; Herrera, F. A Practical Tutorial on Bagging and Boosting Based Ensembles for Machine Learning: Algorithms, Software Tools, Performance Study, Practical Perspectives, and Opportunities. Inf. Fusion 2020, 64, 205–237. [Google Scholar] [CrossRef]
- Mohapatra, S.; Maneesha, S.; Patra, P.K.; Mohanty, S. Heart Diseases Prediction Based on Stacking Classifiers Model. Procedia Comput. Sci. 2023, 218, 1621–1630. [Google Scholar] [CrossRef]
- Nti, I.K.; Nyarko-Boateng, O.; Aning, J. Performance of Machine Learning Algorithms with Different K Values in K-Fold Cross-Validation. Int. J. Inf. Technol. Comput. Sci. 2021, 13, 61–71. [Google Scholar] [CrossRef]
- Marcot, B.G.; Hanea, A.M. What Is an Optimal Value of K in K-Fold Cross-Validation in Discrete Bayesian Network Analysis? Comput. Stat. 2021, 36, 2009–2031. [Google Scholar] [CrossRef]
- Yadav, S.; Shukla, S. Analysis of K-Fold Cross-Validation over Hold-Out Validation on Colossal Datasets for Quality Classification. In Proceedings of the 2016 IEEE 6th International Conference on Advanced Computing (IACC), Bhimavaram, India, 27–28 February 2016; pp. 78–83. [Google Scholar] [CrossRef]
- Jia, W.; Sun, M.; Lian, J.; Hou, S. Feature dimensionality reduction: A review. Complex Intell. Syst. 2022, 8, 2663–2693. [Google Scholar] [CrossRef]
- Toma, R.N.; Kim, J.M. Bearing Fault Classification of Induction Motor Using Statistical Features and Machine Learning Algorithms. Lect. Notes Netw. Syst. 2022, 418, 243–254. [Google Scholar] [CrossRef]
- Kurita, T. Principal Component Analysis (PCA). Comput. Vis. A Ref. Guid. 2019, 19, 303–342. [Google Scholar]
- McConn, J.L.; Lamoureux, C.R.; Poudel, S.; Palsson, B.O.; Sastry, A.V. Optimal dimensionality selection for independent component analysis of transcriptomic data. BMC Bioinform. 2021, 22, 584. [Google Scholar] [CrossRef] [PubMed]
- McInnes, L.; Healy, J.; Melville, J. UMAP: Uniform Manifold Approximation and Projection for Dimension Reduction. arXiv 2018, arXiv:1802.03426. [Google Scholar]
- Tharwat, A.; Gaber, T.; Ibrahim, A.; Hassanien, A.E. Linear Discriminant Analysis: A Detailed Tutorial. AI Commun. 2017, 30, 169–190. [Google Scholar] [CrossRef]
- Sravani, S.; Karthikeyan, P.R. Detection of cardiovascular disease using KNN in comparison with naive bayes to measure precision, recall, and f-score. In AIP Conference Proceedings; AIP Publishing: New York, NY, USA, 2023; Volume 2821. [Google Scholar]
- UE Systems Co. Available online: https://www.uesystems.com/resources/sound-library/ (accessed on 1 January 2020).


| Features | Details | Definition |
|---|---|---|
| Mean | Mean | Average of the data. |
| Median | The middle value of the signal. | |
| RMS (Root Mean Square) | The square root of the mean of the squares of the signal values. | |
| Variance | Standard Deviation | The square root of the variance. |
| Range | The difference between the maximum and minimum values of the signal. | |
| Interquartile Range (IQR) | The difference between the 75th and 25th percentiles of the signal. | |
| Zero Crossing | Number of Peaks | The total count of peaks in the signal. |
| Number of Valleys | The total count of valleys in the signal. | |
| Peak-to-Peak Distance | The average distance between consecutive peaks. | |
| Envelope | Envelope Mean | The mean value of the signal envelope. |
| Envelope Variance | The variance of the signal envelope. | |
| Envelope Energy | The sum of the squared values of the signal envelope. | |
| Crest Factor | Form Factor | The ratio of the RMS value to the mean absolute value. |
| Peak-to-RMS Ratio | The ratio of the maximum value to the RMS value of the signal. | |
| Margin Factor | The ratio of the maximum value to the RMS value. | |
| Shape Factor | Normalized Energy | The energy normalized by the length of the signal. |
| Energy Entropy | The logarithm of the energy of the signal. | |
| Impulse Factor | The ratio of the maximum value to the mean of the absolute values of the signal. | |
| Number of Peaks | Number of Positive Peaks | The count of positive peaks in the signal. |
| Number of Negative Peaks | The count of negative peaks in the signal. | |
| Peak Amplitude | The amplitude of the highest peak in the signal. | |
| Time of Peak | Time of First Peak | The time at which the first peak occurs. |
| Time of Last Peak | The time at which the last peak occurs. | |
| Time of Median | The time index of the median value. | |
| Skewness | Absolute Skewness | Skewness calculated on the absolute values of the signal. |
| Skewness of Positive Values | Skewness calculated only for the positive values of the signal. | |
| Skewness of Negative Values | Skewness calculated only for the negative values of the signal. | |
| Kurtosis | Absolute Kurtosis | Kurtosis calculated on the absolute values of the signal. |
| Kurtosis of Positive Values | Kurtosis calculated only for the positive values of the signal. | |
| Kurtosis of Negative Values | Kurtosis calculated only for the negative values of the signal. |
| PCA | LDA | ICA | UMAP | |
|---|---|---|---|---|
| Fold_1 | 0.802173 | 0.872826 | 0.905434 | 0.726086 |
| Fold_2 | 0.810869 | 0.891304 | 0.929347 | 0.735869 |
| Fold_3 | 0.803261 | 0.875435 | 0.898913 | 0.727173 |
| Fold_4 | 0.797826 | 0.859782 | 0.905434 | 0.713043 |
| Fold_5 | 0.822826 | 0.885869 | 0.928267 | 0.759782 |
| Average | 0.807391 | 0.876956 | 0.913478 | 0.732391 |
| PCA | LDA | ICA | UMAP | |
|---|---|---|---|---|
| Fold_1 | 0.739130 | 0.543478 | 0.815217 | 0.528541 |
| Fold_2 | 0.760869 | 0.663043 | 0.793478 | 0.489130 |
| Fold_3 | 0.771739 | 0.543478 | 0.641304 | 0.467391 |
| Fold_4 | 0.752961 | 0.597826 | 0.771739 | 0.576086 |
| Fold_5 | 0.739130 | 0.608695 | 0.758061 | 0.535028 |
| Average | 0.752173 | 0.591304 | 0.754347 | 0.506521 |
| PCA | LDA | ICA | UMAP | |
|---|---|---|---|---|
| Fold_1 | 0.704225 | 0.809523 | 0.824175 | 0.511728 |
| Fold_2 | 0.685393 | 0.843373 | 0.935897 | 0.584415 |
| Fold_3 | 0.746268 | 0.788306 | 0.880597 | 0.632352 |
| Fold_4 | 0.647058 | 0.741935 | 0.835294 | 0.638554 |
| Fold_5 | 0.643678 | 0.809523 | 0.851851 | 0.547619 |
| Average | 0.685324 | 0.798649 | 0.865563 | 0.582810 |
| PCA | LDA | ICA | UMAP | |
|---|---|---|---|---|
| Fold_1 | 0.613496 | 0.772727 | 0.819672 | 0.505494 |
| Fold_2 | 0.674033 | 0.872065 | 0.858823 | 0.532544 |
| Fold_3 | 0.628930 | 0.780219 | 0.742138 | 0.537514 |
| Fold_4 | 0.621468 | 0.745945 | 0.802259 | 0.605714 |
| Fold_5 | 0.625698 | 0.772803 | 0.797687 | 0.522717 |
| Average | 0.632725 | 0.774324 | 0.804116 | 0.540796 |
Disclaimer/Publisher’s Note: The statements, opinions and data contained in all publications are solely those of the individual author(s) and contributor(s) and not of MDPI and/or the editor(s). MDPI and/or the editor(s) disclaim responsibility for any injury to people or property resulting from any ideas, methods, instructions or products referred to in the content. |
© 2024 by the authors. Licensee MDPI, Basel, Switzerland. This article is an open access article distributed under the terms and conditions of the Creative Commons Attribution (CC BY) license (https://creativecommons.org/licenses/by/4.0/).
Share and Cite
Moshrefi, A.; Nabki, F. Advanced Industrial Fault Detection: A Comparative Analysis of Ultrasonic Signal Processing and Ensemble Machine Learning Techniques. Appl. Sci. 2024, 14, 6397. https://doi.org/10.3390/app14156397
Moshrefi A, Nabki F. Advanced Industrial Fault Detection: A Comparative Analysis of Ultrasonic Signal Processing and Ensemble Machine Learning Techniques. Applied Sciences. 2024; 14(15):6397. https://doi.org/10.3390/app14156397
Chicago/Turabian StyleMoshrefi, Amirhossein, and Frederic Nabki. 2024. "Advanced Industrial Fault Detection: A Comparative Analysis of Ultrasonic Signal Processing and Ensemble Machine Learning Techniques" Applied Sciences 14, no. 15: 6397. https://doi.org/10.3390/app14156397
APA StyleMoshrefi, A., & Nabki, F. (2024). Advanced Industrial Fault Detection: A Comparative Analysis of Ultrasonic Signal Processing and Ensemble Machine Learning Techniques. Applied Sciences, 14(15), 6397. https://doi.org/10.3390/app14156397