Article

Are Clinical Balance Measures Linked to Cycling Performance?

1
Curtin School of Allied Health, Curtin University, Perth, WA 6102, Australia
2
SR Performance, Melbourne, VIC 3032, Australia
3
Dohrmann Consulting, Melbourne, VIC 3032, Australia
*
Author to whom correspondence should be addressed.
Appl. Sci. 2024, 14(14), 6379; https://doi.org/10.3390/app14146379
Submission received: 14 June 2024 / Revised: 17 July 2024 / Accepted: 17 July 2024 / Published: 22 July 2024
(This article belongs to the Special Issue Exercise Physiology and Biomechanics in Human Health)

Abstract

:

Featured Application

Improving cornering skill has the potential to improve overall cycling performance. However, clinically used balance tests do not reflect cornering performance. More cycling-specific balance tests need to be developed to better assess cycling performance.

Abstract

Balance is paramount to safe and successful cycling, both in competition and recreation. Balance has been investigated in the return-to-cycling context, but its relationship to cycling performance is unknown. Our study aimed to analyse the relationship between balance, measured by common clinical balance tests, and cycling performance. Seven competitive cyclists participated in this cross-sectional correlational study. We collected field-based measures of cycling performance, including mean velocity, minimum and maximum velocity, mean corner speed, average lap time, and lean angle. Also, we measured balance via the balance error scoring system, the star excursion balance test, the lateral reach test, and the modified Bass test of dynamic balance. Strong correlations between cornering performance and cycling performance (r = 0.65–0.87, p < 0.01) were detected. Weak correlations between clinical balance tests and cycling performance (r = 0.33–0.53, p < 0.05) were observed. In conclusion, our study showed that improving cornering performance has the potential to improve overall cycling performance. We also found no clear correlations between our clinical balance tests and cycling performance. These weak correlations between postural control in standing and cycling performance suggest that standing balance and balancing during cycling are distinct motor control processes.

1. Introduction

Balance is essential to ride, steer, and brake a bicycle [1]. To successfully complete these manoeuvres, cyclists must apply a combination of steering torque to the handlebars and brake torque to the brake levers, and potentially lean the bicycle laterally [2,3]. Because the bicycle is a dynamically unstable system, the cyclist must also lean their trunk laterally to balance the bicycle [4]. This movement is particularly critical for cornering, and if the cyclist fails to maintain the balance of their bicycle, a crash can ensue [4].
In 2014–15, bicycle crashes represented 12% of all road crashes in Australia [5]. After crashing their bicycles, cyclists often present to the emergency department with lower or upper limb fractures, head injuries, or severe skin abrasions [6]. While bicycles have a high level of perceived risk associated with their vulnerability to other road users [7], the most common crash mechanism for cyclists is falls, not collisions. Over half of cycling falls can be attributed to bicycle handling errors [5,6].
Counterintuitively, competitive cyclists are at an increased risk of crashing compared to recreational cyclists [8]. The risk for competitive cyclists is increased because they travel at higher speeds, cycle in large groups in close proximity, and race on various surfaces and in challenging weather conditions [9]. In the Tour de France, between 2010 and 2017, traumatic injuries resulted in cyclists withdrawing from the race and missing an average of 52 days of competition time [6]. Further, the injury risk to competitive cyclists has increased over time. Cyclists from the 2008/2009 seasons were at double the risk of traumatic injury when compared to cyclists competing in the 1980s–1990s [8]. Consequently, a better understanding of the potential variables which may affect bicycle handling is needed to reduce competitive cyclists’ injury risk.
Expert cyclists make fewer steering inputs compared to novice riders, which is hypothesised to be linked with a superior control of bicycle stability and improved bicycle balance [1]. Traditionally, postural stability is assessed based on performance in tests of static balance. The criterion measure for static balance involves the assessment of centre-of-pressure deviations via a force plate, and electronic balance assessment systems are recognised as highly reliable to assess dynamic balance [10]. However, balance assessments can also be conducted using simple, low-cost, clinically accessible balance tests, which are commonly used to assess balance in athletic populations [11,12,13,14,15,16]. While balance tests have been used to assess concussion in paediatric cyclists as well as American road racing cyclists [17], balance tests have not previously been used to evaluate performance in cyclists. Thus, our aims were twofold: (a) to link bicycle handling to overall cycling performance in competitive cyclists through the analysis of corner performance variables, and (b) to examine the relationship between balance and cycling performance using clinical balance tests. We hypothesised that a relationship exists between cornering performance and cycling performance, and between performance in clinical balance tests and cycling performance.

2. Materials and Methods

We recruited a purposive sample of seven competitive cyclists (mean ± SD, 18 ± 2 years, 1.74 ± 0.09 m, 66 ± 6 kg, BMI 21.7 ± 0.8 kg/m2) with an average of 5 ± 3 years of competitive cycling experience. Participants engaged in cycling training for their sport for an average of 8 ± 5 h per week. Participants were recruited via advertising and social media posts by local cycling and triathlon clubs in Western Australia. Ethical approval for this study was obtained from the institutional Human Research Ethics Committee (2019-0418) prior to commencing data collection. Prospective participants completed a questionnaire to ensure they met the following inclusion criteria: a minimum of one year race experience in either cycling or draft legal triathlons, ability to ride a bicycle with clip-in pedals, and no current or recent injuries (within the preceding six months). Individuals who met these criteria then provided written informed consent prior to commencing data collection.

2.1. Experimental Setup and Procedure

A field-based test of cycling performance was conducted on a closed circular cycling track approximately 800 m in length (Figure 1). On each testing day, the track was inspected for loose debris and the public was informed of testing to ensure participant safety. Upon arrival, participants’ height in centimetres with a stadiometer (Seca 213, Los Angeles, CA, USA) and weight in kilograms with electronic scales (Tanita BC-587, Tokyo, Japan) were measured.
An array of inertial measurement units (IMUs) (Noraxon MyoMOTION, Noraxon, Phoenix, AZ, USA) were used to capture the roll angle of the pelvis in the coronal plane as a measure of overall lean angle. The IMUs were attached to the skin overlying the spinous processes of T10 and S1 using manufacturer-supplied double-sided adhesive tape reinforced with rigid medical-grade strapping tape. IMUs are validated for field-based kinematic assessment in cycling [18,19]. IMU data were recorded using the manufacturer’s data logger. The participant’s own bicycles were fitted with a 10 Hz global positioning system (GPS) (Optimeye S5, Catapult Sports, Melbourne, Australia) secured vertically to the lateral aspect of the bicycle seat post with rigid tape. The GPS captured speed, location via longitude and latitude, and elapsed time. Participants were asked to warm up and familiarize themselves with the track by cycling five laps of the course in an anti-clockwise direction at a self-selected pace. Two traffic cones were used to mark the start of the cycling track. From a standing start, participants were instructed to cycle to their maximum speed for five continuous laps in an anti-clockwise direction. Participants were verbally informed of their lap count upon the completion of each lap. On the completion of their five laps, the GPSs and IMUs were removed, and the data were downloaded to manufacturer-supplied software (Catapult Sprint version 5.1.7, Catapult Sports, Australia; Noraxon myoResearch 3.18, Noraxon, Phoenix, AZ, USA) for further analysis.
Prior to balance testing, participants were verbally rescreened for recent injury. Next, they removed their shoes, and leg length (in cm) was measured as the distance between the anterior superior iliac spine and the medial malleolus [20]. Before commencing each balance test, participants were provided standardised instructions (Appendix A). During testing, participants received instructions to enable them to remain focused on remaining balanced.

2.1.1. Balance Error Scoring System (BESS)

The BESS has an intra-rater reliability intraclass coefficient (ICC) of 0.5–0.88 [21]. It was conducted following the protocol of Bell et al. [22]. Participants were tasked with remaining balanced for 20 s in the following test conditions: (1) feet together (bipedal; Appendix B, Figure A1), (2) on their non-dominant foot (unipedal; Appendix B, Figure A2), and (3) with their non-dominant foot behind their dominant foot (tandem; Appendix B, Figure A3). They were instructed to adopt the standard starting position of eyes closed, hands on iliac crests, and standing up straight, and then the number of balance errors that they committed within the 20 s testing period was recorded. Balance errors were defined as follows: bending the hip forwards or to the side more than 30°, removing hands from hips, lifting heels or forefeet off the ground, opening the eyes, stepping/stumbling/falling out of position, or failure to return to the starting position after five seconds of perturbation. All testing conditions were conducted firstly on the lab floor, and then on a foam block. Participants were allocated two minutes to familiarise themselves with the test procedure prior to the commencement of two recorded trials per condition. The number of balance errors committed was recorded on a data sheet, with the average of the errors committed used for data analysis.

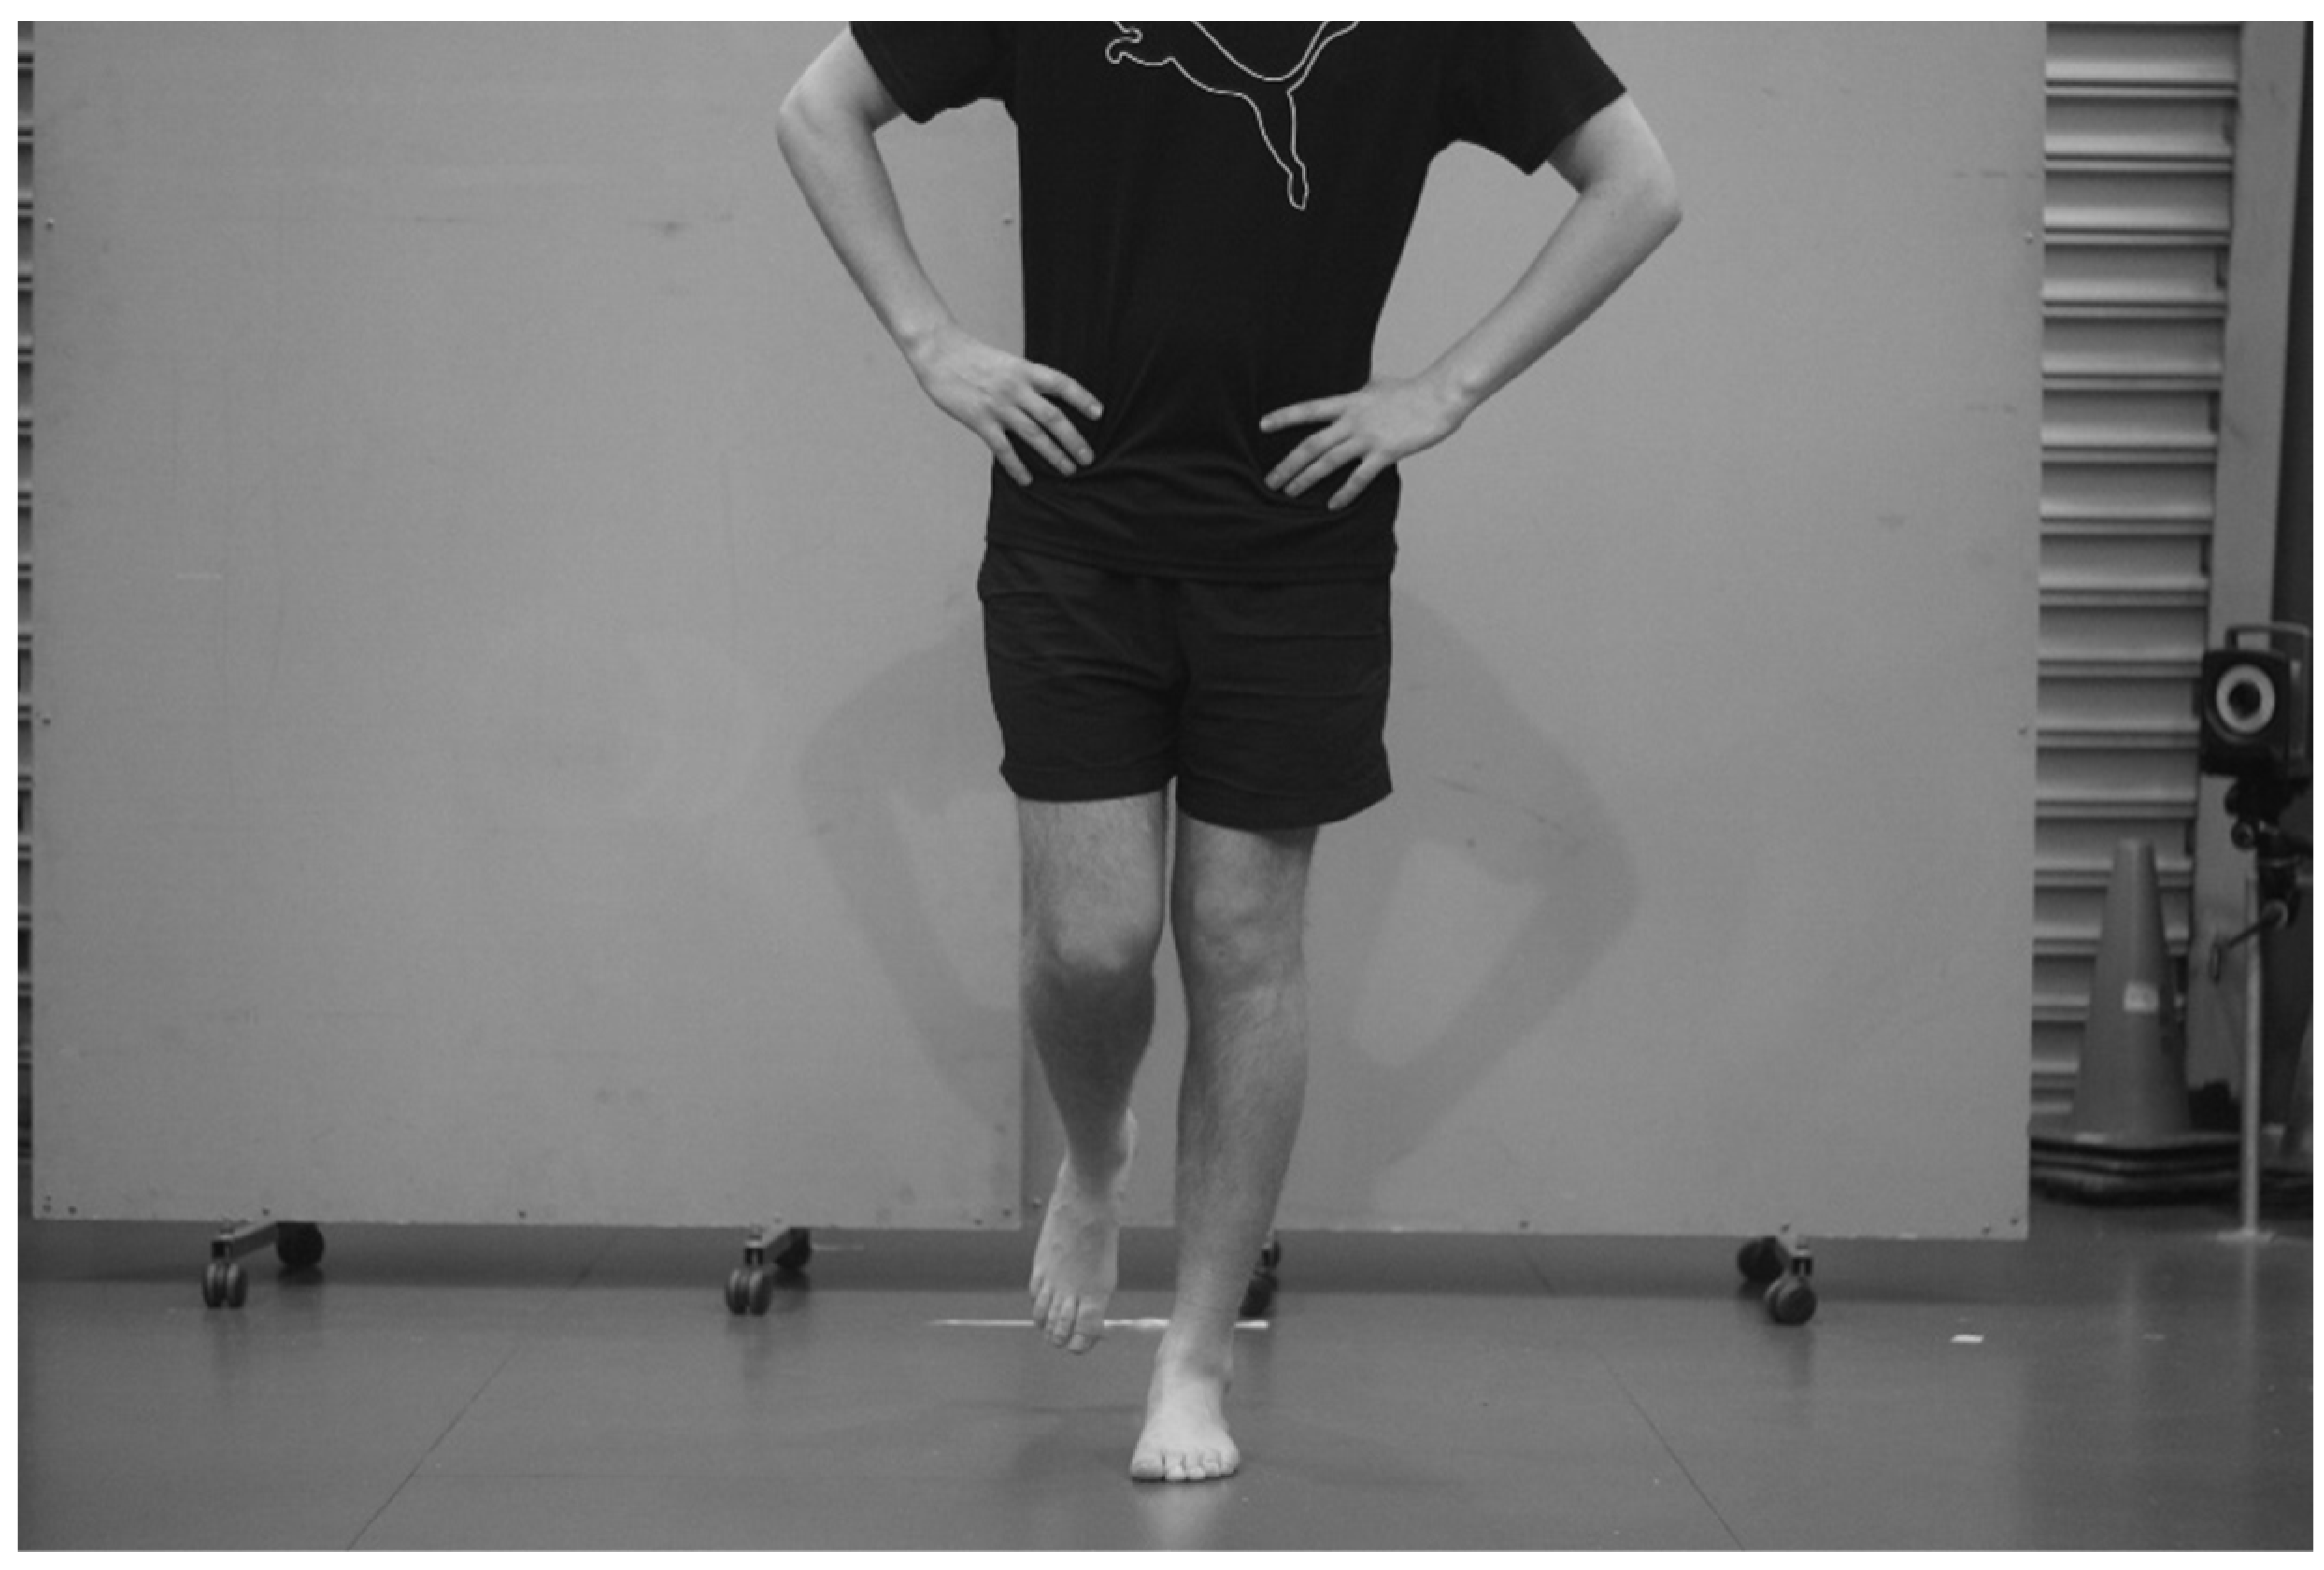
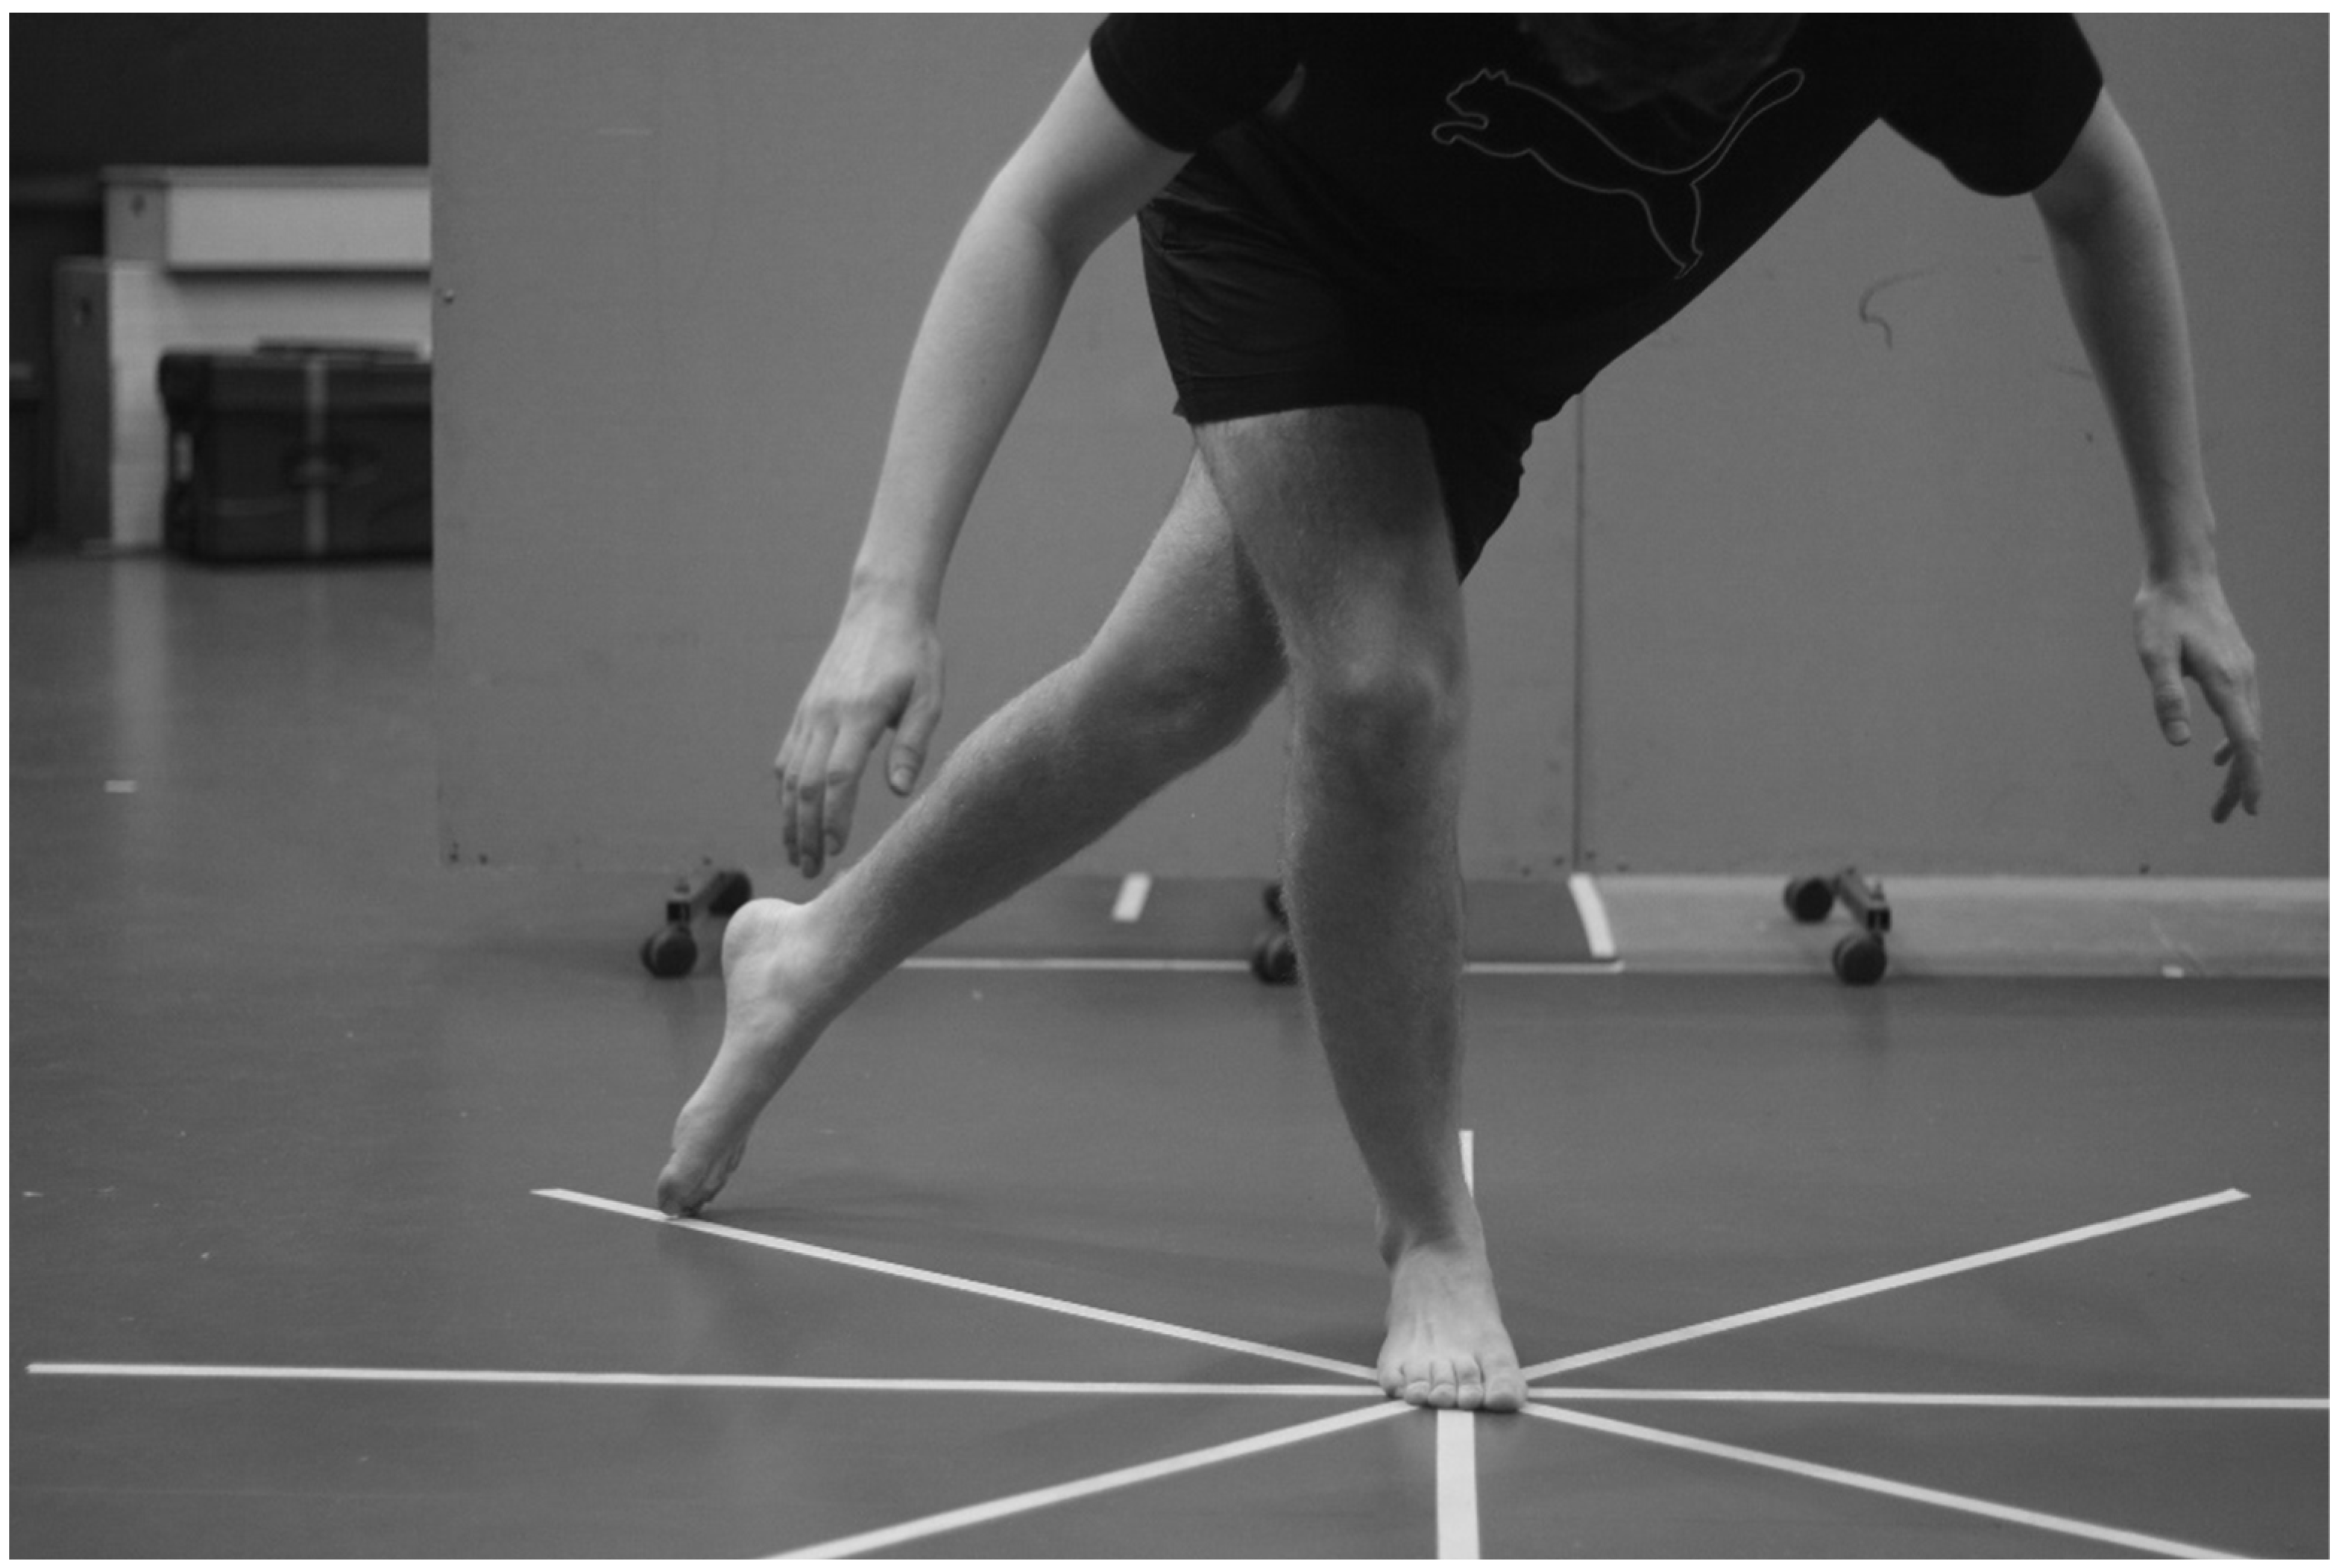
2.1.2. Star Excursion Balance Test (SEBT)

The SEBT has very good test–retest reliability, with an ICC of 0.84–0.92 [23]. The SEBT was implemented following the protocol of Kinzey and Armstrong [13]. Four pieces of masking tape, each two metres long, were placed on the lab floor, such that they intersected at a central point and left 45° between each strip of tape (Appendix C, Figure A4 and Figure A5). This created the following eight directions of equal-length tape around a central point: anterior, anterior lateral, lateral, posterior lateral, posterior, posterior medial, medial, and anterior medial. The participant was instructed to stand with the ball of their foot on the point where the tape intersected. They received four practice trials of reaching with their non-stance foot as far as possible in each of the eight directions of tape to account for the learning effect [23], before conducting three measured trials. Participants were allotted 15 s to regain their balance after each reach. They had to repeat the reach if they moved their stance foot, placed their reach foot down too heavily, or placed their hands on the ground. A pencil was used to mark the distance that the participant reached, with the length of the reach measured in centimetres via measuring tape. The pencil markings were erased after each trial. The participant completed all trials on their right foot, then switched to their left foot. The average of each reach direction was normalised for leg-length discrepancies and included for data analysis, in addition to the average reach distance for all directions for each participant.

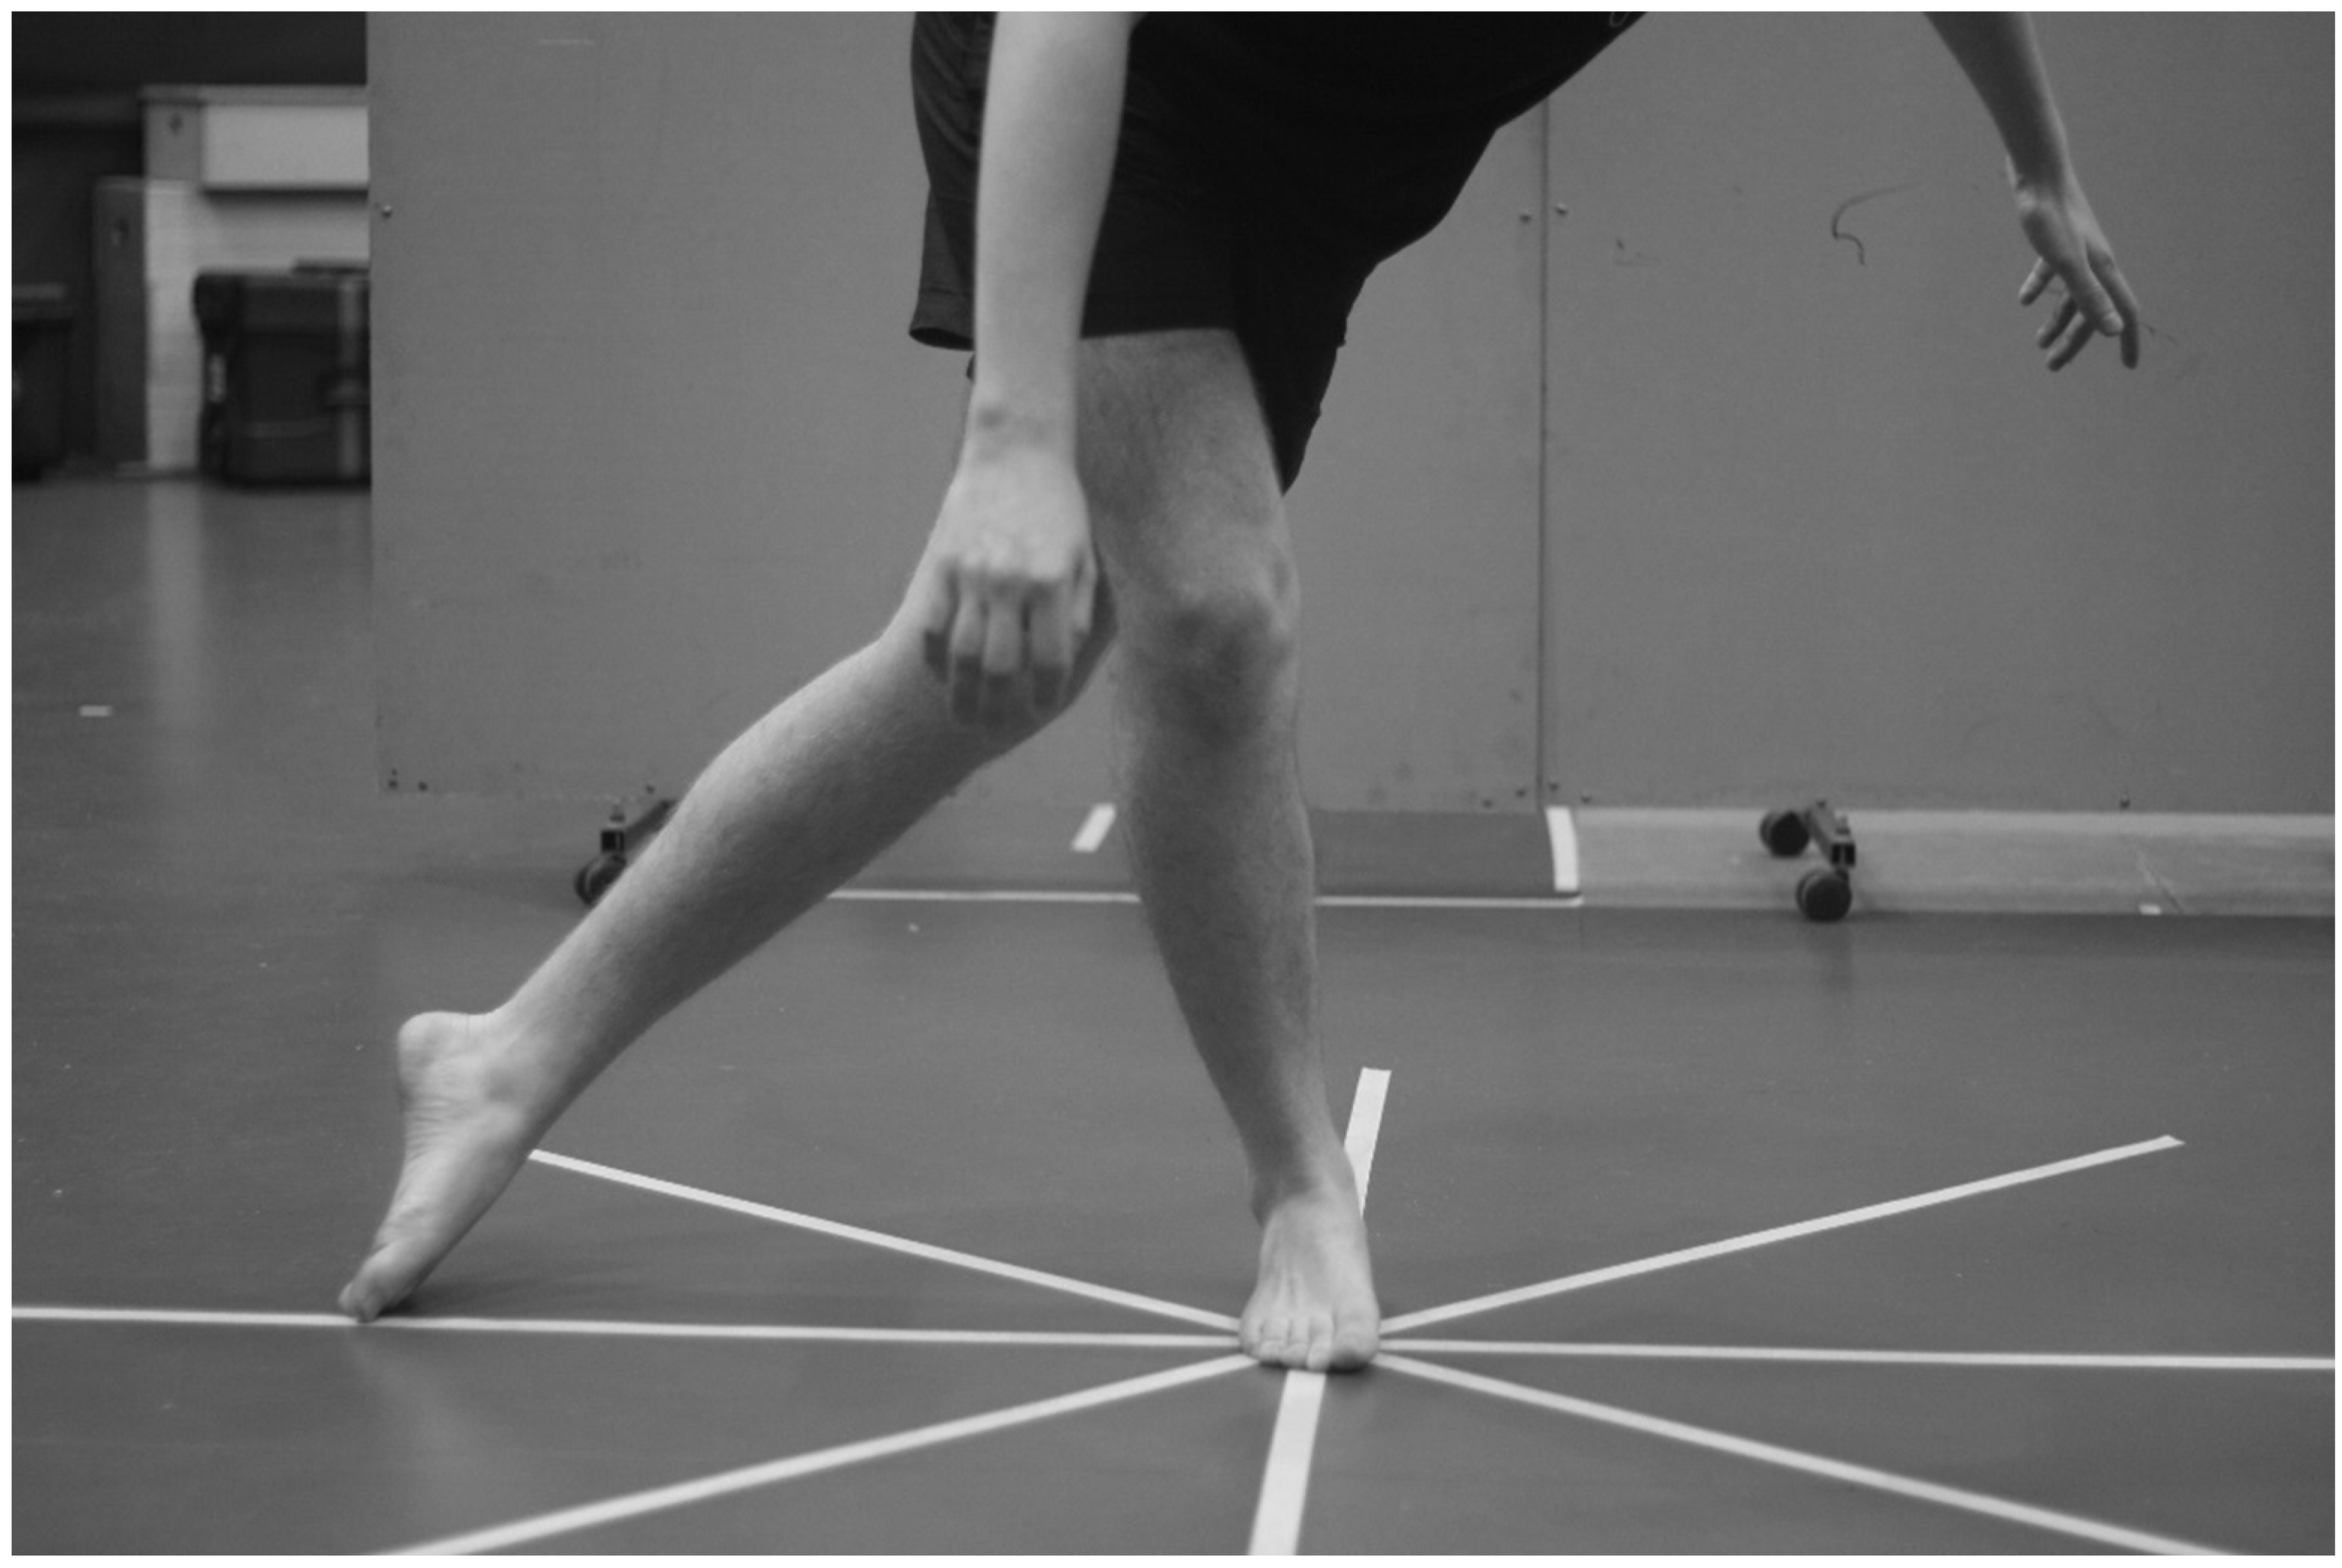
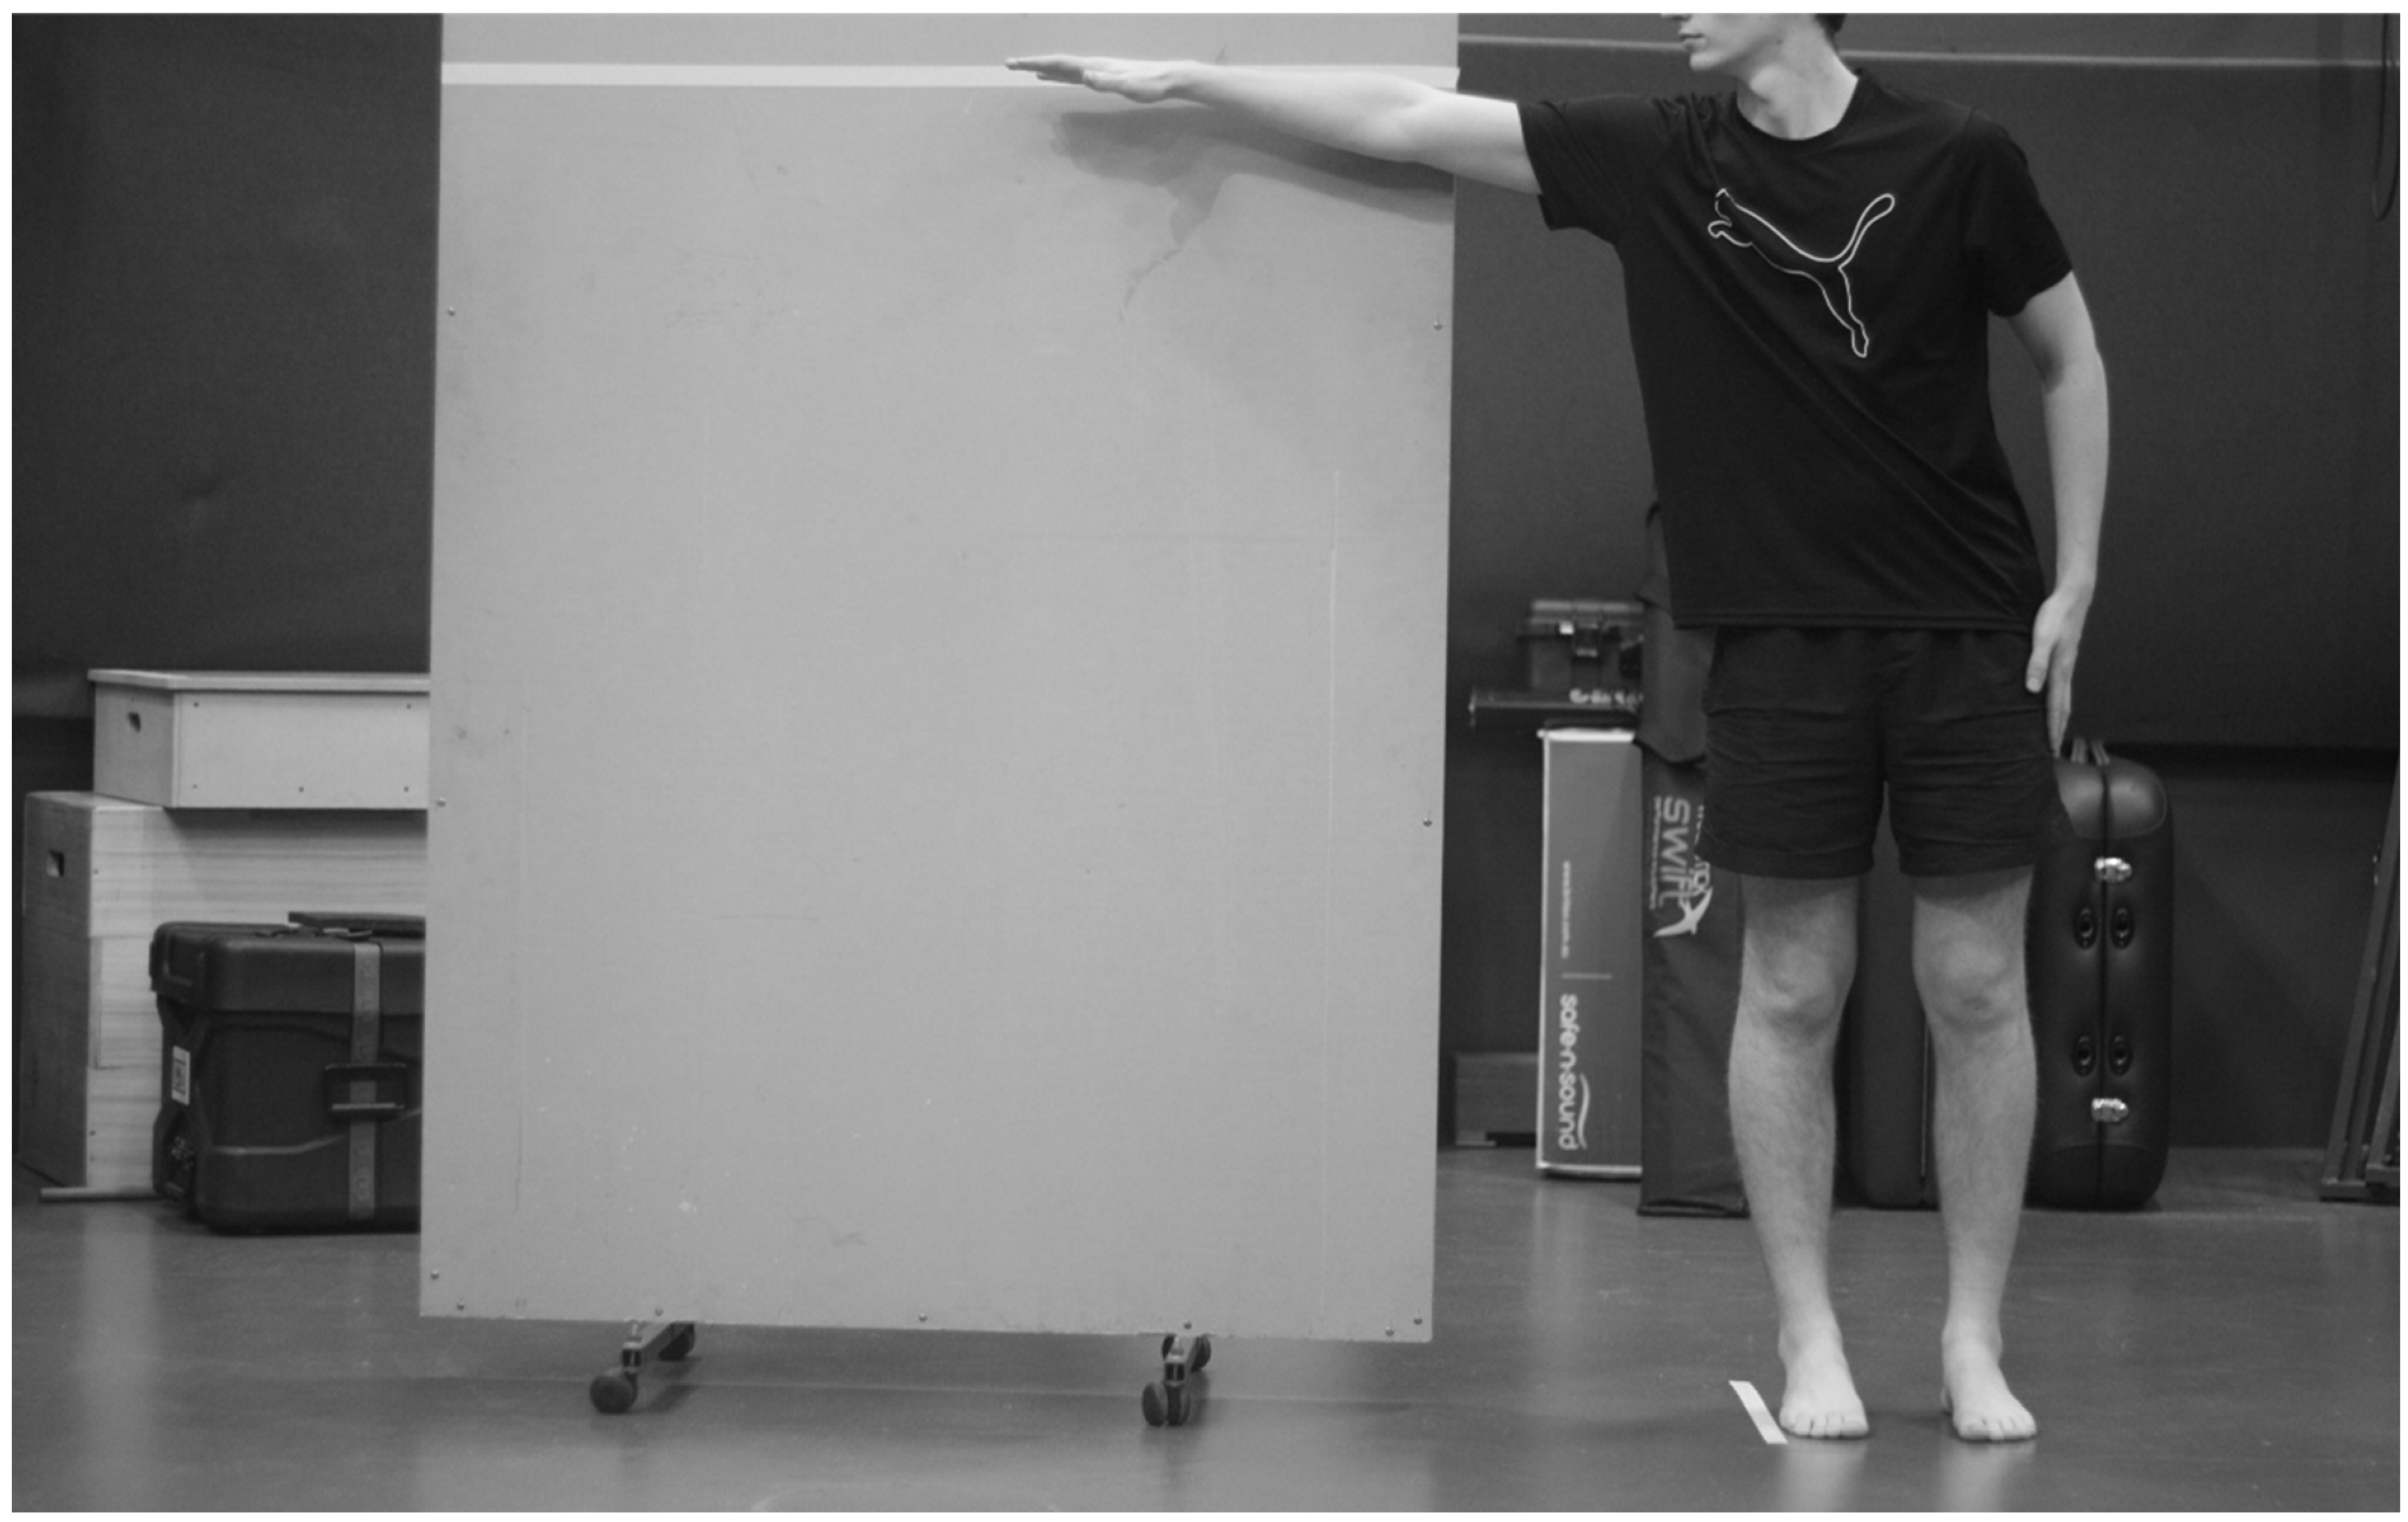
2.1.3. The Lateral Reach Test (LRT)

The LRT has very good test–retest reliability (ICC 0.94) [24]. The LRT was conducted following the protocol of Brauer et al. [24]. The test was set up using a horizontal strip of tape traversing a flat pin-up board (Appendix D, Figure A6). Participants were instructed to stand side-on to the board, with their feet flat on the floor and their non-test arm by their side. To standardise the test for arm length, participants raised their test arm to 90° and a pencil marking was made. Next, participants were instructed to reach laterally as far as possible. If they moved their feet or non-test arm, they were asked to repeat the trial. A pencil marking was made to indicate the most distal point the participant was able to reach. Measurements (cm) between arm length and the reach-length pencil markings were made. Participants received three practice trials [24], then two measured trials with their right arm, then left arm. The average of two trials per arm was used for data analysis.

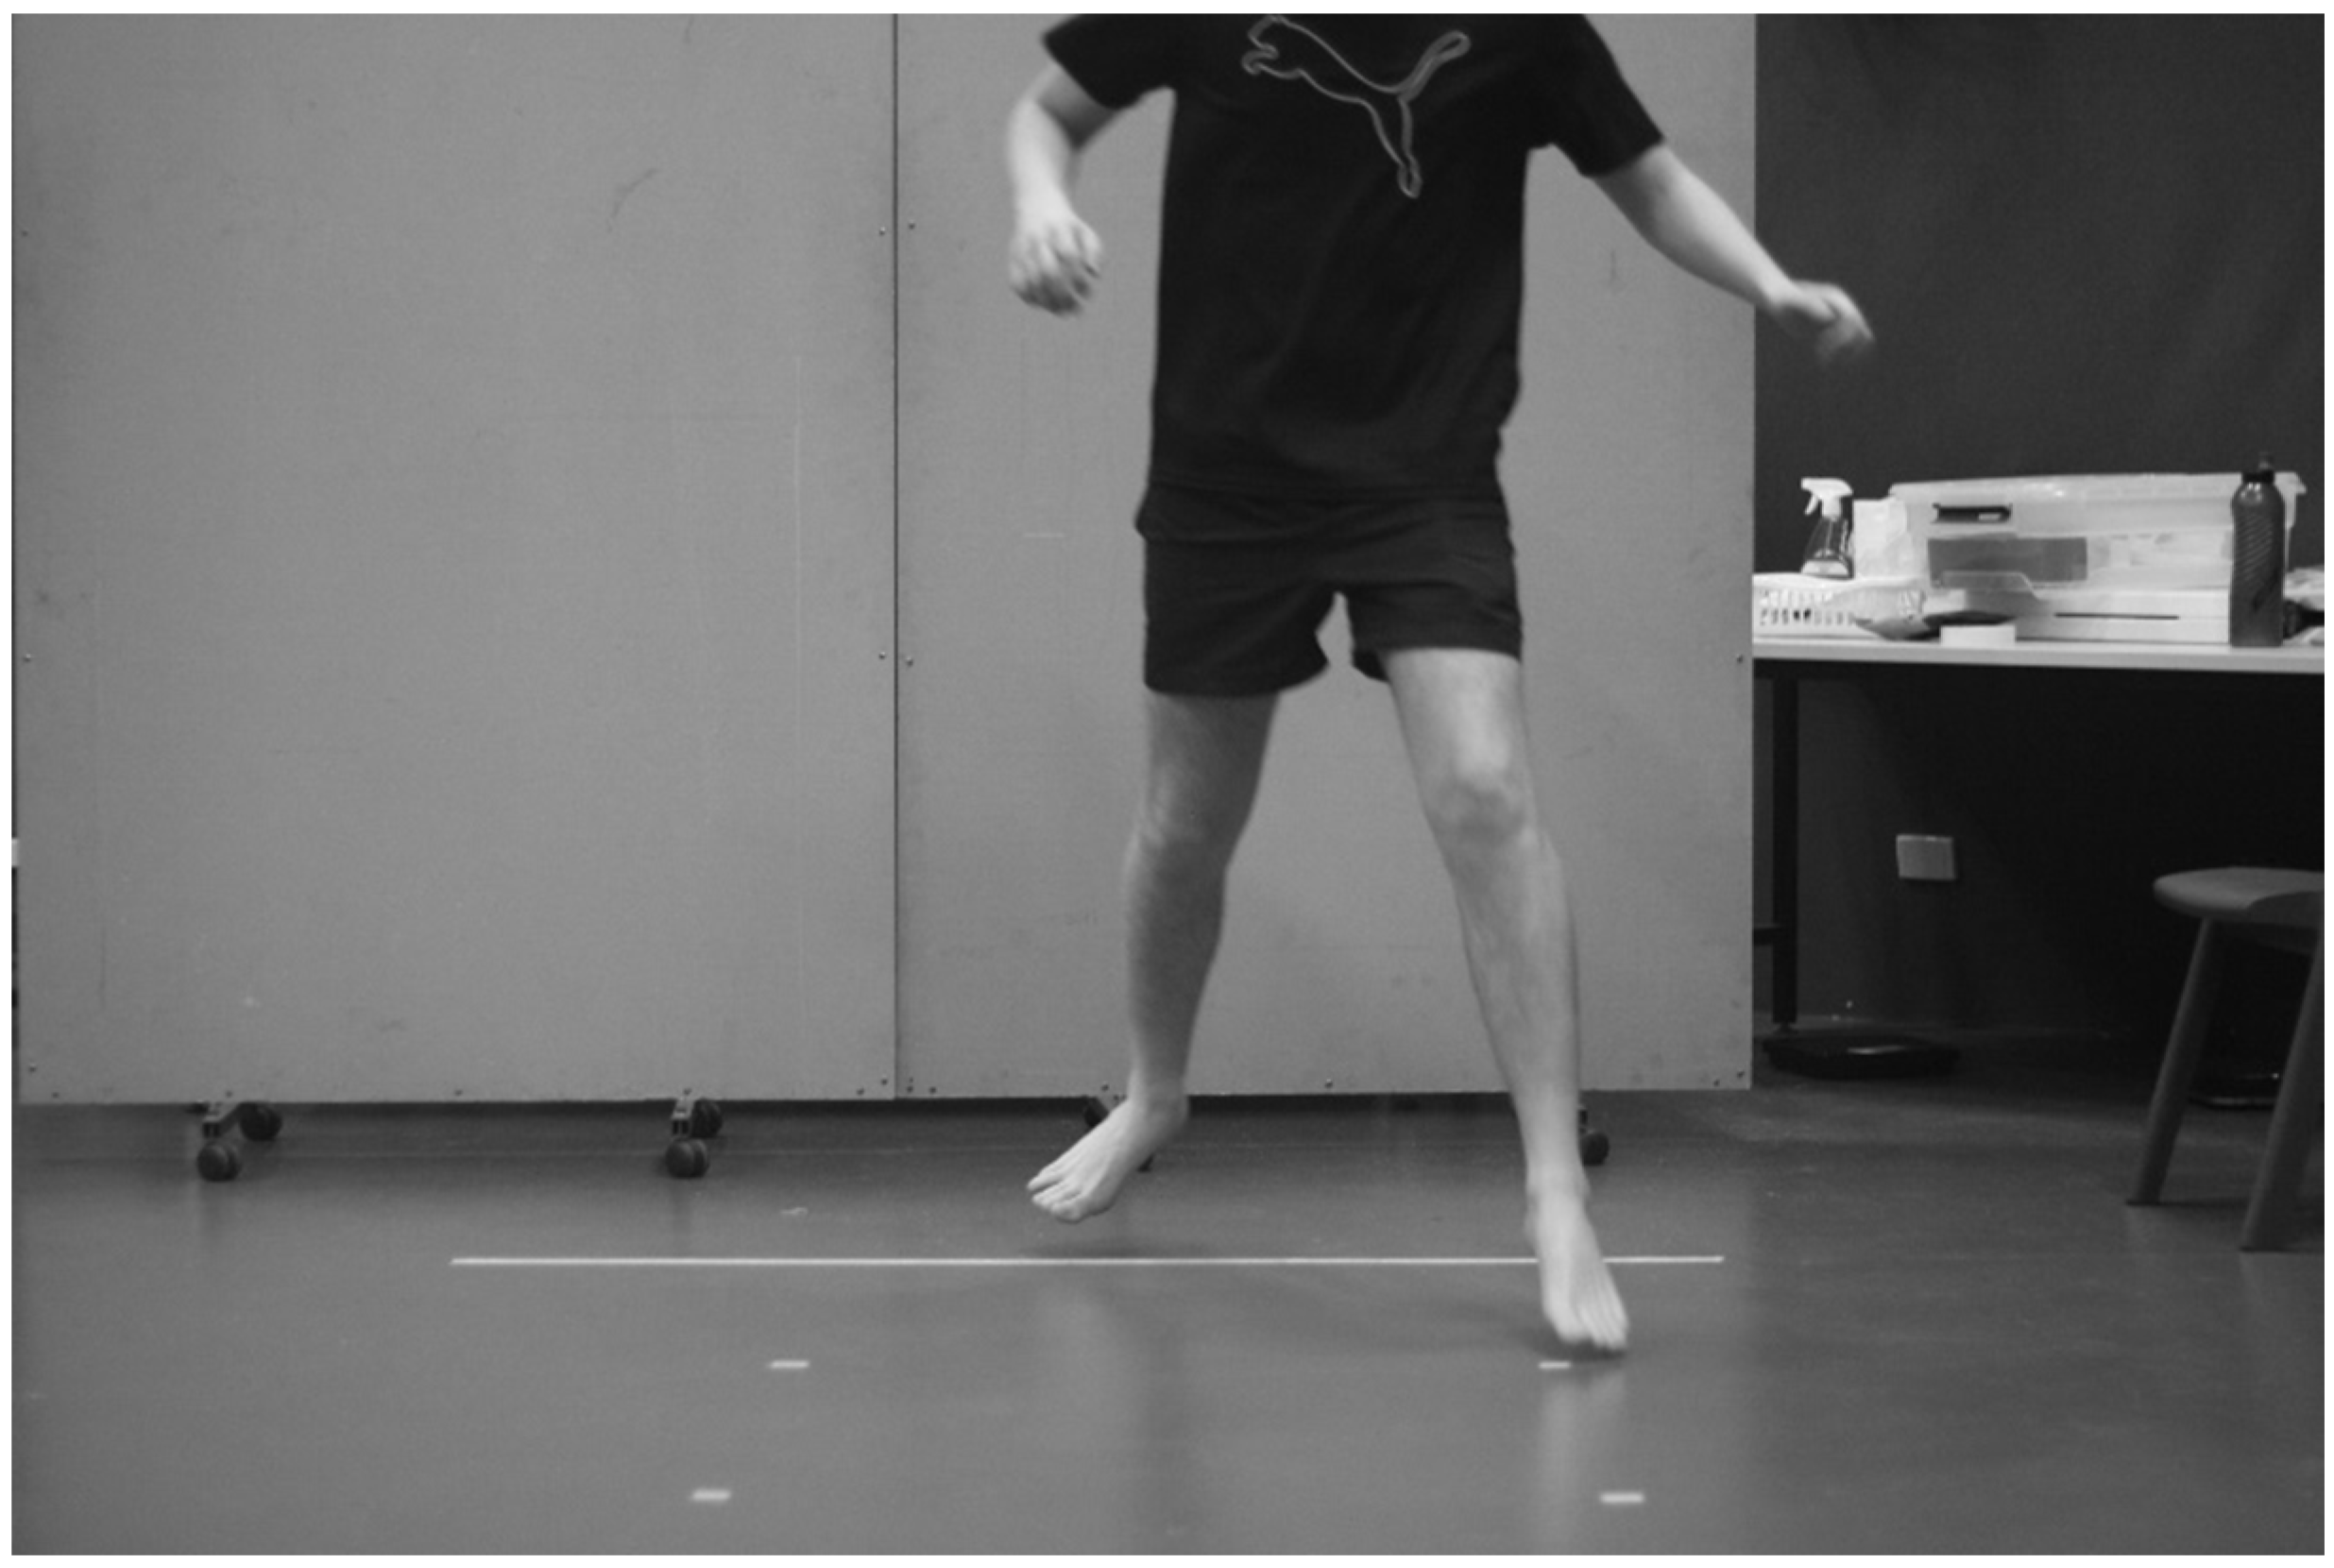
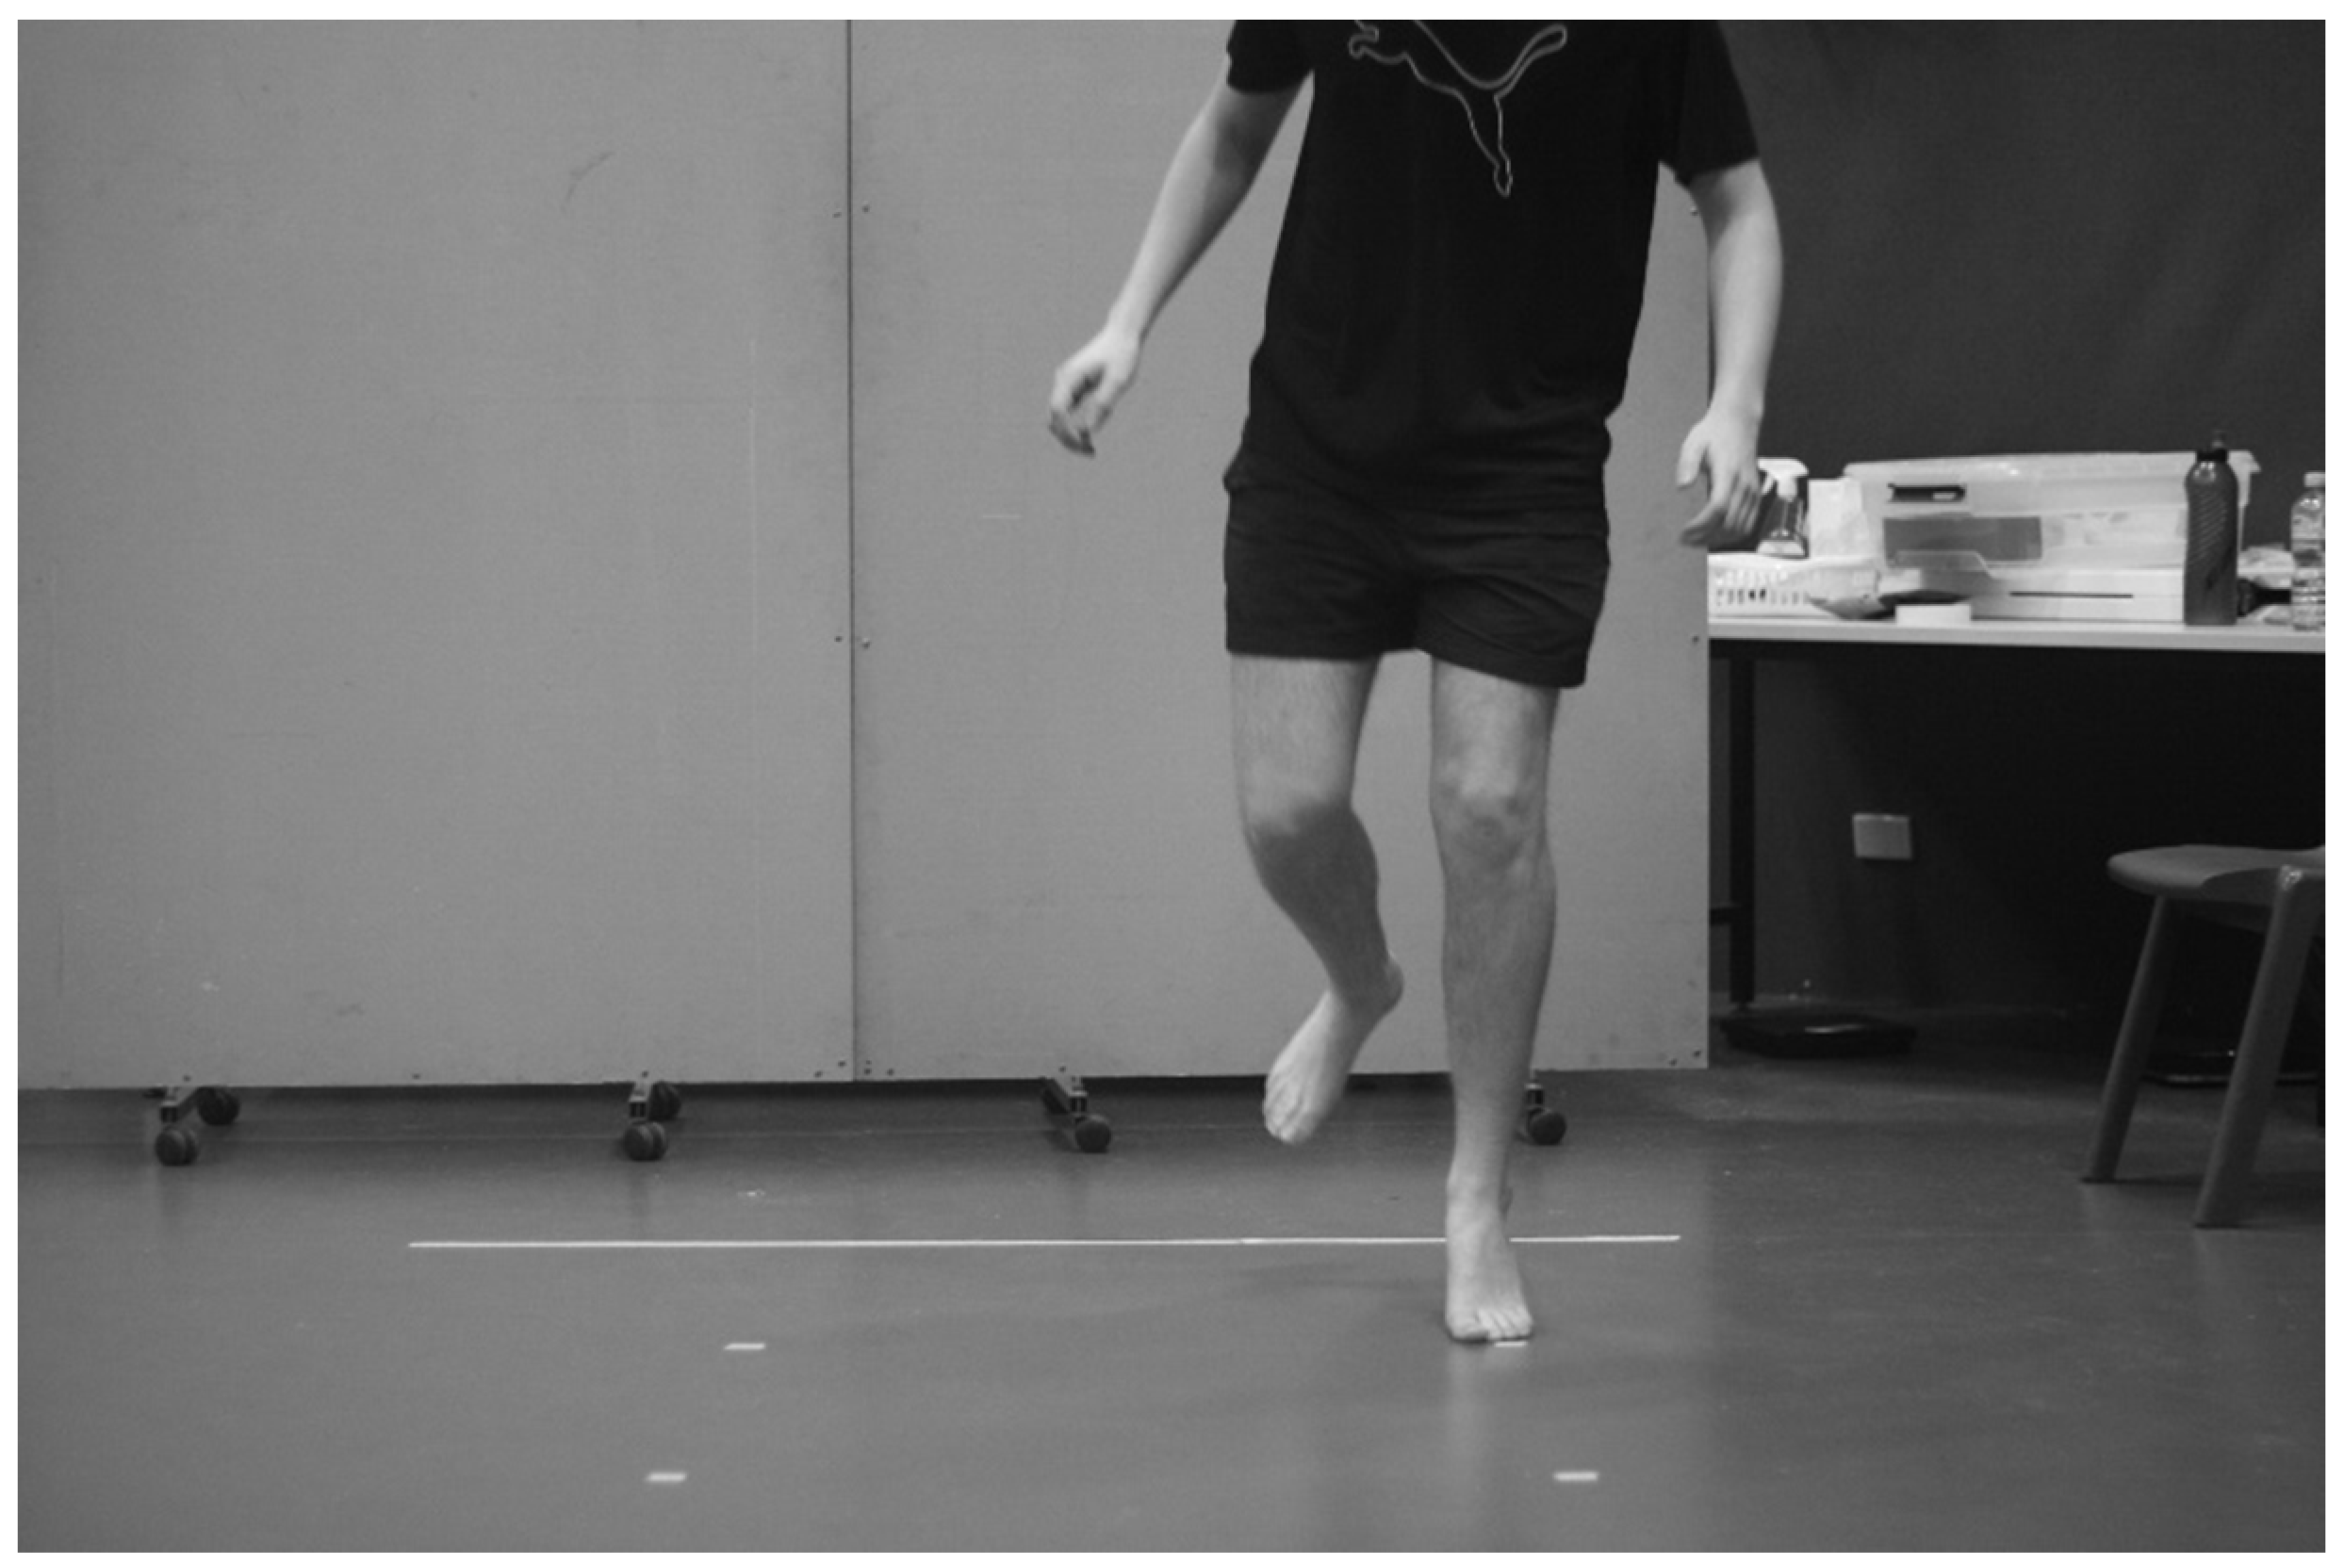
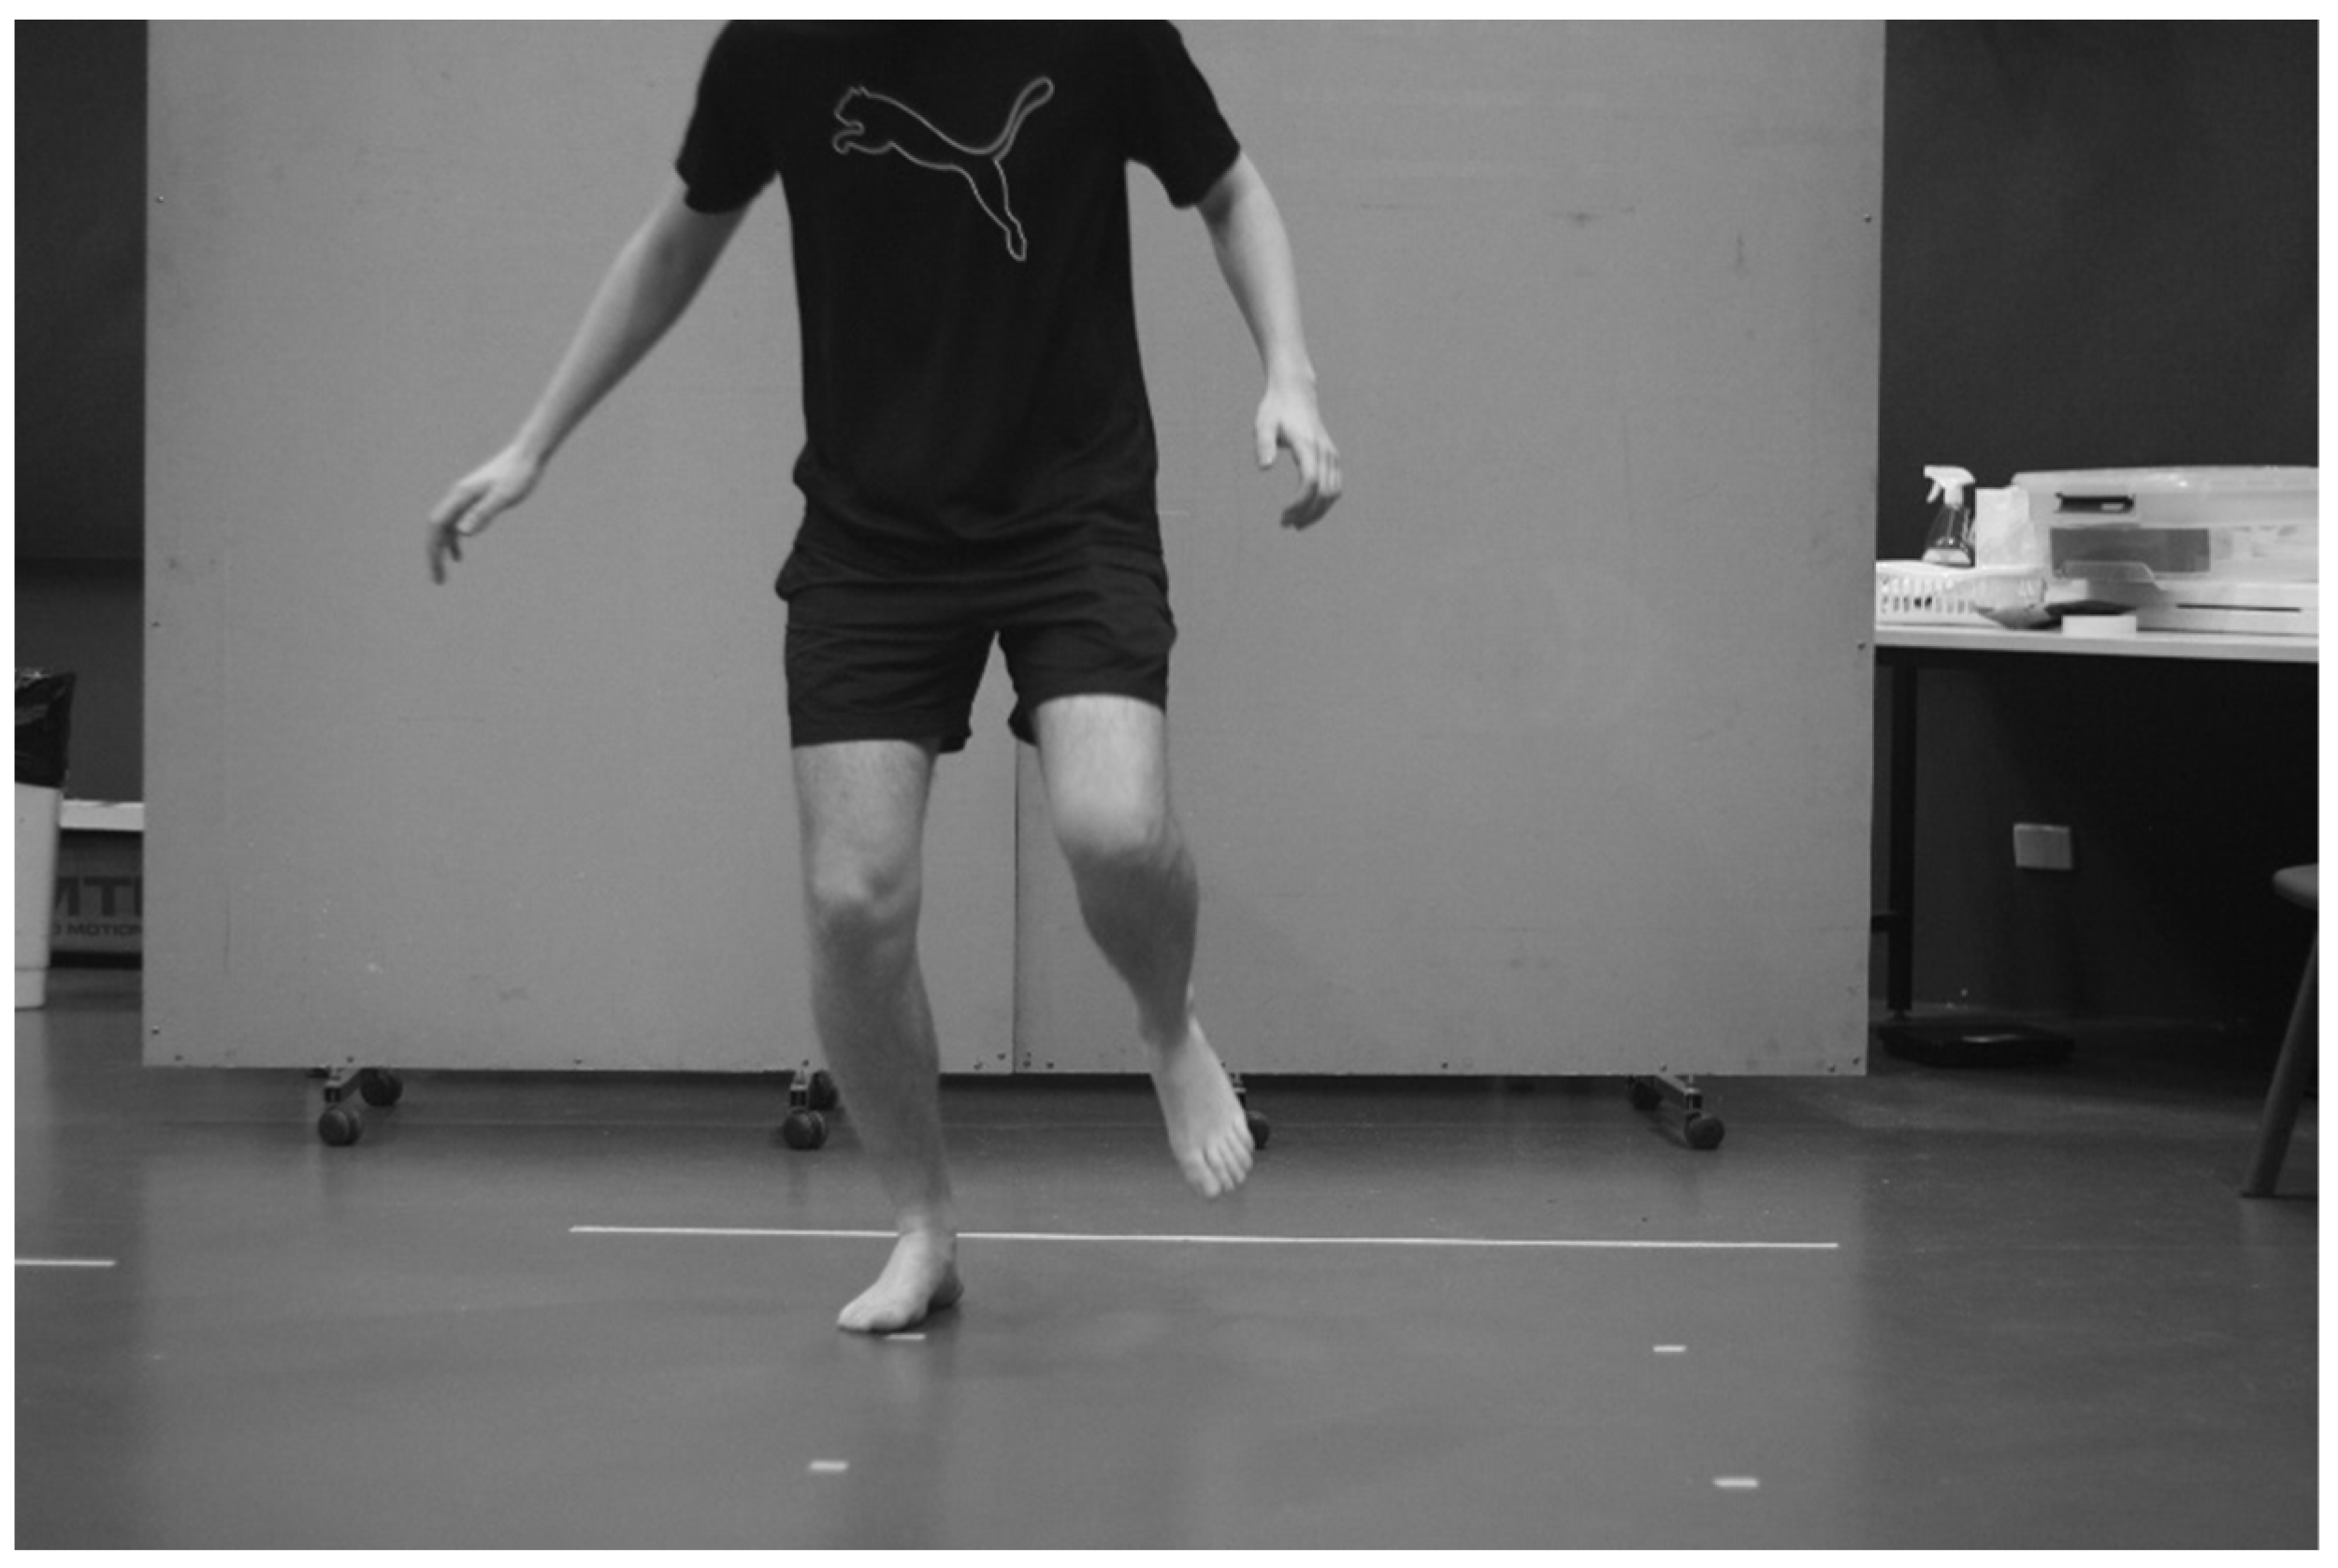
2.1.4. The Modified Bass Test of Dynamic Balance (BASS)

The BASS has good intra-rater reliability (ICC: 0.75) [15]. The BASS was conducted following the protocol of Ambegaonkar et al. [15]. It was set up in a standardised pattern using ten 2.5 cm by 2.5 cm numbered markers. Participants were tasked with alternate foot hopping through the markers in order from 1 to 10 (Appendix E, Figure A7, Figure A8 and Figure A9). At each marker, the participant had to remain balanced for five seconds without committing balance errors, i.e., placing the heel of their foot on the ground, moving their foot off the square, or placing any body part other than the ball of their foot on the ground. Additionally, landing errors were recorded, i.e., failing to completely cover each numbered square with the ball of the foot. The test was scored out of 100, with 10 points available per marker, 1 point deducted for a balance error, 5 points deducted for failing to cover the square upon landing, and 2 points deducted for a partial covering. A 60 bpm metronome was used to ensure the participant remained on each marker for five seconds. Each participant received two practice trials, prior to commencing three measured trials [15]. The average of these tree trials was used for data analysis.

2.1.5. Data Extraction

Lap time, mean lap time, mean corner time, mean lap velocity, median lap velocity, maximum lap velocity, minimum lap velocity, mean corner speed, maximum corner speed, and minimum corner speed were extracted from the GPS data as measures of cycling performance. The average pelvic roll angle during the corners was extracted from the IMU data as a measure of lean angle.

2.2. Statistical Analysis

The foregoing datasets were exported to the Statistical Package for the Social Sciences (SPSS v274.0, New York, NY, USA) and concatenated for analysis. Normality was tested using the Shapiro–Wilk test. Then, Spearman’s rank-order correlations (r) were used to examine the relationships between balance tests and cycling performance. Correlation coefficient strength was rated as follows: poor (<0.3), fair (0.3–0.5), moderately strong (0.5–0.8), or very strong (>0.8) [25,26]. A probability value (p) of <0.05 was accepted as the minimal level of statistical significance.

3. Results

In our study, the participants took an average of 80 ± 4 s (range: 68.7–94.4 s) to complete the lap. Their average lap velocity was 10 ± 0.7 m/s. During the lap, the participants reached an average maximum velocity of 11 ± 0.6 m/s and slowed to an average minimum velocity of 6.7 ± 3.1 m/s. The participants took 7 ± 0.5 s to complete the corner with an average speed of 10 ± 0.8 m/s through the corner. The maximum corner speed during the corner was 11.5 ± 1 m/s, while the minimum was 8.2 ± 1 m/s. The average lean angle during the corner was 15 ± 3.3°.
Participants scores in the BESS test ranged from 0 to 7 errors (Table 1). In the SEBT, participants’ average SEBT reach on the left was 87.7 ± 4.4% of their leg length, and 88.4 ± 7.4% of their leg length on the right. Overall, their average score was 88.0 ± 5.4% of their leg length. Participants were able to reach 21.4 ± 4.8 cm on their left reach during the LRT. They also achieved 22.5 ± 4.1 cm of reach on the right during this test. Lastly, participants scored an average of 89 ± 6 in the BASS test.
Our analysis revealed that cornering performance played a significant (p < 0.01) role in our participants’ cycling performance. Specifically, mean corner speed was very strongly correlated with cycling lap time (r = −0.88; Figure 2), mean lap velocity (r = 0.87; Figure 3), and median lap velocity (r = 0.84; Table 2). Further, moderately strong correlations were detected in other measures of cornering performance and cycling performance (Table 2).
Significant correlations (p < 0.05) that ranged from fair to moderately strong were detected between average lean angle during the corners and cycling performance (maximum velocity r = 0.64; lap time r = −0.45; mean lap time r = −0.44; mean velocity r = 0.42; median velocity r = 0.37; and maximum corner speed r = 0.36). These comparisons yielded a power of 0.9 when post hoc analysis was conducted using G*Power.
A moderately strong and statistically significant (p < 0.01) correlation was found between the average lean angle during the corners and the results from the SEBT (left posterior medial r = 0.87; left posterior r = 0.71; right posterior medial r = 0.61; right medial r = 0.61; average left SEBT r = 0.61; average SEBT r = 0.51; average right SEBT r = 0.51) and the BESS (unipedal r = 0.67; total error score r = 0.44).
Statistically significant (p < 0.05) though fair-to-weak correlations were found between the left posterior medial direction of the SEBT and cycling performance (maximum velocity r = 0.53; mean lap time r = −0.4; maximum corner speed r = 0.39; lap time r = −0.37), and also between average SEBT score and mean corner time (r = 0.43), as well as mean corner speed (r = −0.34). The total BESS errors were found to significantly correlate (p < 0.05) with mean lap time (r = −0.54), lap time (r = −0.43), and mean corner speed (r = −0.34). These comparisons yielded a power of 0.5 when post hoc analysis was conducted using G*Power. No significant correlations were found between the BASS or LRT and measures of cycling performance.

4. Discussion

The aims of this study were to explore the relationships between cornering performance and overall cycling performance, and to explore the relationships between balance and cycling performance. We found strong correlations between cornering performance and overall cycling performance. However, we found inconclusive results regarding the relationship between performance in the clinical balance test and cycling performance.
Strong relationships between cornering and cycling performance have only recently been reported in the literature. Zignoli et al. [27] collected lateral and longitudinal acceleration data from professional cyclists in two time-trial stages of the Giro d’Italia, and then created elliptical models to assess their cornering performance. They found strong correlations between the area of the ellipse and final performance time, indicating that cyclists who cornered their bicycles better, suggesting greater expertise in cornering, also finished the stages with quicker times [27]. Additionally, quicker cornering time was correlated with improved race time in a study of elite bicycle motocross riders [28]. Thus, the skills of cornering and bicycle handling are important components of performance in cycling.
The correlations between performance in the clinical balance tests we selected and measures of field cycling performance were weak. Whilst we identified a range of correlations between balance and cycling performance, notably between the BESS and mean corner speed and mean velocity, and the SEBT and mean corner speed, most of these linked superior balance to worse cycling performance. These findings contradict our hypothesis. One explanation is that athletes develop skills specific to the performance demands of their sport [29]. Thus, the balance required by a cyclist to cycle their bicycle may not translate to improved performance in the clinical balance tests that we used. Furthermore, while the BESS has been used to effectively differentiate the balance of soccer players, basketballers, and gymnasts [30], it has never been administered to a cycling population. The balance demands of a cyclist are vastly different to other athletes. Thus, the BESS may not be specific enough to cycling to correlate balance to cycling performance, and may highlight differences in the motor control processes that underlie standing balance and dynamic cycling balance. Alternatively, limitations in our sample or the balance tests, rather than the true relationship between balance and performance, may have influenced the results.
The left posterior medial direction of the SEBT was the only clinical balance test result that returned correlations to cycling performance that supported our hypothesis. The SEBT has not previously been administered to cycling populations. However, the posterior medial direction of the SEBT has been found to be the most sensitive SEBT direction for detecting superior balance in dancers compared to active controls, and balance deficits in chronic-ankle-instability populations [15,31]. While correlations between the left posterior medial direction of the SEBT and cycling performance were weak, there is potential for clinical balance tests, and the SEBT in particular, to correlate to cycling performance. Thus, further validation of the SEBT in cycling populations is warranted to explore the strength of the relationship between the SEBT and cycling performance.
The LRT is potentially not challenging enough for athletes, as it is typically used in balance-deficient populations such as geriatrics and paediatrics [14,24,32,33]. Although the LRT incorporates a lateral lean, similar to that required to corner a bicycle, the test may be too basic to sufficiently challenge elite cyclists, who are accustomed to cornering at high speeds within constantly changing dynamic environments. Therefore, the LRT should be trialled to test recreational cyclists or cyclists returning from injury, as these populations are likely to have poorer balance and worse cycling performance compared to our healthy sample.
The average BASS score returned no correlations to measures of bicycle performance. Similarly, Ambegaonkar et al. [15] reported that dancers and non-dancers both had similar BASS test scores, despite significant differences in BESS and SEBT scores. This finding may be because the BASS involves an alternate single-leg stance, a movement pattern which mirrors walking and running. Thus, the BASS may not differentiate those with good balance and poor balance, as all active individuals walk frequently. In addition, the test involves repeated hopping, which is not a motor task relevant to cycling. Therefore, the BASS may not be suitable for use in elite cycling populations.
We found correlations between lean angle, balance test scores, and cycling performance. Mean corner lean angle, determined via IMU data, provided a measurement of trunk lean angle. Trunk lean is an important aspect of cycling performance, as cyclists lean their body in order to control their bicycle, which is particularly relevant during cornering [2]. We found fair to moderately strong correlations between lean angle and performance measures such as mean lap time, as well as mean and maximum velocity. This finding supports the theoretical understanding of bicycle handling, which states that the rider induces cornering by counter-steering, then leaning into the direction of the desired corner [2]. The faster a cyclist corners, the more they have to lean into the corner to counterbalance, and thus, faster cyclists would be expected to have larger lean angles [34].
Moreover, strong correlations were found between mean lean angle and the SEBT and BESS clinical balance tests. Correlations were found between average scores in the SEBT and specific SEBT directions. Similar to performance measures, the left posterior medial direction was the strongest-correlated SEBT direction, indicating potential for it to be linked to cycling performance. Correlations were also found between mean lean angle and unipedal stance and total BESS errors. Lean-angle correlations to balance may occur because counter-balance movements of the hips and trunk are part of the balance strategy used by individuals to keep their centre of mass within their base of support [35]. Further research may reveal more about the influence of this parameter on balance and cycling performance.

Limitations and Future Lines of Research

We did not measure key aspects of bicycle dynamics such as lean angle in this study. Instead, we chose to focus on rider kinematics and bicycle velocity as key indicators of cycling performance. Future studies may want to include bicycle dynamics as well as rider kinematics to gain deeper insights into cycling performance. Further, our sample was limited to a highly skilled, homogenous group of participants on a relatively small, simple cycling track. Future research could include a range of variably skilled cyclists to establish the influence of differences in balance ability on cycling performance. Furthermore, the research team chose to use clinical balance tests to increase the clinical relevance of our results. However, laboratory tests of balance, measured by centre-of-pressure changes via a force plate, are considered the gold standard for balance testing and may have provided a more accurate evaluation of our participants’ balance [10]. Future research should focus on the relationships between cycling performance and cycling-specific balance tests.

5. Conclusions

Our study highlights the importance of cornering in overall cycling performance. Thus, cyclists can be encouraged to aim to improve their technical handling skills, as this will likely improve their race performance. Furthermore, our findings provide a solid foundation for future researchers to further explore the skill of bicycle handling. We found no clear correlations between balance and cycling performance, implicating that these clinical balance tests are not relevant to competitive cyclists. However, weak correlations existed between the SEBT and cycling performance, and between balance tests and pelvic lean, which together suggest a relationship to cycling performance. This indicates the potential for the SEBT to be utilised to assess balance deficits in competitive cyclists, which may improve performance. This avenue is particularly worthy of further, robust research.

Author Contributions

Conceptualization, T.H., K.N. and S.M.R.; methodology; T.H., K.N. and S.M.R.; formal analysis, T.H., C.M.H. and S.B.; writing—original draft preparation, T.H., C.M.H. and S.B.; writing—review and editing, K.N. and S.M.R.; supervision, K.N. and S.M.R.; project administration, K.N. and S.M.R. All authors have read and agreed to the published version of the manuscript.

Funding

This research received no external funding.

Institutional Review Board Statement

The study was conducted in accordance with the Declaration of Helsinki and approved by the institutional ethics committee of Curtin University with the approval number HRE2019-0418 on 4 July 2019.

Informed Consent Statement

Not applicable.

Data Availability Statement

Raw data from this project are available from the corresponding author upon request.

Acknowledgments

The authors would like to acknowledge Stuart Durham for his input to the study design.

Conflicts of Interest

Author Simon M. Rosalie was employed by the companies Dohrmann Consulting and SR Performance. The remaining authors declare that the research was conducted in the absence of any commercial or financial relationships that could be construed as a potential conflict of interest.

Appendix A. Standardised Clinical Balance Test Instructions

Appendix A.1. The Balance Error Scoring System (BESS)

“This balance test is called the BESS. This stands for balance error scoring system. The test involves you maintaining your balance while standing still. The test has different conditions: standing with your feet together, standing on one leg and standing with one foot in front of the other. These conditions will be repeated on flat ground, and on a foam block. At the beginning of each trial, I will ask you to adopt the standard starting position. This involves standing up straight with your hands on your hips. When I say go, you will close your eyes and try to remain balanced. Each trial will run for 20 s. During this 20 s period I will count the number of balance errors that you commit. A balance error entails bending your hip forwards or to the side more than 30°, moving your hands off your hips, lifting your heels or forefoot off the ground, opening your eyes, stepping/stumbling/falling out of position, or failure to return to the starting position after five seconds.
I ask that once you commit an error, you return to the standard position as quickly as you are able; however, ensure you do not rush and further disrupt your balance. Continue to do your best until the 20 s have elapsed. I will let you know when to stop. I will demonstrate each position to you before we begin. We will repeat the test twice. Before we begin, do you have any questions?”
Double leg stance: “Stand with your feet touching”
Single leg: “Stand on your non-dominant leg, bend your other leg so that it is not touching the ground. Once you are in the single leg position, then close your eyes and we will start timing”
Tandem: “Stand with your dominant leg in front of your non-dominant leg, so that the toe of your non-dominant leg touches the back of your heel”

Appendix A.2. Star Excursion Balance Test (SEBT)

“This test is called the star excursion balance test. It will involve you reaching in eight different directions with your leg in order to test your balance. The test will involve this section of tape that you can see on the floor. I will ask that you stand in the middle of the pattern, with the ball of your foot on the section where the tape intersects. Start with your right foot, and then we will perform on your left foot. This test requires that you reach as far as you can with your non-stance foot and lightly tap the most distant part of the tape that you can while maintaining your balance. Then, return your reaching foot to the middle, and move to the next piece of tape in an anti-clockwise direction. You will start by reaching towards the front piece of tape. You may have up to 15 s of rest between each trial if you wish. The test is completed once you have successfully reached in each direction. I need you to maintain your balance during this test and I will ask you to repeat the trial if you fail to maintain balance on your stance foot, lift or move your stance foot from the starting position, touch down too firmly with your reaching foot, or fail to return your reach foot to the starting position.
I will demonstrate the test and then give you four practice trials per direction per leg. We will then conduct three measured trials per leg. During the test I will follow your movements and take recordings with a pencil. I will give you a two-to-three-minute rest in between each trial while I record your results. Do you have any questions before we begin?”

Appendix A.3. The Lateral Reach Test (LRT)

“This next test called the lateral reach test. It is going to look at your ability to lean to the left and to the right while maintaining your balance. You will take your position standing side-on to the board with your feet shoulder-width apart. Keep your non-test arm at your sides. Place the arm closest to the board up to shoulder height. During this time, I will make a measurement of the arm. I will then ask you to reach as far along the line of tape as possible while keeping your feet on the ground and keeping your balance. If you lose your balance, we will repeat the trial. If you move your non-test arm or lift your feet off the floor we will repeat the trial. I will demonstrate the test, then you will receive three practice trials. We will then perform two measured trials. Before you begin do you have any questions?”

Appendix A.4. The Modified Bass Test of Dynamic Balance (BASS)

“The next test is called the modified bass test of dynamic balance. The test involves you hopping between a series of markers while maintaining your balance. The markers are numbered, and laid out on the floor in front of you. You will start at the marker that says “start” by balancing on your right foot. You will then hop onto your left foot onto the area marked ‘1’. You will then hop onto your right foot onto the area marked ‘2’. You will continue to hop to each numbered marker, alternating between left and right single-leg balance until you reach the last marker, number ten. At each marker I ask that you aim to completely cover the marker with your foot, and remain balanced on the ball of your foot for five seconds at each marker before continuing. I will be playing a metronome during the test, so count five beats of the metronome before moving to the next marker. I will deduct marks for the following errors:
Landing errors will result in a 5-point deduction: failing to stop and maintain balance upon landing, touching your heel or any body part on the ground apart from the ball of your foot, and failing to completely cover the square with ball of your foot. You will receive three points for partial covering. You will be allowed to reposition during the five-second balance phase if required.
Balance errors will result in a one-point deduction for every second that the error is committed, up to a maximum of five points: touching your heel or any body part on the ground apart from the ball of your foot and moving your foot while in balance position. If you completely lose your balance (i.e., stumble away from the marker), step back to the previous marker, step to the correct marker and continue the test.
I ask that you perform this test to the best of your ability. The test is scored out of 100, with 10 points available per marker. I will demonstrate the test; then, you will have two practice trials of your own. We will then conduct three testing trials and I will record your score for each of these three trials. Before we begin, do you have any questions?”

Appendix B. Balance Error Scoring System Setup

Figure A1. Bipedal stance condition of the BESS.
Applsci 14 06379 g0a1
Figure A2. Unipedal stance condition of the BESS.
Applsci 14 06379 g0a2
Figure A3. Tandem stance condition of the BESS.
Applsci 14 06379 g0a3

Appendix C. Star Excursion Balance Test Setup

Figure A4. Star excursion balance test setup. The above participant is reaching in the posterior medial direction. The foot remains flat, with the ball of the foot on the section where the pieces of tape overlap. The reaching foot lightly taps the section of tape.
Applsci 14 06379 g0a4
Figure A5. Star excursion balance setup. The above participant is reaching in the medial direction. The hands are free to move and can be used by the participant to aid their balance.
Applsci 14 06379 g0a5

Appendix D. The Lateral Reach Test Setup

Figure A6. Experimental setup of the lateral reach test. The participant is tasked with reaching as far as possible in a horizontal direction, while keeping their contralateral arm stationary by their side, and their feet flat on the floor.
Applsci 14 06379 g0a6

Appendix E. The Modified Bass Test of Dynamic Balance Setup

Figure A7. The participant jumps to the first marker.
Applsci 14 06379 g0a7
Figure A8. The participant remains balanced for five seconds per marker.
Applsci 14 06379 g0a8
Figure A9. After five seconds, the participants jumps to the next marker.
Applsci 14 06379 g0a9

References

  1. Cain, S.M.; Ashton-Miller, J.A.; Perkins, N.C. On the skill of balancing while riding a bicycle. PLoS ONE 2016, 11, e0149340. [Google Scholar] [CrossRef] [PubMed]
  2. Kooijman, J.D.G.; Schwab, A.L. A review on bicycle and motorcycle rider control with a perspective on handling qualities. Veh. Syst. Dyn. 2013, 51, 1722–1764. [Google Scholar] [CrossRef]
  3. Meijaard, J.P.; Papadopoulos, J.M.; Ruina, A.; Schwab, A.L. Linearized dynamics equations for the balance and steer of a bicycle: A benchmark and review. Proc. R. Soc. A Math. Phys. Eng. Sci. 2007, 463, 1955–1982. [Google Scholar] [CrossRef]
  4. Haeberle, H.S.; Navarro, S.M.; Power, E.J.; Schickendantz, M.S.; Farrow, L.D.; Ramkumar, P.N. Prevalence and epidemiology of injuries among elite cyclists in the Tour de France. Orthop. J. Sport. Med. 2018, 6, 1–5. [Google Scholar] [CrossRef]
  5. Australian Institute of Health and Welfare. Hospitalised Injury Due to Land Transport Crashes; Australian Institute of Health and Welfare: Darlinghurst, Australia, 2018. Available online: https://www.aihw.gov.au/reports/injury/hospitalised-injury-due-to-land-transport-crashes/contents/table-of-contents (accessed on 29 July 2021).
  6. Eley, R.; Vallmuur, K.; Catchpoole, J. Value of emergency department triage data to describe and understand patterns and mechanisms of cycling injuries. Emerg. Med. Australas. 2019, 31, 234–240. [Google Scholar] [CrossRef] [PubMed]
  7. Prati, G.; Puchades, V.M.; Pietrantoni, L. Cyclists as a minority group? Transp. Res. Part F Traffic Psychol. Behav. 2017, 47, 34–41. [Google Scholar] [CrossRef]
  8. Barrios, C.; Bernardo, N.D.; Vera, P.; Laíz, C.; Hadala, M. Changes in sports injuries incidence over time in world-class road cyclists. Int. J. Sport. Med. 2015, 36, 241–248. [Google Scholar] [CrossRef]
  9. Silberman, M.R. Bicycling injuries. Curr. Sport. Med. Rep. 2013, 12, 337–345. [Google Scholar] [CrossRef] [PubMed]
  10. Hrysomallis, C. Balance ability and athletic performance. Sport. Med. 2011, 41, 221–232. [Google Scholar] [CrossRef]
  11. Riemann, B.L.; Guskiewicz, K.M.; Shields, E.W. Relationship between clinical and forceplate measures of postural stability. J. Sport Rehabil. 1999, 8, 71–82. [Google Scholar] [CrossRef]
  12. Riemann, B.L.; Guskiewicz, K.M. Effects of mild head injury on postural stability as measured through clinical balance testing. J. Athl. Train. 2000, 35, 19–25. Available online: https://search-proquest-com.dbgw.lis.curtin.edu.au/docview/206657864/fulltextPDF/A344911D7B6405BPQ/1?accountid=10382# (accessed on 10 June 2024). [PubMed]
  13. Kinzey, S.J.; Armstrong, C.W. The reliability of the star-excursion test in assessing dynamic balance. J. Orthop. Sport. Phys. Ther. 1998, 27, 356–360. [Google Scholar] [CrossRef] [PubMed]
  14. Purohit, R.D.; Sadhale, A. Co-relation between static and dynamic balance in healthy individuals between 18-25 years using one leg stance test and multi directional reach test. Indian J. Physiother. Occup. Ther. 2014, 8, 89–93. Available online: https://search-proquest-com.dbgw.lis.curtin.edu.au/docview/1538320335/fulltextPDF/A2D6A6E46F4D4B88PQ/1?accountid=10382# (accessed on 9 June 2024). [CrossRef]
  15. Ambegaonkar, J.P.; Caswell, S.V.; Winchester, J.B.; Shimokochi, Y.; Cortes, N.; Caswell, A.M. Balance comparisons between female dancers and active nondancers. Res. Q. Exerc. Sport 2013, 84, 24–29. [Google Scholar] [CrossRef] [PubMed]
  16. Ambegaonkar, J.P.; Redmond, C.J.; Winter, C.; Cortes, N.; Ambegaonkar, S.J.; Thompson, B.; Guyer, S.M. Ankle stabilizers affect agility but not vertical jump or dynamic balance performance. Foot Ankle Spec. 2011, 4, 354–360. [Google Scholar] [CrossRef]
  17. Elliott, J.; Anderson, R.; Collins, S.; Heron, N. Sports-related concussion (SRC) assessment in road cycling: A systematic review and call to action. BMJ Open Sport Exerc. Med. 2019, 5, e000525. [Google Scholar] [CrossRef] [PubMed]
  18. Marin-Perianu, R.; Marin-Perianu, M.; Havinga, P.; Taylor, S.; Begg, R.; Palaniswami, M.; Rouffet, D. A performance analysis of a wireless body-area network monitoring system for professional cycling. Pers. Ubiquitous Comput. 2013, 17, 197–209. [Google Scholar] [CrossRef]
  19. Cockcroft, J.; Scheffer, C. Determining the feasibility of measuring outdoor road cycling kinematics using inertial motion capture technology. SAIEE Afr. Res. J. 2011, 102, 31–39. [Google Scholar] [CrossRef]
  20. Gribble, P.A.; Hertel, J. Considerations for normalizing measures of the Star Excursion Balance Test. Meas. Phys. Educ. Exerc. Sci. 2003, 7, 89–100. [Google Scholar] [CrossRef]
  21. Finnoff, J.T.; Peterson, V.J.; Hollman, J.H.; Smith, J. Intrarater and interrater reliability of the balance error scoring system (BESS). Pm&r 2009, 1, 50–54. [Google Scholar] [CrossRef]
  22. Bell, D.R.; Guskiewicz, K.M.; Clark, M.A.; Padua, D.A. Systematic review of the balance error scoring system. Sport. Health 2011, 3, 287–295. [Google Scholar] [CrossRef] [PubMed]
  23. Munro, A.G.; Herrington, L.C. Between-session reliability of the star excursion balance test. Phys. Ther. Sport 2010, 11, 128–132. [Google Scholar] [CrossRef] [PubMed]
  24. Brauer, S.; Burns, Y.; Galley, P. Lateral reach: A clinical measure of medio-lateral postural stability. Physiother. Res. Int. 1999, 4, 81–88. Available online: https://search-proquest-com.dbgw.lis.curtin.edu.au/docview/215212279/fulltextPDF/5A08E3C4635E444DPQ/1?accountid=10382 (accessed on 9 June 2024). [CrossRef]
  25. Chan, Y.H. Biostatistics 104: Correlational analysis. Singap. Med. J. 2003, 44, 614–619. Available online: https://www.sma.org.sg/smj/4412/4412bs1.pdf (accessed on 1 June 2024).
  26. Cohen, J. Statistical Power Analysis for the Behavioral Sciences; Lawrence Erlbaum Associates: Mahwah, NJ, USA, 1988; Available online: https://books.google.com.au/books?hl=en&lr=&id=rEe0BQAAQBAJ&oi=fnd&pg=PP1&ots=swWSMuQRo7&sig=atG2PGBReLXr8roeZfXg-g3w5Dc&redir_esc=y#v=onepage&q&f=false (accessed on 17 September 2021).
  27. Zignoli, A.; Biral, F.; Fornasiero, A.; Sanders, D.; Erp, T.V.; Mateo-March, M.; Fontana, F.Y.; Artuso, P.; Menaspà, P.; Quod, M.; et al. Assessment of bike handling during cycling individual time trials with a novel analytical technique adapted from motorcycle racing. Eur. J. Sport Sci. 2022, 22, 1355–1363. [Google Scholar] [CrossRef]
  28. Daneshfar, A.; Petersen, C.; Gahreman, D.; Knechtle, B. Power analysis of field-based Bicycle Motor Cross (BMX). Open Access J. Sport. Med. 2020, 11, 113–121. [Google Scholar] [CrossRef]
  29. Zemková, E. Sport-specific balance. Sport. Med. 2014, 44, 579–590. [Google Scholar] [CrossRef]
  30. Bressel, E.; Yonker, J.C.; Kras, J.; Heath, E.M. Comparison of static and dynamic balance in female collegiate soccer, basketball, and gymnastics athletes. J. Athl. Train. 2007, 42, 42–46. Available online: https://www.proquest.com/docview/206650796/fulltextPDF/76D1B54BB88C4091PQ/1?accountid=10382# (accessed on 2 June 2024). [PubMed]
  31. Hertel, J.; Braham, R.A.; Hale, S.A.; Olmsted-Kramer, L.C. Simplifying the star excursion balance test: Analyses of subjects with and without chronic ankle instability. J. Orthop. Sport. Phys. Ther. 2006, 36, 131–137. [Google Scholar] [CrossRef]
  32. Yuksel, E.; Ozcan Kahraman, B.; Nalbant, A.; Kocak, U.Z.; Unver, B. Functional reach and lateral reach tests in turkish children. Phys. Occup. Ther. Pediatr. 2017, 37, 389–398. [Google Scholar] [CrossRef]
  33. DeWaard, B.P.; Bentrup, B.R.; Hollman, J.H.; Brasseur, J.E. Relationship of the functional reach and lateral reach tests in elderly females. J. Geriatr. Phys. Ther. 2002, 25, 4–9. Available online: https://www.proquest.com/docview/213624216/fulltextPDF/6A5654CAE6C243BBPQ/2?accountid=10382 (accessed on 30 May 2024). [CrossRef]
  34. Popov, A.A.; Rowell, S.; Meijaard, J.P. A review on motorcycle and rider modelling for steering control. Veh. Syst. Dyn. 2010, 48, 775–792. [Google Scholar] [CrossRef]
  35. Nashner, L.M. Practical Biomechanics and Physiology of Balance; Plural Publishing Inc.: San Diego, CA, USA, 2014; Available online: https://books.google.com.au/books?id=lSzJDwAAQBAJ&printsec=frontcover&source=gbs_ge_summary_r&cad=0#v=onepage&q&f=false (accessed on 26 September 2021).
Figure 1. An aerial map of the circuit, including the corners and the start/finish.
Applsci 14 06379 g001
Figure 2. Scatter plot of lap time and mean corner speed.
Applsci 14 06379 g002
Figure 3. Scatter plot of mean lap velocity and mean corner speed.
Applsci 14 06379 g003
Table 1. Participants’ BESS error scores.
Balance Error Scoring System (Errors)
Bipedal0 ± 0
Bipedal on foam0 ± 0
Unipedal2 ± 1
Unipedal on foam7 ± 1
Tandem1 ± 1
Tandem on foam5 ± 2
Table 2. Significant correlations between cornering performance and cycling performance.
Variable OneVariable TwoSpearman’s Correlations (r)
Mean corner speedLap time−0.88
Mean corner speedMean velocity0.87
Mean corner speedMedian velocity0.84
Maximum corner speedLap time−0.82
Maximum corner speedMedian velocity0.80
Maximum corner speedMean velocity0.78
Mean corner speedMean lap time−0.75
Maximum corner speedMaximum velocity0.73
Maximum corner speedMean lap time−0.72
Mean corner speedMaximum velocity0.65
Disclaimer/Publisher’s Note: The statements, opinions and data contained in all publications are solely those of the individual author(s) and contributor(s) and not of MDPI and/or the editor(s). MDPI and/or the editor(s) disclaim responsibility for any injury to people or property resulting from any ideas, methods, instructions or products referred to in the content.

