Article

Fracture Mechanism and Damage Constitutive Model of Freeze–Thaw Fissured Granite Subjected to Fatigue Loading

1
School of Architecture and Civil Engineering, Xi’an University of Science and Technology, Xi’an 710054, China
2
Key Laboratory of Urban Security and Disaster Engineering, Ministry of Education, Beijing University of Technology, Beijing 100124, China
*
Authors to whom correspondence should be addressed.
Appl. Sci. 2024, 14(14), 6324; https://doi.org/10.3390/app14146324
Submission received: 21 June 2024 / Revised: 14 July 2024 / Accepted: 18 July 2024 / Published: 20 July 2024
(This article belongs to the Special Issue High-Reliability Structures and Materials in Civil Engineering)

Abstract

:
The failure of rock in cold regions due to repeated freeze–thaw (F-T) cycles and periodic load-induced fatigue damage presents a significant challenge. This study investigates the evolution of the multi-scale structure of fractured granite under combined freeze–thaw (F-T) cycles and periodic loading and develops a constitutive damage model. The results indicate that after F-T cycles, network cracks develop around pre-existing cracks, accompanied by block-like spalling. After applying the fatigue load, the nuclear magnetic resonance (NMR) T2 spectrum shifts to the right, significantly increasing the amplitude of the third peak. The freeze–thaw process induces a “liquid–solid” phase transition, weakening the original pore structure of the rocks and leading to meso-damage accumulation. The pores in fractured granite progressively enlarge and interconnect, reducing the rock’s load-bearing capacity and fatigue resistance. The combined effects of F-T cycles and periodic loading induce particle movement and alter fracture modes within the rock, subsequently affecting its macro-damage characteristics. The theoretical curves of the constitutive model align with the experimental data. The findings can serve as a theoretical reference for preventing and controlling engineering disasters in fractured rock masses in cold regions.

1. Introduction

Permafrost and seasonal frozen soil are predominantly found in the western and northern regions of China, covering over 70% of the land area. With the rising demand for transportation infrastructure and energy development, more rock mass projects are expanding into cold regions. After geological evolution and tectonic movement, a rock mass is rich in joints and fissures, posing significant challenges to rock mass engineering in cold regions. For instance, regions such as Haixi, Ngari, Nagqu, and Yushu experience 140 days per year with a temperature difference of more than 15 °C between day and night and undergo up to 200 freeze–thaw cycles annually (Figure 1) [1]. In cold regions, fractured rock masses in highways, railways, tunnel slopes, and mining slopes of large open-pit mines experience various disasters due to freeze–thaw cycles and cyclic loading [2,3,4,5]. Examples include freeze cracks in open tunnel sections [6], landslides [7], and rockfalls [8,9], significantly affecting the long-term stability of rock mass engineering in these areas.
The primary mechanisms underlying rock freeze–thaw damage include ice volume expansion [10], hydraulic stress from unfrozen water in micropores [11], and internal stress induced by crystal growth [12]. Numerous scholars have conducted extensive laboratory tests and studies. It is widely accepted that porosity [13,14], saturation [15,16,17], freeze–thaw cycle frequency [18,19], pH value [20,21,22,23], and confining pressure [24,25] are the primary factors influencing freeze–thaw damage in rocks. Based on this, scholars have used damage theory to establish rock freeze–thaw damage models, employing factors such as the elastic modulus [26], pore structure [27,28], and ultrasonic longitudinal wave velocity [29,30]. They have also developed corresponding structural models [31,32]. Apart from being susceptible to freeze–thaw geological disasters, rock engineering faces significant challenges from construction-related disturbances and periodic fatigue deformation induced by traffic load cycles during operation [33]. Consequently, research on the mechanical behavior of rocks under fatigue and dynamic loads has emerged as a prominent area of focus [34,35]. Wang [36,37,38] and Bagde [39] analyzed how different stress amplitudes, upper bound stresses, and loading waveforms affect the evolution of rock fractures. Ge and Vutukuri et al. [40,41] proposed the fatigue threshold theory to assess the fatigue failure of rock masses. He et al. [42] examined the evolution of rock fatigue damage variables using the Weibull probability distribution function. Li et al. [43] explored the damage law of rocks under cyclic loading based on dissipated energy. Liu et al. [44] developed a constitutive model for rock fatigue deformation by comparing it with the long-term creep of rocks. However, in cold regions, cracked rock masses often experience simultaneous effects of freeze–thaw cycles and periodic loading during the damage accumulation process. Recent studies have primarily focused on either freeze–thaw or cyclic load damage [45,46,47]. This study aims to bridge this gap by examining the combined effects.
This paper conducts a freeze–thaw cycle (F-T) test on double-fractured granite, followed by a uniaxial fatigue load test. The pore distribution of the samples at different stages was analyzed through NMR scanning. High-speed photographic monitoring was used to explain the fracture evolution behavior of macroscopic cracks during uniaxial fatigue loading. This study investigates the combined effects of freeze–thaw and fatigue loading on the damage and failure characteristics of cracked granite. Additionally, a damage constitutive mathematical model is developed, taking into account the combined influence of prefabricated cracks, freeze–thaw cycles, and fatigue loading. These findings contribute to a deeper understanding of the damage and failure mechanisms of fractured rock masses in seasonally frozen areas.

2. Materials and Methods

2.1. Test Procedure

The jointed rock mass was simulated by pre-fabricating fractures, and the rock sample was prepared according to international standards into a cylindrical sample (Φ 50 × 100 mm). Each of the two fractures measured 15 mm in length and 1.5 mm in width and has a dip angle of 45°. The dip angle of the rock bridge was fixed at 90° and had a length of 20 mm. The entire experimental process was divided into three stages, as illustrated in Figure 2.
(1) Stage 1: Trial preparation stage (Figure 2a).
After determining the parameters of the fractured rock sample, a core was drilled vertically along the granite bedding using a borehole coring machine. Subsequently, double fissures in a wild goose shape were prefabricated using a waterjet cutting machine to prepare the granite sample.
(2) Stage 2: Freeze–thaw cycle test stage (Figure 2b).
Ultrasonic longitudinal wave velocity tests were conducted, and rock samples with abnormal wave velocities were removed to ensure sample consistency and reduce test errors caused by discrepancies. Firstly, the samples were dried and vacuum-coated. The results showed that the water saturation of the samples was 0.84% to 0.93%, the saturation density was 2.526 g/cm3 to 2.580 g/cm3, and the compression wave velocity was 4.175 km/s to 4.245 km/s under saturation. Then, the freeze–thaw cycle test was conducted within the temperature range of −20 °C to 20 °C. The pore distribution was measured using nuclear magnetic resonance scanning at the 0th, 40th, and 80th freeze–thaw cycles.
(3) Stage 3: Uniaxial compression fatigue load test (Figure 2c).
Granite specimens with double fractures were subjected to uniaxial cyclic loading tests with a stress ratio of 0.7 after various freeze–thaw cycles. High-speed photographic capture technology was employed to investigate the macroscopic fracture evolution behavior during compression.

2.2. Test Equipment

(1) Nuclear magnetic resonance (NMR) test equipment.
The NMR pore analyzer consists of four parts including an industrial computer, a radio frequency unit, a magnet cabinet, and a temperature control system. The main parameters are as follows: System model: NMC12-010V, magnetic field intensity: 0.3 ± 0.05 T; H proton resonance frequency: 12 MHz, probe coil diameter: 150/60/20 mm; and Magnet temperature: 32 °C, temperature control range: −25 °C to 25 °C, accuracy: ±0.1 °C.
(2) High-speed camera.
The high-speed camera type used is Photron UX50, with a maximum frame rate of 2000 fps. It consists primarily of the main unit, a 50 mm lens, and a pylon tripod, allowing for shooting from various angles, including tilt, lift, and rotation.
(3) Rock mechanics test system.
The rock mechanics test system type used is MRT-201, consisting of a vertical hydraulic cylinder, a triaxial test device, a triaxial pressure source, and a data acquisition system. The main parameters are listed in Table 1.

3. Results and Discussion

3.1. Macroscopic Damage Characteristics of Fractured Granite under Freeze–Thaw Cycles

Figure 3 shows the macroscopic surface changes in the fractured granite following various freeze–thaw cycles. After 40 freeze–thaw cycles, small free particles and new micro-cracks appeared on the specimen’s surface, showing no obvious damage. After 80 cycles, these cracks increased and became clearly visible. They formed a network at stress concentrations and structural weak points. Block-like peeling occurred at the specimen’s edges and the tips of prefabricated cracks. Fractured granite exhibits more pronounced damage compared with intact granite. Figure 4 shows the granite slices after different freeze–thaw cycles, indicating that internal damage in the granite continues to accumulate and the pore structure becomes increasingly developed.
The morphology of the fracture surface around pre-existing cracks in the granite was observed using a scanning electron microscope (SEM) after various freeze–thaw cycles. The SEM image with zero freeze–thaw cycles shows complete and smooth granite crystals with only a few primary cracks, as depicted in Figure 5a. After 40 freeze–thaw cycles, surface cracks begin to form on the granite crystals and the number of transgranular cracks increases significantly, accompanied by some fine crystal exfoliation, as illustrated in Figure 5b. After 80 freeze–thaw cycles, the crystals undergo further cracking, with transgranular cracks expanding, gradually developing, and connecting. The crystal surface becomes rough, accompanied by the exfoliation of large crystals, as depicted in Figure 5c.
After the freeze–thaw cycle, both the mass and longitudinal wave velocity of the sample progressively decrease (Figure 6). This indicates that after the saturated freeze–thaw cycle, the surface cuttings of the double-fractured granite exfoliate, and internal pores continuously develop because of frost heave force. Consequently, the degree of damage gradually increases, resulting in a macroscopic decrease in both the sample’s mass and longitudinal wave velocity. The freeze–thaw process induces a “liquid–solid” phase transition, which weakens the original pore structure of rocks and leads to the accumulation of meso-damage. The presence of prefabricated cracks induces stress concentration, thereby accelerating the rock damage process.

3.2. NMR T2 Spectrum and Pore Distribution Structure Analysis

The NMR transverse relaxation time (T2) reflects changes in the rock pore structure [48,49]. In this study, granite pore size distribution is categorized into three types as follows: micropore (r < 10 μm), mesopore (10 μm ≤ r < 100 μm), and macropore (r ≥100 μm). Figure 7a presents the T2 curve of the sample after various freeze–thaw cycles. From left to right, two main peaks appear in the curve, representing micropores and mesopores. The area of the second peak accounts for over 85%. As the number of freeze–thaw cycles increases, the T2 curves shift to the right, and the peak value of the second wave increases by 11.11% and 22.61%, respectively. After 80 freeze–thaw cycles, a third peak appears, but its amplitude is weaker than that of the first and second peaks. The proportion of micropores and mesopores gradually decreases, while the proportion of macropores gradually increases. After 80 freeze–thaw cycles, additional macropores appear (Figure 7b).
Figure 8 shows the NMR T2 curves of fractured granite before and after fatigue load failure. After failure, the T2 curves shift to the right, and the spectral areas increase by 101.3%, 61.7%, and 80.7%. The curves for 40 and 80 freeze–thaw cycles change from a two-peak to a three-peak structure, and the signal amplitudes of the peaks increase significantly. This indicates that the internal pores of the fractured granite, after freeze–thaw cycles, continuously initiate, develop, and connect during the fatigue load failure process, forming additional macropores and penetrating cracks, ultimately leading to the sample’s failure.
According to fractal theory, if the internal pores of rocks are assumed to be composed of a series of capillary bundles, their fractal dimension can be characterized by the NMR T2 transverse relaxation time and volume fraction [50]. The fractal dimensions of the three pore types in granite are shown in Table 2. The freeze–thaw cycle alters the pore size distribution range of granite at different scales. As the number of freeze–thaw cycles increases, the fractal dimension of small and medium pores decreases, while that of large pores gradually increases (Figure 9). This indicates that the proportion of medium and small pores in granite gradually decreases, whereas the proportion of large pores gradually increases. The freeze–thaw process promotes the development of micropores in granite, significantly deteriorating its microstructure.

3.3. Mechanical Property Analysis

Figure 10a shows the fatigue load stress–strain curves of the fractured granite after freeze–thaw cycles. The curves exhibit a “sparse–dense–sparse” pattern, and the cyclic load test can be divided into three stages. Stage 1: In the initial deformation stage (the first loading cycle), the axial stress increases suddenly, and the area of the hysteresis loop is larger and then gradually stabilizes. Stage 2: In the constant velocity deformation stage, the hysteresis loop area is small, and the overlapping area between successive hysteresis loops is large, indicating that the specimen is being slowly and irreversibly damaged. Stage 3: In the accelerated deformation stage, the area of the hysteresis loop gradually increases, the distance between hysteresis loops expands, and the overlapping area continuously decreases until the specimen becomes unstable and fails. This indicates that the irreversible damage of the specimen gradually expands, leading to instability and failure when the fatigue limit is reached.
The damage caused by freeze–thaw cycles is reflected both in the reduction in peak strength and decreased fatigue resistance. After 0, 40, and 80 freeze–thaw cycles, the fatigue life of the specimen is 498, 21, and 5 cycles, respectively. The curve of fatigue life versus the number of freeze–thaw cycles is plotted and fitted, as shown in Figure 10b. The relationship between the fatigue resistance of the specimen and the number of freeze–thaw cycles follows an exponential decline. The fitting equation, as shown in Formula (1), has an R2 of 0.99, indicating a strong correlation between the test data and the fitting results.
N t = N 0 + A × 1 exp F t B
where N t is the number of fatigue loads the rock can withstand, F t is the number of freeze–thaw cycles the rock undergoes, N 0 is the number of fatigue loads the rock can withstand without freeze–thaw cycles, and A and B are undetermined parameters.

3.4. Analysis of Damage and the Failure Mechanism under Freeze–Thaw and Fatigue Load

The mechanism of rock damage caused by freeze–thaw cycles is illustrated in Figure 11. During geological processes, natural rocks develop initial damage, such as joints and fissures. In the saturated state, these internal pore structures determine the extent of damage in rocks after freeze–thaw cycles. Water in the primary pores extends into secondary pores. The volume expansion of this free water after the “liquid–solid” phase transition causes significant additional stress. When the expansion stress exceeds the rock’s tensile strength, the original pore walls are destroyed, leading to new pore structures. The expanded pores then absorb water and become saturated again, starting a new freeze–thaw cycle, which further weakens the rock’s pore structure. Through repeated freeze–thaw cycles, rock damage continues to evolve and accumulate.

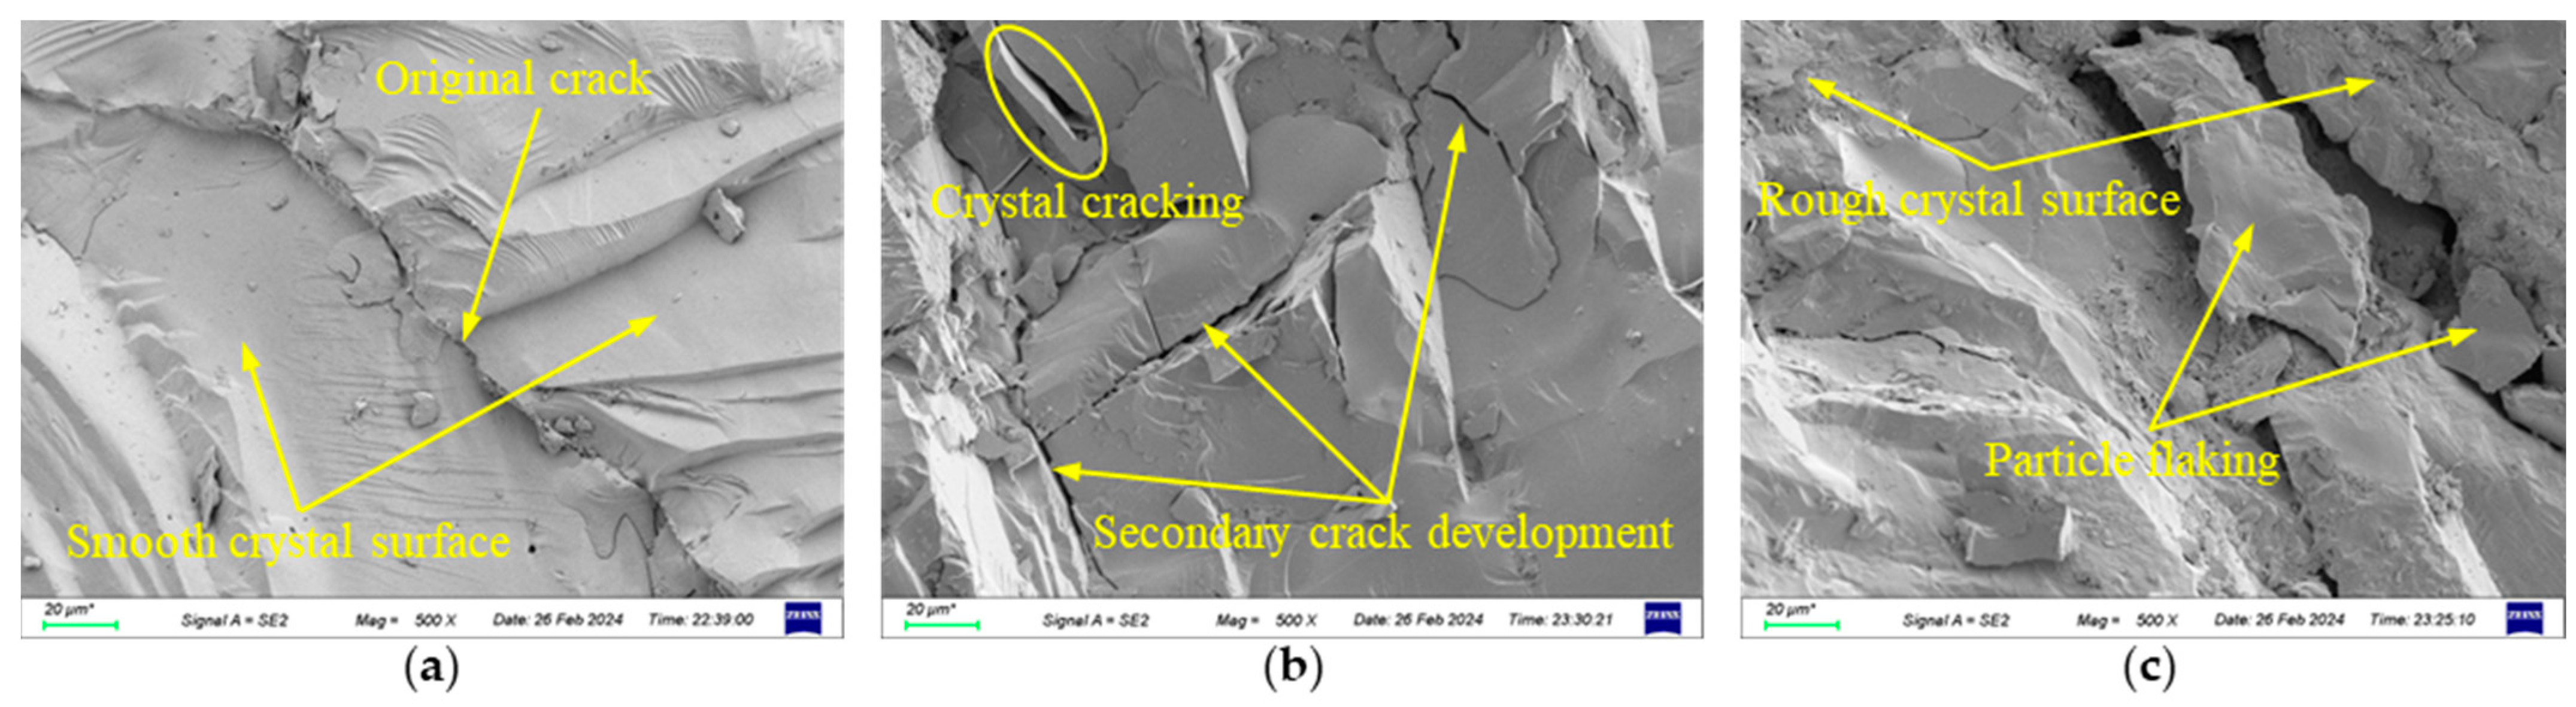
3.5. Destructive Characteristics and Crack Development Mechanism Analysis

The propagation of new cracks at the tips of prefabricated cracks mainly includes the following two forms: wing cracks and secondary cracks (Figure 12). Wing cracks are initiated by tension and are classified as tensile cracks. Secondary cracks are formed by coplanar shear of prefabricated cracks and are classified as shear cracks. Anti-wing cracks often form under combined tensile–shear or compression–shear stresses. As the rock sample approaches its peak strength, anti-wing cracks appear at or near the tip of the prefabricated macro-crack and rapidly expand. The failure mode is dominated by anti-wing cracks [51,52,53,54].
Figure 13a shows the specimen after zero freeze–thaw cycles. Cracks WC-1 and AWC-1 first form at the tip of the prefabricated crack, followed by connected WC-2 cracks. With the increasing number of cyclic loads, downward crack AWC-2 and crack SC-1 along the direction of the prefabricated crack form. Eventually, the specimen becomes destabilized and fails. Figure 13b shows the specimen after 40 freeze–thaw cycles. First, connected crack WC-1 forms at the tip of the two prefabricated cracks, followed by cracks WC-2 and AWC-1. Crack SC-1 forms along the upper crack tip, extending to the top of the crack. With the increasing number of cyclic loads, crack SC-2 forms from top to bottom, and eventually, the specimen becomes destabilized and fails. Figure 13c shows the specimen after 80 freeze–thaw cycles. First, connected crack WC-1, crack AWC-1, and crack SC-1 simultaneously form at the tips of the two prefabricated cracks. Next, crack AWC-2 forms at the tip of the upper prefabricated crack, and a new crack, SC-2 develops in the middle, continuing to extend. With the increasing number of cyclic loads, AWC-3 cracks form at the tips of the upper prefabricated cracks, continuously extending and developing to produce SC-3 cracks. Eventually, the specimen becomes destabilized and fails.
Figure 13 shows that the fractured granite is suddenly destroyed under periodic loading, accompanied by particle and block ejections, exhibiting characteristics of sudden and burst failure. As the number of freeze–thaw cycles increases, the extent of specimen failure gradually diminishes, and the rock block ejection weakens. This indicates that freeze–thaw cycles weaken the internal structure of the specimen, reduce the bearing capacity and energy storage capacity of the granite, and make its fracture surface more complex.

4. Damage Constitutive Model of Fractured Granite under the Combined Action of Freeze–Thaw and Fatigue Load

4.1. Definition of Damage Variable

4.1.1. Definition of the Macroscopic Fracture Damage Variable

The presence of prefabricated open cracks increases the additional strain energy in the rock mass. The damage variable of fractured rock can be defined by the strain release energy criterion [55,56]. According to the far-field stress component of prefabricated cracks (Equation (2)), there is no interaction force among the open cracks. The fracture stress intensity factor under uniaxial action ( σ 2 = σ 3 = 0 ) can be obtained as shown in Equation (3):
σ x = σ 1 sin 2 α τ = 1 2 σ sin 2 α σ y = σ 1 cos 2 α
K I = σ 1 π a cos 2 α K II = σ 1 π a sin 2 α 2
where KI and KII are the stress intensity factors for type I and type II cracks, respectively, a is the half-length of the prefabricated fissure, σ 1 is the axial stress, α is a constant, α = 2 sin φ 3 ( 3 sin φ ) , and φ is the internal friction angle of the rock.
In the plane stress state, the additional elastic strain energy increment U1 caused by a single prefabricated crack at the center can be calculated using Equation (4):
U 1 = 0 A G d A = 1 μ 2 E 0 A K I 2 + K II 2 d A
where A is the area of the prefabricated crack, μ is the Poisson’s ratio of the granite sample, and E is the elastic modulus of the granite sample.
According to damage mechanics theory, the damage variable is defined as D , and the complete sample is defined as undamaged. Then, under uniaxial compression, the elastic strain energy per unit volume of fractured rock is given by:
Y = σ 1 2 2 E ( 1 D ) 2
Let U E denote the elastic strain energy per unit volume corresponding to the stress under uniaxial compression, which can be expressed as:
U E = ( 1 D ) Y
Putting Equation (5) into Equation (6), we obtain:
U E = σ 1 2 2 E ( 1 D )
Therefore, under uniaxial compressive stress ( σ 1 ), the strain energy per unit volume of intact rock is given by Formula (8), and that of fractured rock is given by Formula (9):
U E 0 = σ 1 2 2 E
U E d = σ 1 2 2 E 1 D
where E 0 is the elastic modulus of the intact rock sample and E d is the elastic modulus of the fractured rock sample.
Assuming the volume of the rock sample is V, the change in elastic strain energy per unit volume caused by the crack is given by Equation 10. If only the initial damage caused by the crack is considered, the change in elastic strain energy should conform to Equation (11):
Δ U E = V U E d U E 0 = V σ 1 2 2 E ( 1 D ) σ 1 2 2 E
U 1 = Δ U E , 1 μ 2 E 0 A K I 2 + K II 2 d A = V σ 1 2 2 E ( 1 D ) σ 1 2 2 E
Therefore, we have:
D = 1 1 1 + 2 ( 1 μ 2 ) 0 A K I 2 + K II 2 d A V E
Because of the complex fracture surface topography of real rock, the following assumptions should be made when studying the initial damage caused by prefabricated cracks:
(1) Assume that the surface of the prefabricated crack in the rock sample is flat and simplify its shape to a planar rectangle.
(2) Assume that the force on the prefabricated crack surface is uniformly distributed.
(3) Assume that the prefabricated fractured rock sample is an elastomer with initial damage, and ignore the dissipation of plastic strain energy, thermal energy, and kinetic energy.
Based on the above assumptions, if D f is the damage variable of the prefabricated double-fissured rock, the additional elastic strain energy increment U f caused by the double fissures can be expressed by Equation (13). By combining Equations (10) and (11), the general expression for D f is given by Equation (14):
U f = U f 1 + U f 2 = 0 A 1 G 1 d A 1 + 0 A 2 G 2 d A 2
D f = 1 1 1 + 2 E U 1 V σ 2 = 1 1 1 + 2 E V σ 2 0 A 1 G 1 d A 1 + 0 A 2 G 2 d A 2
where A 1 and A 2 represent the total areas of the first and second cracks, respectively, while G 1 and G 2 represent their energy release rates.
According to Betti’s energy reciprocity law, the relationship between the elastic strain energy U E 0 of the intact rock sample and the elastic strain energy U E d of the prefabricated macroscopic fractured rock sample is given by:
U E 0 = U E d Δ U E U E 0 = V σ 1 2 2 E 0 U E d = V σ 1 2 2 E d σ 1 2 2 E ( 1 D f )
According to the theory of fracture mechanics, the additional strain energy caused by a crack with a length of 2a in the rock sample is given by:
Δ U E = 2 1 μ 0 2 E 0 a K I 2 + K II 2 d a
where μ 0 is the Poisson’s ratio of the intact rock sample.
The additional strain energy caused by parallel double fissures is 2 Δ U E . The damage variable for parallel double fissures can be obtained by introducing Equation (4) and combining it with Equations (2) and (3). The general expression of the damage variable for parallel double fissures is as follows:
D f = 1 1 1 + 4 π a 2 1 μ 0 2 sec π a W r V cos 2 α 0.5 w / a sin 2 α 2 + 0.25 sin 2 2 α
where W r represents the width of the sample, while w represents the crack width.

4.1.2. Definition of the Damage Variable under Uniaxial Load

The concept of micro-element strength is introduced to quantitatively characterize the degree of micro-damage in rock. Assuming that the micro-element strength of the rock follows a Weibull distribution [57], the damage variable D l of granite under uniaxial compression is given by:
D l = 0 F P ( F ) d F = 1 exp F F 0 m
where F is the statistical distribution variable of the micro-element strength, while m and F 0 are undetermined parameters in the Weibull distribution.
Therefore, according to the Lemaitre strain equivalence principle, the constitutive model of rocks containing only micro-defects under uniaxial compression can be derived as follows:
σ 1 = E c ε 1 1 D l = E c ε 1 exp F F 0 m
where E c is the elastic modulus of rock at room temperature and ε 1 is the axial strain of rock at room temperature.
Based on the Drucker–Prager criterion, F it can be expressed as follows:
F = J 2 α 0 I
where α 0 is the test constant related to the internal friction angle and cohesion of the rock, α 0 = sin φ 9 + 3 sin 2 φ ; I is the first invariant of the effective stress, I = σ 1 ; J is the second invariant of the effective stress deviator, J 2 = σ 1 2 3 ; and σ 1 is the effective stress in the axial direction, σ 1 = σ 1 / 1 D l = E C ε 1 .
The expression for F can be obtained as follows:
F = E C ε 1 3 α 0 E C ε 1
Therefore, the constitutive model for granite with cracks under uniaxial load is given as follows:
σ 1 = E C ε 1 1 D l = E C ε 1 exp 1 3 α 0 E C ε 1 F 0 m
Using the extreme conditions at the peak value of the model curve, the theoretical expressions of the model parameters m and F 0 of the rock with only micro-defects under uniaxial compression can be obtained. The extreme conditions that the σ 1 ε 1 curve satisfies at the peak point are as follows:
ε 1 = ε P , σ 1 = σ P ; ② ε 1 = ε P , σ 1 ε 1 = 0 .
It can be obtained that:
F p = E C ε p 3 α 0 E C ε p
From the extreme value condition ① and Equation (19), it can be obtained that:
F p F 0 m = ln ε p E C σ p
From the extreme value condition ②, it can be obtained that:
σ 1 ε 1 = E C exp F F 0 m 1 m ε 1 F m 1 F 0 E C 3 α 0 E C = E C exp F F 0 m 1 m F p m F 0 m = 0
F 0 = F p m 1 / m
The expression for the undetermined parameters m and F 0 , obtained by combining Equations (24) and (26), is:
m = 1 ln ε p E C / σ p
F 0 = F p 1 ln ε p E C / σ p ln ε p E C / σ p

4.1.3. Definition of the Damage Variable in Freeze–Thaw Action

The initial state of fractured granite before freezing and thawing is considered as the non-damaged state. The damage and deterioration of granite caused by long-term freezing and thawing can be defined by the porosity n as its freeze–thawing damage variable D t .
D t = 1 1 n i 1 n 0
where n i is the saturated porosity of granite after different freeze–thaw cycles, while n 0 is the initial saturated porosity.
The total area of the T2 spectrum curve measured by NMR is directly proportional to the pore volume in the rock sample [58]. Assuming that the apparent volume of the rock sample remains constant, the porosity is given by:
n = V V V × 100 = C 1 S T 2 V × 100
where V V represents the pore volume of the rock sample, V is the total volume of the rock sample, C 1 is a pending parameter, and S T 2 is the total area of the T2 spectrum of the rock sample.
Under freezing–thawing conditions, the total damage effect of fractured rock under loading can be equivalent to damage under two stages of loading. The first stage is the initial damage state caused by prefabricated fractures, while the second stage is the total damage state caused by freezing and thawing loads after prefabricated cracks. Therefore, the total damage variable D g is defined as the combination of the initial damage caused by prefabricated cracks D f , the freeze–thaw cycle damage D t , and the load damage D l , based on the damage variables obtained under different conditions. The calculation formula is as follows:
D g = D f + D t + D l D f D t D f D l D t D l + D f D t D l
According to the generalized strain equivalence principle [59], the freeze–thaw damage constitutive relationship of fractured rocks under uniaxial compression can be expressed as:
σ 1 = E 0 ε 1 1 D g

4.2. Fatigue Damage Constitutive Model Based on Internal Variables

Internal variable theory was used to describe the degenerative behavior of fatigue deformation modulus [60]. Since the fatigue damage variables defined by irreversible strain seem to be ideal for reflecting the fatigue degradation of rock materials, we have:
E 0 i = P σ m i Q × ε r i C 2
where E 0 i represents the fatigue deformation modulus; σ m i represents the maximum cyclic stress; ε r i represents the irreversible axial plastic strain; footnote i denotes the i-th cycle; and P , Q , and C 2 are the undetermined coefficients of the model.
Introducing Equation (28) into Equation (27), we can derive a freeze–thaw damage fatigue constitutive model of fractured granite under uniaxial compression based on internal variables:
σ 1 i = P σ m i Q × ε r i C 2 ε 1 i 1 D g i
The undetermined coefficients P, Q, and C 2 of the model are determined using a multi-parameter fitting method. The Weibull distribution parameters m and F 0 are calculated using Equations (32) and (33). The initial value ε 1 i of the axial strain is defined as the ratio of the minimum cyclic stress to the initial tangent modulus in each cycle, while the loading modulus E l and unloading modulus E u are adopted during loading and unloading, respectively.
Additionally, to account for the crack closure stage of the rock sample during the initial loading process, a compaction coefficient R 0 is proposed to modify the fatigue model. This coefficient is defined as the ratio of the secant modulus to Young’s modulus. Thus, the constitutive model can be expressed as:
σ 1 i = R 0 P σ m i Q × ε r i C 2 ε 1 i 1 D g i

4.3. Validation of Parameters and Constitutive Models

The fatigue life of the fractured granite specimen is defined as the number of cycles it undergoes before fatigue failure. The relationship between the irreversible strain and the degree of fatigue completion (the ratio of the current number of cycles to the fatigue life) is shown in Figure 14. The irreversible strain of the specimen gradually increases after various freeze–thaw cycles. This development can be divided into three stages as follows: the initial stage, the constant velocity stage, and the accelerated stage. The constant velocity stage lasts the longest, but the accumulated strain in this stage is only three-quarters of the total.
The parameters m and F0 of the constitutive model, calculated from Equations (27) and (28), are shown in Figure 15. After various freeze–thaw cycles, the model parameters exhibit significant changes in the early stages and tend to stabilize later. However, as the number of freeze–thaw cycles increases, the range of these parameters gradually decreases. This indicates that the parameters of the fatigue constitutive model reflect the impact of freeze–thaw cycles on rock damage.
Figure 16 shows the measured and theoretical values of the first fatigue load, 40% fatigue life, and 100% fatigue life of the double-fracture granite specimen under uniaxial fatigue load after various freeze–thaw cycles. The established fatigue constitutive model accurately reproduces the test results at various stages. As the number of cyclic loads increases, the range of hysteretic cycles in the stress–strain curves gradually increases. The model also reflects the strength state and structural effects of fractured rocks under cyclic loads, fully proving the validity of the defined damage variables, model parameters, and constitutive model.

5. Conclusions

(1)
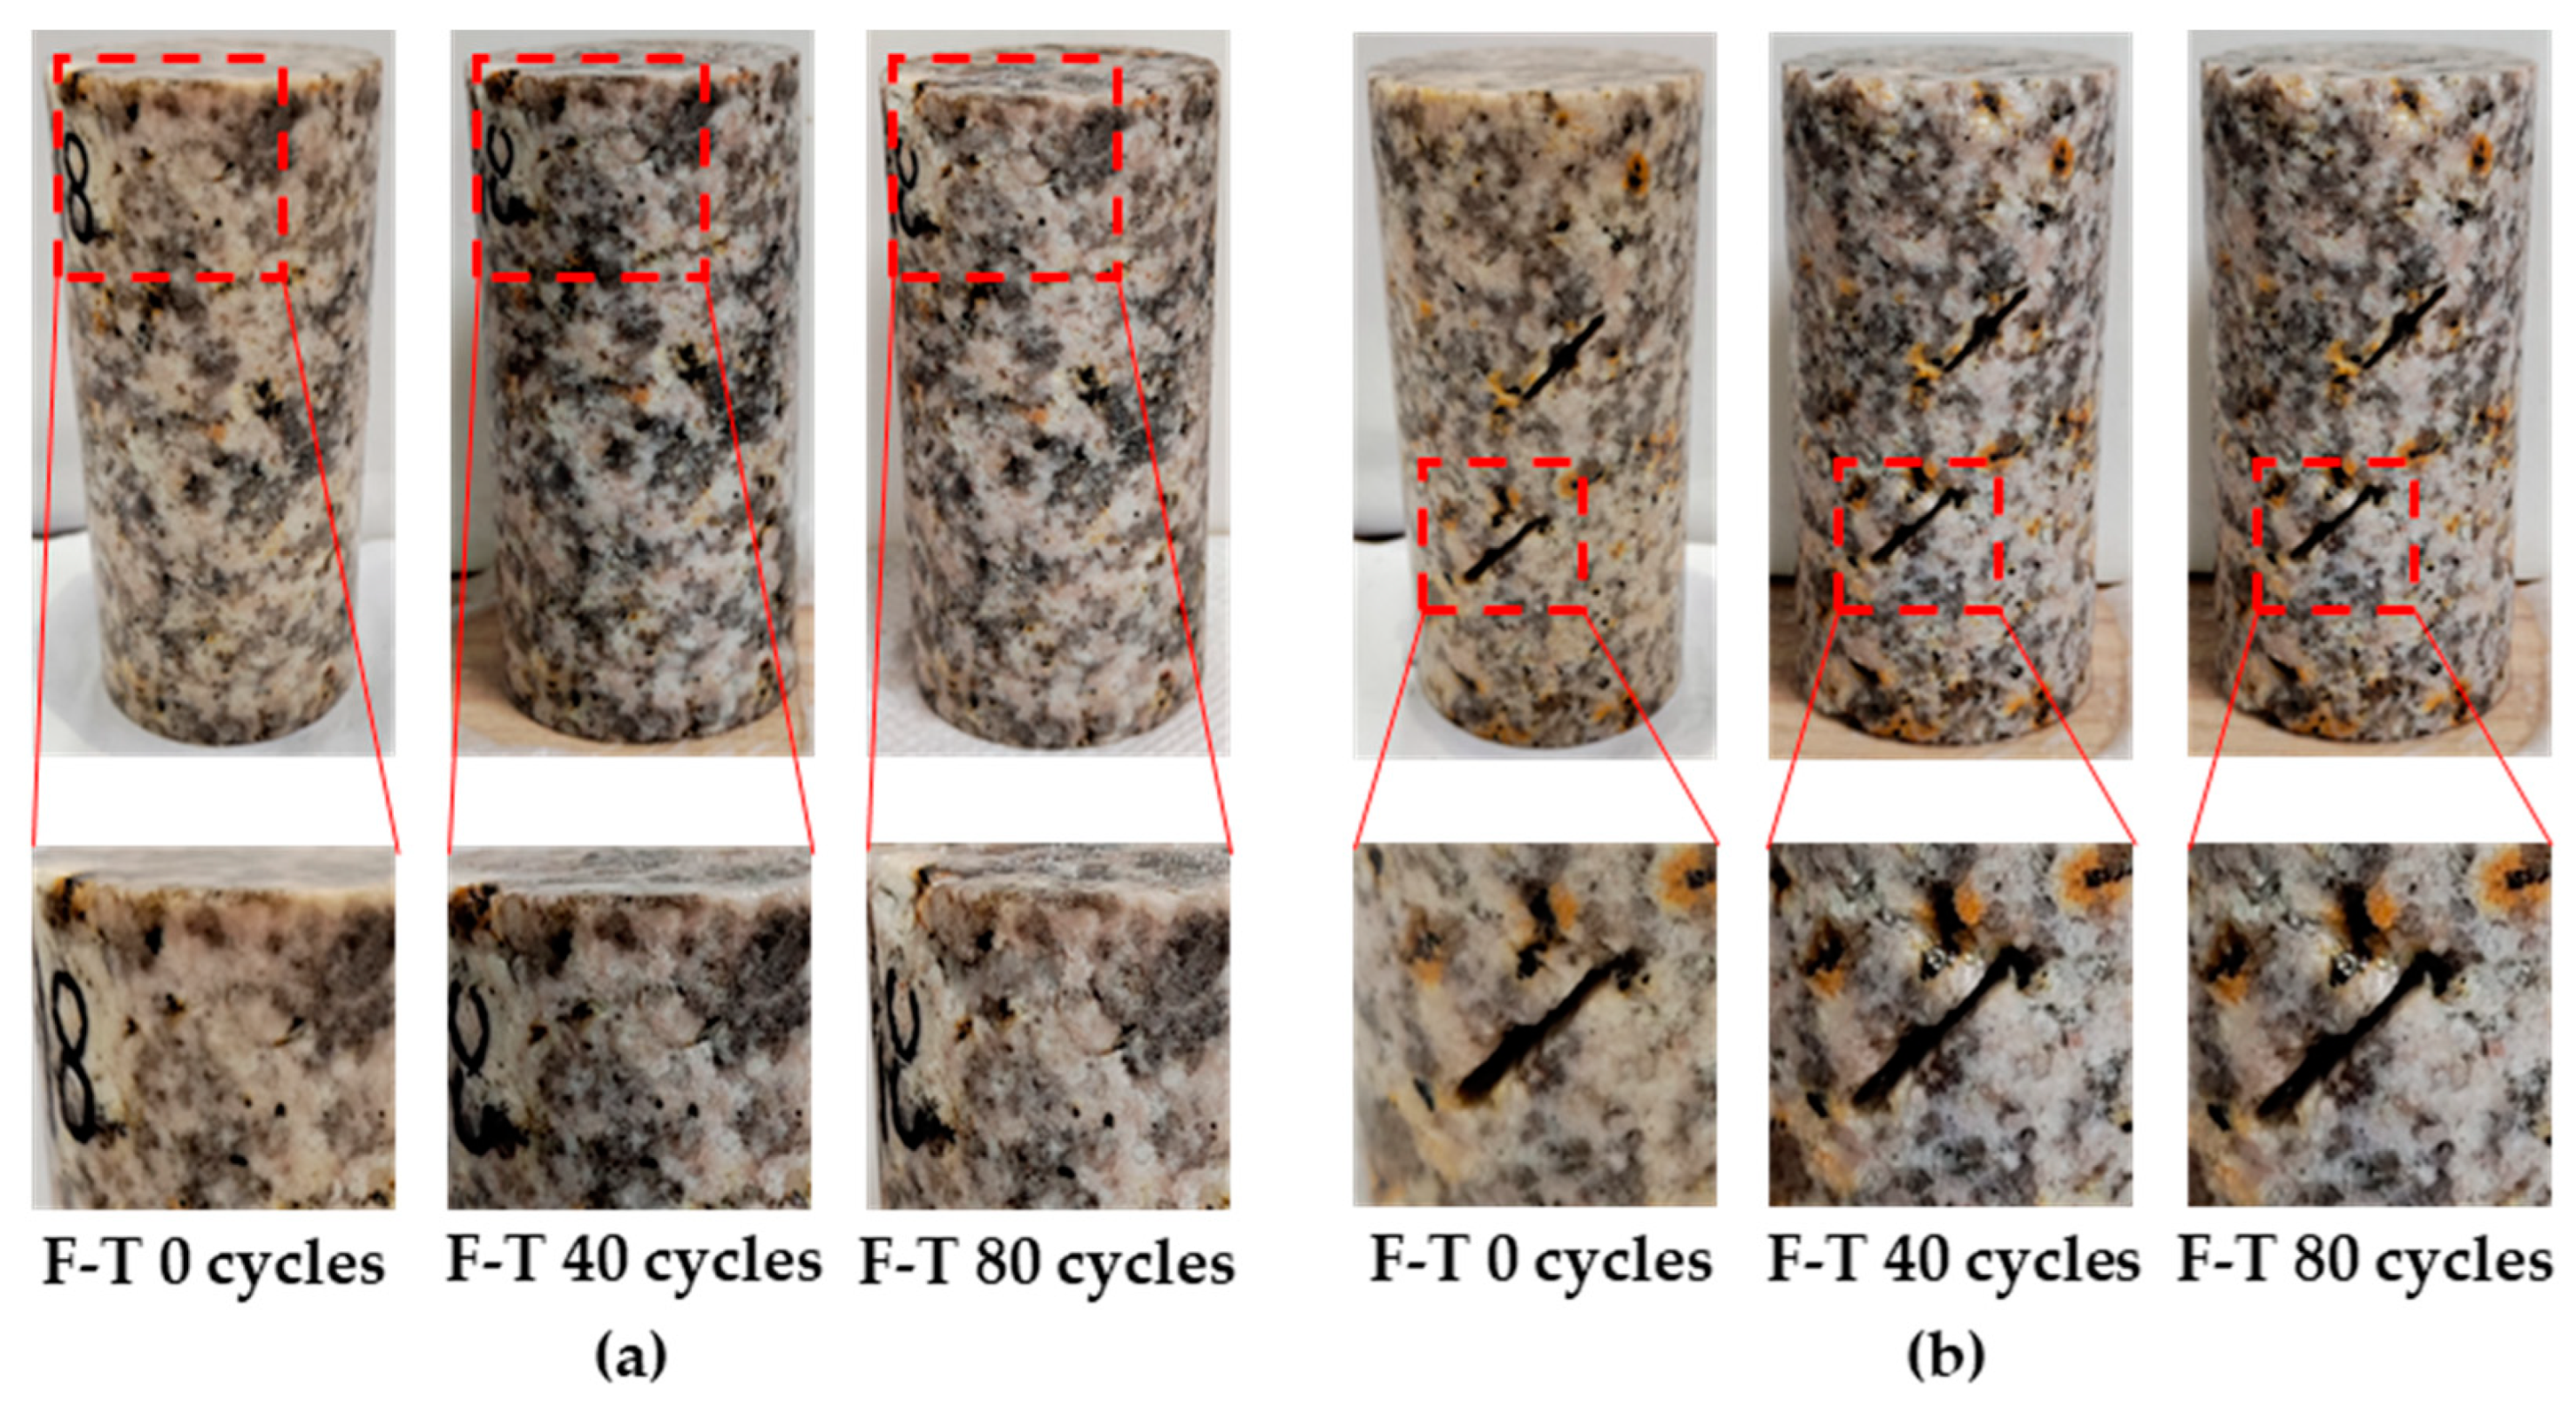
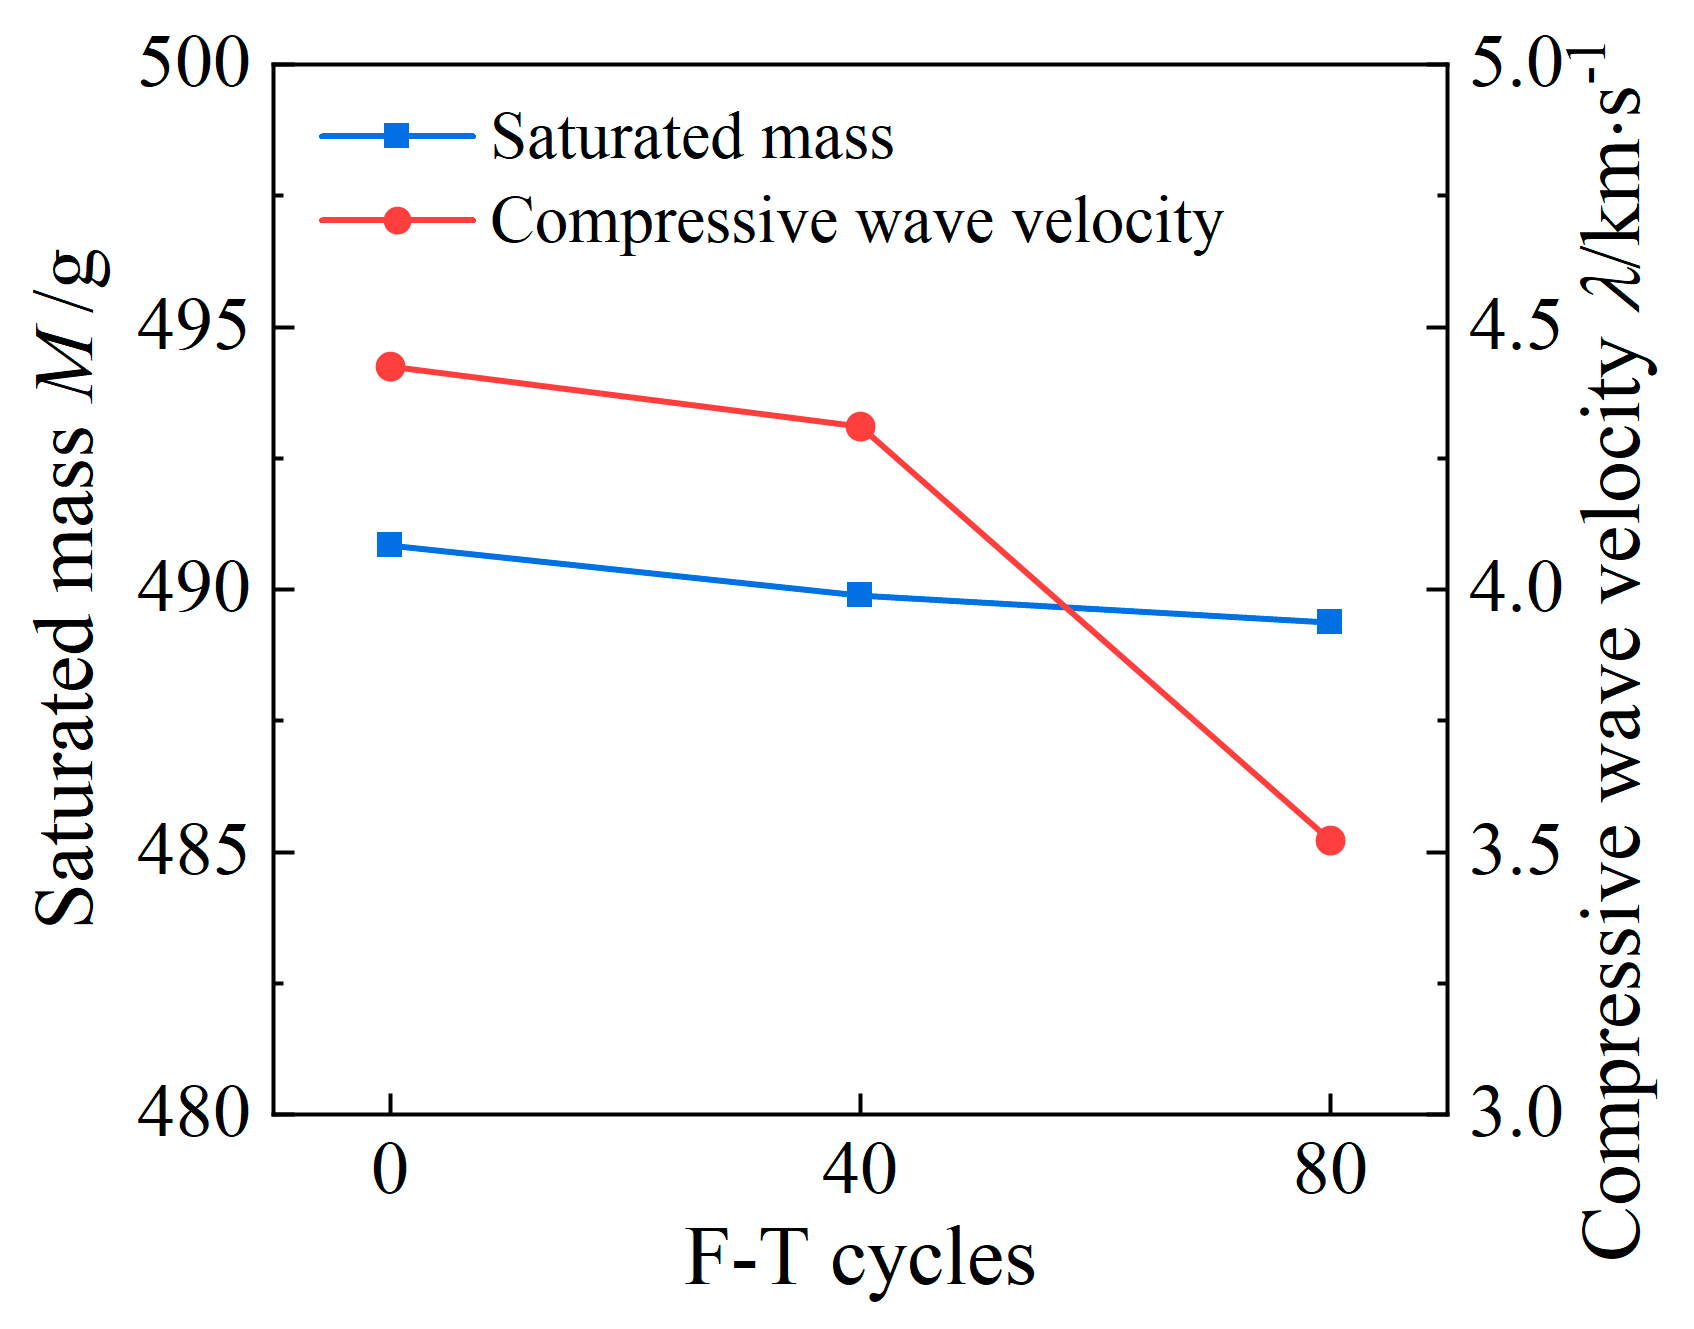
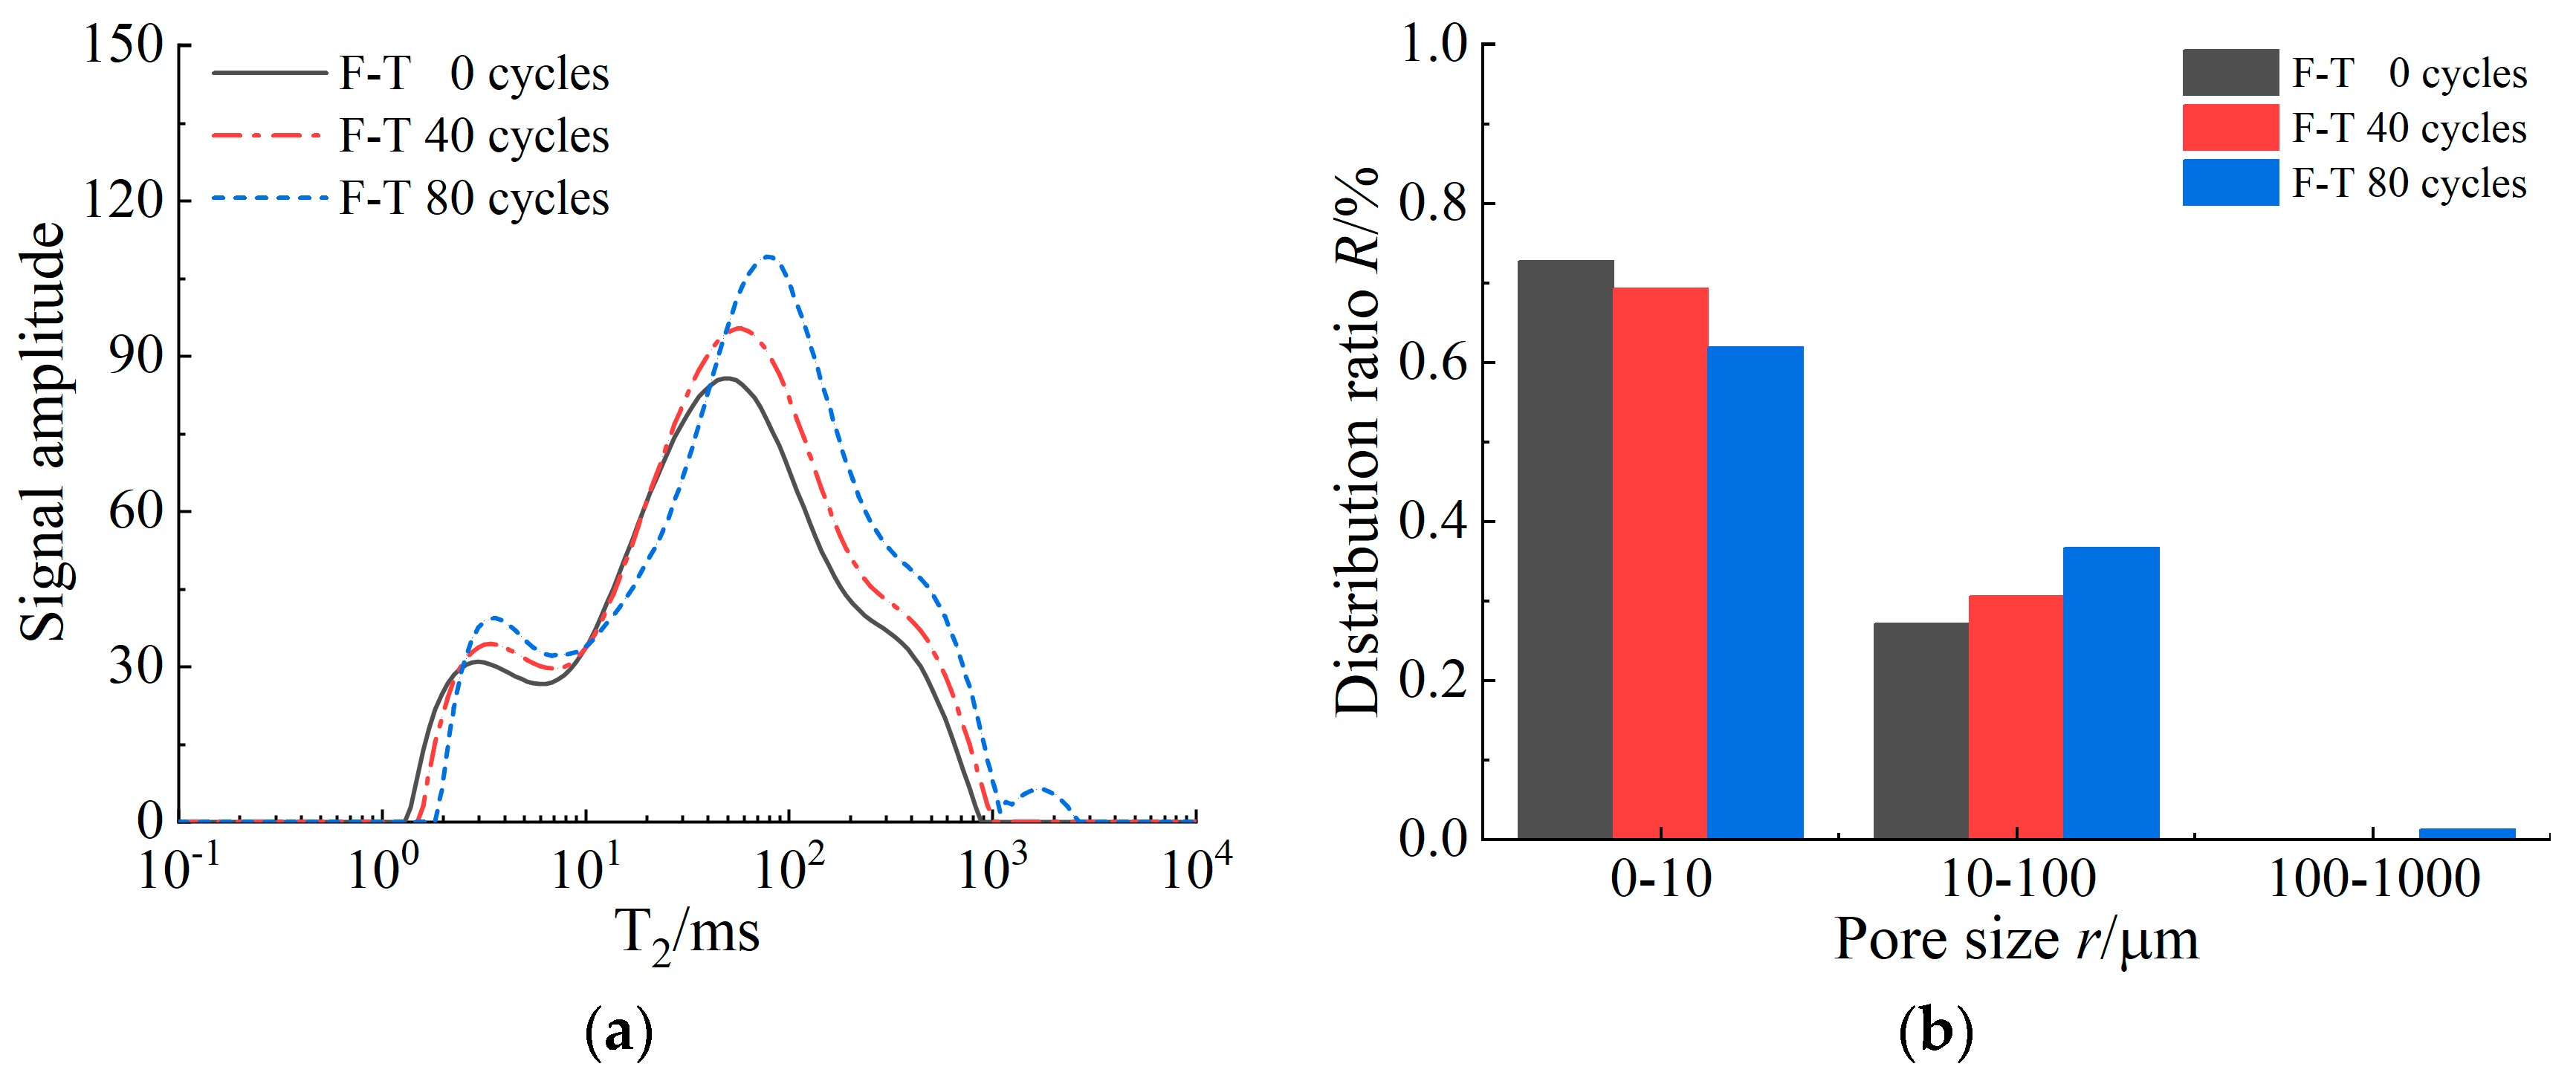
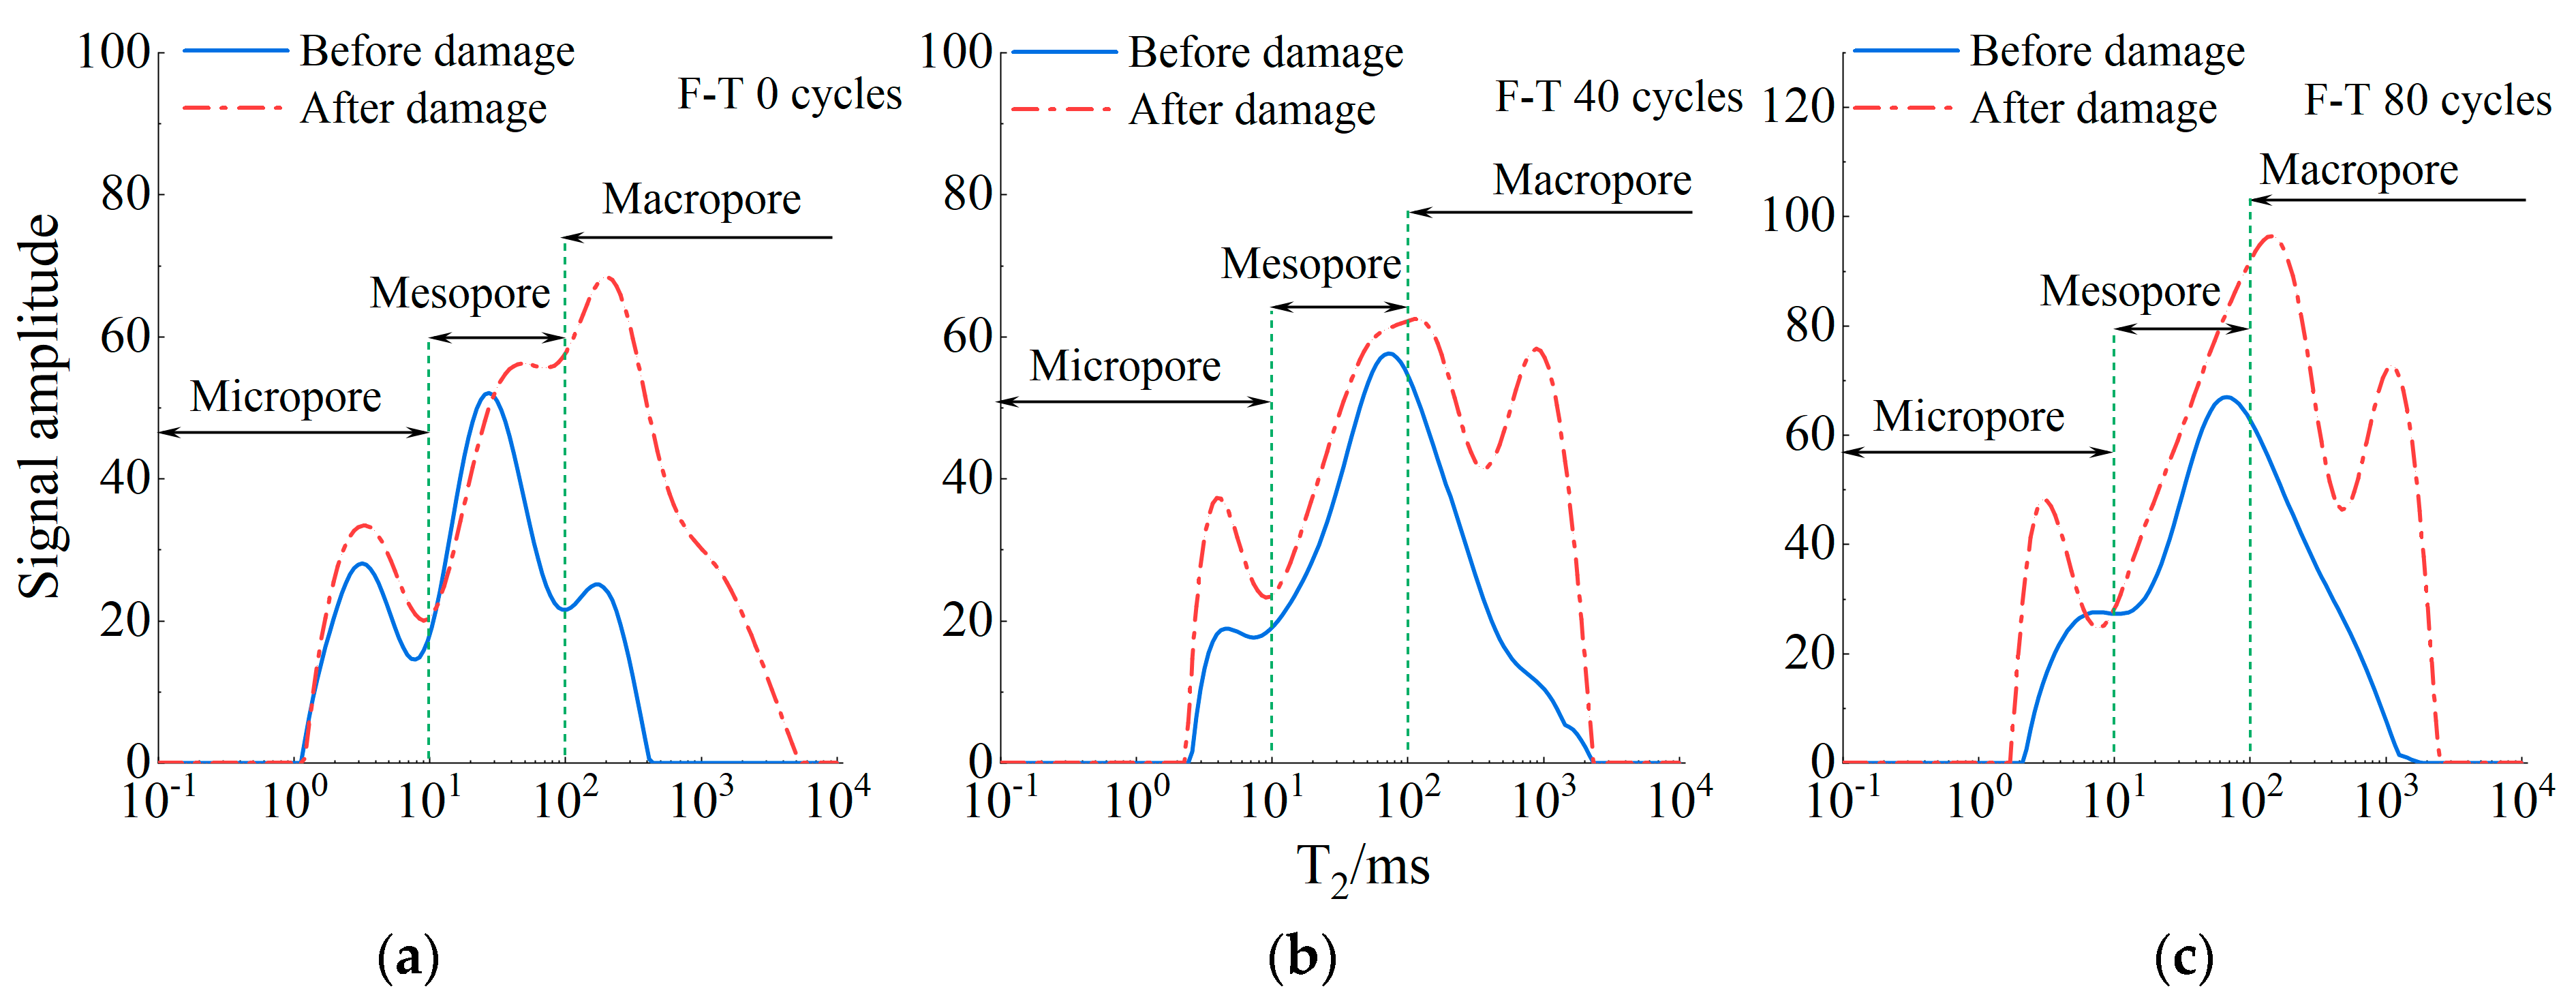
Prefabricated cracks increase stress concentration in granite during freeze–thaw cycles, promoting freeze–thaw damage accumulation. After these cycles, the saturated mass and longitudinal wave velocity of cracked granite gradually decrease. Network micro-cracks and block-like spalling develop around the prefabricated cracks. The NMR T2 spectrum of the sample showed a three-peak distribution, with the second peak area accounting for more than 85%. After freezing and thawing, the peaks of the second wave of T2 spectral curves increased by 11.11% and 22.61%, respectively. The T2 spectrum of the fractured granite shifts significantly to the right after fatigue load failure, and the amplitude of the third peak increases notably.
(2)
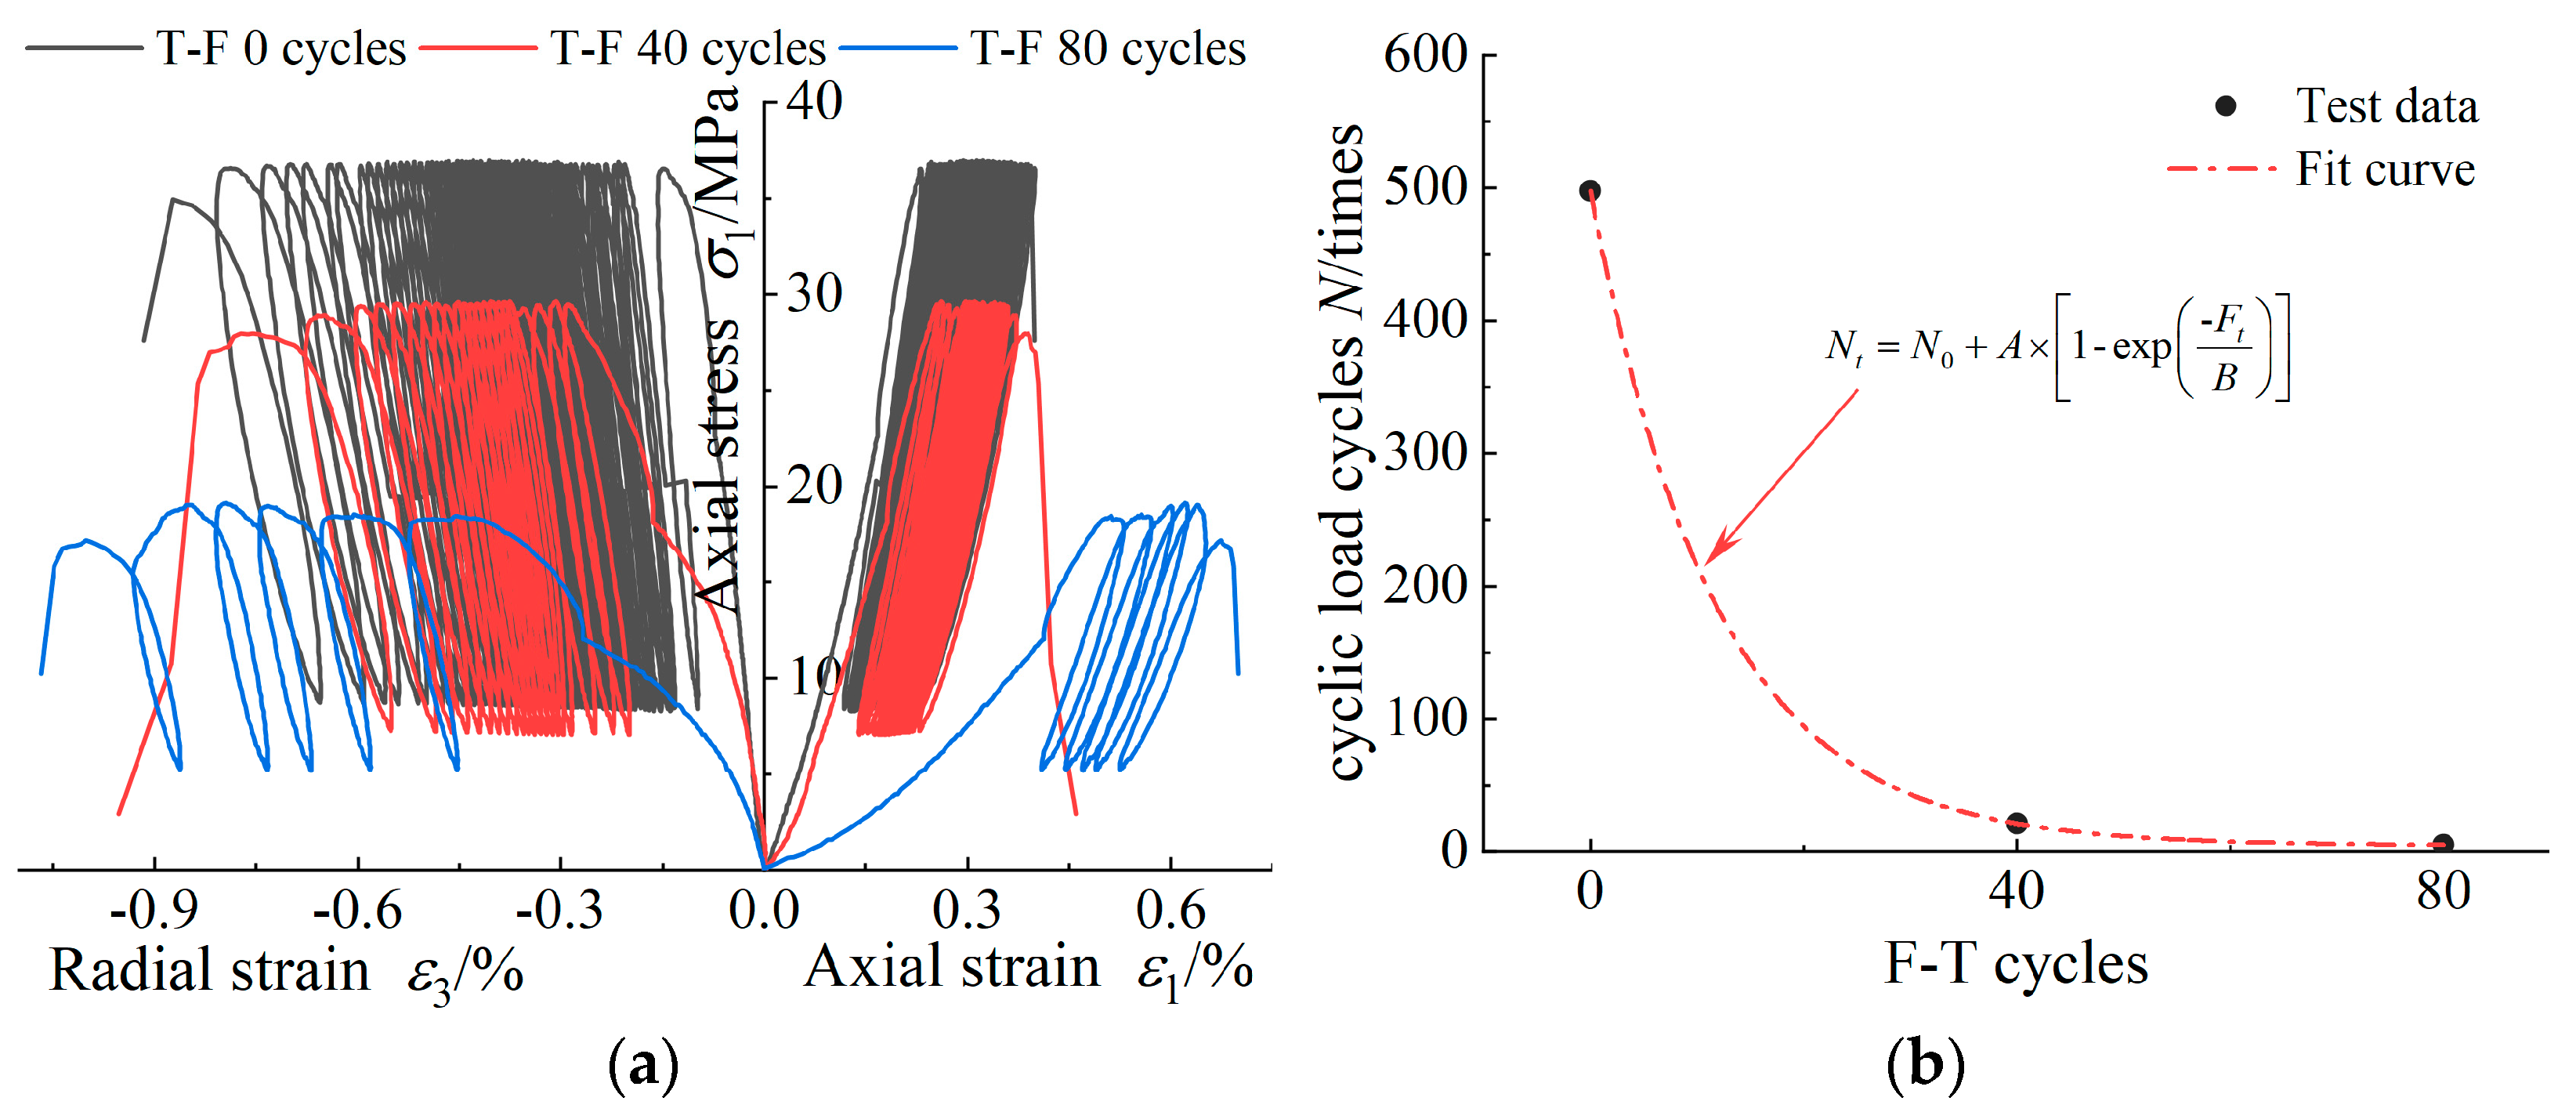
Under fatigue load, the damage to the granite samples without freeze–thaw cycles is sudden and explosive. After freeze–thaw cycles, the failure of the granite specimens becomes more gradual. With an increasing number of freeze–thaw cycles, the granite samples endured 498, 21, and 5 loading cycles, respectively, demonstrating an exponential decrease in fatigue resistance. Freeze–thaw cycles weaken the internal structure of granite, reducing its bearing and energy storage capacities, but making the failure patterns more complex.
(3)
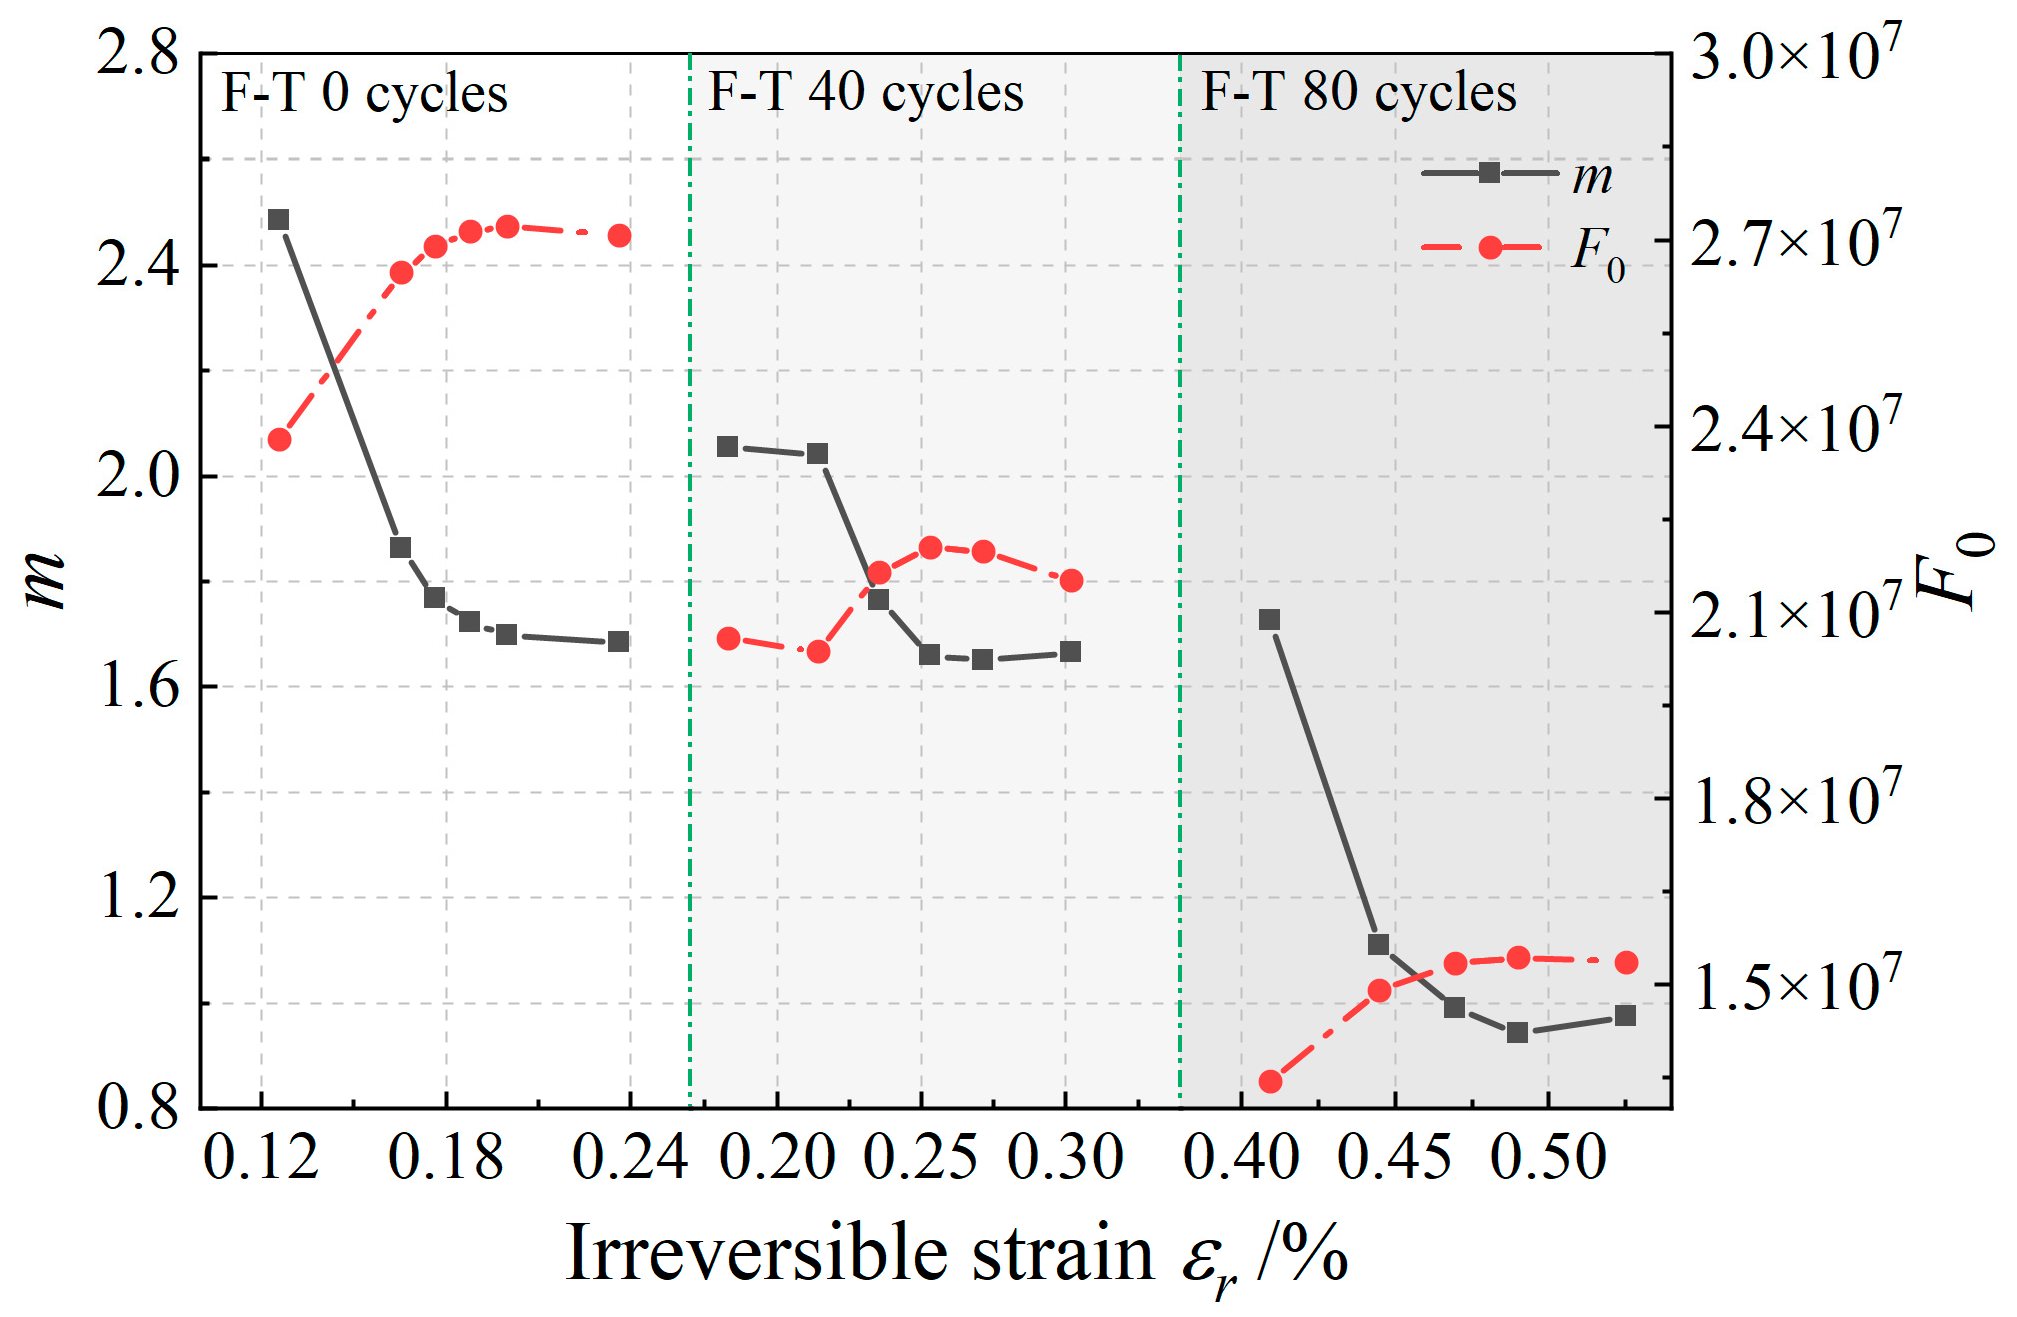
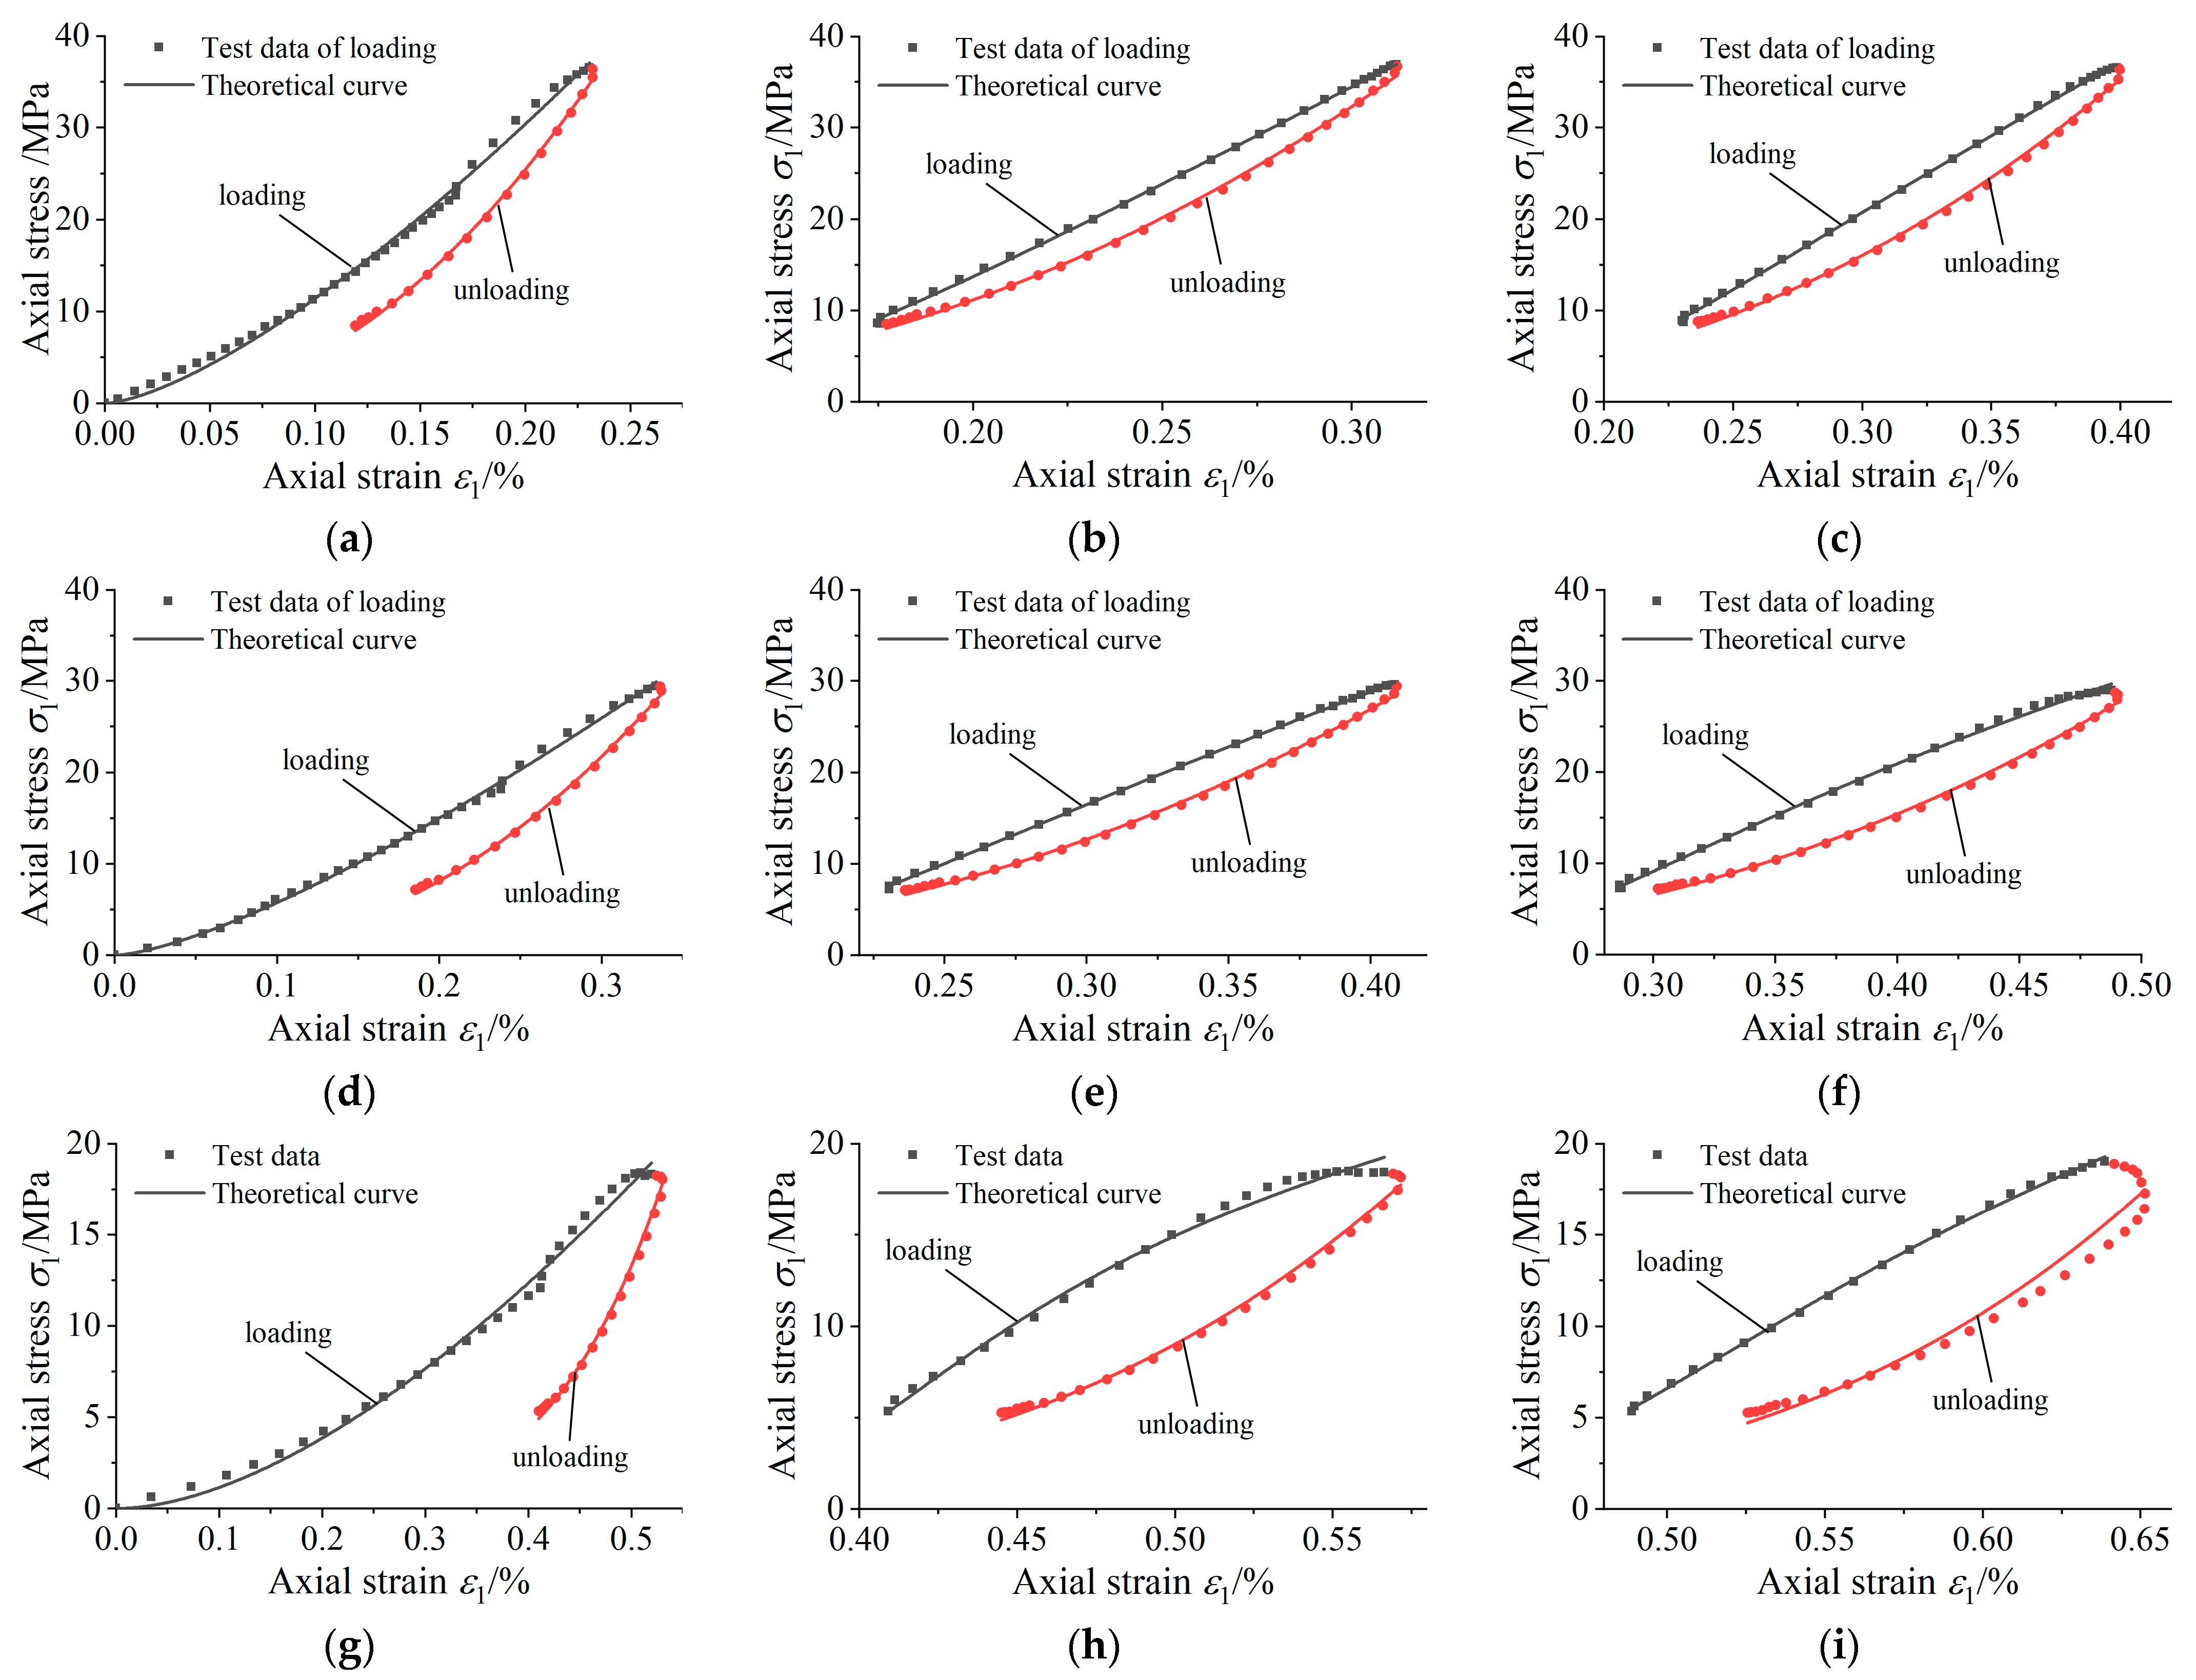
By integrating the irreversible strain evolution model, a fatigue damage constitutive model for fractured granite, encompassing initial fracture damage, freeze–thaw damage, and load damage, is established. This model effectively accounts for the combined effects of freeze–thaw cycles and fatigue load on fractured granite. The theoretical curves align well with experimental data, demonstrating good applicability.
This study performed freeze–thaw cycle tests, SEM scanning, nuclear magnetic resonance tests, and cyclic load fatigue tests on fissured granite. The evolution of the multi-scale structure of fractured granite under the combined effects of freeze–thaw cycles (0, 40, and 80 cycles) and cyclic loading was investigated. This study’s findings highlight the critical impact of combined F-T cycles and fatigue loading on granite’s structural integrity, providing a basis for improved predictive models in engineering. However, this study has certain limitations. For example, the fracture angle, length, and periodic loading parameters of the samples lack diversity. In addition to laboratory experiments, numerical simulation is also an effective method to reproduce the fracture mechanism of rocks [61,62]. Therefore, future research should integrate various influencing factors, test methods, and analysis techniques to further study the mechanics of frozen and thawed rocks in cold regions.

Author Contributions

Conceptualization, M.Y. and J.R.; methodology, L.Z. and C.S.; validation, J.R. and Y.S.; formal analysis, M.Y., C.S. and P.C.; investigation, M.Y. and L.Z.; resources, C.S. and X.C.; data curation, J.R. and Y.S.; writing—original draft preparation, M.Y., P.C. and X.C.; writing—review and editing, M.Y. and J.R.; visualization, L.Z. and C.S.; funding acquisition, J.R. All authors have read and agreed to the published version of the manuscript..

Funding

This research was funded by the National Natural Science Foundation of China, grant number 12072259, 42377187, the China Postdoctoral Science Foundation, grant number 2022MD723831, and the Shaanxi Provincial Natural Science Basic Research Program, grant number 2024JC-YBQN-0029.

Institutional Review Board Statement

Not applicable.

Informed Consent Statement

Not applicable.

Data Availability Statement

The data presented in this study are available on request from the corresponding author.

Conflicts of Interest

The authors declare no conflicts of interest.

References

  1. Li, X.F.; Fu, Z.; Wang, H.L. Quantitative method for freezing-thawing environment of concrete in Qinghai-Tibet plateau. Trans. Chin. Soc. Agric. Eng. 2018, 34, 169–175. [Google Scholar]
  2. Yu, W.B.; Zhang, T.Q.; Lu, Y.; Han, F.L.; Zhou, Y.F.; Hu, D. Engineering risk analysis in cold regions: State of the art and perspectives. Cold Reg. Sci. Technol. 2020, 171, 102963. [Google Scholar] [CrossRef]
  3. Zhang, X.F.; Lai, Y.M.; Yu, W.B.; Zhang, S.J. Non-linear analysis for the freezing–thawing situation of the rock surrounding the tunnel in cold regions under the conditions of different construction seasons, initial temperatures and insulations. Tunn. Undergr. Space Technol. 2002, 17, 315–325. [Google Scholar] [CrossRef]
  4. Tan, X.; Chen, W.; Yang, D.; Dai, Y.; Wu, G.; Yang, J.; Yu, H.; Tian, H.; Zhao, W. Study on the influence of airflow on the temperature of the surrounding rock in a cold region tunnel and its application to insulation layer design. Appl. Therm. Eng. 2014, 67, 320–334. [Google Scholar] [CrossRef]
  5. Luo, L.; Ma, W.; Zhang, Z.; Zhuang, Y.; Zhang, Y.; Yang, J.; Cao, X.; Liang, S.; Mu, Y. Freeze/Thaw-Induced Deformation Monitoring and Assessment of the Slope in Permafrost Based on Terrestrial Laser Scanner and GNSS. Remote Sens. 2017, 9, 198. [Google Scholar] [CrossRef]
  6. Shen, Y.J.; Luo, T.; Wei, X.; Li, X.T.; Long, J.; Wen, L.D.; Peng, H.; Ji, Y.J. Mechanism Analysis of the Influence of Freeze-Thaw on the Damage and Debonding Evolution of Sandstone-Concrete Interface. Geofluids 2022, 2022, 3550597. [Google Scholar] [CrossRef]
  7. Mateos, R.M.; García-Moreno, I.; Azañón, J.M. Freeze–thaw cycles and rainfall as triggering factors of mass movements in a warm Mediterranean region: The case of the Tramuntana Range (Majorca, Spain). Landslides 2012, 9, 417–432. [Google Scholar] [CrossRef]
  8. Strunden, J.; Ehlers, T.A.; Brehm, D.; Nettesheim, M. Spatial and temporal variations in rockfall determined from TLS measurements in a deglaciated valley, Switzerland. J. Geophys. Res.-Earth. 2015, 120, 1251–1273. [Google Scholar] [CrossRef]
  9. Collins, B.D.; Stock, G.M. Rockfall triggering by cyclic thermal stressing of exfoliation fractures. Nat. Geosci. 2016, 9, 395–400. [Google Scholar] [CrossRef]
  10. Stöcke, K.; Weise, F.; Kieslinger, A.; Eissner, W.; Walz, K.; de Quervain, F. Die Prüfung der natürlichen Bausteine. In Die Prüfung Nichtmetallischer Baustoffe; Springer: Berlin/Heidelberg, Germany, 1941; pp. 138–223. [Google Scholar]
  11. Deprez, M.; De Kock, T.; De Schutter, G.; Cnudde, V. A review on freeze-thaw action and weathering of rocks. Earth-Sci. Rev. 2020, 203, 103143. [Google Scholar] [CrossRef]
  12. Steiger, M. Crystal growth in porous materials—I: The crystallization pressure of large crystals. J. Cryst. Growth 2005, 282, 455–469. [Google Scholar] [CrossRef]
  13. Bellanger, M.; Homand, F.; Remy, J.M. Water behaviour in limestones as a function of pores structure: Application to frost resistance of some Lorraine limestones. Eng. Geol. 1993, 36, 99–108. [Google Scholar] [CrossRef]
  14. Meng, F.D.; Zhai, Y.; Li, Y.B.; Zhao, R.F.; Li, Y.; Gao, H. Research on the effect of pore characteristics on the compressive properties of sandstone after freezing and thawing. Eng. Geol. 2021, 286, 106088. [Google Scholar] [CrossRef]
  15. Liu, Y.Z.; Cai, Y.T.; Huang, S.B.; Guo, Y.L.; Liu, G.F. Effect of water saturation on uniaxial compressive strength and damage degree of clay-bearing sandstone under freeze-thaw. Bull. Eng. Geol. Environ. 2020, 79, 2021–2036. [Google Scholar] [CrossRef]
  16. Che, Y.X.; Song, Y.J.; Ren, J.X.; Chen, J.X.; Guo, X.X.; Tan, H.; Hu, M.L. Creep characteristics of different saturated states of red sandstone after freeze-thaw cycles. Geofluids 2021, 2021, 6622380. [Google Scholar] [CrossRef]
  17. Huang, S.B.; Cai, Y.T.; Liu, Y.Z.; Liu, G.F. Experimental and theoretical study on frost deformation and damage of red sandstones with different water contents. Rock Mech. Rock Eng. 2021, 54, 4163–4181. [Google Scholar] [CrossRef]
  18. Ren, J.X.; Yun, M.C.; Cao, X.T.; Zhang, K.; Liang, Y.; Chen, X. Study on the mechanical properties of saturated red sandstone under freeze–thaw conditions. Environ. Earth Sci. 2022, 81, 376. [Google Scholar] [CrossRef]
  19. Wang, Y.; Gao, S.H.; Li, C.H.; Han, J.Q. Energy dissipation and damage evolution for dynamic fracture of marble subjected to freeze-thaw and multiple level compressive fatigue loading. Int. J. Fatigue 2021, 142, 105927. [Google Scholar] [CrossRef]
  20. Yahaghi, J.; Liu, H.Y.; Chan, A.; Fukuda, D. Experimental and numerical studies on failure behaviours of sandstones subject to freeze-thaw cycles. Transp. Geotech. 2021, 31, 100655. [Google Scholar] [CrossRef]
  21. Xie, Y.; Ren, J.; Caoxi, T.; Chen, X.; Yun, M. Triaxial Compression Fracture Characteristics and Constitutive Model of Frozen–Thawed Fissured Quasi-Sandstone. Appl. Sci. 2022, 12, 6454. [Google Scholar] [CrossRef]
  22. Zhang, J.; Deng, H.G.; Taheri, A.; Ke, B.; Liu, C.J.; Yang, X.R. Degradation of physical and mechanical properties of sandstone subjected to freeze-thaw cycles and chemical erosion. Cold Reg. Sci. Technol. 2018, 155, 37–46. [Google Scholar] [CrossRef]
  23. Qu, D.X.; Li, D.K.; Li, X.P.; Yi, L.U.O.; Xu, K. Damage evolution mechanism and constitutive model of freeze-thaw yellow sandstone in acidic environment. Cold Reg. Sci. Technol. 2018, 155, 174–183. [Google Scholar] [CrossRef]
  24. Liu, B.; Ma, Y.J.; Liu, N.; Han, Y.H.; Li, D.Y.; Deng, H.L. Investigation of pore structure changes in Mesozoic water-rich sandstone induced by freeze-thaw process under different confining pressures using digital rock technology. Cold Reg. Sci. Technol. 2019, 161, 137–149. [Google Scholar] [CrossRef]
  25. Liu, B.; Ma, Y.J.; Sheng, H.L. Experiments on mechanical properties of Cretaceous red sandstone after freeze-thaw process. Rock Soil Mech. 2019, 40 (Suppl. S1), 161–171. [Google Scholar]
  26. Huang, S.B.; Liu, Q.S.; Cheng, A.; Liu, Y.Z. A statistical damage constitutive model under freeze-thaw and loading for rock and its engineering application. Cold Reg. Sci. Technol. 2018, 145, 142–150. [Google Scholar] [CrossRef]
  27. Ni, J.; Chen, Y.L.; Wang, P.; Wang, S.R.; Peng, B.; Azzam, R. Effect of chemical erosion and freeze–thaw cycling on the physical and mechanical characteristics of granites. Bull. Eng. Geol. Environ. 2017, 76, 169–179. [Google Scholar] [CrossRef]
  28. Huang, S.B.; Yu, S.L.; Ye, Y.H.; Ye, Z.Y.; Cheng, A. Pore structure change and physico-mechanical properties deterioration of sandstone suffering freeze-thaw actions. Constr. Build. Mater. 2022, 330, 127200. [Google Scholar] [CrossRef]
  29. Mei, S.H.; Liang, X.L.; Wen, L.; Kou, Z.L. Experimental study on mechanical properties of freeze-thaw damaged red sandstone under combined dynamic and static loading. Shock Vib. 2021, 2021, 9980549. [Google Scholar] [CrossRef]
  30. Xu, J.; Pu, H.; Sha, Z.H. Mechanical behavior and decay model of the sandstone in Urumqi under coupling of freeze–thaw and dynamic loading. Bull. Eng. Geol. Environ. 2021, 80, 2963–2978. [Google Scholar] [CrossRef]
  31. Zhang, H.M.; Yuan, C.; Yang, G.S.; Wu, L.Y.; Peng, C.; Ye, W.J.; Moayedi, H. A novel constitutive modelling approach measured under simulated freeze–thaw cycles for the rock failure. Eng. Comput. 2021, 37, 779–792. [Google Scholar] [CrossRef]
  32. Zhang, H.M.; Meng, X.Z.; Yang, G.S. A study on mechanical properties and damage model of rock subjected to freeze-thaw cycles and confining pressure. Cold Reg. Sci. Technol. 2020, 174, 103056. [Google Scholar] [CrossRef]
  33. Song, Z.Y.; Wang, Y.; Konietzky, H.; Cai, X. Mechanical behavior of marble exposed to freeze-thaw-fatigue loading. Int. J. Rock Mech. Min. 2021, 138, 104648. [Google Scholar] [CrossRef]
  34. Fan, W.B.; Zhang, J.W.; Yang, Y.; Zhang, Y.; Dong, X.K.; Xing, Y. Study on the Mechanical Behavior and Constitutive Model of Layered Sandstone under Triaxial Dynamic Loading. Mathematics 2023, 11, 1959. [Google Scholar] [CrossRef]
  35. Xia, Y.J.; Liu, B.C.; Li, T.J.; Zhao, D.C.; Liu, N.; Tang, C.A.; Chen, J. Numerical Simulation of Failure Modes in Irregular Columnar Jointed Rock Masses under Dynamic Loading. Mathematics 2023, 11, 3790. [Google Scholar] [CrossRef]
  36. Wang, Y.; Li, J.Z.; Zhu, C.; Mao, T.Q. Fatigue failure identification using deformation and energy rate for hole-fissure contained granite under freeze–thaw and variable-frequency–variable-amplitude cyclic loads. Fatigue Fract. Eng. Mater. Struct. 2022, 45, 834–851. [Google Scholar] [CrossRef]
  37. Wang, Y.; Gao, S.H.; Li, C.H.; Han, J.Q. Investigation on fracture behaviors and damage evolution modeling of freeze-thawed marble subjected to increasing-amplitude cyclic loads. Theor. Appl. Fract. Mech. 2020, 109, 102679. [Google Scholar] [CrossRef]
  38. Wang, Y.; Han, J.Q.; Li, C.H. Acoustic emission and CT investigation on fracture evolution of granite containing two flaws subjected to freeze–thaw and cyclic uniaxial increasing-amplitude loading conditions. Constr. Build. Mater. 2020, 260, 119769. [Google Scholar] [CrossRef]
  39. Bagde, M.N.; Petroš, V. Waveform effect on fatigue properties of intact sandstone in uniaxial cyclical loading. Rock Mech. Rock Eng. 2005, 38, 169–196. [Google Scholar] [CrossRef]
  40. Vutukuri, V.S.; Lama, R.D.; Saluja, S.S. Handbook on Mechanical Properties of Rocks; Trans Tech Publications: Clausthal, Germany, 1980. [Google Scholar]
  41. Ge, X.R.; Lu, Y.F. Discussion on fatigue failure and irreversible deformation of rock under cyclic loading. J. Geotech. Eng. 1992, 14, 56–60. [Google Scholar]
  42. He, G.C.; Wu, W.Y.; Wang, Y.; Xue, Y.M.; Dai, B.; Zhang, Z.J. Fracture Characteristics and fatigue damage of noncoplanar fractured rocklike specimens under uniaxial graded cyclic loading and unloading. Geofluids 2021, 2021, 9993195. [Google Scholar] [CrossRef]
  43. Li, T.T.; Pei, X.; Guo, J.; Meng, M.H.; Huang, R.Q. An energy-based fatigue damage model for sandstone subjected to cyclic loading. Rock Mech. Rock Eng. 2020, 53, 5069–5079. [Google Scholar] [CrossRef]
  44. Liu, J.H.; Pu, S.Y.; Rao, J.Y. Visco-elastoplastic constitutive fatigue model for rocks. Adv. Civ. Eng. 2020, 2020, 4292043. [Google Scholar] [CrossRef]
  45. Yun, M.C.; Ren, J.X.; Zhang, L.; Zhang, K. Research on triaxial compressive mechanical properties and damage constructive model of post-thawing double-fractured quasi-sandstones with different angles. Heliyon 2024, 10, e34268. [Google Scholar] [CrossRef]
  46. Peng, K.; Zhou, J.Q.; Zou, Q.L.; Song, X. Effect of loading frequency on the deformation behaviours of sandstones subjected to cyclic loads and its underlying mechanism. Int. J. Fatigue 2020, 131, 105349. [Google Scholar] [CrossRef]
  47. Wang, Y.; Feng, W.K.; Li, C.H. On anisotropic fracture and energy evolution of marble subjected to triaxial fatigue cyclic-confining pressure unloading conditions. Int. J. Fatigue 2020, 134, 105524. [Google Scholar] [CrossRef]
  48. Coates, G.R.; Xiao, L.; Prammer, M.G. NMR Logging: Principles and Applications; Haliburton Energy Services: Houston, TX, USA, 1999. [Google Scholar]
  49. Niu, C.Y.; Zhu, Z.M.; Zhou, L.; Li, X.H.; Ying, P.; Dong, Y.Q.; Deng, S. Study on the microscopic damage evolution and dynamic fracture properties of sandstone under freeze-thaw cycles. Cold Reg. Sci. Technol. 2021, 191, 103328. [Google Scholar] [CrossRef]
  50. Hao, J.W.; Li, Q.W.; Qiao, L.; Deng, N.F. Study on pore fractal characteristics and rock constitutive model of sandstone after high temperature. J. Huazhong Univ. Sci. Tech. (Nat. Sci. Ed.) 2024, 52, 142–148. [Google Scholar]
  51. Zhou, X.P.; Li, C.Q.; Zhou, L.S. The effect of microstructural evolution on the permeability of sandstone under freeze-thaw cycles. Cold Reg. Sci. Technol. 2020, 177, 103119. [Google Scholar] [CrossRef]
  52. Zhou, X.P.; Niu, Y.; Zhang, J.Z.; Shen, X.C.; Zheng, Y.; Berto, F. Experimental study on effects of freeze-thaw fatigue damage on the cracking behaviors of sandstone containing two unparallel fissures. Fatigue Fract. Eng. Mater. Struct. 2019, 42, 1322–1340. [Google Scholar] [CrossRef]
  53. Yang, S.Q.; Tian, W.L.; Liu, X.R.; Huang, Y.H.; Yang, J. An experimental study on failure mechanical behavior and cracking mechanism of rectangular solid sandstone containing two non-coplanar fissures under conventional triaxial compression. Theor. Appl. Fract. Mech. 2021, 114, 102975. [Google Scholar] [CrossRef]
  54. Zhou, X.P.; Zhang, J.Z.; Yang, S.Q.; Berto, F. Compression-induced crack initiation and growth in flawed rocks: A review. Fatigue Fract. Eng. Mater. Struct. 2021, 44, 1681–1707. [Google Scholar] [CrossRef]
  55. Wang, J.; Li, J.T.; Shi, Z.M.; Chen, J.C. Fatigue damage and fracture evolution characteristics of sandstone under multistage intermittent cyclic loading. Theor. Appl. Fract. Mech. 2022, 119, 103375. [Google Scholar] [CrossRef]
  56. Wang, J.; Li, J.T.; Shi, Z.M. Deformation damage and acoustic emission characteristics of red sandstone under fatigue–creep interaction. Theor. Appl. Fract. Mech. 2022, 117, 103192. [Google Scholar] [CrossRef]
  57. Weibull, W.; Sweden, S. A statistical distribution function of wide applicability. J. Appl. Mech. 1951, 18, 293–297. [Google Scholar] [CrossRef]
  58. Sun, Y.; Zhai, C.; Xu, J.Z.; Cong, Y.Z.; Qin, L.; Zhao, C. Characterisation and evolution of the full size range of pores and fractures in rocks under freeze-thaw conditions using nuclear magnetic resonance and three-dimensional X-ray microscopy. Eng. Geol. 2020, 271, 105616. [Google Scholar] [CrossRef]
  59. Zhang, Q.S.; Yang, G.S.; Ren, J.X. New study of damage variable and constitutive equation of rock. Chin. J. Rock Mech. Eng. 2003, 22, 30–34. [Google Scholar]
  60. Liu, Y.; Dai, F. A damage constitutive model for intermittent jointed rocks under cyclic uniaxial compression. Int. J. Rock Mech. Min. 2018, 103, 289–301. [Google Scholar] [CrossRef]
  61. Arvydas, R.; Vladimir, C.; Viktor, G.; Jan, C. Uncertainty of the smeared crack model applied to RC beams. Eng. Fract. Mech. 2020, 233, 107088. [Google Scholar]
  62. Umberto, D.M.; Fabrizio, G.; Paolo, L.; Andrea, P. A combined ALE-cohesive fracture approach for the arbitrary crack growth analysis. Eng. Fract. Mech. 2024, 301, 109996. [Google Scholar]
Figure 1. Map of permafrost types and regional divisions of China.
Applsci 14 06324 g001
Figure 2. Test equipment and flowchart. (a) Rock sample preparation. (b) Freeze–thaw cycle experiment. (c) Periodic load experiment.
Applsci 14 06324 g002
Figure 3. Apparent changes in samples after different freeze–thaw cycles. (a) Intact granite. (b) Fractured granite.
Applsci 14 06324 g003
Figure 4. Microscopic damage to granite slices after different freeze–thaw cycles. (a) F-T 0 cycles. (b) F-T 40 cycles. (c) F-T 80 cycles.
Applsci 14 06324 g004
Figure 5. SEM image of granite after different freeze–thaw cycles. (a) F-T 0 cycles. (b) F-T 40 cycles. (c) F-T 80 cycles.
Applsci 14 06324 g005
Figure 6. The relationship between mass and compressive wave velocity with freeze–thaw cycles.
Applsci 14 06324 g006
Figure 7. T2 spectral characteristics and pore size distribution of rocks under different freeze–thaw cycles. (a) T2 spectral curve. (b) Pore size distribution.
Applsci 14 06324 g007
Figure 8. T2 spectrum curve before and after destruction. (a) F-T 0 cycles. (b) F-T 40 cycles. (c) F-T 80 cycles.
Applsci 14 06324 g008
Figure 9. Fractal dimension of granite pores with different freeze–thaw cycles.
Applsci 14 06324 g009
Figure 10. Mechanical properties of granite under different freeze–thaw cycles. (a) Uniaxial compression cyclic load stress–strain curve. (b) Relationship between fatigue frequency and freeze–thaw cycles.
Applsci 14 06324 g010
Figure 11. Conceptual model of freeze–thaw and fatigue load deterioration processes.
Applsci 14 06324 g011
Figure 12. Schematic diagram of the crack propagation mode. ① Wing crack (WC, blue line). ② anti-wing crack (AWC, green line). ③ Secondary crack (SC, yellow line).
Applsci 14 06324 g012
Figure 13. The development process of macroscopic cracks in fractured granite. (a) F-T 0 cycles. (b) F-T 40 cycles. (c) F-T 80 cycles.
Applsci 14 06324 g013
Figure 14. Relationship between irreversible strain and the number of freeze–thaw cycles.
Applsci 14 06324 g014
Figure 15. Relationship between irreversible strain and model parameters m and F0.
Applsci 14 06324 g015
Figure 16. Theoretical fitting curve and experimental data. (a) F-T 0, first fatigue loading. (b) F-T 0, 40% fatigue loading. (c) F-T 0, 100% fatigue loading. (d) F-T 40, first fatigue loading. (e) F-T 40, 40% fatigue loading. (f) F-T 40, 100% fatigue loading. (g) F-T 80, first fatigue loading. (h) F-T 80, 40% fatigue loading. (i) F-T 80, 100% fatigue loading.
Applsci 14 06324 g016
Table 1. Parameters of the RMT-201 rock mechanics test system.
ItemParameters
Equipment size1200 × 1000 × 1870 mm (long × wide × high)
Equipment weight3500 kg
Frame stiffness6 MN/mm
Maximum axial pressure1500 kN
Maximum confining pressure50 MPa
Dynamic load waveformoblique wave, sine wave, triangular wave, and square wave
Dynamic load frequency0.001~1 Hz
Table 2. Fractal dimension of granite across pore sizes.
StatusF-T CyclesMicropore
(r < 10 μm)
Mesopore
(10 μm ≤ r < 100 μm)
Macropore
(r ≥ 100 μm)
T2a/msT2b/msDbT2c/msT2d/msDbT2e/msT2f/msDb
Integrity01.3839.6592.12310.35395.4772.728102.341821.4342.375
201.5899.6591.98310.35395.4772.712102.341943.7882.467
401.9569.6591.82010.35395.4772.658102.3412494.5082.697
Post-destruction01.2039.6592.15210.35395.4772.537102.3414994.5052.778
202.4099.6591.83310.35395.4772.516102.3412171.1182.788
401.8259.6591.56810.35395.4772.516102.3412327.2022.815
Disclaimer/Publisher’s Note: The statements, opinions and data contained in all publications are solely those of the individual author(s) and contributor(s) and not of MDPI and/or the editor(s). MDPI and/or the editor(s) disclaim responsibility for any injury to people or property resulting from any ideas, methods, instructions or products referred to in the content.

