Article

A Medical Image Segmentation Network with Multi-Scale and Dual-Branch Attention

School of Computer Science, Jiangsu University of Science and Technology, Zhenjiang 212003, China
*
Author to whom correspondence should be addressed.
Appl. Sci. 2024, 14(14), 6299; https://doi.org/10.3390/app14146299
Submission received: 2 July 2024 / Revised: 13 July 2024 / Accepted: 16 July 2024 / Published: 19 July 2024

Abstract

:
Accurate medical image segmentation can assist doctors in observing lesion areas and making precise judgments. Effectively utilizing important multi-scale semantic information in local and global contexts is key to improving segmentation accuracy. In this paper, we present a multi-scale dual attention network (MSDA-Net), which enhances feature representation under different receptive fields and effectively utilizes the important multi-scale semantic information from both local and global contexts in medical images. MSDA-Net is a typical encoder–decoder structure and introduces a multi-receptive field densely connected module (MRD) in the decoder. This module captures semantic information across various receptive fields and utilizes dense connections to provide comprehensive and detailed semantic representations. Furthermore, a parallel dual-branch attention module (PDA), incorporating spatial and channel attention, focuses intensively on detailed features within lesion areas. This module enhances feature representation, facilitates the identification of disease boundaries, and improves the accuracy of segmentation. To validate the effectiveness of MSDA-Net, we conducted performance analyses on the CVC-ClinicDB, 2018 Data Science Bowl, ISIC 2018, and colon cancer slice datasets. We also compared our method with U-Net, UNet++, and other methods. The experimental results unequivocally demonstrate that MSDA-Net outperforms these methods, showcasing its superior performance in medical image segmentation tasks.

1. Introduction

Previously, medical image labeling relied on manual analysis and annotation by experienced physicians. However, manual annotation is susceptible to both objective factors and subjective opinions, resulting in lower accuracy of annotated data. Currently, CAD is widely utilized, which mostly uses the results of medical image segmentation to make diagnoses [1]. Existing classic segmentation algorithms encompass edge detection [2], region-base [3], threshold segmentation [4], watershed algorithm [5], etc. While each algorithm offers its advantages, the performance of these algorithms on complex data sets is unsatisfactory. In addition to these methods, there are other methods that can be used for medical image segmentation. For example, cellular automaton-based segmentation [6] uses a discrete model composed of a grid of cells, where each cell is in one of a finite number of states. The Optimal Cellular Automata Technique for Image Segmentation [7] uses particle swarm optimization with the gravitational search algorithm to find the optimal value of active cells, which is then input into the meta-cellular automata model for segmenting blood smear images. Ant Colony Optimization (ACO) [8] is a metaheuristic-based segmentation method. Ant Colony Optimization for Image Segmentation [9] introduces an ACO algorithm based on the boundary search process of the ant colony algorithm, which searches for the optimal path within constrained regions. ACO simulates the foraging behavior of ants in nature to find the optimal path corresponding to the image boundary. However, these techniques have difficulty handling noise in image data, which can lead to incorrect segmentation boundaries. Common problems with medical imaging include overall image blur, uneven lighting, and unclear boundaries between foreground and background [10]. Consequently, achieving high-precision segmentation for various types of medical images poses a significant challenge.
Convolutional neural networks have advanced significantly in the field of image segmentation due to the rapid growth of deep learning. Among these, the encoder–decoder network structure has made important achievements in medical image segmentation. This type of network structure provides powerful capabilities for image segmentation tasks through its unique feature-extraction and restoration mechanisms. The encoder extracts feature information layer by layer, effectively capturing the complex semantic information of the input data and providing rich semantic information for the subsequent decoder. The decoder then gradually restores the resolution of the feature maps, maximizing the retention and recovery of the input data’s detailed information. Additionally, the encoder–decoder structure is highly flexible and can adapt to different types of inputs and outputs. The classic U-Net [11] model is a typical encoder–decoder structure. It is widely used in the field of image segmentation and has achieved remarkable results. Following the development of U-Net [11], many U-shaped architectures in the form of encoder–decoders, such as Attention-UNet [12] and Res-UNet [13], have emerged and achieved excellent results. However, these networks often fall short of effectively extracting and utilizing multi-scale contextual feature information. Despite CNNs’ robust feature learning capabilities, they often lack sensitivity to variations in input image resolution. This limitation arises from the fixed size of the convolution kernel, which remains unchanged regardless of shifts in input image resolution, resulting in suboptimal extraction of global contextual features. The transformer [14] from the domain of natural language processing has been adopted into the field of visual processing to compensate for the shortcomings of convolution. In contrast to convolutional neural networks, transformers are less effective at extracting fine-grained details.
Traditional neural networks use fixed-size convolutional kernels for single-scale feature extraction, which leads to insufficient feature representation and neglect of details at other scales. This method may result in poor processing effects on target areas of different sizes. Additionally, traditional neural networks treat all extracted features equally, making them susceptible to irrelevant information interference, which negatively impacts the final segmentation results. To capture features at various scales, fully utilize global and local important feature information, enhance the ability to segment objects of different sizes within the image, preserve feature details, and achieve clearer edges, in this paper, we propose a novel encoder–decoder architecture for medical image segmentation, named the multi-scale dual attention network (MSDA-Net). In the encoder extraction process, a convolutional neural network is utilized to capture intricate local details within the image. Subsequently, the resulting feature map undergoes expansion into a one-dimensional sequence at the pixel level, which is then inputted into the transformer block for further processing. In the decoder stage, a module that combines multi-receptive field densely connected is used in the decoding stage to integrate semantic feature information from different receptive fields. The parallel dual-branch attention module then processes the multi-scale data produced by the decoder and the low-frequency features obtained from the encoder. This dual-branch attention module primarily operates on feature information channels and spaces, utilizing a parallel dual-branch attention mechanism to guide context by identifying global or local important feature information to obtain prediction results.
In summary, our main contributions are as follows:
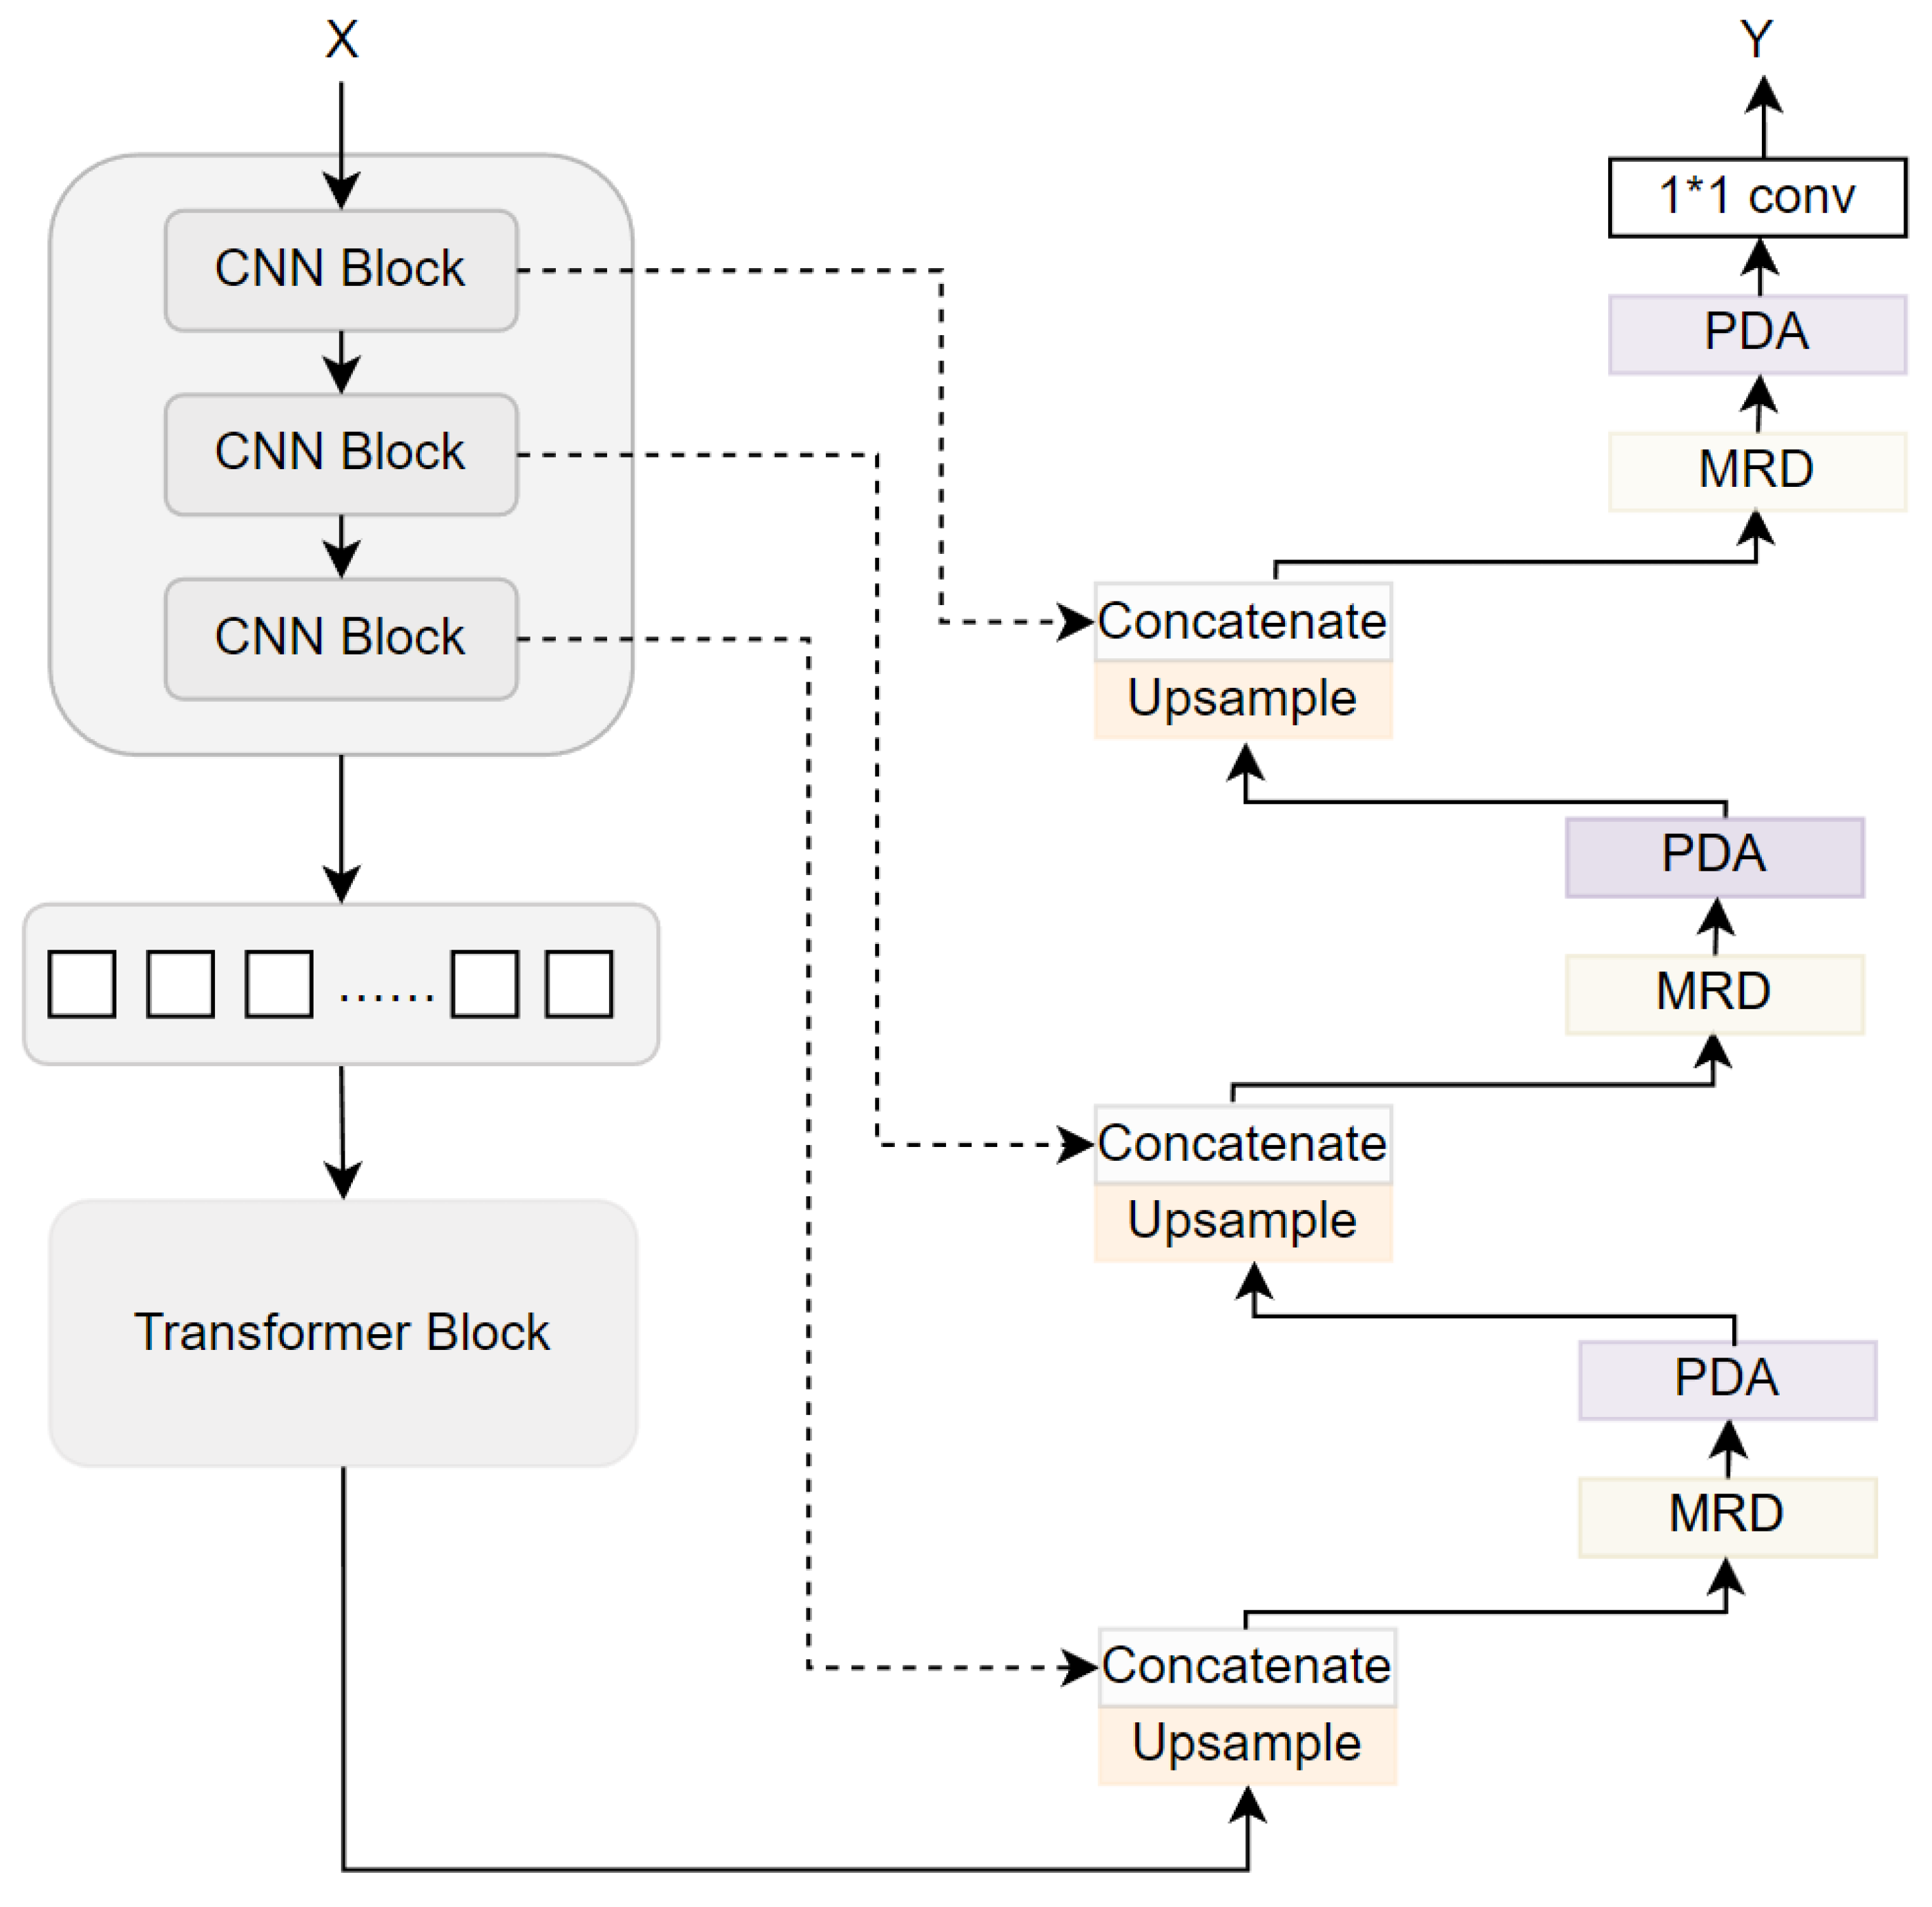
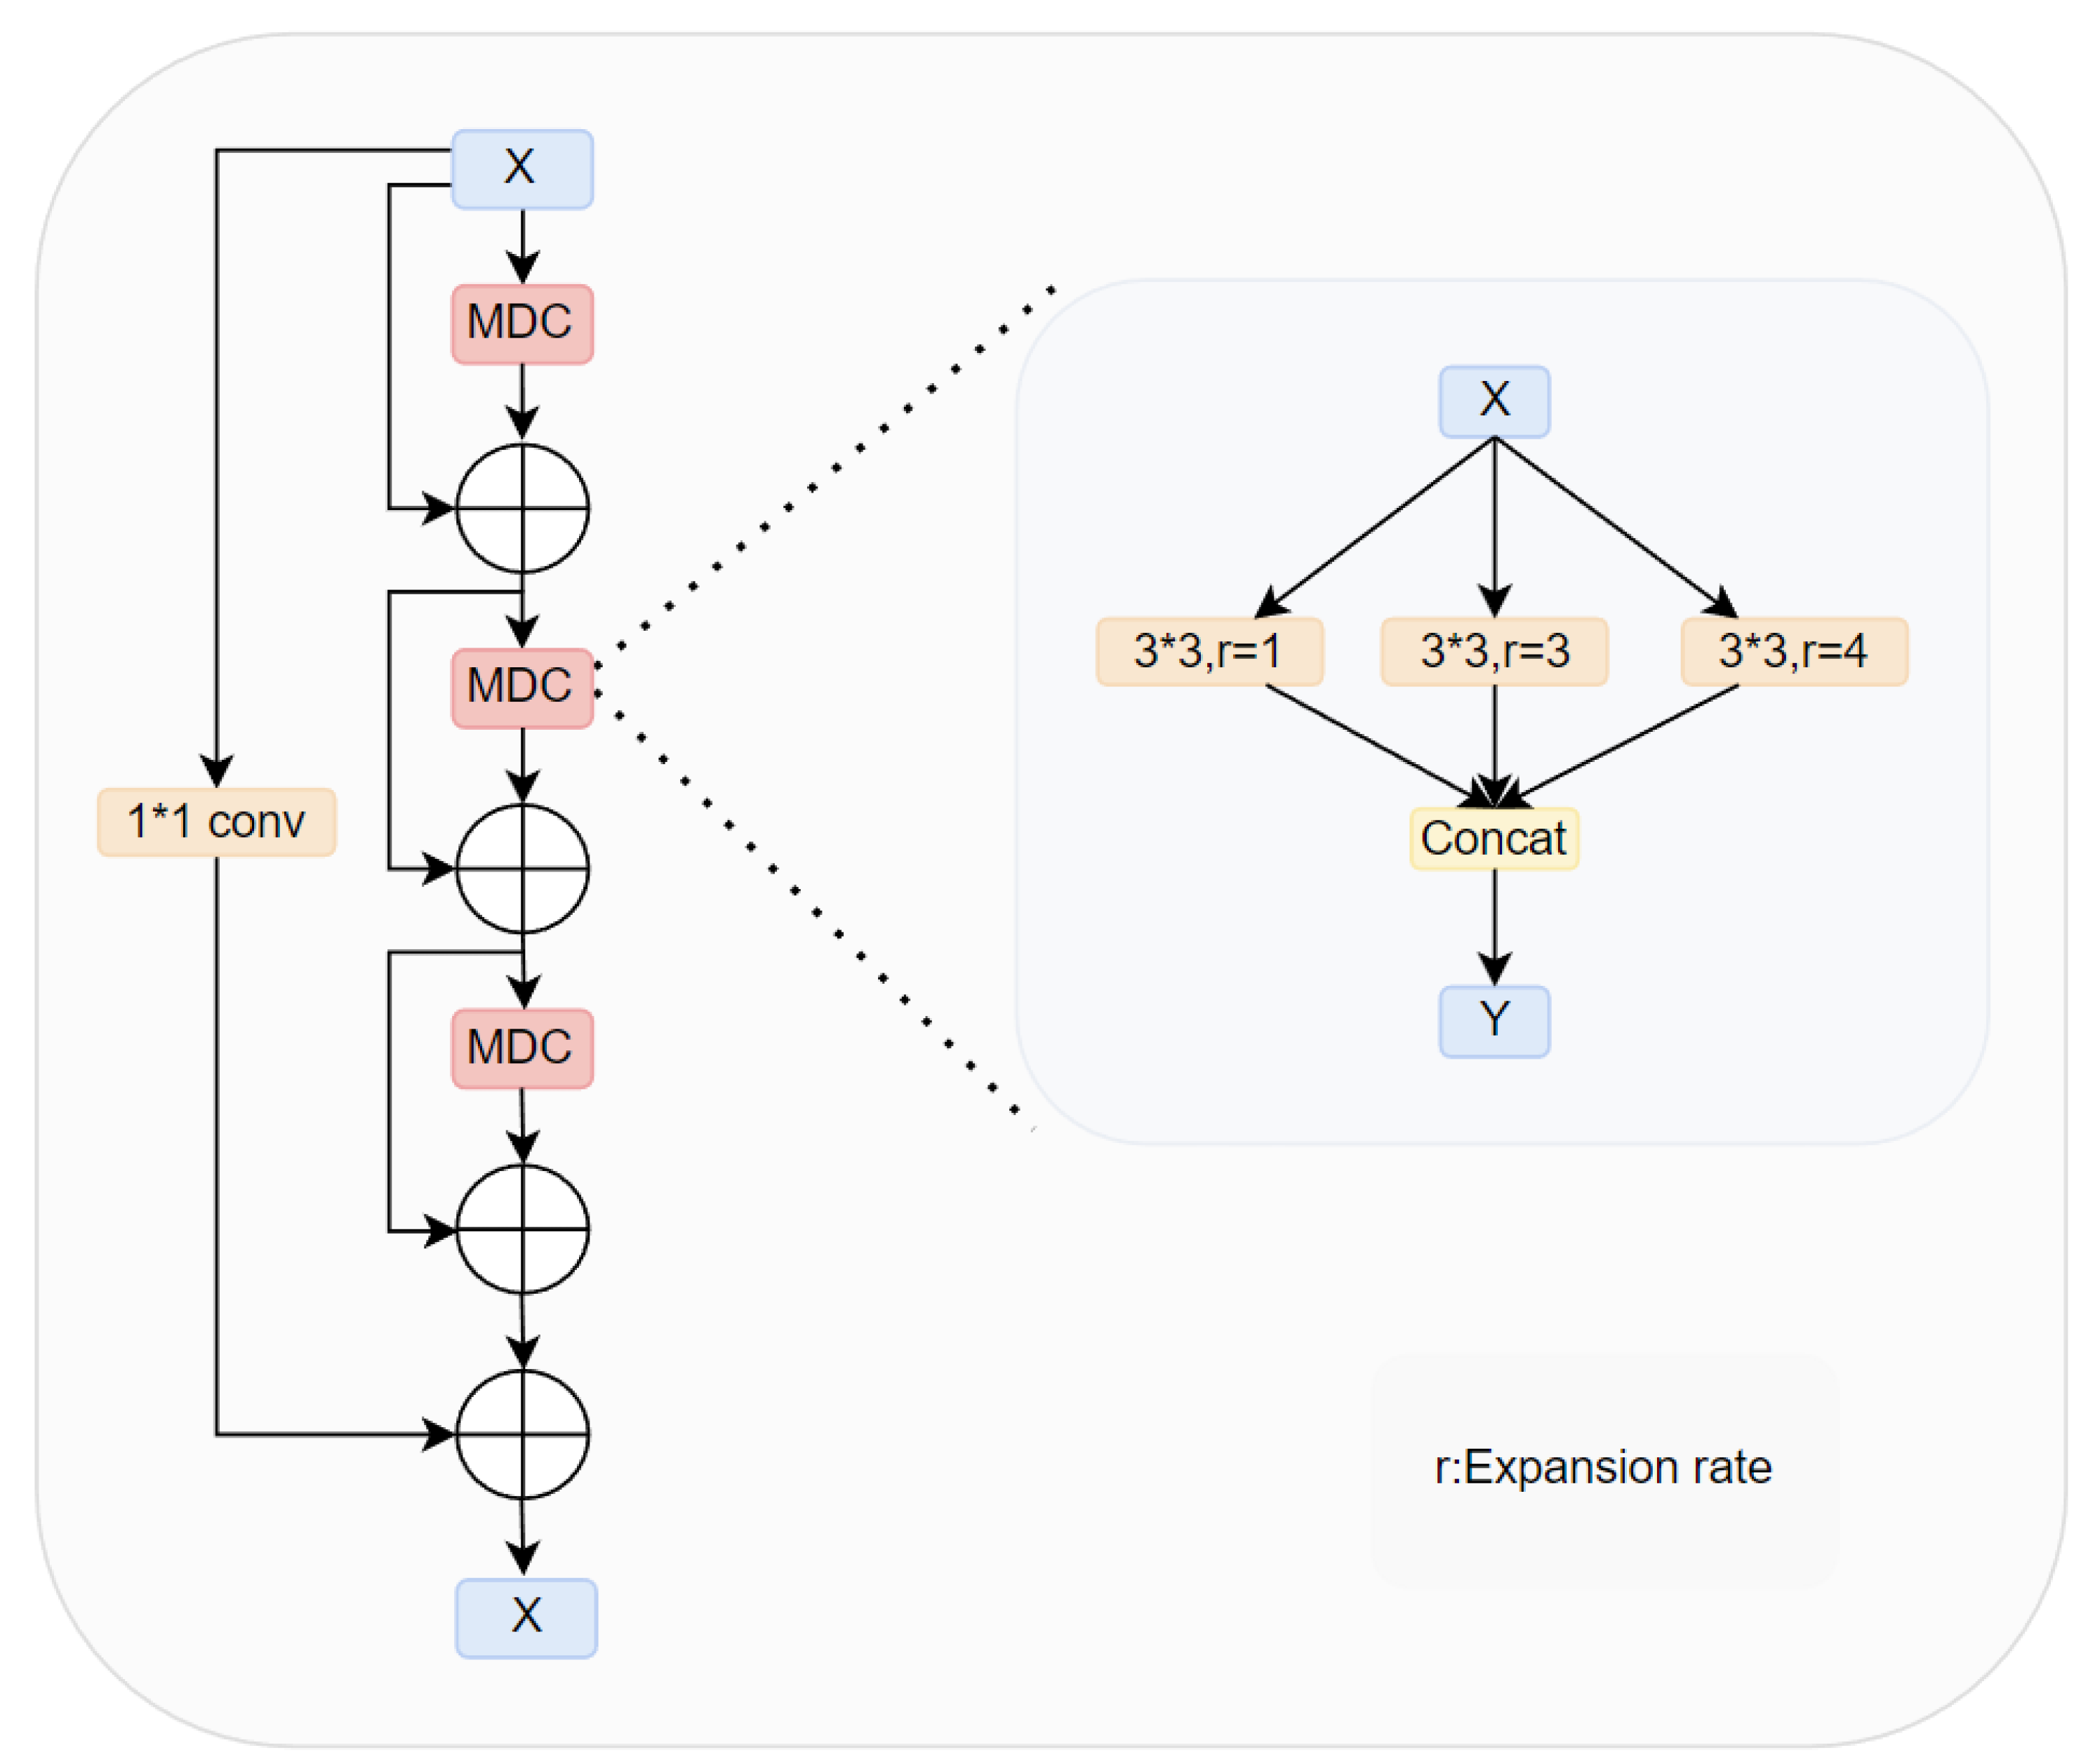
  • We proposed a novel module MRD, which introduced convolution operations with different dilation rates during upsampling and extracted features through three parallel branches. This module enables the simultaneous capture of global and local semantic information, enhancing the multi-scale feature representation capability of the network. Additionally, the extracted semantic information is fused through dense connections to reduce the risk of information loss, thereby enhancing the feature representation ability and improving segmentation accuracy. The MRD effectively addresses the shortcomings of traditional methods in feature extraction and fusion, significantly enhancing the overall performance and segmentation results of the network.
  • We propose a novel module PDA designed to process feature information in parallel from both channel and spatial dimensions. This module receives shallow semantic features from the encoder and multi-scale features from the decoder, effectively integrating features at different scales, emphasizing crucial global and local semantic information in each receptive field, suppressing noise, and enhancing the ability to segment target boundaries. The PDA allows for better integration of feature information and precise calculation of attention weights for the feature maps, thereby enhancing the overall performance of the network.
  • To assess the robustness and generalization of our network, we conduct experimental analyses on four distinct medical image datasets: 2018 Data Science Bowl [15], ISIC 2018 [16,17], CVC-ClinicDB [18], and colon cancer slices dataset(images provided with authorization from the collaborating hospital). The assessment findings underscore notable advancements attained with our proposed model in contrast to medical image segmentation methods such as UNet and UNet++, thereby providing additional affirmation of the effectiveness of our approach.

2. Related Work

2.1. Medical Image Segmentation

In recent years, deep learning methods utilizing convolutional neural networks (CNNs) [19,20,21] have made significant progress in medical image segmentation. Notably, the fully convolutional network [22] has emerged as a potent tool in this domain, demonstrating considerable success. It is a type of encoder–decoder network structure that replaces traditional fully connected layers with fully convolutional layers to extract image feature information. This modification allows it to handle inputs of different sizes and shapes, making it more flexible. Res-UNet [23] integrates residual network concepts to mitigate issues related to gradient vanishing during training, thereby improving network convergence. Incorporating an attention mechanism into U-Net, Attention U-Net [12] enhances the network’s ability to focus on relevant regions within the image during segmentation, leading to improved extraction and utilization of critical information. Attention U-Net++ [24] incorporates an attention mechanism into U-Net++ [25], allowing the network to simultaneously focus on global and local information; CFHA-Net [26] uses a triple hybrid mechanism to enhance the segmentation of polyp boundaries. BA-Net [27] effectively uses boundary details to provide supplementary information to enhance prediction capabilities through a small multi-task learning module learned jointly. R2U-Net [28] extracts multi-scale features through recursive residual blocks and then combines the attention mechanism to improve the focus on the key areas of the target. EIU-Net [29] utilizes feature extraction under different receptive fields and a normalized attention module to obtain multi-scale feature information while suppressing the influence of non-essential features on the results, thus improving the final segmentation outcomes. FSA-Net [30] fuses feature information of multiple scales through an attention mechanism and effectively aggregates important features. LM-Net [31] uses a multi-branch module to capture multi-scale features at the same level and then combines local and global self-attention modules to improve the problem of blurred segmentation boundaries. MSCA-Net [32] first leverages a multi-scale bridging module to fully utilize the features from both the encoder and decoder, and then uses a global–local channel–spatial attention module to emphasize significant features, thereby enhancing the segmentation results of medical images. However, these networks primarily emphasize local feature extraction while overlooking global semantic information. Therefore, to overcome the shortcomings of convolutional neural networks, transformers [14] are increasingly being adopted in image segmentation, offering a solution to the inherent limitations of convolutional neural networks. The Vision Transformer [33] split the image into pre-defined blocks and then apply a multi-head attention method to enhance the image’s global understanding, hence increasing the image segmentation’s effectiveness. The Swin Transformer [34] incorporates a shift window mechanism, facilitating interaction between different windows and empowering the model to efficiently grasp both the overarching and local details of the image. Swin-UNet [35] emerges from the fusion of the Swin Transformer with the U-shaped network, exhibiting advantages in handling large-scale images and multi-scale information. TDD-UNet [36] integrates the transformer’s multi-head self-attention into the encoding layer of U-Net to extract comprehensive global context information. However, these networks are limited in extracting both local detail semantic information and global feature information at the same time and are prone to ignore important feature information. This paper proposes a new network structure that can simultaneously extract local detail feature information and global multi-scale feature information. By focusing on important feature details, it improves the comprehensiveness and accuracy of feature capture and thus improves the overall performance.

2.2. Image Serialization

Initially, transformers achieved significant breakthroughs in natural language processing, but they were unable to directly process image data. To address this issue, the Vision Transformer [33] and Swin Transformer [34] models were introduced. ViT [33] employs image serialization to enable Transformer [14] to process image data. Image serialization involves dividing the image data into a fixed number of blocks with uniform shapes and sizes, and then converting each image block into a one-dimensional vector. Each one-dimensional vector can be likened to a word in natural language processing. ViT [33] utilizes self-attention calculations to adjust the weights of different image blocks, allowing it to focus on important features. Image serialization enhances the model’s adaptability to images of varying resolutions and sizes. The Transformer [14] model utilizes image serialization to process images, allowing it to efficiently capture both global feature relationships and local features, thereby improving its ability to process image features. Image serialization enables the network to process images of various resolutions, thereby enhancing the adaptability and generalization capability of the model. This approach transforms the image segmentation task into processing serialized patch representations, effectively allowing the model to perform accurate feature extraction on images of different sizes.

2.3. Attention Mechanism

In recent years, attention mechanisms have become prevalent in the field of image processing. These mechanisms increase the attention to important information and minimize the attention to less important details. CCNet [37] utilizes a cross-attention module to calculate attention across various positions of the feature map. DANet [38] integrates spatial attention and channel attention, effectively enhancing the correlation between global features and channels. RA-UNet [39] integrates the attention mechanism and residual networks, enhancing segmentation performance by stacking attention modules. SENet [40] employs squeeze and excitation phases to improve the network’s ability to capture image details and boost its representational power. GFANet [41] uses two progressive relational decoders to segment images. In Vision Transformer [33], the concept of multi-head attention is introduced, enabling the model to learn multiple distinct attention weights and focus on different subspaces. This paper proposes a novel attention mechanism that utilizes parallel dual-branch attention to guide the network to focus on the region of interest pay more attention to detail information, reduce the interference of irrelevant information, and improve the accuracy of medical image segmentation.

3. Method

The entire network architecture follows an encoder–decoder structure, which mainly includes CNN Block, Transformer Block, MRD, and PDA. The overall structure is depicted in Figure 1.

3.1. Multi-Receptive Field Densely Connected Module

The effective receptive field of many of the current traditional convolutional neural networks does not grow proportionately with an increase in the number of convolutional layers. Traditional Fully Convolutional Networks [22] (FCNs) rely on fixed receptive field sizes of convolutional and pooling layers for feature extraction. This approach limits the ability to simultaneously capture features of both large and small target regions, leading to detail loss and blurred boundaries during image segmentation. To address this issue, we introduce a novel module (MRD) in upsampling. Incorporating multi-receptive field extraction into the network allows it to capture features at various scales, enabling the detection of a broader context while simultaneously focusing on detailed information.
This approach ensures a more accurate capture of features across different target sizes, preserving feature details and achieving clearer boundaries. MRD consists of three densely connected multi-scale dilated convolutions (MDC). Its structure is shown in Figure 2. The multi-scale dilation convolution module employs three parallel convolution branches with varying expansion rates to extract features across different receptive fields, thereby enhancing sensitivity to features of various sizes. The MDC module takes the input feature map X and feeds it into convolutional branches with dilation rates of 1, 3, and 4, respectively. Through feature concatenation and 1 × 1 convolution, the outputs of the three parallel branches are fused to achieve feature integration across different scales. In the following formula, M D C () is the multi-scale dilated convolution function of input feature map X, and D C o n v m m r ( X ) represents an atrous convolution operation with a convolution kernel of m × m and an atrous rate of r for input feature map X.
M D C X = C o n v 1 × 1 ( C o n C a t ( D C o n v 3 × 3 1 ( X ) , D C o n v 3 × 3 2 ( X ) , D C o n v 3 × 3 4 ( X ) ) )
Additionally, leveraging dense connectivity [42] enables the capture of richer and more detailed feature representations. As shown in Figure 1, the final output feature map, Y , is generated by summing the outputs of the three densely connected MDC modules and the input feature map X .
Y 1 = X + M D C ( X )
Y 2 = Y 1 + M D C ( Y 1 )
Y 3 = Y 2 + M D C ( Y 3 )
Y = Y 3 + C o n v 1 1 ( X )

3.2. Parallel Dual-Branch Attention Module

Currently, attention mechanisms are widely applied in skip connections, while network models that modify the upsampling part are relatively rare. The typical CBAM [43] sequentially employs channel attention and spatial attention to enhance feature representation. However, this sequential method may propagate errors from the first attention module, affecting the performance of subsequent attention modules. To address this problem, we designed a novel parallel dual-branch attention module PDA with residual connections to improve the robustness and performance of the model. PDA can simultaneously focus on different dimensions of the feature map, capturing essential global and local semantic information more comprehensively. Furthermore, the PDA module effectively enhances the model’s ability to segment target regions. The PDA primarily computes attention weights from two branches, focusing on extracting features from both channel and spatial dimensions. This approach effectively addresses the problem of import and information loss in the process of extracting semantic features and provides precise feature details, enabling the decoder to accurately reconstruct the feature map to its original size. The features obtained from the MRD, along with the low-frequency features from the encoder, are fed into the PDA for feature integration and more refined feature extraction. Within the decoder, attention modules are incorporated from deeper to shallower layers, enhancing the detailed information of the lesions and highlighting the inter-scale relationships. This structure is illustrated in Figure 3.
For an input feature map x R C H W , where C denotes the number of channels, H represents the height of the feature map, and W denotes the width of the feature map, the computation formula for the F 1 branch is as follows:
W c = s i g m o i d ( g ( C o n v 1 1 ( C o n v 3 3 ( x ) ) ) )
Among them, C o n v 1 1 represents a convolution kernel of size 1 × 1, and C o n v 3 × 3 represents a convolution kernel of size 3 × 3. g a = 1 W H i = 1 , j = 1 W , H α v , performs channel average pooling for the feature map α. The calculation formula of the F 2 branch is as follows:
x 1 = C o n v 1 1 ( x )
M s = h C o n v 3 3 ( x 1 ) × x 1
Among them, h a = 1 C i = 1 C a i represents the average value computed across the channels of the feature map α.
Finally, the output expression of the PDA module is as follows:
Y = C o n v 1 1 ( x ; M s × W c )
Among them, C o n v 1 1 represents a convolution kernel of size 1 × 1.

4. Experiments and Results

4.1. Datasets and Evaluation Metric

We evaluated MSDA-Net using four distinct biomedical datasets: the 2018 Data Science Bowl dataset [15] for lung nodule segmentation dataset, ISIC 2018 [16,17] for dermatology segmentation dataset, CVC-ClinicDB [18] for intestinal polyp segmentation dataset, and a private dataset on Colon Cancer Slice. These datasets contain segmented objects of different sizes and textures. Specifically, the 2018 Data Science Bowl dataset [15] consists of a microscope dataset, which contains a total of 402 training cases, 134 validation cases, and 134 testing cases, which is mainly used for diagnosing lung diseases. ISIC 2018 [16,17]. This dataset is an application of dermatoscopic images for the diagnosis of melanoma. ISIC 2018 [16,17] comprises 2594 labeled images. Of these, 1556 were randomly chosen as the training dataset, and the rest of the images were divided into test and validation datasets. CVC-ClinicDB [18] dataset consists of lesion areas of intestinal polyps extracted from colonoscopy videos. CVC-ClinicDB [18] contains a total of 612 images and corresponding masked images with annotations, which contain a total of 368 training data points. Colorectal cancer slice dataset: this dataset is private (images provided under license from partner hospitals) consisting of rectal cancer slices, which are mainly used for rectal cancer diagnostic studies, of which the training dataset contains a total of 407 images.
I o U = | G P r | | G P r |
D i c e = 2 | G P r | G + | P r |
A c c = T N + T P T N + T P + F N + F P
P r e c i s i o n = T P T P + F P
R e c a l l = T P T P + F N
P r represents the foreground effect that the network anticipated, and G represents the foreground of the actual label. T P , T N , F P , and F N represent true positive, true negative, false positive, and negative. Precision, denoted by P, refers to the proportion of correctly identified positive samples out of all preditions predictions made, calculated across the entire sample population. R denotes Recall, which represents the proportion of actual positive samples that the model correctly predicts as positive.

4.2. Implementation Details

The experiment was conducted using an AMD 5900X processor (AMD, Santa Clara, CA, USA) and an NVIDIA GeForce RTX 3090 (Santa Clara, CA, USA) with 24 GB of memory. The input image was resized to 224 × 224 pixels. The loss function of PPA [44] was used. The model employed the Radam optimizer with an initial learning rate set at 1 × 10⁻⁵, and the learning rate was adjusted using ConsineAnnealingLR. Additionally, data augmentation techniques such as vertical flipping, random horizontal flipping, and random rotation were applied to improve the model’s generalization capabilities.

4.3. Results

In this section, we present the conclusive results on four distinct medical image datasets and compare our proposed architecture with other methodologies.

4.3.1. 2018 Data Science Bowl Dataset Comparison Results

Nucleus segmentation plays an important role in biomedical image analysis. The 2018 Data Science Bowl dataset results are shown in Table 1, and the qualitative comparative results of the six models are shown in Figure 4. Compared with TransU-Net, MSDA-Net obtained an improvement of 0.7% Acc, 4.7% IoU, 0.7% Dice, 1.2% Precision, and Infer-T reduced the time by 1.32 s on the 2018 Data Science Bowl dataset. Compared with other models, the boundary details of our model are clearer.

4.3.2. CVC-ClinicDB Dataset Comparison Results

The results of the CVC-ClinicDB dataset are shown in Table 2, and the qualitative comparative results of the six models are shown in Figure 5. The results show that MSDA-Net showed improved values of ACC, Dice, Precision, and IoU. Compared with UNet, MSDA-Net obtained an improvement of 1% Acc, 3.1% IoU, 1.4% Dice, 0.7% Precision on the CVC ClinicDB-dataset. Additionally, Infer-T reduces the time by 1.12 s compared to UCTransNet. From Figure 5, it can be seen that our proposed method can accurately predict the location and boundaries of intestinal polyp lesions, and its prediction results closely align with ground truth values.

4.3.3. ISIC 2018 Dataset Comparison Results

The ISIC 2018 dataset results are shown in Table 3, and the qualitative comparative results of the six models are shown in Figure 6. Dice is 0.913, IoU is 0.857, Precision is 0.937, Recall is 0.917, and Acc is 0.962. Compared to other models, MSDA-Net was improved in defined metrics. Compared with MultiResUNet, MSDA-Net obtained an improvement of 0.4% Acc, 4% IoU, 2.5% Dice, 2.6% Precision, and 2% Recall on the ISIC 2018 dataset. Infer-T reduced the time by 1.07 s compared to UCTransNet. In general, our proposed model outperformed the compared models in most evaluation metrics.

4.3.4. Colon Cancer Slice Dataset Comparison Results

The colon cancer slice dataset is private (images provided with authorization from the collaborating hospital), the results are shown in Table 4, and the qualitative comparative results of the six models are shown in Figure 7. Through the analysis of Table 4, we can conclude that MSDA-Net was improved in Acc, Dice, Precision, and IoU. Compared with UNet, MSDA-Net obtains an improvement of 0.3% IoU,0.6% Dice, and 1.6% Precision on the Colon Cancer Slice dataset. Infer-T reduced the time by 0.79 s compared to UCTransNet. MSDA-Net improved in metrics compared to other models.

4.4. Comparison of Parameters and FLOPs

We compared the complexity and number of parameters of multiple models and performed a detailed analysis. As shown in Figure 8, our proposed method has lower complexity compared to classical CNN methods such as U-Net. Additionally, our method is less complex than transformer-based network structures such as UCTransNet and TransUNet. Figure 9 illustrates that compared to TransU-Net, our proposed method also reduced the number of parameters. Overall, our model shows certain advantages in practical applications by maintaining low complexity and ensuring no increase in the number of parameters.

4.5. Ablation Study

To evaluate the effectiveness of the proposed module in MSDA-Net, we conducted an ablation experiment on the CVC-ClinicDB, 2018 Data Science Bowl, ISIC 2018 and Colon Cancer Slice Dataset. The model primarily consisted of two components: PDA and MRD.
The MRD module mainly obtains dense connections to fuse feature information at different scales to obtain more comprehensive semantic features and achieve clearer boundary segmentation. As demonstrated in Table 5, integrating the MRD into the baseline network resulted in an increase of 0.9% in Dice, 1.7% in IoU, and 0.9% in Recall on CVC-ClinicDB. In the 2018 Data Science Bowl, Dice increased by 1.2%, IoU increased by 0.1%, and Recall increased by 0.2%. On the ISIC 2018, it had an improvement of 0.8% IoU, 1.6% Dice, 1.1% Precision, 0.3% Recall. On the Colon Cancer Slice dataset, Dice increased by 0.5%, IoU increased by 1.3%, and Recall increased by 0.3%. These prove that adding the MRD module can effectively extract multi-scale detail feature information and improve the network segmentation capability. The PDA leverages a parallel dual-branch attention mechanism to focus on the target lesion area and suppress the influence of noise information on the segmentation results. Integrating the PDA module into the baseline network results in a Dice improvement of 1.4%, IoU improvement of 1.3%, and Recall improvement of 1.6% on the CVC-ClinicDB dataset. On the 2018 Data Science Bowl dataset, Dice increased by 0.8%, IoU by 0.3%, and Recall by 0.7%. On the ISIC 2018, it had an improvement of 1.1% IoU, 1.6% Dice, 2% Precision, and 0.5% Recall. On the Colon Cancer Slice dataset, Dice increased by 0.3%, IoU increased by 1%, and Recall increased by 0.6%. These findings confirm that the addition of the PDA module significantly enhanced the network’s ability to segment target regions accurately.

5. Conclusions

This paper introduces MSDA-Net, a medical image segmentation framework comprising an encoder, a decoder, an MRC, and a PDA. The encoder efficiently extracts both global and local semantic information. In the decoder, a multi-receptive field dense connection module and a parallel dual-branch attention module are added. MRD uses dense connections and convolutions with different expansion rates to extract feature information at various receptive fields, thereby enhancing the segmentation performance of the lesion area. The PDA module integrates spatial and channel attention to evaluate feature representation, mitigate the impact of irrelevant information, and enhance the precision and resilience of segmentation outcomes.
Although our network demonstrates promising performance, it still possesses certain limitations. Firstly, its design around the encoder–decoder structure hinders its adaptability for general network integration. Secondly, MSDA-Net exhibits a complex architecture and a considerable parameter count. Our future efforts will primarily focus on addressing the limitations of our proposed module to enhance its adaptability. Additionally, we will continue to explore more efficient methods for parameter reduction and increased computational speed to streamline the network’s complexity while maintaining its performance.

Author Contributions

The authors confirm their contribution to the paper as follows: study conception and design, C.Z. and K.C.; writing—original draft preparation, C.Z.; writing—review and editing, C.Z. and X.H. All authors have read and agreed to the published version of the manuscript.

Funding

This research received no external funding.

Institutional Review Board Statement

Not applicable.

Informed Consent Statement

Not applicable.

Data Availability Statement

Conflicts of Interest

The authors declare no conflicts of interest.

References

  1. Xu, Q.; Ma, Z.; He, N.; Duan, W. DCSAU-Net: A deeper and more compact split-attention U-Net for medical image segmentation. Comput. Biol. Med. 2023, 154, 106626. [Google Scholar] [CrossRef] [PubMed]
  2. Canny, J. A Computational Approach to Edge Detection. IEEE Trans. Pattern Anal. Mach. Intell. 1986, PAMI–8, 679–698. [Google Scholar] [CrossRef]
  3. Kass, M.; Witkin, A.; Terzopoulos, D. Snakes: Active contour models. Int. J. Comput. Vis. 1988, 1, 321–331. [Google Scholar] [CrossRef]
  4. Otsu, N. A Threshold Selection Method from Gray-Level Histograms. IEEE Trans. Syst. Man Cybern. 1979, 9, 62–66. [Google Scholar] [CrossRef]
  5. Vincent, L.M.; Soille, P. Watersheds in Digital Spaces: An Efficient Algorithm Based on Immersion Simulations. IEEE Trans. Pattern Anal. Mach. Intell. 1991, 13, 583–598. [Google Scholar] [CrossRef]
  6. Sandler, M.; Zhmoginov, A.; Luo, L.; Mordvintsev, A.; Randazzo, E. Image segmentation via Cellular Automata. arXiv 2020, arXiv:2008.04965. [Google Scholar]
  7. Antony, M.; Sathiaseelan, J.G.R. Optimal Cellular Automata Technique for Image Segmentation. Int. J. Innov. Technol. Explor. Eng. 2020, 9, 1474–1478. [Google Scholar]
  8. Dorigo, M.; Birattari, M.; Stutzle, T. Ant colony optimization. IEEE Comput. Intell. Mag. 2006, 1, 28–39. [Google Scholar] [CrossRef]
  9. Wang, X.N.; Feng, Y.J.; Feng, Z.R. Ant colony optimization for image segmentation. In Proceedings of the 2005 International Conference on Machine Learning and Cybernetics, Guangzhou, China, 18–21 August 2005; Volume 9, pp. 5355–5360. [Google Scholar]
  10. Feng, S.; Zhao, H.; Shi, F.; Cheng, X.; Wang, M.; Ma, Y.; Xiang, D.; Zhu, W.; Chen, X. CPFNet: Context Pyramid Fusion Network for Medical Image Segmentation. IEEE Trans. Med. Imaging 2020, 39, 3008–3018. [Google Scholar] [CrossRef]
  11. Ronneberger, O.; Fischer, P.; Brox, T.J.A. U-Net: Convolutional Networks for Biomedical Image Segmentation. arXiv 2015, arXiv:1505.04597. [Google Scholar]
  12. Oktay, O.; Schlemper, J.; Folgoc, L.L.; Lee, M.J.; Heinrich, M.P.; Misawa, K.; Mori, K.; McDonagh, S.G.; Hammerla, N.Y.; Kainz, B.; et al. Attention U-Net: Learning Where to Look for the Pancreas. arXiv 2018, arXiv:1804.03999. [Google Scholar]
  13. Xiao, X.; Lian, S.; Luo, Z.; Li, S. Weighted Res-UNet for High-Quality Retina Vessel Segmentation. In Proceedings of the 2018 9th International Conference on Information Technology in Medicine and Education (ITME), Hangzhou, China, 19–21 October 2018; pp. 327–331. [Google Scholar]
  14. Vaswani, A.; Shazeer, N.M.; Parmar, N.; Uszkoreit, J.; Jones, L.; Gomez, A.N.; Kaiser, L.; Polosukhin, I. Attention is All you Need. In Proceedings of the he Thirty-First Annual Conference on Neural Information Processing Systems (NIPS), San Diego, CA, USA, 4–9 December 2017. [Google Scholar]
  15. Caicedo, J.C.; Goodman, A.; Karhohs, K.W.; Cimini, B.A.; Ackerman, J.; Haghighi, M.; Heng, C.; Becker, T.; Doan, M.; McQuin, C.; et al. Nucleus segmentation across imaging experiments: The 2018 Data Science Bowl. Nat. Methods 2019, 16, 1247–1253. [Google Scholar] [CrossRef]
  16. Gutman, D.; Codella, N.C.F.; Celebi, E.M.; Helba, B.; Marchetti, M.; Mishra, N.K.; Halpern, A.J.A. Skin Lesion Analysis toward Melanoma Detection: A Challenge at the International Symposium on Biomedical Imaging (ISBI) 2016, hosted by the International Skin Imaging Collaboration (ISIC). arXiv 2016, arXiv:1605.01397. [Google Scholar]
  17. Tschandl, P.; Rosendahl, C.; Kittler, H. The HAM10000 dataset, a large collection of multi-source dermatoscopic images of common pigmented skin lesions. Sci. Data 2018, 5, 180161. [Google Scholar] [CrossRef]
  18. Bernal, J.; Sánchez, F.J.; Fernández-Esparrach, G.; Gil, D.; Rodríguez, C.; Vilariño, F. WM-DOVA maps for accurate polyp highlighting in colonoscopy: Validation vs. saliency maps from physicians. Comput. Med. Imaging Graph. Off. J. Comput. Med. Imaging Soc. 2015, 43, 99–111. [Google Scholar] [CrossRef] [PubMed]
  19. Mu, C.C.; Li, G. Research progress in medical imaging based on deep learning of neural network. Zhonghua Kou Qiang Yi Xue Za Zhi = Zhonghua Kouqiang Yixue Zazhi = Chin. J. Stomatol. 2019, 54, 492–497. [Google Scholar]
  20. Philbrick, K.A.; Weston, A.D.; Akkus, Z.; Kline, T.L.; Korfiatis, P.; Sakinis, T.; Kostandy, P.M.; Boonrod, A.; Zeinoddini, A.; Takahashi, N.; et al. RIL-Contour: A Medical Imaging Dataset Annotation Tool for and with Deep Learning. J. Digit. Imaging 2019, 32, 571–581. [Google Scholar] [CrossRef] [PubMed]
  21. Zhao, Y.; Li, J.; Hua, Z. MPSH: Multiple Progressive Sampling Hybrid Model Multi-Organ Segmentation. IEEE J. Transl. Eng. Health Med. 2022, 10, 1800909. [Google Scholar] [CrossRef]
  22. Long, J.; Shelhamer, E.; Darrell, T. Fully convolutional networks for semantic segmentation. In Proceedings of the 2015 IEEE Conference on Computer Vision and Pattern Recognition (CVPR), Boston, MA, USA, 7–12 June 2015; pp. 3431–3440. [Google Scholar]
  23. Diakogiannis, F.I.; Waldner, F.; Caccetta, P.; Wu, C.J.A. ResUNet-a: A deep learning framework for semantic segmentation of remotely sensed data. arXiv 2019, arXiv:1904.00592. [Google Scholar] [CrossRef]
  24. Liu, J.; Kim, J.H. A Variable Attention Nested UNet++ Network-Based NDT X-ray Image Defect Segmentation Method. Coatings 2022, 12, 634. [Google Scholar] [CrossRef]
  25. Zhou, Z.; Siddiquee, M.M.R.; Tajbakhsh, N.; Liang, J.J.D.L. UNet++: A Nested U-Net Architecture for Medical Image Segmentation. arXiv 2018, arXiv:1807.10165. [Google Scholar]
  26. Yang, L.; Zhai, C.; Liu, Y.; Yu, H. CFHA-Net: A polyp segmentation method with cross-scale fusion strategy and hybrid attention. Comput. Biol. Med. 2023, 164, 107301. [Google Scholar] [CrossRef] [PubMed]
  27. Wang, R.; Chen, S.; Ji, C.; Fan, J.; Li, Y. Boundary-aware Context Neural Network for Medical Image Segmentation. Med. Image Anal. 2020, 78, 102395. [Google Scholar] [CrossRef]
  28. Alom, M.Z.; Hasan, M.; Yakopcic, C.; Taha, T.M.; Asari, V.K.J.A. Recurrent Residual Convolutional Neural Network based on U-Net (R2U-Net) for Medical Image Segmentation. arXiv 2018, arXiv:1802.06955. [Google Scholar]
  29. Yu, Z.; Yu, L.; Zheng, W.; Wang, S. EIU-Net: Enhanced feature extraction and improved skip connections in U-Net for skin lesion segmentation. Comput. Biol. Med. 2023, 162, 107081. [Google Scholar] [CrossRef] [PubMed]
  30. Zhan, B.; Song, E.; Liu, H. FSA-Net: Rethinking the attention mechanisms in medical image segmentation from releasing global suppressed information. Comput. Biol. Med. 2023, 161, 106932. [Google Scholar] [CrossRef] [PubMed]
  31. Lu, Z.; She, C.; Wang, W.; Huang, Q. LM-Net: A light-weight and multi-scale network for medical image segmentation. Comput. Biol. Med. 2024, 168, 107717. [Google Scholar] [CrossRef] [PubMed]
  32. Sun, Y.; Dai, D.; Zhang, Q.; Wang, Y.; Xu, S.; Lian, C. MSCA-Net: Multi-scale contextual attention network for skin lesion segmentation. Pattern Recognit. 2023, 139, 109524. [Google Scholar] [CrossRef]
  33. Yuan, Y.; Chen, X.; Wang, J.J.A. Object-Contextual Representations for Semantic Segmentation. arXiv 2019, arXiv:1909.11065. [Google Scholar]
  34. Liu, Z.; Lin, Y.; Cao, Y.; Hu, H.; Wei, Y.; Zhang, Z.; Lin, S.; Guo, B. Swin Transformer: Hierarchical Vision Transformer using Shifted Windows. arXiv 2021, arXiv:2103.14030. [Google Scholar]
  35. Cao, H.; Wang, Y.; Chen, J.; Jiang, D.; Zhang, X.; Tian, Q.; Wang, M. Swin-Unet: Unet-like Pure Transformer for Medical Image Segmentation; Springer: Tel Aviv, Israel, 2021. [Google Scholar]
  36. Huang, X.; Chen, J.; Chen, M.; Chen, L.; Wan, Y. TDD-UNet: Transformer with double decoder UNet for COVID-19 lesions segmentation. Comput. Biol. Med. 2022, 151, 12. [Google Scholar] [CrossRef] [PubMed]
  37. Huang, Z.; Wang, X.; Huang, L.; Huang, C.; Wei, Y.; Shi, H.; Liu, W. CCNet: Criss-Cross Attention for Semantic Segmentation. arXiv 2018, arXiv:1811.11721. [Google Scholar]
  38. Fu, J.; Liu, J.; Tian, H.; Fang, Z.; Lu, H. Dual Attention Network for Scene Segmentation. arXiv 2018, arXiv:1809.02983. [Google Scholar]
  39. Jin, Q.; Meng, Z.-P.; Sun, C.; Wei, L.; Su, R.J. RA-UNet: A Hybrid Deep Attention-Aware Network to Extract Liver and Tumor in CT Scans. arXiv 2018, arXiv:1811.01328. [Google Scholar] [CrossRef]
  40. Hu, J.; Shen, L.; Albanie, S.; Sun, G.; Wu, E. Squeeze-and-Excitation Networks. arXiv 2017, arXiv:1709.01507. [Google Scholar]
  41. Qiu, S.; Li, C.; Feng, Y.; Zuo, S.; Liang, H.; Xu, A. GFANet: Gated Fusion Attention Network for skin lesion segmentation. Comput. Biol. Med. 2023, 155, 106462. [Google Scholar] [CrossRef] [PubMed]
  42. Huang, G.; Liu, Z.; Maaten, L.V.D.; Weinberger, K.Q. Densely Connected Convolutional Networks. In Proceedings of the 2017 IEEE Conference on Computer Vision and Pattern Recognition (CVPR), Honolulu, HI, USA, 21–26 July 2017; pp. 2261–2269. [Google Scholar]
  43. Woo, S.; Park, J.; Lee, J.-Y.; Kweon, I.-S. CBAM: Convolutional Block Attention Module. arXiv 2018, arXiv:1807.06521. [Google Scholar]
  44. Wei, J.; Wang, S.; Huang, Q. F³Net: Fusion, feedback and focus for salient object detection. Proc. AAAI Conf. Artif. Intell. 2020, 34, 12321–12328. [Google Scholar]
  45. Ibtehaz, N.; Rahman, M.S. MultiResUNet: Rethinking the U-Net architecture for multimodal biomedical image segmentation. Neural Netw. 2020, 121, 74–87. [Google Scholar] [CrossRef]
  46. Chen, J.; Lu, Y.; Yu, Q.; Luo, X.; Adeli, E.; Wang, Y.; Lu, L.; Yuille, A.L.; Zhou, Y.J.A. TransUNet: Transformers Make Strong Encoders for Medical Image Segmentation. arXiv 2021, arXiv:2102.04306. [Google Scholar]
  47. Wang, H.; Cao, P.; Wang, J.; Zaiane, O.R. UCTransNet: Rethinking the Skip Connections in U-Net from a Channel-Wise Perspective with Transformer. Proc. AAAI Conf. Artif. Intell. 2022, 36, 2441–2449. [Google Scholar] [CrossRef]
Figure 1. MSDA-Net network structure.
Applsci 14 06299 g001
Figure 2. Multi-receptive field densely connected module.
Applsci 14 06299 g002
Figure 3. Parallel dual-branch attention module.
Applsci 14 06299 g003
Figure 4. Visual comparison of image segmentation results of the 2018 Data Science Bowl dataset.
Applsci 14 06299 g004
Figure 5. Visual comparison of image segmentation results of the CVC-ClinicDB dataset.
Applsci 14 06299 g005
Figure 6. Visual comparison of image segmentation results of the ISIC 2018 dataset.
Applsci 14 06299 g006
Figure 7. Visual comparison of image segmentation results of the Colon Cancer Slice dataset.
Applsci 14 06299 g007
Figure 8. FLOPs distribution scatter plot of different methods. The horizontal axis represents the compared network model, and the vertical axis represents the parameter value. The blue scatter points represent the FLOPs value of the compared methods, and the red scatter points represent the FLOPS of MSDA-Net.
Applsci 14 06299 g008
Figure 9. Parameter distribution scatter plot of different methods. The horizontal axis represents the compared network model, and the vertical axis represents the parameter value. The blue scatter points represent the parameters value of the compared methods, and the red scatter points represent the parameters of MSDA-Net.
Applsci 14 06299 g009
Table 1. Quantitative comparisons with various models on the 2018 Data Science Bowl dataset.
ModelParameter FLOPsAccDicePrecisionIoURecallInfer-T
U-Net [11]14.75 M25.22 G0.9700.9110.9050.8420.9261.79 s
U-Net++ [25]36.63 M105.85 G0.9710.9070.9300.8940.9042.86 s
MultiResUNet [45]7.25 M14.30 G0.9660.8960.9260.8220.8852.36 s
AttentionU-Net [12]34.88 M16.70 G0.9690.9010.8930.8340.9253.33 s
TransU-Net [46]105.28 M25.35 G0.9720.9110.9130.8240.9164.73 s
UCTransNet [47]63.36 M36.12 G0.9680.9010.9100.8270.9044.36 s
Ours99.47 M19.86 G0.9790.9180.9250.8710.9383.41 s
Bolding indicates best results.
Table 2. Quantitative comparisons with various models on the CVC-ClinicDB dataset.
ModelAccDicePrecisionIoURecallInfer-T
U-Net [11]0.9820.9030.9040.8390.9162.61 s
U-Net++ [25]0.9850.9220.9250.8660.9246.20 s
MultiResUNet [45]0.9820.9000.8860.8350.9232.10 s
AttentionU-Net [12]0.9840.9150.9020.8580.9323.12 s
TransU-Net [46]0.9840.9230.9330.8640.9225.12 s
UCTransNet [47]0.9850.9160.9030.8600.9314.47 s
Ours0.9920.9170.9110.8700.9343.45 s
Bolding indicates best results.
Table 3. Quantitative comparisons with various models on the ISIC 2018 dataset.
ModelAccDicePrecisionIoURecallInfer-T
U-Net [11]0.9500.8620.8700.7820.90181.02 s
U-Net++ [25]0.9540.8800.9170.8080.881116.82 s
MultiResUNet [45]0.9580.8880.9110.8170.897102.60 s
AttentionU-Net [12]0.9580.8830.8990.8120.93490.57 s
TransU-Net [46]0.9550.8870.8960.8140.90191.25 s
UCTransNet [47]0.9530.8690.8750.7940.904101.48 s
Ours0.9620.9130.9370.8570.917100.41 s
Bolding indicates best results.
Table 4. Quantitative comparisons with various models on the Colon Cancer Slice dataset.
ModelAccDicePrecisionIoURecallInfer-T
U-Net [11]0.8680.8050.8230.7180.8112.93 s
U-Net++ [25]0.8490.7900.7950.6560.8115.96 s
MultiResUNet [45]0.8510.7640.8280.6720.7462.45 s
AttentionU-Net [12]0.8580.7760.8060.6920.7793.84 s
TransU-Net [46]0.8490.8190.7950.7360.8895.36 s
UCTransNet [47]0.8500.7730.7990.6830.7834.58 s
Ours0.8690.8110.8230.7210.8273.79 s
Bolding indicates best results.
Table 5. Ablation experiments on different datasets.
DatasetMethodAccDicePrecisionIoURecall
CVC-ClinicDBBaseline0.9820.8990.9240.8350.919
Baseline + MRD0.9820.9080.8950.8520.928
Baseline + PDA0.9840.9130.9080.8480.935
MSDA-Net0.9920.9170.9110.8700.934
2018 Data Science BowlBaseline0.9700.9000.9230.8630.914
Baseline + MRD0.9710.9120.9010.8640.916
Baseline + PDA0.9710.9080.9170.8660.921
MSDA-Net0.9790.9180.9250.8710.938
ISIC 2018Baseline0.9580.8830.9030.8160.898
Baseline + MRD0.9600.8990.9140.8240.901
Baseline + PDA0.9600.9010.9230.8270.903
MSDA-Net0.9620.9130.9370.8570.917
Colon Cancer Slice datasetBaseline0.8570.8010.8160.7040.810
Baseline + MRD0.8610.8060.8150.7110.811
Baseline + PDA0.8640.8040.8180.7140.816
MSDA-Net0.8690.8110.8230.7210.827
Bolding indicates best results.
Disclaimer/Publisher’s Note: The statements, opinions and data contained in all publications are solely those of the individual author(s) and contributor(s) and not of MDPI and/or the editor(s). MDPI and/or the editor(s) disclaim responsibility for any injury to people or property resulting from any ideas, methods, instructions or products referred to in the content.

