1. Introduction
With the rapid development of the world economy, the demand for energy consumption is increasing. The scarcity of traditional resources and the need for environmental protection have led to a sharp increase in the demand for renewable energy. Among all renewable energy sources, solar energy, as the most typical one, has attracted widespread attention due to its abundance, almost ubiquitous availability, and clean, renewable characteristics, gradually evolving from standalone power generation to grid-connected power generation [
1]. However, PV power generation is easily affected by various meteorological factors within the region, such as solar irradiance, temperature, and relative humidity, leading to characteristics of randomness, intermittency, and uncertainty in PV power generation [
2]. These uncertainties can degrade real-time control performance, reduce system economy, and jeopardize the stable operation of the power system, posing significant challenges to the management and operation of power and energy systems. To overcome these shortcomings, accurate PV power forecasting is needed.
Regarding the aforementioned issue, scholars have proposed various prediction methods to address the challenges of PV power generation and enhance prediction accuracy. In terms of prediction methods, PV power prediction can be categorized into four main types: (1) statistical and probabilistic methods such as autoregressive modeling (AR) [
3]. Statistical methods are more suitable for ultra-short-term (from seconds to under 30 min) and short-term (30 min to under 6 h) forecasting [
4]. Reference [
5] proposes a short-term probabilistic photovoltaic power forecasting model based on the beta distribution, which improves the forecasting process and results using a semi-parametric method. (2) Machine learning-based methods such as k-nearest neighbor (KNN), support vector machine (SVM), and gradient boosting decision trees [
6,
7,
8]. These methods are also suitable for short-term forecasts. (3) Deep learning methods, which can be divided into three categories: convolutional neural network (CNN) methods, recurrent neural network (RNN) methods, and hybrid models combining both [
9]. RNN usually includes long short-term memory (LSTM) and gated recurrent unit (GRU) [
10]. They can automatically learn complex mappings from input to output and support multiple inputs and outputs [
11]. (4) Physical modeling method is based on NWP (such as solar irradiance, temperature, wind speed, etc.) and the physical characteristics of a photovoltaic system. Such methods can provide a detailed understanding of the behavior of photovoltaic systems and are often suitable for in-depth analysis and simulation of the physical properties of the system. Reference [
12] proposes a probabilistic photovoltaic power forecasting method that combines ensemble numerical weather prediction (NWP) and a chain of physical models. By incorporating quantile regression, this method improves the accuracy and reliability of the forecasts. In addition to the above methods, combinatorial forecasting methods combine the advantages of multiple forecasting methods, such as combining physical models with statistical models, machine learning, or deep learning models, taking advantage of the complementary properties of the different methods to improve prediction performance. These methods are the most widely used in current research.
Photovoltaic (PV) power output forecasting is primarily divided into short-term and medium-to-long-term predictions. For short-term forecasting (less than 6 h), reference [
13] proposes a combined ultra-short-term PV power prediction method considering ground-based cloud images and chaotic characteristics, significantly improving prediction accuracy under sudden irradiance changes caused by moving clouds. For medium-to-long-term forecasting (more than 6 h), reference [
14] presents a method based on copula functions and LSTM networks. This method effectively extracts key meteorological factors and deeply explores long-term dependencies within limited data samples, significantly enhancing prediction accuracy. Reference [
15] introduces a new adaptive discrete gray model, which improves the accuracy and reliability of long-term PV power prediction by incorporating time power terms and periodic terms and optimizing using genetic algorithms.
In recent years, data-driven PV forecasting methods have been extensively studied and applied. These methods integrate machine learning, deep learning, time-series analysis, and feature engineering for PV output prediction. Reference [
16] proposes a deep learning model based on an intelligent fusion gate mechanism for a bimodal feature fusion network, aimed at short-term point-interval prediction of PV power. This model effectively extracts and fuses global and local features of PV power sequences, significantly improving prediction accuracy and stability. In terms of similar day data processing, reference [
17] employs the K-means clustering method to select similar days, reduces multidimensional feature data through factor analysis, and finally models and predicts using the extreme gradient boosting (XGBoost) algorithm, significantly improving prediction accuracy. Combining time–frequency analysis, weather characteristics, and algorithm optimization, reference [
18] uses variational mode decomposition (VMD) technology and K-means clustering for time–frequency analysis of weather-conditioned grouped datasets. The resulting sub-signal sequences are then predicted using an LSTM neural network model optimized by the grey wolf optimizer (GWO). Reference [
19] employs multiscale permutation entropy (MPE) technology to quantitatively evaluate different weather patterns, using these patterns as input features to construct a prediction model with the least squares support vector machine (LSSVM). The study verifies LSSVM’s performance advantage in handling small-scale dataset prediction tasks. However, detailed parameter tuning of the LSSVM model was not conducted in this study, which might affect the model’s generalization performance. Reference [
20] proposes a CNN-LSTM-Transformer hybrid model, where CNN extracts spatial features, LSTM extracts temporal features, and the Transformer’s encoder–decoder strategy improves prediction accuracy by learning the combination of spatiotemporal features. For model capability enhancement, reference [
21] introduces a hybrid model based on guided LSTM, using an improved chicken swarm optimization (ICSO) and predator–prey mechanism to further enhance particle search capabilities, optimizing neural network (NN) weights and biases to improve prediction accuracy. Addressing issues such as data redundancy in VMD, insufficient VMD accuracy, and limited generalization capability of LSSVM in PV power prediction models, reference [
22] proposes an improved VMD (IVMD)-grey wolf optimizer least squares support vector machine (GLSSVM) method, combining grey relational analysis (GRA) and Kendall correlation coefficient (KCC). This integrated approach effectively reduces the complexity of raw data, improves VMD decomposition accuracy, and enhances the model’s generalization capability by optimizing LSSVM parameters, thereby improving PV power prediction accuracy and reliability. In comparative optimization of various models, reference [
23] proposes a meta-learning method that dynamically mixes the base predictions of multiple deep learning models to learn the conditions under which each model performs best, improving the deterministic prediction of PV systems one hour in advance. In terms of utilizing satellite cloud images, reference [
24] presents a time-segmented PV power prediction model based on cloud images. This model improves short-term prediction methods and processes through real-time adjustment of clear-sky PV power estimates and cloud transmittance, achieving high prediction accuracy under various weather conditions and having potential application value in practical grid dispatching.
The methods discussed provide an overview of various existing techniques for PV power prediction, including statistical, probabilistic, machine learning, and deep learning approaches. While these methods have significantly improved prediction accuracy, they still face notable limitations. Traditional methods typically focus on decomposing the PV power data itself without accounting for environmental conditions, leading to incomplete decomposition results. EMD and VMD are single-sequence decomposition methods, and traditional multivariate PV power and meteorological sequence decompositions require multiple applications of these algorithms. The frequencies of the decomposed subsequences cannot be aligned, preventing time–frequency synchronous analysis of multivariate sequences and reducing prediction accuracy. Additionally, as neural network models become more complex with increasing layers, they face issues like low feature learning efficiency, slow training speeds, and overfitting. These challenges hinder the accurate prediction of PV power generation, particularly when dealing with long sequence data and multivariate inputs.
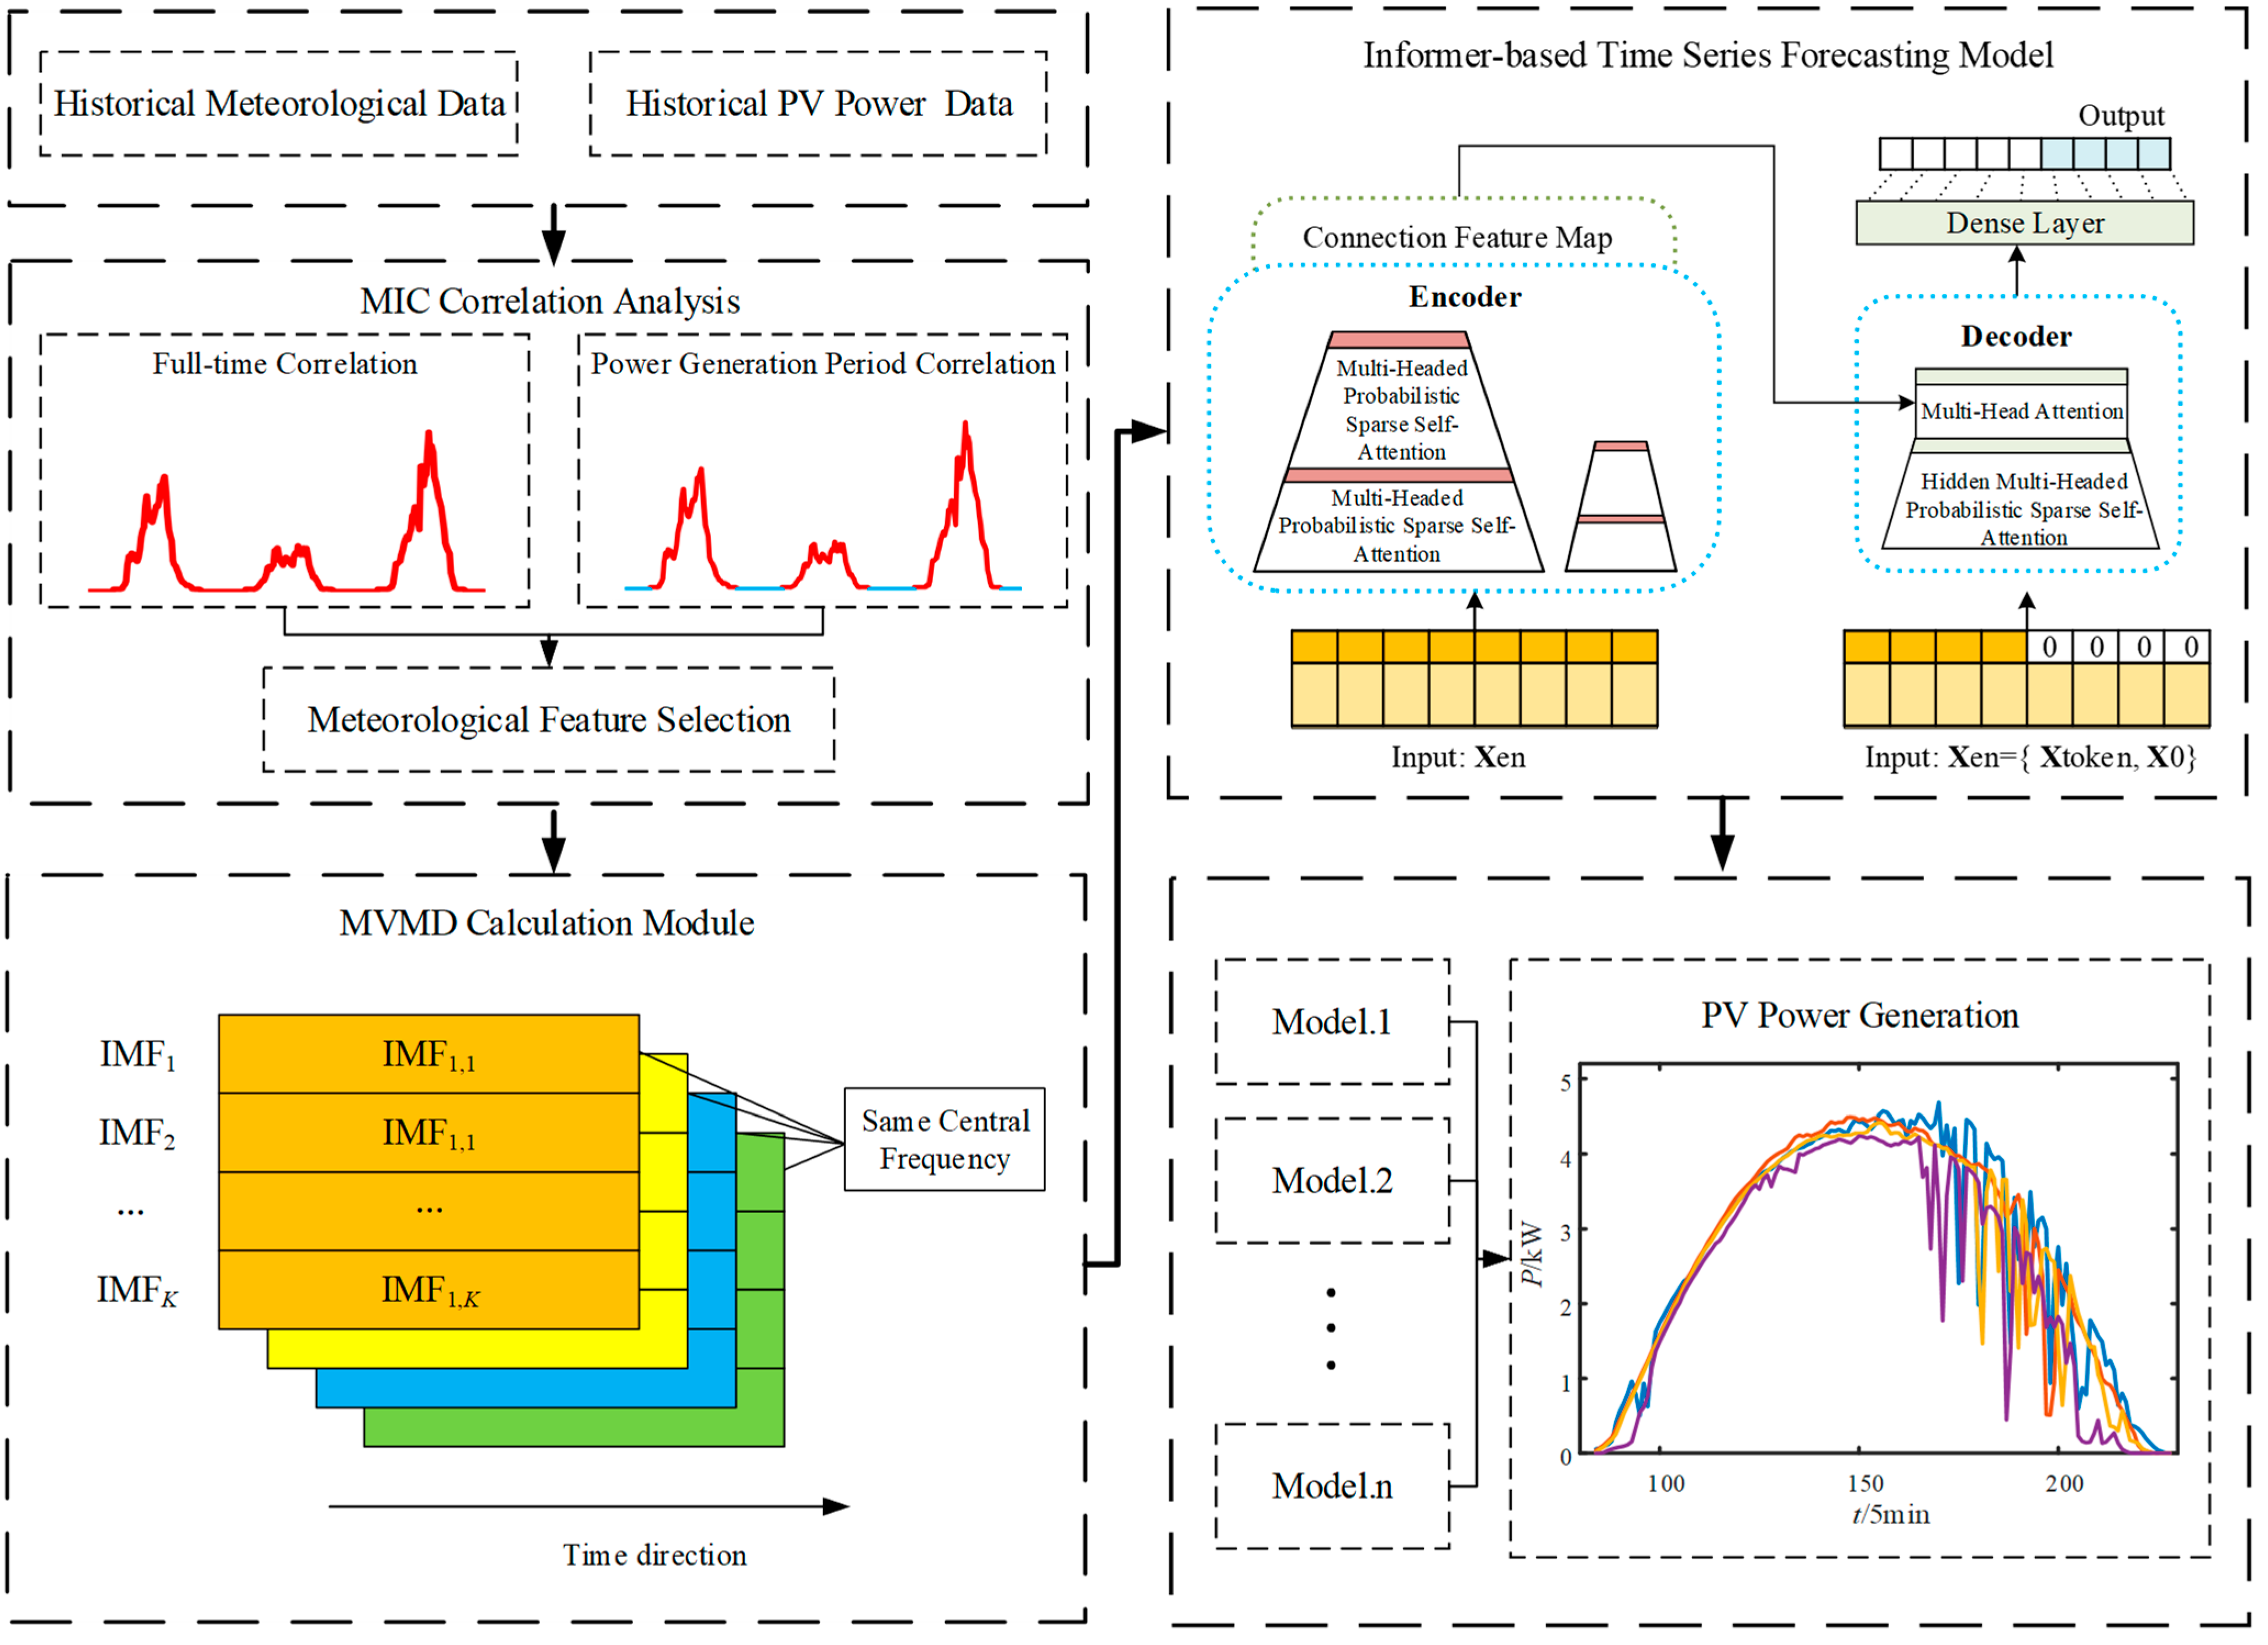
To address these issues, this paper proposes a short-term photovoltaic (PV) power generation forecasting method based on multivariate variational mode decomposition (MVMD) and the Informer model. First, the most relevant weather features to PV power are extracted through maximal information coefficient (MIC) correlation analysis and incorporated into the PV power prediction, enhancing the model’s adaptability to environmental conditions. Next, to comprehensively describe the relationship between PV power and environmental conditions, MVMD is employed for multivariate variational mode decomposition [
25,
26,
27,
28,
29]. This method performs time–frequency synchronous analysis on the PV power sequence combined with the weather data having the highest MIC correlation, obtaining intrinsic mode functions (IMFs) modes characterizing PV power features and corresponding weather feature IMFs modes. By obtaining these frequency-aligned multivariate intrinsic modes, multiple weather factors are introduced into the data decomposition-based prediction method, improving the completeness of data decomposition and the accuracy of predictions. Finally, the Informer neural network model is adopted in the prediction phase [
30,
31]. Based on the respective power IMF sequences, combined with the relevant weather modes of each power IMF, separate Informer prediction models are constructed for training and prediction. The predicted results of different IMF modes are then aggregated to obtain the overall PV power generation forecast. The proposed method’s effectiveness and accuracy are validated using historical data from a PV power station in Shengzhou, Zhejiang Province.
In summary, this paper systematically extracts weather features related to PV power through MIC correlation analysis, employs MVMD for time–frequency synchronous analysis, and achieves the integration of PV power with multidimensional weather factors, thereby improving the completeness of data decomposition and the accuracy of predictions. Additionally, the combination with the Informer neural network model enhances the model’s learning ability and prediction accuracy while significantly reducing computational complexity and memory requirements.
3. Informer Forecasting Model
PV power generation, compared to other new energy sources like wind power, has higher electricity generation and a more stable power pattern. Time-series forecasting methods can predict future power variations based on historical power patterns, giving them a natural advantage in forecasting tasks with strong periodicity.
In recent years, the Transformer model in deep learning has shown far better capabilities in handling time-series problems than traditional recurrent neural network (RNN) models. The Informer model, designed to address time-series data processing and forecasting issues, improves upon the Transformer by addressing three challenges in long time-series forecasting: quadratic self-attention computation, the memory bottleneck of long input stacking layers, and reduced speed in predicting long power generation. This section will introduce the Informer model and propose an improved version for PV power generation.
3.1. Self-Attention Mechanism
In the Transformer, the traditional attention mechanism proposed by the authors calculates the scaled dot product after receiving the input.
In Equation (7),
,
d is the input dimension. The authors of Informer found through experimentation and observation that the self-attention scores of the traditional attention computation method follow a long-tailed distribution. This means that only a small portion of the query matrix
Q significantly contributes to the attention. Therefore, in the Informer model, the attention computation method has been improved to:
In Equation (8), is a sparse matrix that has been filtered through the attention mechanism and is the same size as Q. It only contains queries that significantly contribute to the attention. This process enables the Informer model to maintain high accuracy in long time-series data processing while using less memory and improving computation speed.
3.2. Encoding and Decoding Structure
Informer continues with the encoder and decoder structure of the Transformer, and its structure can be represented in
Figure 1.
The encoder receives long-sequence input and uses a multi-head ProbSparse self-attention module and a self-attention distillation module to obtain feature representations. The multi-head ProbSparse self-attention mechanism replaces the original attention matrix with a sparse matrix, significantly reducing computation requirements while maintaining good performance.
The decoder receives long-sequence input, interacts with the encoded features through multi-head attention, and finally directly predicts the target value. The one-shot generative prediction method used by Informer is faster in inference speed than the step-by-step method while achieving comparable results.
3.3. Loss Function
In this paper, we use the Huber loss function to train the PV power generation model. Its calculation formula is as follows:
Here, yi is the actual power value, ŷi is the predicted value from the model, and δ is the hyperparameter of the Huber loss function, set to 0.5 in this model’s training.
When predicting the total PV power of a large city, two key factors need to be considered when handling large-scale training data. First, the training accuracy must be ensured, and second, the training time required is also an important factor that cannot be ignored. Therefore, to improve the training accuracy without sacrificing training speed, this paper proposes using the Huber loss function in an improved Informer model for PV power generation [
32]. The Huber loss function has a hyperparameter,
δ, which can be adjusted to accommodate different types of power prediction model training.
When the prediction deviation is less than δ, a loss calculation method similar to MSE is used to improve the model’s convergence speed when the gradient of the loss is small. When the prediction deviation is greater than δ, a linear error similar to MAE is used to reduce the impact of large losses caused by outliers on model training, thereby improving the model’s robustness to outliers.
4. PV Power Generation
Based on the methods mentioned above, this paper proposes a short-term PV power generation method using MVMD feature extraction and the Informer neural network model. The structure of the prediction model is shown in
Figure 2.
Firstly, to more accurately extract the weather features most correlated with PV power stations, this paper uses the MIC correlation analysis method to optimize the selection of multidimensional weather factors. MIC can quantify the nonlinear relationship between various weather factors and PV power, which is crucial for capturing the impact of complex weather variables on PV power generation.
Considering that PV power stations have almost no power generation at night, this paper proposes a strategy of performing correlation analysis in different time segments, namely, full-time correlation analysis and power-generation–time correlation analysis. Full-time correlation analysis covers 24 h data, helping reveal common, overall weather-influencing factors. However, since PV power generation mainly occurs during the day, especially during periods of high solar irradiance, power-generation–time correlation analysis focuses on these critical periods, directly identifying the most crucial weather factors affecting PV power. This dual analysis method provides a comprehensive understanding of the impact of weather factors on PV power and allows for a thorough evaluation of the most critical weather features.
Additionally, this analysis method covers not only the daylight hours but also the nighttime. Although photovoltaic stations generate almost no power at night, nighttime meteorological conditions, such as temperatures and humidity, can affect the temperature of the modules during the night and the following morning, thereby impacting the efficiency of power production the next day. For example, if the nighttime temperatures are lower, it may slow down the heat loss from the photovoltaic panels, ensuring that the panels start the day at a relatively lower temperature. As solar irradiance increases, the efficiency of the panels could be higher. Moreover, nighttime weather conditions, such as frost or dew formation, could affect the cleanliness of the photovoltaic panels’ surface, further impacting the next day’s power production efficiency.
Next, to more comprehensively describe the relationship between PV power and environmental conditions, this paper employs MVMD to perform time–frequency synchronized analysis on PV power time series in combination with the meteorological data most correlated to it via MIC analysis.
MVMD, an advanced signal decomposition tool, can simultaneously decompose multiple time series and extract their respective intrinsic mode functions. Using MIC-based correlation analysis, the weather factors most strongly correlated with PV power are selected as input variables. These input variables, along with the PV power time series, are input into the MVMD model and, through decomposition, produce frequency-aligned multivariate intrinsic modes. These frequency-aligned modes not only retain the essential characteristics of each data set but also reveal the coupling relationships between PV power and weather factors across different frequency components, providing multidimensional feature input for subsequent PV power generation. Decomposing PV power and multivariate meteorological sequences into simpler subsequences also reduces the effects of nonlinearity and volatility in PV power time series.
To further enhance the model’s learning ability, an Informer neural network model with a Huber loss function is used during the prediction phase. Based on the corresponding PV power IMFs (intrinsic mode functions), combined with relevant weather modal components, multiple Informer prediction models are built for training and forecasting. Each model predicts different IMFs independently, and finally, the predictions of each IMF mode are combined to yield the forecast value of total PV power generation.
5. Case Study
To verify the effectiveness of the short-term PV power generation method based on MVMD feature extraction and the Informer neural network model, this paper uses historical PV power generation and weather data from the PV station in Shengzhou, Zhejiang Province, China, as experimental data. The historical PV power and meteorological data cover the entire year from 1 January 2023, 00:00 to 31 December 2023, 23:55, with a sampling frequency of 15 min per point and power data measured in MW. The historical PV output data is provided by the State Grid Zhejiang Shengzhou Power Supply Company, and the weather data comes from the European Centre for Medium-Range Weather Forecasts (ECMWF).
5.1. Prediction Evaluation Metrics
This paper uses the root mean squared error (RMSE), mean absolute error (MAE), and mean absolute percentage error (MAPE) as prediction evaluation metrics. Their respective calculation formulas are:
In power prediction, yi is the actual value at time i, and yi′ is the predicted value at time i.
5.2. MIC Correlation Analyss
First, perform the segmented MIC correlation analysis proposed in this paper, which includes full-time correlation analysis and power-generation–time correlation analysis. The MIC correlation coefficients are shown in
Table 1. In this table, total cloud cover refers to the proportion of the sky covered by clouds, usually expressed as a percentage. It significantly impacts solar radiation, particularly direct and diffuse radiation reaching the surface. The irradiance involved in the EC meteorological sources in this paper is global horizontal irradiance (GHI), which is the total irradiance on a horizontal plane, including both direct and diffuse radiation, ranging from 0 to 2000 W/m
2.
From
Table 1, it can be seen that cloud cover shows a moderate correlation with PV power in both full-time and power-generation–time periods. The correlation is slightly higher during the power-generation–time period, indicating that cloud cover has a more significant impact during PV power generation. Solar irradiance is highly correlated with PV power in both time periods, especially over the full-time period, with correlation coefficients exceeding 0.9. This shows that solar irradiance is a decisive factor in PV power. Meanwhile, the correlation between various seasonal meteorological variables and PV power varies significantly. For instance, relative humidity is much more strongly correlated with PV power in summer (July–September) than in winter. This may be because the high humidity in summer reduces the efficiency of PV panels.
After comprehensive analysis, this paper selects total cloud cover, irradiance, relative humidity, and surface temperature as relevant weather features for PV power to proceed with the next MVMD and prediction process.
5.3. MVMD Decomposition
Next, the relevant weather features and PV power time series are combined for MVMD to obtain frequency-aligned multivariate intrinsic modes. Considering that when the number of decompositions exceeds seven, the IMF central frequencies show too many similarities, and having too many decompositions increases the computational burden on the model, this paper sets the number of MVMD
K to seven. The multivariate mode diagram and FFT frequency diagram are shown in
Figure 3 and
Figure 4.
According to
Figure 3, PV power, total cloud cover, irradiance, relative humidity, and surface temperature are input as five channels into MVMD for decomposition. Each channel consists of seven IMF features. Unlike VMD, each channel’s IMF is a feature decomposition chart of multidimensional data in both time and spatial dimensions. IMF1 is the primary decomposition component of each channel, retaining the main feature information. IMF2 to IMF7 in each channel represent different frequency components, with their frequencies progressively decreasing. They represent lower-frequency components or long-term variations over different time scales.
As seen in
Figure 3 and
Figure 4, the same IMF index across different feature channels has a consistent frequency distribution. This indicates that because MVMD can perform multivariate decomposition, the central frequencies of IMF1 to IMF7 obtained from the decomposition of PV power and meteorological factor channels are the same, achieving time–frequency synchronized analysis. This ensures that the prediction model is built at the same central frequency. Therefore, the same IMF index in each channel represents a distinct time scale, providing the model with rich information across different time scales and improving the prediction accuracy for various PV power IMFs.
5.4. Informer PV Prediction
The experimental environment for the Informer model includes Python 3.9, Pytorch 2.0.0 framework, Windows 11 system, with hardware configuration of 16 GB RAM, 12th Gen Intel i7-12700H processor, and NVIDIA GeForce RTX 3060 workstation GPU.
In the prediction phase, for each power IMF, an experimental dataset is built using weather multivariate intrinsic modes of the same frequency. These are then input into the prediction model to train and forecast the predicted results of each mode, which are combined to obtain the overall PV power generation.
In this study, a single day from the experimental dataset is randomly selected as the target prediction day. The data from the preceding 50 days are partitioned into 80% for training, 10% for validation, and 10% for testing to initialize the model parameters. Given that the sampling frequency of the training data is every 15 min, the prediction step length is set to 96. The Adam optimizer is employed, with the learning rate adjusted within the [0, 1] range. Model parameters such as batch size, dropout rate, number of encoders, number of decoders, and the number of training epochs are fine-tuned based on the training dataset. By iteratively selecting different target prediction days and repeating the aforementioned process, a highly generalized model was ultimately developed for subsequent experiments.
Table 2 presents the key parameter settings for the prediction model on the target prediction day.
In the comparison experiment, the models introduced include the non-decomposed Informer prediction model, CNN-LSTM prediction model, WaveNet prediction model, MVMD-CNN-LSTM prediction model, MVMD-WaveNet prediction model, and the proposed MVMD-Informer prediction model. These models are compared to explore the differences between the proposed method and other methods. The actual and predicted power values for the target day are shown in
Figure 5, and the error boxplot is shown in
Figure 6.
Based on
Figure 5 and
Figure 6, the prediction curve of the proposed MVMD-Informer prediction model is the closest to the actual values, yielding the best predictive performance. Comparing the prediction performance across different neural networks, the inclusion of MVMD improves prediction accuracy in all cases, showing that MVMD achieves time–frequency synchronized analysis of PV power and meteorological sequences and performs multivariate decomposition. Therefore, it aligns more closely with the real operating conditions of distributed PV power plants, improving prediction accuracy.
At the same time, the Informer model demonstrates advantages over other models in prediction accuracy and model size. The evaluation metrics for the prediction results are shown in
Table 3.
According to the evaluation metrics data in
Table 3, the proposed MVMD-Informer model performed best in predicting PV power, with the lowest RMSE (0.939 MW), MAE (0.758 MW), and MAPE (4.31%). Notably, compared to the Informer model, the MVMD-Informer reduced RMSE by 62.48%, MAE by 52.18%, and MAPE by 20.92%. Compared to the CNN-LSTM model, the performance improvement was even more significant, with RMSE reduced by 81.67%, MAE by 79.92%, and MAPE by 43.40%. This demonstrates that the MVMD-Informer model combines the temporal decomposition capabilities of MVMD with the self-attention mechanism of the Informer, effectively capturing the dynamic characteristics and long-term dependencies of PV power.
Due to the addition of the MVMD process, the training time of the MVMD-Informer model is longer than that of the Informer model alone. However, this additional complexity is reasonably compensated by a significant improvement in prediction accuracy. Compared to other models incorporating MVMD, the training time of the MVMD-Informer model is also shorter, reduced by approximately 13%. Furthermore, the training efficiency of the Informer model, compared to other models without MVMD, has increased by at least 15%. This indicates that the self-attention mechanism of the Informer model not only enhances prediction accuracy but also improves computational efficiency.
Overall, the MVMD-Informer model strikes a balance between accuracy and computational complexity, making it a robust and efficient method for short-term photovoltaic power generation forecasting.
Moreover, to investigate the impact of different seasons on PV power and the superiority of MVMD over VMD, the model was trained and predicted quarterly. Example plots of days to be predicted for different seasons are shown in
Figure 7. The MAPE error results are shown in
Figure 8.
According to
Figure 7 and
Figure 8, the MVMD-Informer model consistently exhibited the lowest MAPE values across all quarters: 4.46% (January–March), 4.27% (April–June), 4.22% (July–September), and 4.39% (October–December), demonstrating its superiority in handling multivariate information. In contrast, the VMD-Informer model had higher MAPE values, at 5.21%, 4.91%, 4.89%, and 5.11%, respectively. Although the Informer model had its highest MAPE value in the first quarter (6.01%), it gradually decreased over subsequent quarters to 5.66%, 5.51%, and 5.76%.
While VMD can reduce the volatility and nonlinearity of PV power and meteorological sequences, MVMD achieves synchronized time–frequency analysis of these sequences and completes multivariate decomposition. This aligns better with the actual operation of distributed PV power stations and highlights the algorithm’s advantages.
Based on its robustness and accuracy, the proposed short-term PV power forecasting method using MVMD and the Informer model shows extensive application prospects. It can be employed in PV power station monitoring systems for accurate short-term forecasts and optimizing operation and maintenance. Grid dispatch centers can use it for better power generation forecasts, enabling rational load allocation, reducing power curtailment, and optimizing grid operations. Additionally, integrating this method into distributed energy management systems can enhance energy utilization efficiency, reduce costs, and promote renewable energy adoption. In smart grids, accurate forecasts aid in demand response and load balancing, improving grid resilience and reliability. Therefore, this method has significant potential in monitoring systems, grid dispatch, energy management, and smart grids.


