Article

Tiny Machine Learning Battery State-of-Charge Estimation Hardware Accelerated

by
Danilo Pietro Pau
*,† and
Alberto Aniballi
STMicroelectronics, Via Camillo Olivetti, 2, 20864 Agrate Brianza, Italy
*
Author to whom correspondence should be addressed.
These authors contributed equally to this work.
Appl. Sci. 2024, 14(14), 6240; https://doi.org/10.3390/app14146240
Submission received: 31 May 2024 / Revised: 11 July 2024 / Accepted: 12 July 2024 / Published: 18 July 2024

Abstract

:
Electric mobility is pervasive and strongly affects everyone in everyday life. Motorbikes, bikes, cars, humanoid robots, etc., feature specific battery architectures composed of several lithium nickel oxide cells. Some of them are connected in series and others in parallel within custom architectures. They need to be controlled against over current, temperature, inner pressure and voltage, and their charge/discharge needs to be continuously monitored and balanced among the cells. Such a battery management system exhibits embarrassingly parallel computing, as hundreds of cells offer the opportunity for scalable and decentralized monitoring and control. In recent years, tiny machine learning has emerged as a data-driven black-box approach to address application problems at the edge by using very limited energy, computational and storage resources to achieve under mW power consumption. Examples of tiny devices at the edge include microcontrollers capable of 10–100 s MHz with 100 s KiB to few MB embedded memory. This study addressed battery management systems with a particular focus on state-of-charge prediction. Several machine learning workloads were studied by using IEEE open-source datasets to profile their accuracy. Moreover, their deployability on a range of microcontrollers was studied, and their memory footprints were reported in a very detailed manner. Finally, computational requirements were proposed with respect to the parallel nature of the battery system architecture, suggesting a per cell and per module tiny, decentralized artificial intelligence system architecture.

1. Introduction

Electric vehicles (EVs) have seen a significant increase in adoption over the past decade [1]. Sales of EVs, such as city cars, buses, scooters and e-bikes, are supported by a quest for more energy-efficient urban transport. Furthermore, light-duty electric vehicles fit perfectly with new urban mobility macro trends, such as car and bike sharing [2]. Technological advances in electronic devices and batteries have played a major role in successes in recent years; in particular, lithium-based technology [3,4] has established itself as the most widely adopted choice for energy storage in EVs [5]. The price of lithium-ion batteries has been reduced by approximately 97% since their introduction on the market [6], facilitating the market penetration of electric vehicles. Projections of future adoption indicate that EVs could achieve a position of dominance before 2050 within urban areas [1].
EV performance is strongly influenced by the battery and the specific battery management system (BMS). The main responsibilities of the BMS is to ensure the safety and reliability of the battery by estimating the most relevant states of the battery system, such as its state-of-charge (SoC) and state of health (SoH) [7]. The BMS collects real-time data about the temperature, voltage and current of the cells embedded into the battery packs, then uses these data processed by embedded algorithms to estimate SoC and SoH.
SoC measures the amount of energy left inside an electric battery. Its correct estimation is an essential element to ensure the safety of the vehicle and, therefore, the safety of any human using the vehicle or in its proximity. It can be calculated using Equation (1) as follows:
S o C ( t ) = t 0 t I b ( τ ) d τ Q 0 × 100
where I b ( τ ) is the charging current, the charge delivered to the battery is t 0 t I b ( τ ) d τ and Q 0 = t 0 I b ( τ ) d τ is the total charge the battery can hold [8].
SoC plays a key role in the optimized management of the vehicle’s electrical energy, enabling efficient use of battery power. However, the SoC is not a direct observable quantity in a low-cost way, at least from the consumer perspective, and the relationship between it and the observable physical quantities of the battery is not linear. Due to the importance and complexity of the estimation process, SoC prediction has been the focus of numerous recent studies.
Traditional estimation methods not based on machine learning (ML) techniques have shown numerous limitations. One of the simplest approaches to estimate SoC is the Coulomb Counting (CC) method. It has been adopted for small electrical devices due to its simple computational nature. However, the conventional CC algorithm has been deemed unsuitable for the online SoC estimation problem due to the following two main problems: the initial value of the SoC should be known, and high error accumulation tends to occur [9]. Furthermore, the aging process and temperature could affect the accuracy of SoC calculation by varying the Coulomb efficiency. SoC estimation via the Ampere-hour (Ah) counting method has also been widely used due to the low computational complexity required. This algorithm is based on current measurement, representing one of its main problems due to current sensor drift and current measurement error. The current measurement error increases over time and is not reliable without re-calibration [10]. In general, it has been suggested that to achieve acceptable levels of accuracy through Ah counting, a re-calibration of the method is required, which cannot exceed 10 days, and this is not usually allowed for automotive applications.
SoC estimation methods based on closed-loop models, such as filter- or observer-based approaches, overcome the shortcomings of traditional approaches [11]. However, these algorithms rely on a physical model of the batteries, and obtaining an accurate model to simulate the electrochemical dynamics of lithium-ion batteries is extremely challenging [12]. In particular, these approaches consist of the following two steps: physical modeling of the battery and implementation of an algorithm such as an Extended Kalman Filter (EKF), Unscented Kalman Filter (UKF) or Luenberger Observer (LO). However, LO estimation performance may deteriorate considerably in the case of strongly non-linear systems such as battery systems due to its linear properties [13]. The same shortcoming can be highlighted in the case of a simple linear Kalman Filter (KF). Therefore, EKF was proposed, which attempts to linearize through Taylor-series expansion, characterizing nonlinearities of battery models but causing high levels of truncation errors [14]. UKF reduces the error caused by linearization, and it can suffer from divergence between the noise distribution assumed a priori and the true distribution of the real non-linear system, adversely affecting SoC predictions [15]. Although model-based techniques for SoC estimation are powerful, they are characterized by theoretical and practical complications. From a theoretical point of view, these techniques use physical and chemical theories such as electrochemical reaction or polarization consisting of numerous complex equations and functions [16]. On the practical side, there is a need for a domain expert to spend a long period of time developing an accurate and robust physical model because accuracy is influenced by how well the model replicates the real system, which is extremely complex in the case of batteries. The more accurate the model, the more effort that has to be put into the design of the control system. Furthermore, model-based techniques have a long online lead time due to the low speed of complex calculations such as partial differential equations [17]. Model parameter identification is also usually a lengthy and expensive process. Consequently, model-based approaches are often not practical to implement.
In contrast, data-driven SoC estimation can be used successfully without detailed knowledge of the typical processes of the physical battery model [18]. This implies a shorter development time as it did not require the construction of a complex mathematical model and the understanding of complex chemical reactions. In addition, parametrization was performed automatically through self-learning mechanisms in data-driven approaches [19], which were also effective against uncertainties in measurement offsets and noise, as opposed to model-based methods whose performance deteriorated due to uncertainties caused by measurement noise. Thanks to a continuous improvement in computational power and data availability, further ML techniques were developed, such as Deep Learning [20] which proven to outperform traditional ML models in numerous tasks [21]. Among the data-driven models used to estimate SoC, greater accuracy of artificial neural networks (ANN) approaches was noted compared to traditional ML models such as support vector machines [22]. The increase in the usage of ANNs in research was also due to their great ability to fit the dynamics of non-linear systems and their lower complexity in terms of understanding the mechanisms behind the prediction. The performance of feed forward networks (FNN) was overtaken by more sophisticated recurrent ANN [23], due to their greater ability to retain sequential information typical of the nature of the data used to predict the SoC. Simple FNN shown poor performances on time series data [24]. The major limitation of Deep Learning approaches was related to the large number of data needed to train the model. Collecting data and organising it into datasets for monitoring the battery of electric vehicles was achieved by means of new-generation sensors strategically placed in the battery pack. This sensor system allowed a large amount of data to be stored during the use of electric vehicles and then made it available for the training of data-driven techniques [25].
However, it is important to remind that the computational capacity of embedded systems deployed in EVs is limited, while the goal of estimating SoC under short latencies and accurately is of paramount and practical importance. Numerous optimisation techniques have recently been developed to enable the successful deployment of ANN on embedded devices, such as microcontrollers. For instance, 8-bit quantisation allowed the memory footprint of the model to be considerably reduced to a fourth compared to floating point 32 bits (fp32), making possible to combine next-generation edge devices with Artificial Intelligence (AI) capabilities [26].
Technological progress in the low cost hardware components of BMS, such as sensors to measure physical properties of interest and microcontrollers (MCUs) to process signals [27], have made the application of edge AI techniques viable [28]. AI algorithms deployed to MCU make it possible to perform SoC inference, guaranteeing great accuracy to its estimation. Edge AI avoids the use of cloud resources to run AI models, increasing privacy, scalability and by reducing power consumption, memory and latency without the data leaving the edge device where they are collected to feed ML inference workloads. A central feature of edge computing is that computation is moved to the edge of the internet of things (IoT) network within resource-constrained embedded devices that are not equipped to run computationally intensive tasks as the cloud does [29].
In recent years there has been growing attention towards the field of tiny machine learning (TinyML), which aims to combine the powerful inferential capabilities of ANN with the computational efficiency of ultra-low power embedded devices [30]. The cornerstone of TinyML is to reduce the number of ANN’s parameters to the minimum without drastically compromising their performance, so as to obtain accurate results with much lower latency than cloud computing. The TinyML foundation [31] was established in 2019 to federated a community easing the adoption of ML approaches at the edge on resource limited low power (under 1 mW) embedded devices, such as MCU. Therefore, this research focused on the study of tiny ANNs in resource-constrained devices.
This paper is structured as follows. In Section 3, the specific challenge guiding this research is defined. Subsequently, in Section 2, a review of the existing literature is performed. In Section 4, the contribution to the field is presented; Section 5 describes the dataset which shapes the problem under consideration; Section 6 describes the AI topologies subject of accuracy investigations by this paper; Section 7 and Section 9 are dedicated to the experimental and deployability analysis, respectively; Section 12 is dedicated to study computational complexity and inference time required to compute SoC for each cell of the battery pack; Section 13 lists main findings gathered by this work and proposes some future developments.

2. Related Works

2.1. Traditional Machine Learning

Ren et al. [32] reviewed several ML approaches for SoC estimation, including support vector machines and Gaussian process regression, stating their great potential for BMS. Babaeiyazdi et al. [33] investigated the use of features derived from electrochemical impedance spectroscopy measurements and then evaluated the accuracy of SoC prediction through linear and Gaussian process regression. The results indicated that the features introduced by electrochemical impedance positively influenced the estimation accuracy. Mediouni et al. [34] evaluated linear regression, support vector machines (SVM), ensembling methods and gaussian process regressor (GPR) in terms of accuracy and robustness in estimating SoC of LGHG2 lithium batteries under different temperatures. GPR achieved the best performance with an RMSE of 1.3%. Mithul and al. [35] also used LGH2 batteries to evaluate the performance of ML models, random forest (RF) achieved the best accuracy on the LG dataset [36]. In Stighezza et al. a support vector regression (SVR) algorithm was developed to estimate SoC of a Panasonic 18650 battery cell, exploiting constant current profiles to train the model, thus avoiding the need for vehicle-dependent data [37]. Zhao et al. [38] implemented an ensemble learning approach by improving generalisation and accuracy from four basic ML models: linear regressor, RF regressor, GPR, gradient boosting regressor. Tan et al. improved the estimation of SVR by means of an EKF-RLS parameter identification method [39]. Babaeiyazdi et. al included the phenomenon of battery degradation to predict SoC, in particular the cells were degraded from 100% of the state-of-health (SoH) down to 60%. Cell data came from the public NASA dataset [40], which allowed cells to be categorized into 3 different categories based on their SoH. In this work RF and gaussian process models achieved the lowest mean absolute error values [41].

2.2. Artificial Neural Networks

Due to high non-linear relationship between input data and output data, numerous research works introduced ANN as they have an inherent ability to learn non-linear input-output mappings [42]. Chandran et al. [43] decided to use ANN in addition to other traditional ML models. ANN recorded the best performance in terms of MSE and Root MSE concluding that deep learning approaches were appropriate for accurate SoC estimation. In the study proposed by Siva Suriya Narayanan et al. [44] several ML algorithms were developed to estimate the SoC through the relationship with open circuit voltage. ANNs achieved the best results for each operating temperature in comparison with decision tree (DT), ensemble boosting, ensemble bagging, and support vector machines. El et al. [45] tested the performance of deep NN using data from batteries exposed to varying dynamics and presented a comparative study between the experimentally measured SoC and the SoC obtained in simulations at different temperatures and under different profiles. Guo et al. compared multiple state-of-the-art DL methods, and the results revealed that the FC model was the worst in terms of accuracy [46]. Dao et al. [47] designed a SoC estimator based on EKF combined with a multi-layer perceptron (MLP), whose input data were only current, voltage and temperature. By combining the two approaches, the number of network weights and the required computation could be reduced, and by including EKF in the ANN it was possible to achieve the model adaptability to the dynamics of the battery system. The combined EKF-MLP outperformed approaches using EKF and MLP used independently, the maximum SoC error in charge and discharge was 2.3% and 2.6%. Liu et al. [48] merged a back propagation (BP) neural network with an EKF algorithm, enhancing the model accuracy. Che et al. proposed a transfer learning strategy to improve the monitoring of battery states under different application scenarios [49].
Tian et al. developed a convolutional ANN (CNN) fed with partial charging data. The model included n CNN blocks, where each CNN block was formed by a 1D convolution layer, followed by a batch normalisation and a ReLu activation layer; the architecture ended with a global averaging pooling and a dense layer. The CNN model was the most accurate in comparison to non ANN approaches [50]. Hannan et al. tested the ability of a deep fully convolutional (FCN) model to estimate the SoCof a Panasonic 18650 lithium battery cell at constant ambient temperature and varying temperature over different drive cycles. The proposed architecture recorded lower RMSE and fewer floating-point operations per second (FLOPs) than recurrent models (RNN) such as long short-term memory (LSTM) and gated recurrent units (GRU). The experiment was conducted on a GTX1080Ti GPU [51]. Shibl developed a RNN architecture for estimating SoC of electric air vehicles. The model consisted of two LSTM layers with 100 and 60 neurons, two Dropout and two Dense layers; this network had the Nash–Sutcliffe model efficiency coefficient (NSE) of 0.023 [52]. Reddy et al. [53] introduced GRU into their RNN topologies to capture the dependency between past input and present output. In particular, the GRU-RNN network was built with a minimum number of GRUs so as to make the computation more efficient. The number of fp32 operation was reduced by 56 times compared to [54]. The ANN was subsequently deployed on a Teensy MCU and estimated SoC was achieved in 0.215 s. Huang et al. proposed a mixed CNN-GRU model trained on FUDS data. In the proposed neural architecture a 1-D convolutional layer was followed by two GRUs layers then connected to a fully connected layer linked to the output corresponding to the battery SoC [55]. Li et al. also developed a data-driven model by combining CNN and LSTM, the results indicated an accurate estimate of the SoC with RMSE below 0.31% [56].
Given the sequential nature of lithium battery data, some papers experimented specific CNN designed to capture temporal dependencies in the dataset. Liu et al. studied the effectiveness of dilated, causal 1D convolutional layers in estimating the SoC. After testing the feasibility of the proposed model, the authors suggested further investigations toward the use of compression techniques on this type of ANN [57]. Other works [58,59,60] employed other advanced deep neural architectures, without, however, analysing their memory footprint and their number of parameters. Both of them are crucial aspects for EVs as they are usually equipped with in-vehicle computing platforms with low computational power. Hong et al. [61] modeled an embedded environment consisting of two Raspberry PI boards, one for acquiring data and the other for calculating the SoC, to check whether the chosen algorithm met the real-time requirements of estimation. The authors concluded that under conditions of reduced computational resources, it was adequate to use the EKF instead of the UKF, as the latter shown a 12.4% higher computational cost on average. Mazzi et al. [62] tested the performance of the CNN and GRU after optimising the size of the two models using TensorFlow Lite [63] and STM32Cube.AI [64]. The evaluation of the models was conducted in terms of accuracy and average inference time on an STM32F429ZI discovery board. From the results achieved in estimating the SoC, the work suggested a 1D CNN model quantized through the ST Edge AI Developer Cloud (https://stm32ai-cs.st.com/home (accessed on 13 July 2024)) framework.
Minimal research has deepened the joint estimation and MCU deployability performances of other DL architectures for SoC estimation under conditions of reduced computational and memory capacities. This suggested the need to further explore the usability of these advanced models on low-power platforms. Following the analysis of many studies, this paper proposed to compare on the same dataset tiny ANN of the following topologies: FNN, LSTM, GRU, temporal convolutional network (TCN), Legendre memory units (LMU). This because each of these approaches were claimed to achieve best results under certain conditions or by processing a given dataset. Bai et al. [65] verified the validity of using CNN for sequential problems by introducing TCN. Voelker et al. proposed a new memory cell for recurrent networks in their paper, the LMU [66], claimed that it could efficiently deal with long temporal dependencies. For these reasons, TCNs and LMUs were investigated by this work too.

3. Problem Definition

Estimating the SoC through a physical model is known to be a complex task as it is directly depending on the integration procedure (1). Thus, many data-driven ML methods have been used to calculate SoC. Unfortunately, these models shared a computationally intensive nature and were therefore impractical to be deployed on low-power MCUs, typically deployed in EVs embedded architectures. Furthermore, the accuracy of a model couldn’t ignore its deployability in a real automotive application context.
The problem addressed by this paper was how to compare and measure quantitatively, on the same dataset provided by IEEE, the suitability of heterogeneous ANNs architectures in MCUs and MPUs that can be used in real BMS of EVs, characterizing their accuracy and also their requirements in terms of memory footprint and computational time with respect to their deployability on off-the-shelf MCU.

4. Proposed Contribution

In this work, multiple tiny ANNs were designed and tested to estimate SoC of an electric car battery. Once the tiny models have been developed, and their accuracy assessed, they were converted into ANSI C code through STM32 Edge AI [67] Developer Cloud framework that enabled to evaluate through deployment in an automated fashion their computational performance on different tiny off-the shelf MCUs. Then, the pre-trained networks were quantized, reducing the precision of the model’s weights and activations from fp32 to 8 bits (integer), to make them cheaper once deployed on a low-power STM32 MCU into which memory they were embedded. The 8-bit networks were accelerated and their memory footprint was re-evaluated. Since BMS architectures monitors EV batteries populated by an high number of cells, system architecture studies were conducted to size the memory and computation time for effective applicability on practical systems featuring low latency processing.

5. Dataset Description

The data on which the models were trained and tested were derived from the public IEEE dataport dataset composed of data from 72 real driving cycles of a BMW i3 car powered by a battery with a capacity of 60 Ah [68]. This data source contained data on driving behaviour but also on the car’s secondary services, such as air conditioning, and the environmental conditions under which the vehicle was affected by. The existing literature suggested that these three factors influenced the energy consumption of EVs [69,70,71], therefore this work decided to rely on this dataset. Each trip had a varying amount of time steps, while each step was composed by 47 features:
  • environment data, such as temperature and elevation;
  • vehicle data, such as velocity and throttle;
  • battery data, such as voltage, current, temperature and SoC;
  • heating circuit data, such as internal temperature and heating power.
About the IEEE dataport dataset, only the cycles belonging to category B were consistent, therefore all trips in category A were not considered by this study. In addition, data from driving cycles were discharged and where the battery was recharged during the trip, as shown in Figure 1, there are trips that recorded an increase in SoC over time. Eventually, category B trips chosen to train the models were numbered as follows: 01, 06, 14, 15, 17, 18, 19, 22, 30, 35. Two independent test sets were created to evaluate the performance of the models on unseen data, the first had cycles 10 and 16, the second had cycles 10 and 37. The final dataset used to train the tiny ANNs consisted of 191,203 instances. The first test dataset included 35,517 instances, while the second had 34,403 instances.
To predict the SoC, feature selection was performed from the initial 47 features characterising each observation. In particular, each feature was plotted to verify the presence or absence of anomalies. Subsequently, correlation between different variables was studied (Figure 2) to identify and remove highly correlated variables, thus improving the computational efficiency of the training phase without losing relevant information.
As explained by [72], the BMW i3 featured a 96-cell battery pack. To model the battery behaviour accurately, an Equivalent Circuit Model (ECM) was defined at the pack level, including ohmic resistance. The reference model was parameterised using measurement data and further tests. Separate measurements were conducted to determine the static effect of the Open Circuit Voltage (OCV), crucial for accurately estimating the SoC. Charge and discharge measurements were performed at low currents, less than 3 A, to minimise dynamic effects. Charging was carried out at an average current of 2.8 A and discharging at an average of 2.5 A, with additional load from vehicle systems such as headlights and ventilation. The data collected were used to set a look-up table dependent only on the SoC, which was initially determined using an Ah counting method. Therefore, the referenced SoC of the battery pack of the BMW i3 was obtained through a combination of physical measurements, like current and voltage during charge/discharge cycles, and subsequent modelling using an ECM, which integrated dynamic and static effects to accurately represent battery behaviour.
The correlation matrix (Figure 2) on the 47 features showed a high correlation between all features belonging to the vehicle temperature measurements, i.e., not the external ambient and battery temperature. In addition, there were other combinations of variables characterised by a strong correlation, like: Heating Power CAN, Heating Power Lin and Requested Heating Power. To avoid the multi-collinearity problem [73], Figure 3 10 features were chosen to tackle the regression task. For this reason, every sample in both the testing and training datasets consisted of 10 features and the SoC target ground truth. Each instance represented a distinct point in time during the driving journey and thus provided a snapshot of the relevant data collected from the vehicle at that instant. The 10 features characterising each observation and their correlation matrix are described as follows:
  • Battery Current [A]: this column indicated the amount of electric current flowing into the vehicle’s battery. Electric current is measured in amperes (A) and represents the rate of flow of electric charges within the battery.
  • Battery Voltage [V]: it referred to the electrical potential difference across the terminals of the vehicle’s battery. It is measured in volts (V) and indicates the level of electrical charge stored in the battery.
  • Battery Temperature [°C]: this feature provided information about the temperature of the vehicle’s battery in degrees Celsius (°C).
  • Velocity [km/h]: it represented the speed of the vehicle and is measured in kilometers per hour (km/h).
  • Throttle [%]: throttle percentage indicated the position of the accelerator pedal as a percentage of its full range. It reflects the driver’s input in terms of acceleration or deceleration of the vehicle.
  • Requested Heating Power [W]: this column represented the amount of power requested for heating purposes in the vehicle, measured in watts (W).
  • Heater Voltage [V]: it referred to the electrical potential difference across the heater component in the vehicle, measured in volts (V).
  • Elevation [m]: it indicated the height of the vehicle’s location above sea level and is measured in meters (m).
  • Ambient Temperature [°C]: it represented the temperature of the surrounding environment outside the vehicle, measured in degrees Celsius (°C).
  • Cabin Temperature Sensor [°C]: this feature indicated the temperature measured by a sensor located inside the vehicle cabin, measured in degrees Celsius (°C).
Both the testing and training data were normalised through the MinMaxScaler approach, as the features had different ranges of values so the scaling process had a positive effect on the predictive capabilities of the supervised learning models developed. In particular, the statistics utilised to scale the training dataset were the same as those used to scale the test data in order to ensure that the parameters of the training transformation were the same as those employed in the testing phase. Furthermore, the datasets were processed in order to generate windows comprising exactly 100 consecutive samples. In this way, the pre-processed training and test datasets contained data representing windows of 100 consecutive sequential observations where each was characterised by 10 features. As a consequence, the models input was a tensor with shape 100 × 10 features.

6. Tiny Architectures Description

This section details the topologies considered by this work and applied to the cross benchmarking. The neural architectures were designed with a reduced number of parameters with respect to the number of training samples, in particular the maximum threshold limit was given by a reduction factor of 10 with respect to 191,203 observations. The number of layers and neurons comprising each of the following tiny ANN architectures was carefully selected by means of the KFold cross validation technique. In particular, the training dataset was divided into five folds of equal size. In each iteration, 4 folds were used for training and 1 single fold for validation. Each model was therefore trained 5 times using different training and validation data each time, and then the mean error across the 5 folds was calculated for each specific model. Finally, the architecture with the lowest mean error across the 5 folds was chosen.

6.1. Feedforward Neural Network

The implemented FNN architecture was defined sequentially. The first component of the network was a dense layer of 128 neurons, characterised by the rectified linear unit (ReLU) activation function [74]. The input shape was (100, 10), because the input data consisted of 100 samples, each with 10 features; neuron weights were initialized using a normal distribution. Furthermore, a kernel regularizer with L1 and L2 penalties was applied to the kernel weights to prevent overfitting [75]. Following the dense layer, batch normalization was introduced to normalise previous layer activations. Batch normalization helped stabilize and accelerate the training of ANN by reducing internal covariate shift. Subsequently, a dropout layer with a dropout rate of 0.2 was introduced in the model to randomly drop a fraction of the input units during training, thus further reducing the possibility of overfitting [76]. This sequence of dense, batch normalization, and dropout layers was repeated twice more with decreasing layer sizes: the second dense layer had 64 neurons and the third dense layer had 32 neurons, both followed by batch normalization and dropout. A flatten layer was added to reshape the tensor output into a one-dimensional array, preparing it for the subsequent output layer. Finally, the last dense layer had a single neuron and it outputted the continuous value corresponding to the SoC estimate. Also this last output layer was characterized by a kernel regularizer with L1 and L2 penalties. The FFN architecture is shown in Figure 4.

6.2. Long Short-Term Memory Network—Stateless

The LSTM-based architecture started with a LSTM layer consisting of 32 memory cells, with the hyperbolic tangent (tanh) activation function. The parameter ’stateful’ was set to false in the LSTM layer, indicating that the model would not maintain its state across batches. In this way, the hidden states of the LSTM cells were reset for each new batch during training, which is suitable for scenarios where the sequential data are not characterised by long-term temporal correlation structure across batches. The input shape was (100, 10), indicating 100 time steps and 10 features for each model input. Kernel regularization with L1 and L2 penalties was applied to the LSTM kernel weights to mitigate overfitting [75]. A 0.2 dropout rate was added after the LSTM layer. A dense layer with a single neuron and linear activation was utilized as the output layer to output SoC prediction. The stateless LSTM-based architecture is shown in Figure 5.

6.3. Long Short-Term Memory Network—Stateful

The first layer of the proposed architecture was a LSTM layer with 16 memory cells and tanh activation function. The input dimensions were (1, 100, 10), indicating a batch size of 1, 100 time steps, and 10 features. Additionally, kernel regularization with L1 and L2 penalties was applied to the LSTM kernel weights to mitigate overfitting. The parameter ’stateful’ was set to true in the LSTM layer, indicating that the model would preserve states across training batches in order to capture long-term dependencies across sequences. A dropout layer with a dropout rate of 0.2 was added after the first and second LSTM layers. Also the second LSTM layer, formed by 8 memory cells, was configured to operate in a stateful mode. The last dense layer had a single neuron used to estimate SoC through linear activation function. The stateful LSTM-based architecture is shown in Figure 6.

6.4. Gated Recurrent Unit Network—Stateless

The architecture consisted of a GRU layer configured with 32 units and tanh activation function. The input shape was (100, 10), indicating 100 time steps and 10 features per model input. The parameter ‘stateful’ was set to false in the GRU layer, indicating that the model would not preserve its state across batches. In this way, the hidden states of the GRU cells were initialised for each new batch during training, which is suitable for scenarios where the sequential data are not characterised by long-term temporal correlation structure across batches. A dropout layer with a dropout rate of 0.2 was attached to the network to prevent overfitting. The output, SoC, was calculated from a dense layer of a single neuron through linear activation function. The stateless GRU-based architecture is shown in Figure 7.

6.5. Gated Recurrent Unit Network—Stateful

The developed architecture started with a GRU layer composed of 32 units and batch input shape (1, 100, 10), indicating a batch size of 1, 100 time steps, and 10 features. Tanh was chosen as activation function for the GRU and kernel regularization with L1 and L2 penalties was utilized to regularize GRU weights. The parameter ’stateful’ was set to true in both GRU layers, indicating that the model would preserve states across training batches in order to capture long-term dependencies across sequences. A dropout layer characterised by a dropout rate of 0.2 was appended to randomly drop a fraction of the input units during training. Finally, the last dense layer computed SoC estimate through linear activation of a single neuron. The stateful GRU-based architecture is shown in Figure 8.

6.6. Temporal Convolutional Network—Parallel Ensemble Approach

The architecture was based on three parallel branches, each consisting of a specific TCN, producing three outputs merged into one. Combining the output of different neural networks predicting the same target variable is a common ensembling technique to improve predictive performance over the task [77]. However, the model developed by this work was not based on three independently trained ANN, and consisted of three TCN branches with different structures trained together as they were part of the same model. TCN met the constraint of at least 10 times less number of model’s parameters then the training data; and also minimised the error achieved on the validation dataset. Experiments with a different number of parallel branches were performed, and the error metric guided this work toward the architecture here reported.
The proposed TCN was based on two main concepts: preventing information leakage from the future to the past and residual connections (or shortcut connections, skip connections). As suggested by the authors [65], the technique of causal convolutions was applied; the use of causal padding meant that the output of the 1D CNN layers at time t depended only on contemporaneous or preceding elements of previous layers. The connection in the residual block was implemented by employing a 1 × 1 convolution due to the difference among the number of filters used and the size of the input data. By using the optional 1 × 1 Convolution layer, it has been ensured that the shortcut connection could be successfully performed.
A TCN branch consists of a Residual Block as shown in Figure 9 (RB) which can be used to build a more complex topology as shown in Figure 10, Figure 11 and Figure 12. When several RBs were used within the branch of TCN, as with the second branch (Figure 11) and third branch (Figure 12), the output of the entire branch was calculated by imposing skip connections between the individual outputs of each RB. Skip connections among RB were used to mitigate the vanishing gradient problem, as in deeper branches, there was a risk that the gradient of the loss function would become small during BP and thus slow down or block the learning process. This hypothesis was confirmed by the results achieved, introducing skip connections resulted in a marked improvement in the performance of the model.
A single RB consists of the following layers (Figure 9):
  • The first layer performs a 1-dimensional convolution with a specified number of filters, kernel size and dilation rate. Causal padding was adopted to keep temporal causality and kernel weights were initialized using He initializer.
  • Batch normalization was applied to the output of the first 1D CNN to stabilize the training of the neural network.
  • The ReLU activation function is then employed on the batch normalization output, convolution is a linear operation so this activation layer was meant to introduce non-linearity into the block.
  • A 0.05 spatial dropout followed the activation layer.
  • A second 1D convolutional layer was put within the residual block, it had same parameters of the first 1D CNN and it was connected to the dropout output.
  • Batch normalization was applied to the output of the second 1D CNN.
  • The ReLU activation function was computed on each output neuron of the previous batch normalization.
  • A 0.05 spatial dropout followed the activation layer.
  • A 1D CNN featured a kernel size of 1 and it was connected directly to the input layer to successfully perform shortcut connection.
  • An Add layer performed addition on the outputs of the 1 × 1 1D CNN and the final ReLU to match initial lenght.
  • After reconstructing the initial size, the ReLU activation was calculated again and this was the last Residual Block layer.
In the case of several sequentially connected RB, the output of the last ReLU activation was used as the input of the next block, thus ensuring that each RB had an input of the same size.
The architecture of the proposed model had three parallel TCN branches, which are described below.
  • The first TCN branch had 1 RB (Figure 9) where both 1D convolution layers had a number of filters equal to 16, a dilation rate of 1 and a kernel size equal to 2 (Figure 10).
  • The second TCN branch had 2 sequentially connected RBs (Figure 9); in this case the first block had a filter count of 16, a dilation rate of 1 and a kernel size of 4. The second block received as input the output of the first RB; number of filters, dilation rate and kernel size were 16, 2 and 4 respectively in this second block. The output of the second TCN branch was calculated using skip connections a final Add layer added the output of the first and second RB (Figure 11).
  • The third TCN branch had 3 sequential RBs (Figure 9); the first block had a filter count of 16, a dilation rate of 1, and a kernel size of 6. The output of the first block was delivered to the second RB, for which a number of filters, dilation rate and kernel size of 16, 6 and 2 were chosen. The third RB, sequentially connected to the second, employed two 1D CNN layers with a filter number of 16, kernel size of 6 and dilation rate of 4. The skip connections technique was also used for this third TCN branch to compute the output, and the Add layer added the outputs of the 3 RBs (Figure 12).
The ensembling layer averaged the outputs of the three parallel TCN branches, (Figure 10, Figure 11 and Figure 12) and then it was connected to a dense layer with 8 neurons and a ReLU activation function. A final Dense layer with a single neuron and a linear activation function was used to predict the SoC. The TCN-based architecture is shown in Figure 13.

6.7. Legendre Memory Unit Network

The LMU-based architecture first layer served as the entry point for the sequential data and the input shape was (100, 10). This indicated that it could accept sequences of 100 time steps, where each time step had 10 features. The LMU layer was the focal point of this topology and it was directly connected to the input layer. It leveraged Legendre polynomials to capture temporal dependencies and to augment the network’s memory. The parameters of the LMU layer included: memory_d, order, theta, hidden_cell, memory_to_memory. Memory_d parameter defined the dimensionality of the LMU’s internal memory. The LMU was set to keep a memory state of dimension 10. The order of the Legendre polynomial by the LMU was set to 3. Theta was the integration time constant, influencing the decay rate of the internal memory, and it was set to 1. Hidden_cell represented the type of recurrent cell used within the LMU. A LSTM cell with 50 units was employed to process the input data. Memory_to_memory was a boolean parameter set to true indicating whether to allow direct connections from memory to memory. This facilitated the propagation of information across time steps within the network. The LMU layer was followed by a dense layer with 8 neurons and the Rectified Linear Unit (ReLU) activation function. The last layer was responsible for predicting the SoC value, a single neuron was present in this layer. The LMU-based architecture is shown in Figure 14.

7. Experiments and Accuracy Results

All experiments were conducted with Google Colab, CPU runtime selected, in a Python 3.10.12 environment with the following library versions:
  • keras == 2.15.0,
  • numpy == 1.25.2,
  • pandas == 2.0.3,
  • scikit-learn == 1.2.2,
  • scipy == 1.11.4,
  • TensorFlow == 2.15.0.
To allow reproducibility of the results, a random seed was set to initialise the pseudorandom number generator. Zero value was set as it was the most common choice https://www.kaggle.com/code/residentmario/kernel16e284dcb7 (accessed on 13 July 2024). The seed was set in Python, Numpy and TensorFlow via the set_random_seed https://www.tensorflow.org/api_docs/python/tf/keras/utils/set_random_seed (accessed on 13 July 2024) command available in TensorFlow’s utils library. In addition, the following environment variables were set equal to 1:
  • TF_DETERMINISTIC_OPS, introduced to ensure determinism in operations, i.e., to achieve the same result each time the program was executed with the same inputs.
  • TF_NUM_INTRAOP_THREADS, introduced to limit the number of threads to 1 in parallel execution within individual operations.
  • TF_NUM_INTEROP_THREADS, introduced to limit the number of threads to 1 in parallel execution between multiple operations.
  • OMP_NUM_THREADS, introduced to limit the number of threads used by OpenMP to 1.
The seed within the pseudorandom number generator and the environment variables described above were set to provide reproducibility and consistency of each model performance. Table 1 shows the number of parameters of each model in the first column and the ratio between the amount of training data and the number of parameters in the second column.
To add robustness to the accuracy values achieved during the training phase and to reduce the risk of the models being overfitted to the data, the K-fold cross validation (CV) was adopted. The training dataset was divided into five different folds and therefore each model was trained five times: each training took place on 4 folds and 1 validation fold, with the validation fold changing for each training. The optimiser Adam was chosen as the stochastic gradient descent algorithm, the loss function to optimise on was Mean Squared Error (MSE) because of the regression problem to be solved. To further reduce the risk of overfitting, the technique of Early Stopping versus calculated loss on the validation fold was introduced with a patience parameter equal to 50. Table 2 shows the average of the 5 MSE values achieved during the K-fold CV for each model.
Before deploying the models on an embedded tiny MCU, their accuracy were evaluated on the two test groups described in the Section 5. The Table 3 shows the MSE values of the ANN architectures achieved using the test data. The computed MSE was dimensionless because the target variable SoC on which the error was measured represented the percentage ratio between two values having the same unit of measurement, in this case the measured quantity was current so the unit of measurement was ampere (A). By dividing two values with the same unit of measurement, a dimensionless result was obtained. The Table 4 shows the Mean Absolute Percentage Error (MAPE) values of the ANN architectures achieved using the test data which confirms the TCN lowest error on both test cycles.
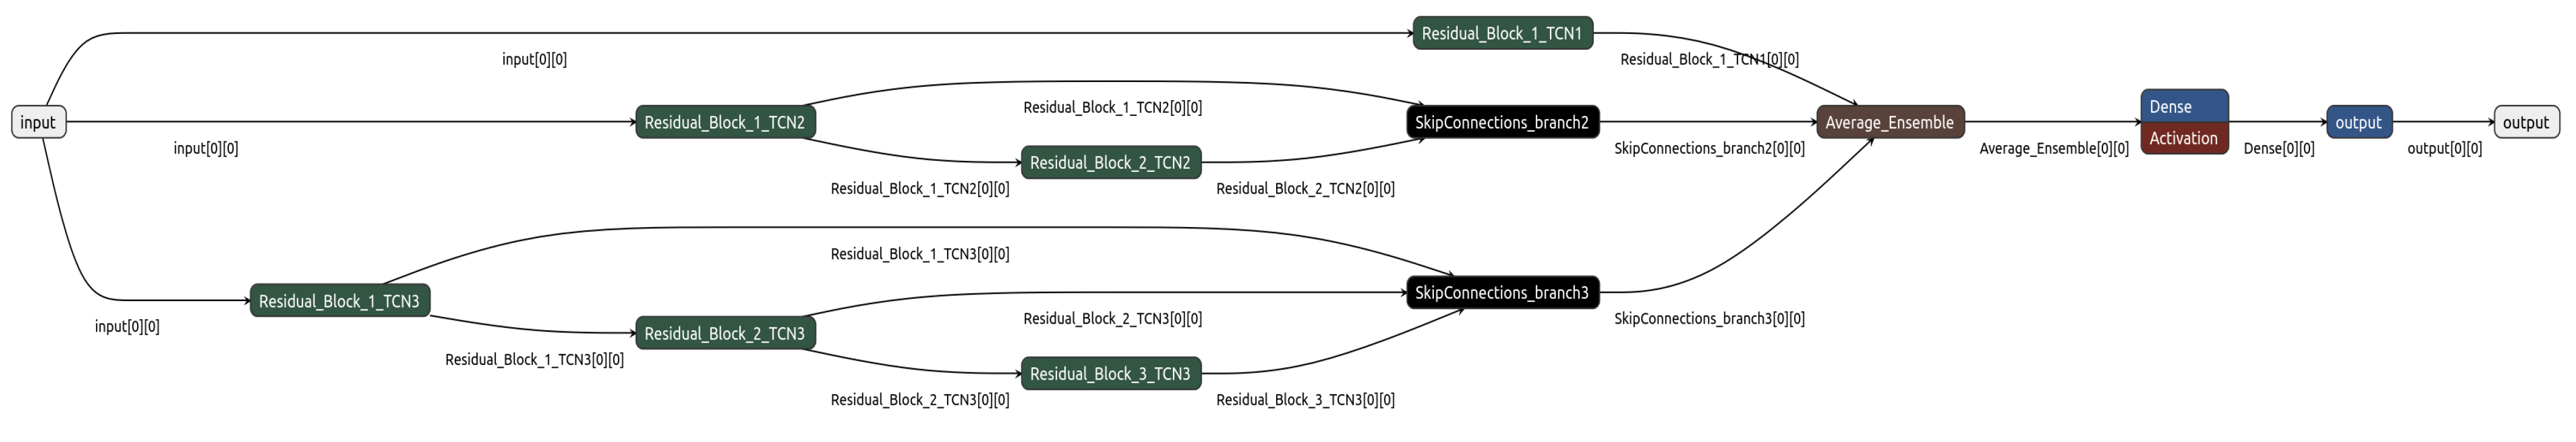
Looking at the Table 1, the stateful LSTM model was characterised by the lowest number of parameters yet its test and validation MSE was higher compared to other developed networks. The approach incorporating TCNs was the third largest in terms of the number of parameters, the LMU layer network being the first. Based on Table 3 and Table 15, the parallel TCN architecture achieved the best results in both test sets, with the best average MSE and standard deviation MSE achieved during the K-fold CV. The LSTM Stateless architecture exhibited a good trade-off between MSE and the number of parameters.

8. Accuracy Comparisons w.r.t. Traditional Machine Learning

Table 3 and Table 4 show that the parallel TCN approach proven to offer high accuracy due its ability to capture non-linear battery dynamics. On the contrary, more traditional approaches often proved to under perform in capturing such dynamics due to their simpler approach and linear approximations capabilities, as in the case of the EKF. Furthermore, as widely known, traditional ML models, such as DT and SVM, exhibit less computational complexity compared to NN. Table 5 reports the results achieved by testing these approaches on the dataset under consideration. Table 6 shows the percentage increase of the MSE for SoC estimation w.r.t. the parallel TCN, making these traditional ML methods inadequate from the accuracy point of view.
The lowest MSE increase on test cycles 10 and 16 was 1372% by SVM while DT was accountable for 12,418% increase, more than 4 orders of magnitude. A similar trend it has been observed on test cycles 10 and 37; the lowest MSE increase was 949% by SVM while DT was accountable for 13,742% increase.

9. Deployability on Micro-Controllers

Deployability on tiny MCU and performance characterization were studied in terms of the memory occupied by the tiny neural networks and the number of multiply-accumulated operations (MACC) required by their execution. The evaluation run on two MCUs typically employed in the Automotive and Internet of Things (IoT) solutions. The SR5E1-EVBE3000D [78] MCU is dedicated to automotive applications and deployed in electric vehicles. It is equipped with a dual split-lock ARM Cortex-M7 process, an internal RAM memory of 488 KiB and an internal FLASH memory of 2 MB, with a clock frequency of 300 MHz. STM32H5731-DK [79] MCU, instead, is for IoT applications, equipped with an ARM Cortex-M7 processor at 280 MHz, an internal RAM memory of 1184 KiB and an external RAM memory of 16 MB, an internal FLASH memory of 2MB and an external FLASH memory of 64 MB, and relies on 128 Mbits SDRAM. The STM32Cube.AI Developer Cloud tool eased the deployment of the pre-trained networks on these two MCUs. It automatically converted pre-trained ANN models into optimized ANSI C code for these low-power edge devices. The results achieved by deploying the fp32 neural architecture on the two MCUs are shown below. Table 7 and Table 8 report the RAM and FLASH memory occupancy. Table 9 and Table 10 report the memory, in KiB, occupied by the storage of activation tensors and the weights assigned to the connections between neurons in the layers, respectively. Table 11 and Table 12 report the number of operations executed by the MCUs and the inference time in milliseconds. The LMU layer was not supported by the STM32Cube.AI platform at the time this study was performed. Therefore, it was not included in the deployability analysis and this is left to the future work.
As per Table 3 and Table 4, parallel TCNs architecture achieved the best accuracy on both test sets, however it featured the highest MACC and inference time on both MCUs. On the other hand, the dense architecture was the highest in KiB size for storing the activations in RAM on both MCUs. The deployability results of the dense architecture and parallel TCNs were due to the higher number of parameters compared to the other networks. LSTM stateful, having been the model characterised by the lowest number of parameters, was expected to achieve low MACC count and inference time and indeed achieved the lowest, on both SR5E1-EVBE3000 and STM32H5731-DK, FLASH memory footprint.
Few ANNs were subsequently quantized to 8 bits through the TensorFlow Lite Post Training Quantize (PTQ) procedure, and then accelerated using the STM32MP257F-EV1 [80] microprocessor (MPU). This is equipped with dual Arm Cortex-A35 running at 1.5 GHz, one Arm Cortex-M33 and a neural co-processing unit (NPU). The inference time was considerably reduced both using 1, Table 13, and two cores, Table 14. At the time of this study, the TensorFlow Lite procedure did not support the optimisation of recurrent ANNs. Therefore, architectures with LSTM and GRU layers could not be quantized to 8 bits and were kept as fp32.

10. Application Oriented Considerations

Each inference required 100 × 10 input features to run, where 100 were the consecutive sampling steps to compose one input features batch. The sampling rate of each input feature was set to 100 ms, accordingly to the dataset documentation this work adopted. A sliding batch was adopted: thus, instead to juxtapose consecutive in time batches of 100 features, which increased much the SoC prediction latency, the sliding batch was updated every 100 ms, thus incorporating the new incoming feature, and replacing the oldest one. Then once the input batch was set, the inference was run by the MCU. Clearly this approach could require up to 10 inference runs per second, compared to one every 10 s (in case of juxtapose consecutive in time batches). At the start-up there would be a latency time of 10 s to compose the first batch; then a new batch would be updated every 100 ms. Furthermore, the input batch would be saved into the MCU embedded RAM, such that at start-up time a latency of 10 s is required to trigger the first inference run by the CPU embedded into the MCU. Moreover, 100 steps, each with 10 features, corresponded to 1000 total features in fp32 precision, therefore required 32,000 bits corresponding to 3.9 KiB RAM footprint well within the storage capabilities of both SR5E1 and STM32H5. Figure 15 describes the simplified features acquisition and computing architecture. The feature sampler block is used to acquire the features from the battery pack (3) and the other car features (7) which composes the 10 features sampled every 100 ms as reported by the dataset. They are written into the M memory embedded into the MCU. Once 1000 of them are stored, this event triggers the ANN execution by the CPU integrated into the MCU.
It was assumed that two clock cycles were required by the MCU to read each input feature and store it into MCU embedded RAM. SR5E1-EVBE3000 would require 6.6 μ s to store at start 1000 features batch into M, STM32H5731-DK would take 7.1 μ s, STM32MP257F would take 1.3 μ s (Table 15). In throughput, the latency to trigger an inference run would be obtained by diving by 100 these values, since 10 features update the batch every 100 ms.

11. Complexity of ANN Versus MCU Capabilities

A single-layer perceptron (SLP) model was designed to benchmark the memory and computational capabilities of the MCUs and to suggest the complexity in terms of neurons of a ANN that can be handled by these edge devices. The SR5E1-EVBE3000D MCU has got an internal RAM of 256 KiB, using a flatten input of 1000 features, this RAM was saturated by the activation tensor of a SLP with a dense layer of 610 neurons and a single neuron output. The RAM was computed by the STM32Cube.AI Developer Cloud. SLP’s inference required 19.77 ms with 610,610 MACC operations. The STM32H5731-DK MCU has got an internal RAM of 640 KiB, using a flatten input of 1000 features, the RAM was saturated by a SLP with a dense layer of 1300 neurons and a single neuron output. The STM32MP257F-EV MCU was tested by a SLP of 500,000 neurons and a single neuron output, and achieved an inference time of 1018 ms (approx. 1 s), with 500,500,000 MACC operations.

12. Battery Pack Architecture Analysis

The battery pack, which provides electrical energy to the vehicle’s inverter to drive the electric motor, usually consists of a number of modules with battery cells connected in series or in parallel or a combination of both. A crucial function of the BMS is to make sure that the different cells in the battery pack keep the same charge capacity during charge and discharge cycles. By keeping the cells balanced in terms of energy stored, the BMS extends the life of the battery pack (and its elements) as its longevity is affected by overcharge and depth of discharge states. Unbalances between the charge levels of different cells can exacerbate these issues. Consequently, this paper investigated the total time required to compute the SoC at a finer granularity level considering all cells composing the battery pack. As it was also suggested by Zhong et al. [81] to estimate the SoC at pack level, the SoC for each individual cell shall be computed and then combine them to compute the overall value:
S o C P a c k = i = 1 N S o C i × C i i = 1 N C i
The use of a single MCU installed on the battery connected via a common data transport bus to the individual cells was assumed be available. With a single MCU, the approach chosen was the linear accumulation of the individual inference times of the SoC inference for each cell. Table 16 shows the number of cells, their configuration within battery pack and the overall inference time for different automobile models. The pack configurations are arranged in an “xSyP” structure, where x denotes the number of cells connected in series to form a module and y denotes the number of modules connected in parallel to form the battery pack [82]. For example, Nissan Leaf had 96 cells connected in series to form a module and 2 modules connected in parallel to form the pack, for a total of 192 cells. All data concerning the different electric car models were collected from the EV Database [83]. All these vehicles featured Lithium-ion battery type.
In the first scenario, the STM32MP257F-EV1 MPU (2 cores) was adopted. The Parallel TCNs architecture provided the fastest results (Table 14). The RAM occupied was 4.92 MB (Table 14). Total inference time was computed by multiplying the number of pack cells by 0.88 ms, inference time (Table 17 column STM32MP257F-EV1).
In the second scenario, the MCU SR5E1-EVBE3000D automotive MCU was adopted. The LSTM Stateless was chosen, since it exhibited the best trade-off among inference time (Table 11), MSE (Table 3), RAM and Flash usage (Table 7). The MCU RAM and Flash occupied was 4.91 KiB and 22 KiB (Table 7) respectively. Total inference time was computed by multiplying the number of pack cells by 20.64 ms inference time (Table 17 column SR5E1-EVBE3000D).
The results (ref. Table 17) showed a significant inference time difference between the 8bits Parallel TCNs deployed on a STM32MP2 and the fp32 LSTM Stateless topology deployed on the SRE51, mainly due to the highest computing capabilities of the STM32MP257F (2 cores at 1.5 GHz) and due to the more efficient 8 bits TCN workload. The inference time was higher on automobiles with high module parallelism, such as Tesla Model S Plaid, Lucid Air Grand Touring and Rimac Nevera (column Number of cells of Table 16).
Therefore, a second approach was considered. It assumed that a MCU was connected to each “xS” structure. This to enable “yP” parallel computation. The total inference time was computed by multiplying the “xS” by the inference time of the individual cell. This because each MCU could perform the SoC computations of the individual “xS” cells. Table 18, the column STM32MP257F-EV1 shows the final values computed using the inference time of the Parallel TCNs architecture deployed on 2 cores: 0.88 ms. The column SR5E1-EVBE3000D reports the final values computed with the inference time of LSTM Stateless topology, 20.64 ms.
Table 18 shows that the Parallel TCNs network achieved low inference times.

13. Conclusions and Future Works

This study introduced a Parallel TCN (Section 6.6) topology accelerated by the STM32MP257F-EV1. It proved to be the fastest solution for estimating the SoC of EV batteries. It achieved the lowest MSE (Table 3), and also the lowest inference times measured once deployed on a off-the-shelf MCU (Table 17 and Table 18).
On the other hand, this model was the most complex in terms of number of MACCs and inference time on both the considered MCUs without hardware acceleration, (Table 11 and Table 12). The LSTM Stateless topology (Section 6.2) was deployed on the SR5E1-EVBE3000D MCU, and this architecture achieved the best trade-off between accuracy performance and computational complexity. However, at the time of writing, 8-bit quantization of the recurrent network and its subsequent acceleration on NPU was not supported. Therefore, the inference times achieved for the entire battery pack were significantly higher than the ones achieved using accelerated Parallel 8bit quantized TCNs. In the case of the Tesla Model S Plaid (Table 17), a inference time of 163.468 s was estimated. Despite the limitation that recurrent networks were not quantized, the use of a CNN proven to be adequate. The experiments showed that the architecture incorporating parallel branches of TCNs achieved the lowest MSE in both test sets (Table 3). This result was not obvious since multiple studies reported that RNN usually were the most performing models in SoC estimation [84].
Future work will focus on implementing 8-bit quantization of recurrent layers and studying their performance once accelerated on MCUs. Moreover the LMU C code implementation on MCU will be addressed. Since the research work for SoC estimation was conducted using data from a BMW i3, another research direction encompass to incorporate data from other electric car models, while under daily usage, to validate the developed models on a broader spectrum of existing vehicles and different driver’s habits. A complete application profiling embodying SoC prediction deployed on the field is also another interesting direction to provide quantitative data considering the whole application running on the MCU.

Author Contributions

Conceptualization, D.P.P.; methodology, D.P.P.; software, D.P.P. and A.A.; validation, D.P.P. and A.A.; formal analysis, D.P.P. and A.A.; investigation, D.P.P. and A.A.; resources, D.P.P. and A.A.; data curation, D.P.P. and A.A.; writing—original draft preparation, D.P.P. and A.A.; writing—review and editing, D.P.P.; visualization, D.P.P. and A.A.; supervision, D.P.P.; project administration, D.P.P.; funding acquisition, none. All authors have read and agreed to the published version of the manuscript.

Funding

This research received no external funding.

Institutional Review Board Statement

This study did not require any ethical approval.

Informed Consent Statement

This study did not require any experimentation on humans not animals.

Data Availability Statement

No new datasets were created.

Conflicts of Interest

The authors declare no conflicts of interest.

Abbreviations

The following abbreviations are used in this manuscript:
AhAmpere-hour
AIArtificial Intelligence
ANNArtificial Neural Networks
BMSBattery Management System
BPBack-Propagation
CCCoulomb Counting
CNNConvolutional Neural Networks
DLDeep Learning
DTDecision Tree
ECMEquivalent Circuit Model
EVElectric Vehicles
KFKalman Filter
EKFExtended Kalman Filter
FNNFeed Forward Networks
FP32Floating Point 32 bits
FCFully connected
GPRGaussian Process Regression
GRUGated Recurrent Unit
LMULegendre Memory Unit
LSTMLong-short term memory
LOLuenberger Observer
Mmemory
MAEMean Absolute Error
MAPEMean Absolute Percentage Error
MCUMicrocontroller
MLMachine Learning
MPUMicroprocessor
MSEMean Square Error
NPUNeural Processing unit
NSENash–Sutcliffe model efficiency coefficient
RBResidual Block
RMSERoot MSE
RNNRecurrent Neural Networks
RFRandom Forest
SLPSingle Layer Perceptron
SoCState of Charge
SoHState of Health
SVMSupport Vector Machine
SVRSupport Vector Regression
TinyMLTiny Machine Learning
UKFUnscented Kalman Filter

References

  1. Muratori, M.; Alexander, M.; Arent, D.; Bazilian, M.; Cazzola, P.; Dede, E.; Farrell, J.; Gearhart, C.; Greene, D.; Jenn, A. Others The rise of electric vehicles—2020 status and future expectations. Prog. Energy 2021, 3, 022002. [Google Scholar] [CrossRef]
  2. Van Mierlo, J.; Berecibar, M.; El Baghdadi, M.; De Cauwer, C.; Messagie, M.; Coosemans, T.; Jacobs, V.; Hegazy, O. Beyond the state of the art of electric vehicles: A fact-based paper of the current and prospective electric vehicle technologies. World Electr. Veh. J. 2021, 12, 20. [Google Scholar] [CrossRef]
  3. Scrosati, B.; Garche, J. Lithium batteries: Status, prospects and future. J. Power Sources 2010, 195, 2419–2430. Available online: https://www.sciencedirect.com/science/article/pii/S0378775309020564 (accessed on 13 July 2024). [CrossRef]
  4. Kim, T.; Song, W.; Son, D.; Ono, L.; Qi, Y. Lithium-ion batteries: Outlook on present, future, and hybridized technologies. J. Mater. Chem. A 2019, 7, 2942–2964. [Google Scholar] [CrossRef]
  5. Salgado, R.; Danzi, F.; Oliveira, J.; El-Azab, A.; Camanho, P.; Braga, M. The Latest Trends in Electric Vehicles Batteries. Molecules 2021, 26, 3188. [Google Scholar] [CrossRef] [PubMed]
  6. Ziegler, M.; Trancik, J. Re-examining rates of lithium-ion battery technology improvement and cost decline. Energy Environ. Sci. 2021, 14, 1635–1651. [Google Scholar] [CrossRef]
  7. Mishra, S.; Swain, S.C.; Samantaray, R.K. A Review on Battery Management system and its Application in Electric vehicle. In Proceedings of the 2021 International Conference on Advances in Computing and Communications (ICACC), Kochi, Kakkanad, India, 21–23 October 2021; pp. 1–6. [Google Scholar] [CrossRef]
  8. Chiasson, J.; Vairamohan, B. Estimating the state of charge of a battery. IEEE Trans. Control Syst. Technol. 2005, 13, 465–470. Available online: https://ieeexplore.ieee.org/stamp/stamp.jsp?arnumber=1424024 (accessed on 13 July 2024). [CrossRef]
  9. Shrivastava, P.; Naidu, P.; Sharma, S.; Panigrahi, B.; Garg, A. Review on technological advancement of lithium-ion battery states estimation methods for electric vehicle applications. J. Energy Storage 2023, 64, 107159. [Google Scholar] [CrossRef]
  10. Zheng, Y.; Ouyang, M.; Han, X.; Lu, L.; Li, J. Investigating the error sources of the online state of charge estimation methods for lithium-ion batteries in electric vehicles. J. Power Sources 2018, 377, 161–188. [Google Scholar] [CrossRef]
  11. Lai, X.; Yuan, M.; Tang, X.; Yao, Y.; Weng, J.; Gao, F.; Ma, W.; Zheng, Y. Co-estimation of state-of-charge and state-of-health for lithium-ion batteries considering temperature and ageing. Energies 2022, 15, 7416. [Google Scholar] [CrossRef]
  12. Ghaeminezhad, N.; Ouyang, Q.; Wei, J.; Xue, Y.; Wang, Z. Review on state of charge estimation techniques of lithium-ion batteries: A control-oriented approach. J. Energy Storage 2023, 72, 108707. [Google Scholar] [CrossRef]
  13. Yang, B.; Wang, J.; Cao, P.; Zhu, T.; Shu, H.; Chen, J.; Zhang, J.; Zhu, J. Classification, summarization and perspectives on state-of-charge estimation of lithium-ion batteries used in electric vehicles: A critical comprehensive survey. J. Energy Storage 2021, 39, 102572. [Google Scholar] [CrossRef]
  14. Waag, W.; Fleischer, C.; Sauer, D. Critical review of the methods for monitoring of lithium-ion batteries in electric and hybrid vehicles. J. Power Sources 2014, 258, 321–339. [Google Scholar] [CrossRef]
  15. Wang, Z.; Feng, G.; Zhen, D.; Gu, F.; Ball, A. A review on online state of charge and state of health estimation for lithium-ion batteries in electric vehicles. Energy Rep. 2021, 7, 5141–5161. [Google Scholar] [CrossRef]
  16. Hannan, M.; Lipu, M.; Hussain, A.; Mohamed, A. A review of lithium-ion battery state of charge estimation and management system in electric vehicle applications: Challenges and recommendations. Renew. Sustain. Energy Rev. 2017, 78, 834–854. [Google Scholar] [CrossRef]
  17. Lipu, M.; Hannan, M.; Hussain, A.; Ayob, A.; Saad, M.; Karim, T.; How, D. Data-driven state of charge estimation of lithium-ion batteries: Algorithms, implementation factors, limitations and future trends. J. Clean. Prod. 2020, 277, 124110. [Google Scholar] [CrossRef]
  18. Yang, F.; Song, X.; Xu, F.; Tsui, K. State-of-charge estimation of lithium-ion batteries via long short-term memory network. IEEE Access 2019, 7, 53792–53799. [Google Scholar] [CrossRef]
  19. How, D.; Hannan, M.; Lipu, M.; Ker, P. State of charge estimation for lithium-ion batteries using model-based and data-driven methods: A review. IEEE Access 2019, 7, 136116–136136. [Google Scholar] [CrossRef]
  20. LeCun, Y.; Bengio, Y.; Hinton, G. Deep learning. Nature 2015, 521, 436–444. [Google Scholar] [CrossRef] [PubMed]
  21. Dong, S.; Wang, P.; Abbas, K. A survey on deep learning and its applications. Comput. Sci. Rev. 2021, 40, 100379. [Google Scholar] [CrossRef]
  22. Ragone, M.; Yurkiv, V.; Ramasubramanian, A.; Kashir, B.; Mashayek, F. Data driven estimation of electric vehicle battery state-of-charge informed by automotive simulations and multi-physics modeling. J. Power Sources 2021, 483, 229108. Available online: https://www.sciencedirect.com/science/article/pii/S0378775320314038 (accessed on 13 July 2024). [CrossRef]
  23. Manoharan, A.; Sooriamoorthy, D.; Begam, K.; Aparow, V. Electric vehicle battery pack state of charge estimation using parallel artificial neural networks. J. Energy Storage 2023, 72, 108333. [Google Scholar] [CrossRef]
  24. Manoharan, A.; Begam, K.; Aparow, V.; Sooriamoorthy, D. Artificial Neural Networks, Gradient Boosting and Support Vector Machines for electric vehicle battery state estimation: A review. J. Energy Storage 2022, 55, 105384. [Google Scholar] [CrossRef]
  25. Kumar, R.; Bharatiraja, C.; Udhayakumar, K.; Devakirubakaran, S.; Sekar, K.; Mihet-Popa, L. Advances in Batteries, Battery Modeling, Battery Management System, Battery Thermal Management, SOC, SOH, and Charge/Discharge Characteristics in EV Applications. IEEE Access 2023, 11, 105761–105809. [Google Scholar] [CrossRef]
  26. Daghero, F.; Pagliari, D.; Poncino, M. Chapter Eight - Energy-efficient deep learning inference on edge devices. Hardw. Accel. Syst. Artif. Intell. Mach. Learn. 2021, 122, 247–301. Available online: https://www.sciencedirect.com/science/article/pii/S0065245820300553 (accessed on 13 July 2024).
  27. Lelie, M.; Braun, T.; Knips, M.; Nordmann, H.; Ringbeck, F.; Zappen, H.; Sauer, D. Battery management system hardware concepts: An overview. Appl. Sci. 2018, 8, 534. [Google Scholar] [CrossRef]
  28. Sipola, T.; Alatalo, J.; Kokkonen, T.; Rantonen, M. Artificial Intelligence in the IoT Era: A Review of Edge AI Hardware and Software. In Proceedings of the 2022 31st Conference of Open Innovations Association (FRUCT), Helsinki, Finland, 27–29 April 2022; pp. 320–331. [Google Scholar] [CrossRef]
  29. Su, W.; Li, L.; Liu, F.; He, M.; Liang, X. AI on the edge: A comprehensive review. Artif. Intell. Rev. 2022, 55, 6125–6183. [Google Scholar] [CrossRef]
  30. Banbury, C.; Reddi, V.; Lam, M.; Fu, W.; Fazel, A.; Holleman, J.; Huang, X.; Hurtado, R.; Kanter, D.; Lokhmotov, A. Others Benchmarking tinyml systems: Challenges and direction. arXiv 2020, arXiv:2003.04821. [Google Scholar]
  31. TinyML Foundation. Tinyml Summit. 2019. Available online: https://arxiv.org/abs/2003.04821 (accessed on 13 July 2024). [CrossRef]
  32. Ren, Z.; Du, C. A review of machine learning state-of-charge and state-of-health estimation algorithms for lithium-ion batteries. Energy Rep. 2023, 9, 2993–3021. [Google Scholar] [CrossRef]
  33. Babaeiyazdi, I.; Rezaei-Zare, A.; Shokrzadeh, S. State of charge prediction of EV Li-ion batteries using EIS: A machine learning approach. Energy 2021, 223, 120116. Available online: https://www.sciencedirect.com/science/article/pii/S0360544221003650 (accessed on 13 July 2024). [CrossRef]
  34. Mediouni, H.; Hani, S.E.; Ezzouhri, A.; Daghouri, A.; Aboudrar, I.; Naseri, N. State of Charge Estimation for Lithium-Ion Batteries Using Machine Learning Algorithms. In Proceedings of the 2022 IEEE International Conference on Electrical Sciences and Technologies in Maghreb (CISTEM), Tunis, Tunisia, 26–28 October 2022; pp. 1–5. [Google Scholar] [CrossRef]
  35. Mithul Raaj, T.; Justin, R.; Niranjan, S.; Tanya, G.; Keerthi, B. A Comprehensive Exploration on Different Machine Learning Techniques for State of Charge Estimation of EV Battery. In Proceedings of the 2023 58th International Universities Power Engineering Conference (UPEC), Dublin, Ireland, 30 August–1 September 2023; pp. 1–6. [Google Scholar] [CrossRef]
  36. Kollmeyer, P.; Vidal, C.; Naguib, M.; Skells, M. LG 18650HG2 Li-ion battery data and example deep neural network xEV SOC estimator script. Mendeley Data 2020, 3, 2020. [Google Scholar]
  37. Stighezza, M.; Bianchi, V.; Toscani, A.; Munari, I.D. A flexible machine learning based framework for state of charge evaluation. In Proceedings of the 2022 IEEE International Workshop on Metrology for Automotive (MetroAutomotive), Modena, Italy, 4–6 July 2022; pp. 111–115. [Google Scholar] [CrossRef]
  38. Zhao, J.; Ling, H.; Liu, J.; Wang, J.; Burke, A.; Lian, Y. Machine learning for predicting battery capacity for electric vehicles. ETransportation 2023, 15, 100214. [Google Scholar] [CrossRef]
  39. Tan, X.; Zhan, D.; Lyu, P.; Rao, J.; Fan, Y. Online state-of-health estimation of lithium-ion battery based on dynamic parameter identification at multi timescale and support vector regression. J. Power Sources 2022, 484, 229233. Available online: https://www.sciencedirect.com/science/article/pii/S0378775320315226 (accessed on 13 July 2024). [CrossRef]
  40. Saha, B.; Goebel, K. Battery Data Set, NASA Ames Prognostics Data Repository. NASA Ames Research Center, Moffett Field, Battery Data Set, NASA Ames Prognostics Data Repository; NASA Ames Research Center: Moffett Field, CA, USA, 2007; Journal: Open Journal of Applied Sciences, Vol.12 No.8, August 19, 2022. Available online: https://scirp.org/journal/home?journalid=1003 (accessed on 13 July 2024).
  41. Babaeiyazdi, I.; Rezaei-Zare, A.; Shokrzadeh, S. State-of-Charge Prediction of Degrading Li-ion Batteries Using an Adaptive Machine Learning Approach. In Proceedings of the 2022 IEEE Power and Energy Society General Meeting (PESGM), Denver, CO, USA, 17–21 July 2022; pp. 1–5. [Google Scholar] [CrossRef]
  42. Tian, J.; Xiong, R.; Shen, W.; Lu, J. State-of-charge estimation of LiFePO4 batteries in electric vehicles: A deep-learning enabled approach. Appl. Energy 2021, 291, 116812. [Google Scholar] [CrossRef]
  43. Chandran, V.; Patil, C.; Karthick, A.; Ganeshaperumal, D.; Rahim, R.; Ghosh, A. State of charge estimation of lithium-ion battery for electric vehicles using machine learning algorithms. World Electr. Veh. J. 2021, 12, 38. [Google Scholar] [CrossRef]
  44. Narayanan, S.S.S.; Thangavel, S. Machine learning-based model development for battery state of charge–open circuit voltage relationship using regression techniques. J. Energy Storage 2022, 49, 104098. [Google Scholar]
  45. El Fallah, S.; Kharbach, J.; Hammouch, Z.; Rezzouk, A.; Jamil, M. State of charge estimation of an electric vehicle’s battery using Deep Neural Networks: Simulation and experimental results. J. Energy Storage 2023, 62, 106904. [Google Scholar] [CrossRef]
  46. Guo, S.; Ma, L. A comparative study of different deep learning algorithms for lithium-ion batteries on state-of-charge estimation. Energy 2023, 263, 125872. [Google Scholar] [CrossRef]
  47. Dao, V.; Dinh, M.; Kim, C.; Park, M.; Doh, C.; Bae, J.; Lee, M.; Liu, J.; Bai, Z. Design of an Effective State of Charge Estimation Method for a Lithium-Ion Battery Pack Using Extended Kalman Filter and Artificial Neural Network. Energies 2021, 14, 2634. [Google Scholar] [CrossRef]
  48. Liu, X.; Li, Q.; Wang, L.; Lin, M.; Wu, J. Data-driven state of charge estimation for power battery with improved extended Kalman filter. IEEE Trans. Instrum. Meas. 2023, 72, 1–10. [Google Scholar] [CrossRef]
  49. Che, Y.; Zheng, Y.; Wu, Y.; Lin, X.; Li, J.; Hu, X.; Teodorescu, R. Battery states monitoring for electric vehicles based on transferred multi-task learning. IEEE Trans. Veh. Technol. 2023, 72, 10037–10047. [Google Scholar] [CrossRef]
  50. Tian, J.; Xiong, R.; Shen, W.; Lu, J.; Sun, F. Flexible battery state of health and state of charge estimation using partial charging data and deep learning. Energy Storage Mater. 2022, 51, 372–381. [Google Scholar] [CrossRef]
  51. Hannan, M.; How, D.; Lipu, M.; Ker, P.; Dong, Z.; Mansur, M.; Blaabjerg, F. SOC Estimation of Li-ion Batteries with Learning Rate-Optimized Deep Fully Convolutional Network. IEEE Trans. Power Electron. 2021, 36, 7349–7353. [Google Scholar] [CrossRef]
  52. Shibl, M.; Ismail, L.; Massoud, A. A machine learning-based battery management system for state-of-charge prediction and state-of-health estimation for unmanned aerial vehicles. J. Energy Storage 2023, 66, 107380. Available online: https://www.sciencedirect.com/science/article/pii/S2352152X23007776 (accessed on 13 July 2024). [CrossRef]
  53. Reddy, D.; Bhimasingu, R. State of Charge Estimation of Li-ion Batteries through Efficient Gated Recurrent Neural Networks using Engineered features. In Proceedings of the 2022 IEEE 19th India Council International Conference (INDICON), Kochi, India, 24–26 November 2022; pp. 1–6. [Google Scholar]
  54. Li, C.; Xiao, F.; Fan, Y. An approach to state of charge estimation of lithium-ion batteries based on recurrent neural networks with gated recurrent unit. Energies 2019, 12, 1592. [Google Scholar] [CrossRef]
  55. Huang, Z.; Yang, F.; Xu, F.; Song, X.; Tsui, K. Convolutional Gated Recurrent Unit–Recurrent Neural Network for State-of-Charge Estimation of Lithium-Ion Batteries. IEEE Access 2019, 7, 93139–93149. [Google Scholar] [CrossRef]
  56. Li, J.; Huang, X.; Tang, X.; Guo, J.; Shen, Q.; Chai, Y.; Lu, W.; Wang, T.; Liu, Y. The state-of-charge prediction of lithium-ion battery energy storage system using data-driven machine learning. Sustain. Energy Grids Netw. 2023, 34, 101020. [Google Scholar] [CrossRef]
  57. Liu, Y.; Li, J.; Zhang, G.; Hua, B.; Xiong, N. State of Charge Estimation of Lithium-Ion Batteries Based on Temporal Convolutional Network and Transfer Learning. IEEE Access 2021, 9, 34177–34187. [Google Scholar] [CrossRef]
  58. Tian, J.; Chen, C.; Shen, W.; Sun, F.; Xiong, R. Deep learning framework for lithium-ion battery state of charge estimation: Recent advances and future perspectives. Energy Storage Mater. 2023, 61, 102883. [Google Scholar] [CrossRef]
  59. Zhang, D.; Zhong, C.; Xu, P.; Tian, Y. Deep learning in the state of charge estimation for li-ion batteries of electric vehicles: A review. Machines 2022, 10, 912. [Google Scholar] [CrossRef]
  60. Shen, H.; Zhou, X.; Wang, Z.; Wang, J. State of charge estimation for lithium-ion battery using Transformer with immersion and invariance adaptive observer. J. Energy Storage 2022, 45, 103768. [Google Scholar] [CrossRef]
  61. Hong, S.; Kang, M.; Park, H.; Kim, J.; Baek, J. Real-time state-of-charge estimation using an embedded board for li-ion batteries. Electronics 2022, 11, 2010. [Google Scholar] [CrossRef]
  62. Mazzi, Y.; Ben Sassi, H.; Gaga, A.; Errahimi, F. State of charge estimation of an electric vehicle’s battery using tiny neural network embedded on small microcontroller units. Int. J. Energy Res. 2022, 46, 8102–8119. [Google Scholar] [CrossRef]
  63. TensorFlow Lite for Microcontrollers. 2024. Available online: https://www.tensorflow.org/lite (accessed on 13 July 2024).
  64. STM32Cube.AI (X-CUBE-AI v9.0). 2024. Available online: https://stm32ai.st.com/stm32-cube-ai/ (accessed on 13 July 2024).
  65. Bai, S.; Kolter, J.; Koltun, V. An empirical evaluation of generic convolutional and recurrent networks for sequence modeling. arXiv 2018, arXiv:1803.01271. [Google Scholar]
  66. Voelker, A.; Kaji, I.; Eliasmith, C. Legendre Memory Units: Continuous-Time Representation in Recurrent Neural Networks. In Advances in Neural Information Processing Systems; Curran Associates, Inc.: New York, NY, USA, 2019; Volume 32, Available online: https://proceedings.neurips.cc/paper_files/paper/2019/file/952285b9b7e7a1be5aa7849f32ffff05-Paper.pdf (accessed on 13 July 2024).
  67. STM32 Cloud Solutions for Artificial Neural Networks—STMicroelectronics. 2024. Available online: https://stm32ai-cs.st.com/home (accessed on 13 July 2024).
  68. Steinstraeter, M.; Buberger, J.; Trifonov, D. Battery and Heating Data in Real Driving Cycles. IEEE Dataport. 2020. Available online: https://doi.org/10.21227/6jr9-5235 (accessed on 13 July 2024).
  69. Lee, J.; Kwon, S.; Lim, Y.; Chon, M.; Kim, D. Effect of Air-Conditioning on Driving Range of Electric Vehicle for Various Driving Modes; Event: Asia Pacific Automotive Engineering Conference; ISSN: 0148-7191; e-ISSN: 2688-3627; SAE Technical Paper; SAE International: Warrendale, PA, USA, 2013; Available online: https://www.sae.org/publications/technical-papers/content/2013-01-0040/ (accessed on 13 July 2024).
  70. Al-Wreikat, Y.; Serrano, C.; Sodré, J. Driving behaviour and trip condition effects on the energy consumption of an electric vehicle under real-world driving. Appl. Energy 2021, 297, 117096. [Google Scholar] [CrossRef]
  71. Yi, Z.; Bauer, P. Effects of environmental factors on electric vehicle energy consumption: A sensitivity analysis. IET Electr. Syst. Transp. 2017, 7, 3–13. [Google Scholar] [CrossRef]
  72. Steinstraeter, M.; Buberger, J.; Minnerup, K.; Trifonov, D.; Horner, P.; Weiss, B.; Lienkamp, M. Controlling cabin heating to improve range and battery lifetime of electric vehicles. ETransportation 2022, 13, 100181. Available online: https://www.sciencedirect.com/science/article/pii/S2590116822000273 (accessed on 13 July 2024). [CrossRef]
  73. Alin, A. Multicollinearity. Wiley Interdiscip. Rev. Comput. Stat. 2010, 2, 370–374. [Google Scholar] [CrossRef]
  74. Agarap, A. Deep learning using rectified linear units (relu). arXiv 2018, arXiv:1803.08375. [Google Scholar]
  75. Girosi, F.; Jones, M.; Poggio, T. Regularization theory and neural networks architectures. Neural Comput. 1995, 7, 219–269. [Google Scholar] [CrossRef]
  76. Srivastava, N.; Hinton, G.; Krizhevsky, A.; Sutskever, I.; Salakhutdinov, R. Dropout: A simple way to prevent neural networks from overfitting. J. Mach. Learn. Res. 2014, 15, 1929–1958. [Google Scholar]
  77. Hansen, L.; Salamon, P. Neural network ensembles. IEEE Trans. Pattern Anal. Mach. Intell. 1990, 12, 993–1001. [Google Scholar] [CrossRef]
  78. STMicroelectronics Stellar Electrification MCUs Datasheet. Available online: https://www.st.com/resource/en/datasheet/sr5e1e3.pdf (accessed on 13 July 2024).
  79. STMicroelectronics Discovery Kit with STM32H573II MCU Datasheet. Available online: https://www.st.com/resource/en/data_brief/stm32h573i-dk.pdf (accessed on 13 July 2024).
  80. STMicroelectronics Microprocessors with AI Accelarator. Available online: https://www.st.com/resource/en/datasheet/stm32mp257f.pdf (accessed on 13 July 2024).
  81. Zhong, L.; Zhang, C.; He, Y.; Chen, Z. A method for the estimation of the battery pack state of charge based on in-pack cells uniformity analysis. Appl. Energy 2014, 113, 558–564. [Google Scholar] [CrossRef]
  82. Wang, L.; Zhao, X.; Liu, L.; Wang, R. Battery pack topology structure on state-of-charge estimation accuracy in electric vehicles. Electrochim. Acta 2016, 219, 711–720. [Google Scholar] [CrossRef]
  83. Electric Vehicles Database. 2024. Available online: https://ev-database.org/ (accessed on 13 July 2024).
  84. Ma, L.; Hu, C.; Cheng, F. State of charge and state of energy estimation for lithium-ion batteries based on a long short-term memory neural network. J. Energy Storage 2021, 37, 102440. [Google Scholar] [CrossRef]
Figure 1. SoC variations over the time.
Applsci 14 06240 g001
Figure 2. Dataset features: correlation matrix. Numbers between parenthesis () are negative.
Applsci 14 06240 g002
Figure 3. 10 Features selected from the dataset: correlation matrix. Numbers between parenthesis () are negative.
Applsci 14 06240 g003
Figure 4. FFN architecture.
Applsci 14 06240 g004
Figure 5. Stateless LSTM-based architecture.
Applsci 14 06240 g005
Figure 6. Stateful LSTM-based architecture.
Applsci 14 06240 g006
Figure 7. Stateless GRU-based architecture.
Applsci 14 06240 g007
Figure 8. Stateful GRU-based architecture.
Applsci 14 06240 g008
Figure 9. TCN Residual Block structure.
Applsci 14 06240 g009
Figure 10. TCN first branch topology.
Applsci 14 06240 g010
Figure 11. TCN second branch topology.
Applsci 14 06240 g011
Figure 12. TCN third branch topology.
Applsci 14 06240 g012
Figure 13. TCN complete topology with all the branches connected together.
Applsci 14 06240 g013
Figure 14. LMU-based architecture.
Applsci 14 06240 g014
Figure 15. Simplified features acquisition and computing architecture. (1) is the path to store the input features into embedded memory M, (2) is the path to read the feature batch from the memory M to feed the inference run on the CPU.
Applsci 14 06240 g015
Table 1. Model size of the designed neural architectures.
ArchitectureNum. of ParametersNum. of Training Data/Num. of Parameters
Dense15,84112.07
LSTM Stateless553734.531
LSTM Stateful253775.365
GRU Stateless425744.914
GRU Stateful664128.791
Parallel TCNs14,52913.16
LMU17,01711.235
Table 2. K-fold cross validation results.
ArchitectureAverage MSEStandard Deviation MSE
Dense3.88 × 10 4 9.64 × 10 9
LSTM Stateless28.0 × 10 4 2.84 × 10 6
LSTM Stateful335.9 × 10 4 11.9 × 10 4
GRU Stateless35.47 × 10 4 3.03 × 10 6
GRU Stateful525.8 × 10 4 43.0 × 10 4
Parallel TCNs2.09 × 10 4 2.06 × 10 9
LMU80.9 × 10 4 2.12 × 10 5
Table 3. Test MSE results.
ArchitectureMSE Tests 10 and 16MSE Tests 10 and 37
Dense14.6 × 10 4 16.7 × 10 4
LSTM Stateless11.2 × 10 4 10.7 × 10 4
LSTM Stateful361.0× 10 4 270.7 × 10 4
GRU Stateless20.4 × 10 4 29.0 × 10 4
GRU Stateful209.0 × 10 4 376.4 × 10 4
Parallel TCNs5.4 × 10 4 7.1 × 10 4
LMU19.7 × 10 4 25.0 × 10 4
Table 4. Test MAPE (Mean Absolute Percentage Error) results.
ArchitectureMAPE [%] Tests 10 and 16MAPE [%] Tests 10 and 37
Dense5.035.44
LSTM Stateless4.854.30
LSTM Stateful30.822.9
GRU Stateless5.546.76
GRU Stateful18.225.1
Parallel TCNs2.963.26
LMU4.905.56
Table 5. Test MSE results of traditional ML methods.
ModelMSE Tests 10 and 16MSE Tests 10 and 37
Decision Tree670.6 × 10 4 975.7 × 10 4
Random Forest649.1 × 10 4 991.3 × 10 4
Support Vector Machine74.1 × 10 4 67.4 × 10 4
Table 6. Traditional ML methods MSE % increase with respect to Parallel TCNs results.
ModelMSE [%] Tests 10 and 16MSE [%] Tests 10 and 37
Decision Tree+12,418%13,742%
Random Forest+12,020%13,961%
Support Vector Machine+1372%949%
Table 7. SR5E1-EVBE3000D RAM and FLASH results.
ArchitectureRAM [KiB]Flash [KiB]
Dense7558.63
LSTM Stateless4.9122
LSTM Stateful10.5910.19
GRU Stateless4.7816.63
GRU Stateful17.1625.94
Parallel TCNs15.2638.52
Table 8. STM32H5731-DK RAM and FLASH results results.
ArchitectureRAM [KiB]FLASH [KiB]
Dense81.5868.23
LSTM Stateless6.3237.4
LSTM Stateful12.7726.65
GRU Stateless6.1133.52
GRU Stateful19.1543.77
Parallel TCNs39.5992.28
Table 9. SR5E1-EVBE3000D Activation and Weights results.
ArchitectureActivation [KiB]Weights [KiB]
Dense7558.63
LSTM Stateless4.9122
LSTM Stateful10.5910.19
GRU Stateless4.7816.63
GRU Stateful17.1625.94
Parallel TCNs15.2638.52
Table 10. STM32H5731-DK Activation and Weights results.
ArchitectureActivation [KiB]Weights [KiB]
Dense78.9158.63
LSTM Stateless4.9122
LSTM Stateful10.5910.19
GRU Stateless4.7816.63
GRU Stateful17.1625.94
Parallel TCNs20.7738.52
Table 11. SR5E1-EVBE3000D MACC and Inference Time results.
ArchitectureMACCInference Time [ms]
Dense1,206,40124.26
LSTM Stateless553,63320.64
LSTM Stateful256,10011.42
GRU Stateless409,63312.84
GRU Stateful643,21719.25
Parallel TCNs1,457,52328.48
Table 12. STM32H5731-DK MACC and Inference Time results.
ArchitectureMACCInference Time [ms]
Dense1,206,40123.43
LSTM Stateless553,63320.99
LSTM Stateful256,10012.10
GRU Stateless409,63313.33
GRU Stateful643,21720.00
Parallel TCNs1,457,52330.27
Table 13. STM32MP257F-EV1 1 Core, RAM and Inference Time results for 8bits quantized neural networks.
ArchitectureRAM Size MBInference Time [ms]
Dense4.811.28
Parallel TCNs4.971.17
Table 14. STM32MP257F-EV1 2 Cores, RAM and Inference Time results for 8bits quantized neural networks.
ArchitectureRAM Size MBInference Time [ms]
Dense4.841.05
Parallel TCNs4.920.88
Table 15. Latencies to store the input feature batch into embedded MCU memory at startup (1000 features) and in throughput (10 features update).
MCULatency at Startup [μs]Throughput Latency [ns]
SR5E1-EVBE30006.666
STM32H5731-DK7.171
STM32MP257F1.313
Table 16. Battery pack architecture of common EV models.
Car ModelNumber of CellsPack Configuration
BMW i39696s1p
BYD ATTO 3126126s1p
Porsche Macan 4 Electric180180s1p
Nissan Leaf19296s2p
Fiat 500e Hatchback 42 kWh19296s2p
Audi Q8 e-tron432108s4p
Lucid Air Grand Touring6600220s30p
Rimac Nevera6960174s40p
Tesla Model S Plaid7920110s72p
Table 17. Per cell inference time on battery pack SoC estimation of EV using 8bits Parallel TCNs architecture deployed on STM32MP257F-EV1-2 cores and fp32 LSTM Stateless architecture deployed on a SR5E1-EVBE3000D.
Car ModelTCN-8b-STM32MP257F-EV1-2cores [s]LSTM-fp32-SR5E1-EVBE3000D [s]
BMW i30.0841.981
Nissan Leaf0.1683.962
Audi Q8 e-tron0.3808.916
BYD ATTO 30.1102.600
Fiat 500e Hatchback 42 kWh0.1683.962
Porsche Macan 4 Electric0.1583.715
Lucid Air Grand Touring5.808136.224
Rimac Nevera6.124143.654
Tesla Model S Plaid6.969163.468
Table 18. Per “xS” inference time on battery pack SoC estimation of EV using 8bits Parallel TCNs architecture deployed on STM32MP257F-EV1-2cores and fp32 LSTM Stateless architecture deployed on SR5E1-EVBE3000D.
Car ModelTCN-8b-STM32MP257F-EV1-2cores [s]LSTM-fp32-SR5E1-EVBE3000D [s]
Lucid Air Grand Touring0.1934.540
Rimac Nevera0.1533.591
Tesla Model S Plaid0.0962.270
Disclaimer/Publisher’s Note: The statements, opinions and data contained in all publications are solely those of the individual author(s) and contributor(s) and not of MDPI and/or the editor(s). MDPI and/or the editor(s) disclaim responsibility for any injury to people or property resulting from any ideas, methods, instructions or products referred to in the content.

