Article

Numerical Simulation of Vertical Well Depressurization-Assisted In Situ Heating Mining in a Class 1-Type Hydrate Reservoir

1
Guangzhou Marine Geology Survey, China Geological Survey, Ministry of Natural Resources, Guangzhou 511458, China
2
National Engineering Research Center for Gas Hydrate Exploration and Development, Guangzhou 511458, China
*
Authors to whom correspondence should be addressed.
Appl. Sci. 2024, 14(14), 6203; https://doi.org/10.3390/app14146203
Submission received: 12 June 2024 / Revised: 12 July 2024 / Accepted: 15 July 2024 / Published: 17 July 2024

Abstract

:
In situ electric heating is an important method used to increase production capacity during the extraction of natural gas hydrates. This work numerically evaluated the sensitivity of different heating parameters on gas production behavior with a vertical well depressurization in the Shenhu Sea area hydrate reservoir, the production pressure difference of 4 MPa, and continuous depressurization for 1080 days. The results showed that the in situ electric heating method can effectively enhance production capability by promoting hydrate dissociation and eliminating secondary hydrates. Compared with scenarios without heating, implementing whole wellbore heating (100 W/m) increases cumulative gas production (Vg) by 118.56%. When intermittent heating is applied to the local wellbore (15 m) located in the three-phase layer (with an interval of 30 days) and stops heating in advance at 480 days, there is no significant difference in Vg compared to the whole wellbore heating case, and the cumulative heat input is only 4.76%. We recommend considering intermittent heating of the local wellbore and stopping heating in advance during vertical well depressurization as this approach significantly reduces heating energy consumption while simultaneously improving production capacity.

1. Introduction

Natural gas hydrates (NGHs) are compact crystalline substances from the combination of water and gas [1]. Deep sea and permafrost geological environments are suitable places for the formation and occurrence of hydrates [1,2,3]. NGH resources are considered a significant alternative energy source for future global sustainable development [3,4]. The recent offshore NGH trial production completed in the South China Sea (SCS) and Japan’s Nankai Trough verified the efficiency of the depressurization method, but their production capacity is still far below the standard for industrial development [5,6,7,8,9]. To achieve industrial development of NGHs, various studies likewise contribute relevant information and background on environmentally friendly, safe, and efficient exploitation of NGHs (e.g., Okwananke et al., 2019; Zhang et al., 2019; Farahani et al., 2021) [10,11,12]. Currently, the most promising method for achieving industrial development is the complex structured well or well-pattern production mode combined with the composite production method (such as assisted-thermal extraction) and/or reservoir stimulation technologies (such as hydraulic fracturing) [13]. The depressurization-assisted thermal extraction method can be divided into two categories as follows: one is fluid-assisted thermal mining methods (such as hot water injection, geothermal assistance, etc.), and the other is non-fluid assisted thermal mining methods (such as electric heating, microwave heating, in situ backfill heating, etc.) [13]. The fluid-assisted thermal mining method is prone to forming high-pressure injection zones, which inhibits hydrate dissociation and makes injection in low-permeability reservoirs problematic; the method also has the problem of significant heat loss [13]. The non-fluid-assisted thermal mining method is less likely to cause reservoir instability and other issues and is thus especially suitable for low-permeability reservoirs [13]. In recent years, the non-fluid-assisted thermal mining method has attracted a lot of attention and research effort. For example, Zheng et al. (2018) conducted a sensitivity analysis on the dissociation front of hydrates under the conditions of depressurization combined with wellbore heating [14]. Zhao et al. (2021) used depressurization assisted with the heating method to extract Class 2-type hydrate reservoirs, and their numerical results confirmed the efficiency of the method [15]. Xu et al. (2021) numerically validated the effectiveness of extracting NGHs by depressurization combined with in situ backfilling CaO powder [16]. Li et al. (2021) found that when using the five-point method to extract hydrate reservoirs, the recovery rate of hot water injection was almost the same as that of electric heating combined with water injection, with only wellbore heating suitable for low-permeability hydrate reservoir extraction [17]. Zhao et al. (2021) analyzed the production performance of the NGHs in the SCS using a mathematical model of low-frequency electric heating and depressurization (LF-EHAD). Their results showed that after more than 5 years of continuous production, the gas production of LF-EHAD is 2.37 times that of depressurization [18]. Liu et al. (2022) found that intermittent heating has higher energy utilization efficiency than continuous heating in depressurization-assisted thermal for extracting hydrates [19]. Zhao et al. (2022) numerically validated the effectiveness of using LF-EHAD to develop Class 1-type hydrate deposits with five-point wells [20]. Wang et al. (2022) found that microwaves can quickly respond to the energy demand for hydrate dissociation [21]. Zhang et al. (2022) discovered that combining brine flooding and electric heating can result in low heat loss and enhanced thermal convection [22]. Zhang et al. (2023) numerically compared the recovery efficiency of different assisted heating methods under dual horizontal well depressurization mining. They found that LF-EHAD can promote the dissociation of hydrates and the heat distribution is more uniform than wellbore electric heating, avoiding wellbore instability caused by continuous high temperatures [23]. Previous research work has effectively improved the technical feasibility of the non-fluid-assisted thermal method in NGH mining. The group well mining scheme is an inevitable choice for the future industrial development of hydrates, and the vertical well is an important basic well type of the group well mining scheme. It is necessary to further study the application strategy of assisted heating methods in vertical well depressurization.
On-site testing is difficult and costly, and numerical simulation methods are the best choice for studying the large-scale development of NGHs. Some well-known simulators include TOUGH+HYDRATE, CMG-STARS, MH21-HYDRES, STOMP-HYD, etc. [24,25,26,27]. Except for TOUGH+HYDRATE and CMG-STARS, which are widely used, other simulators are limited to use by development departments because of technical confidentiality and intellectual property reasons. TOUGH+HYDRATE is specifically developed for hydrate exploitation simulation and has the best applicability, although its disadvantage is weak pre- and post-processing. CMG is not specifically developed for simulating hydrate extraction, and its description of hydrate characteristics may be insufficient, but it has more advantages in pre- and post-processing. This work adopted TOUGH+HYDRATE and numerically analyzed the effects of different heating parameters such as heating power, heating location, heating time, and heating mode on gas production in a Class 1-type hydrate reservoir with a single vertical well depressurization and proposed an efficient application strategy for assisted in situ electric heating. The research results provide a reference for hydrate extraction in the Shenhu Sea area.

2. Methodology

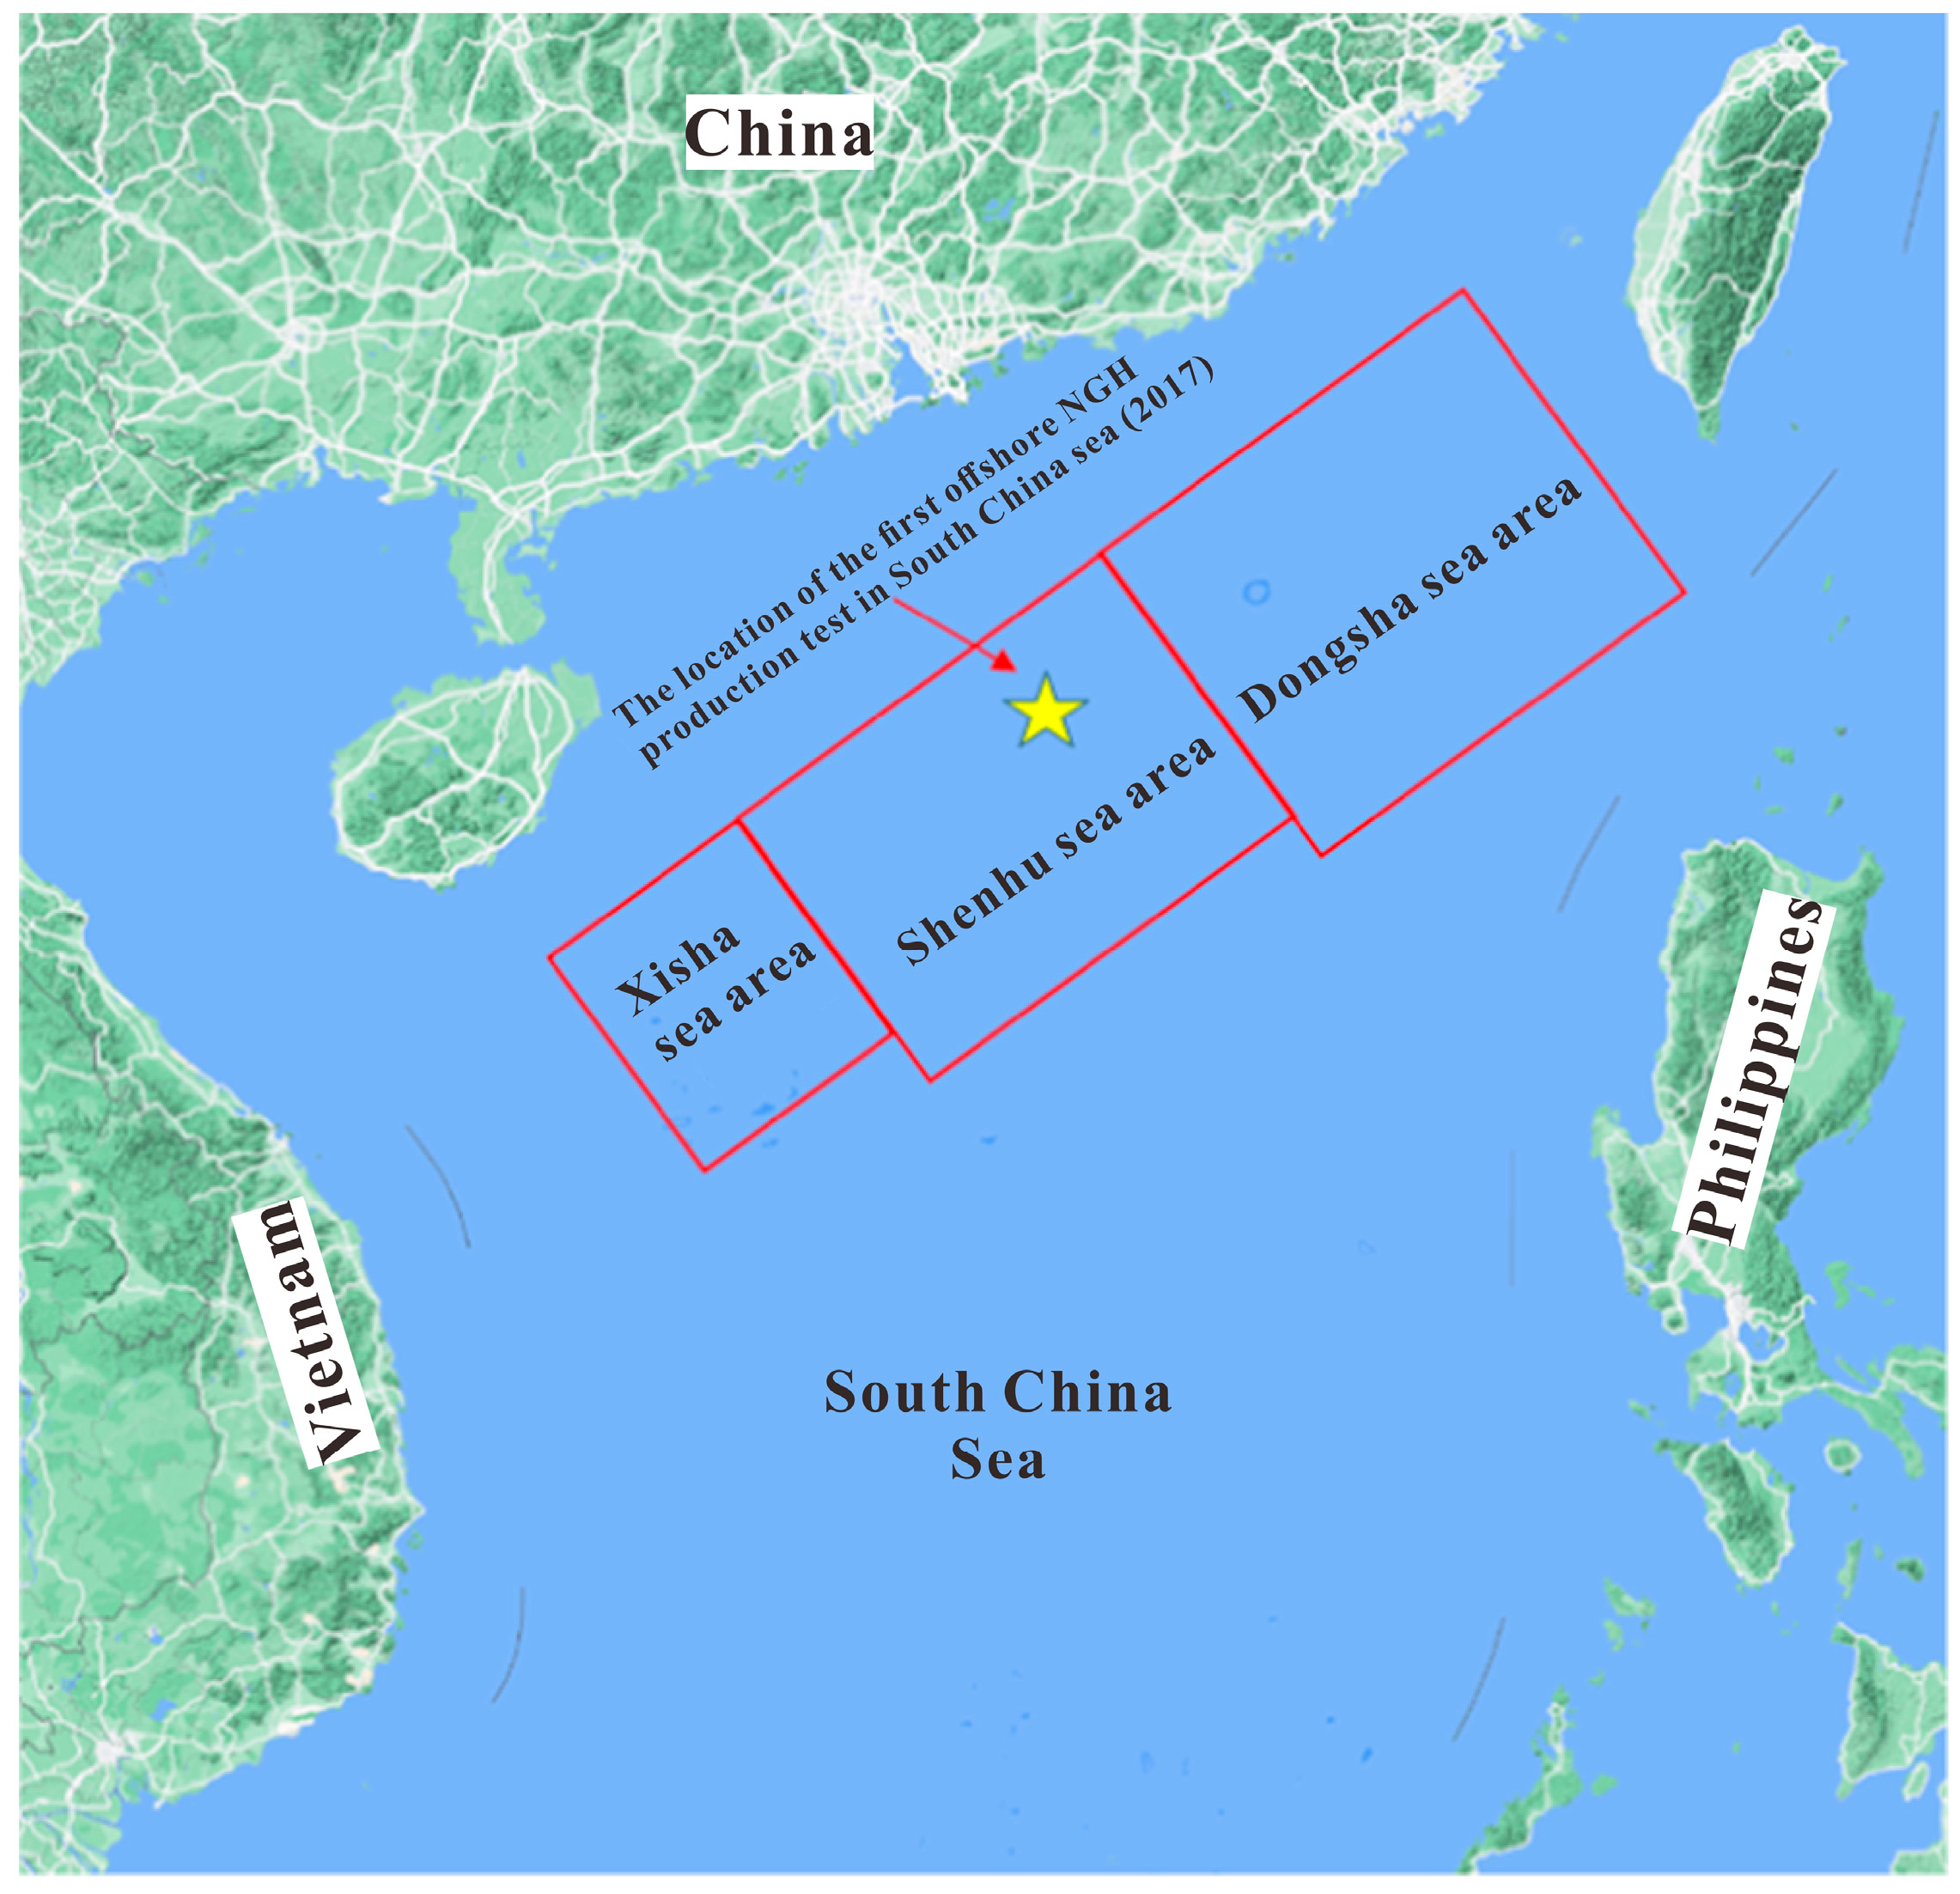
2.1. Site Description

Class 1-type hydrate reservoirs consist of an upper hydrate layer and an underlying two-phase fluid layer containing free gas and water. The SHSC4 (Figure 1) well’s NGH reservoir is classified as Class 1-type with three layers as follows: (1) the gas hydrate-bearing layer (GHBL) contains water and hydrates, with a buried depth of 201–236 m below seafloor (mbsf); (2) the three-phase layer (TPL) contains water, free gas, and hydrates, with a buried depth of 236–251 mbsf; and (3) the free gas layer (FGL) contains water and free gas, with a buried depth of 251–278 mbsf [8,28,29].

2.2. Simulator

TOUGH+HYDRATE V1.0 comprehensively considers depressurization, inhibitors, thermal stimulation, and combined methods. It includes equilibrium and kinetic models for describing the dissociation and formation of hydrates, considering components including water, methane, salt, and hydrate. The phase states include water, gas, ice, and hydrate. By adopting the fully implicit equation form, continuously updating physical property parameters, and decoupling the nonlinear equations of heat and flow using the Newton iteration method, phase change calculations can be efficiently completed [24]. The efficiency of this code has been experimentally and on-site verified [31,32]. We adopted the parallel version of this code and the equilibrium model in this work [33,34]. During the simulation process, it was assumed that Darcy’s law is applicable, and geological mechanical responses were ignored. The main equations of the code are as follows [24]:
  • Multi-components and -phases.
Multicomponent (κ): methane (m), water (w), salt (i), and hydrate (h); multiphase (β): hydrate (H), aqueous (A), gas (G), and ice (I).
2.
Mass conservation equation.
The mass conservation equation of the code is as follows:
d d t V n M κ d V = Γ n F κ n d Γ + V n q κ d V
The component’s mass accumulation, flux, and source/sink ratio are represented by M κ , F κ , and q κ in the above equation.
3.
Energy conservation equation.
The energy conservation equation of the code is as follows:
d d t V n M θ d V = Γ n F θ n d Γ + V n q θ d V
The heat component, heat accumulation, flux, and source/sink ratio are represented by θ, M θ , F θ , and q θ in the above equation.

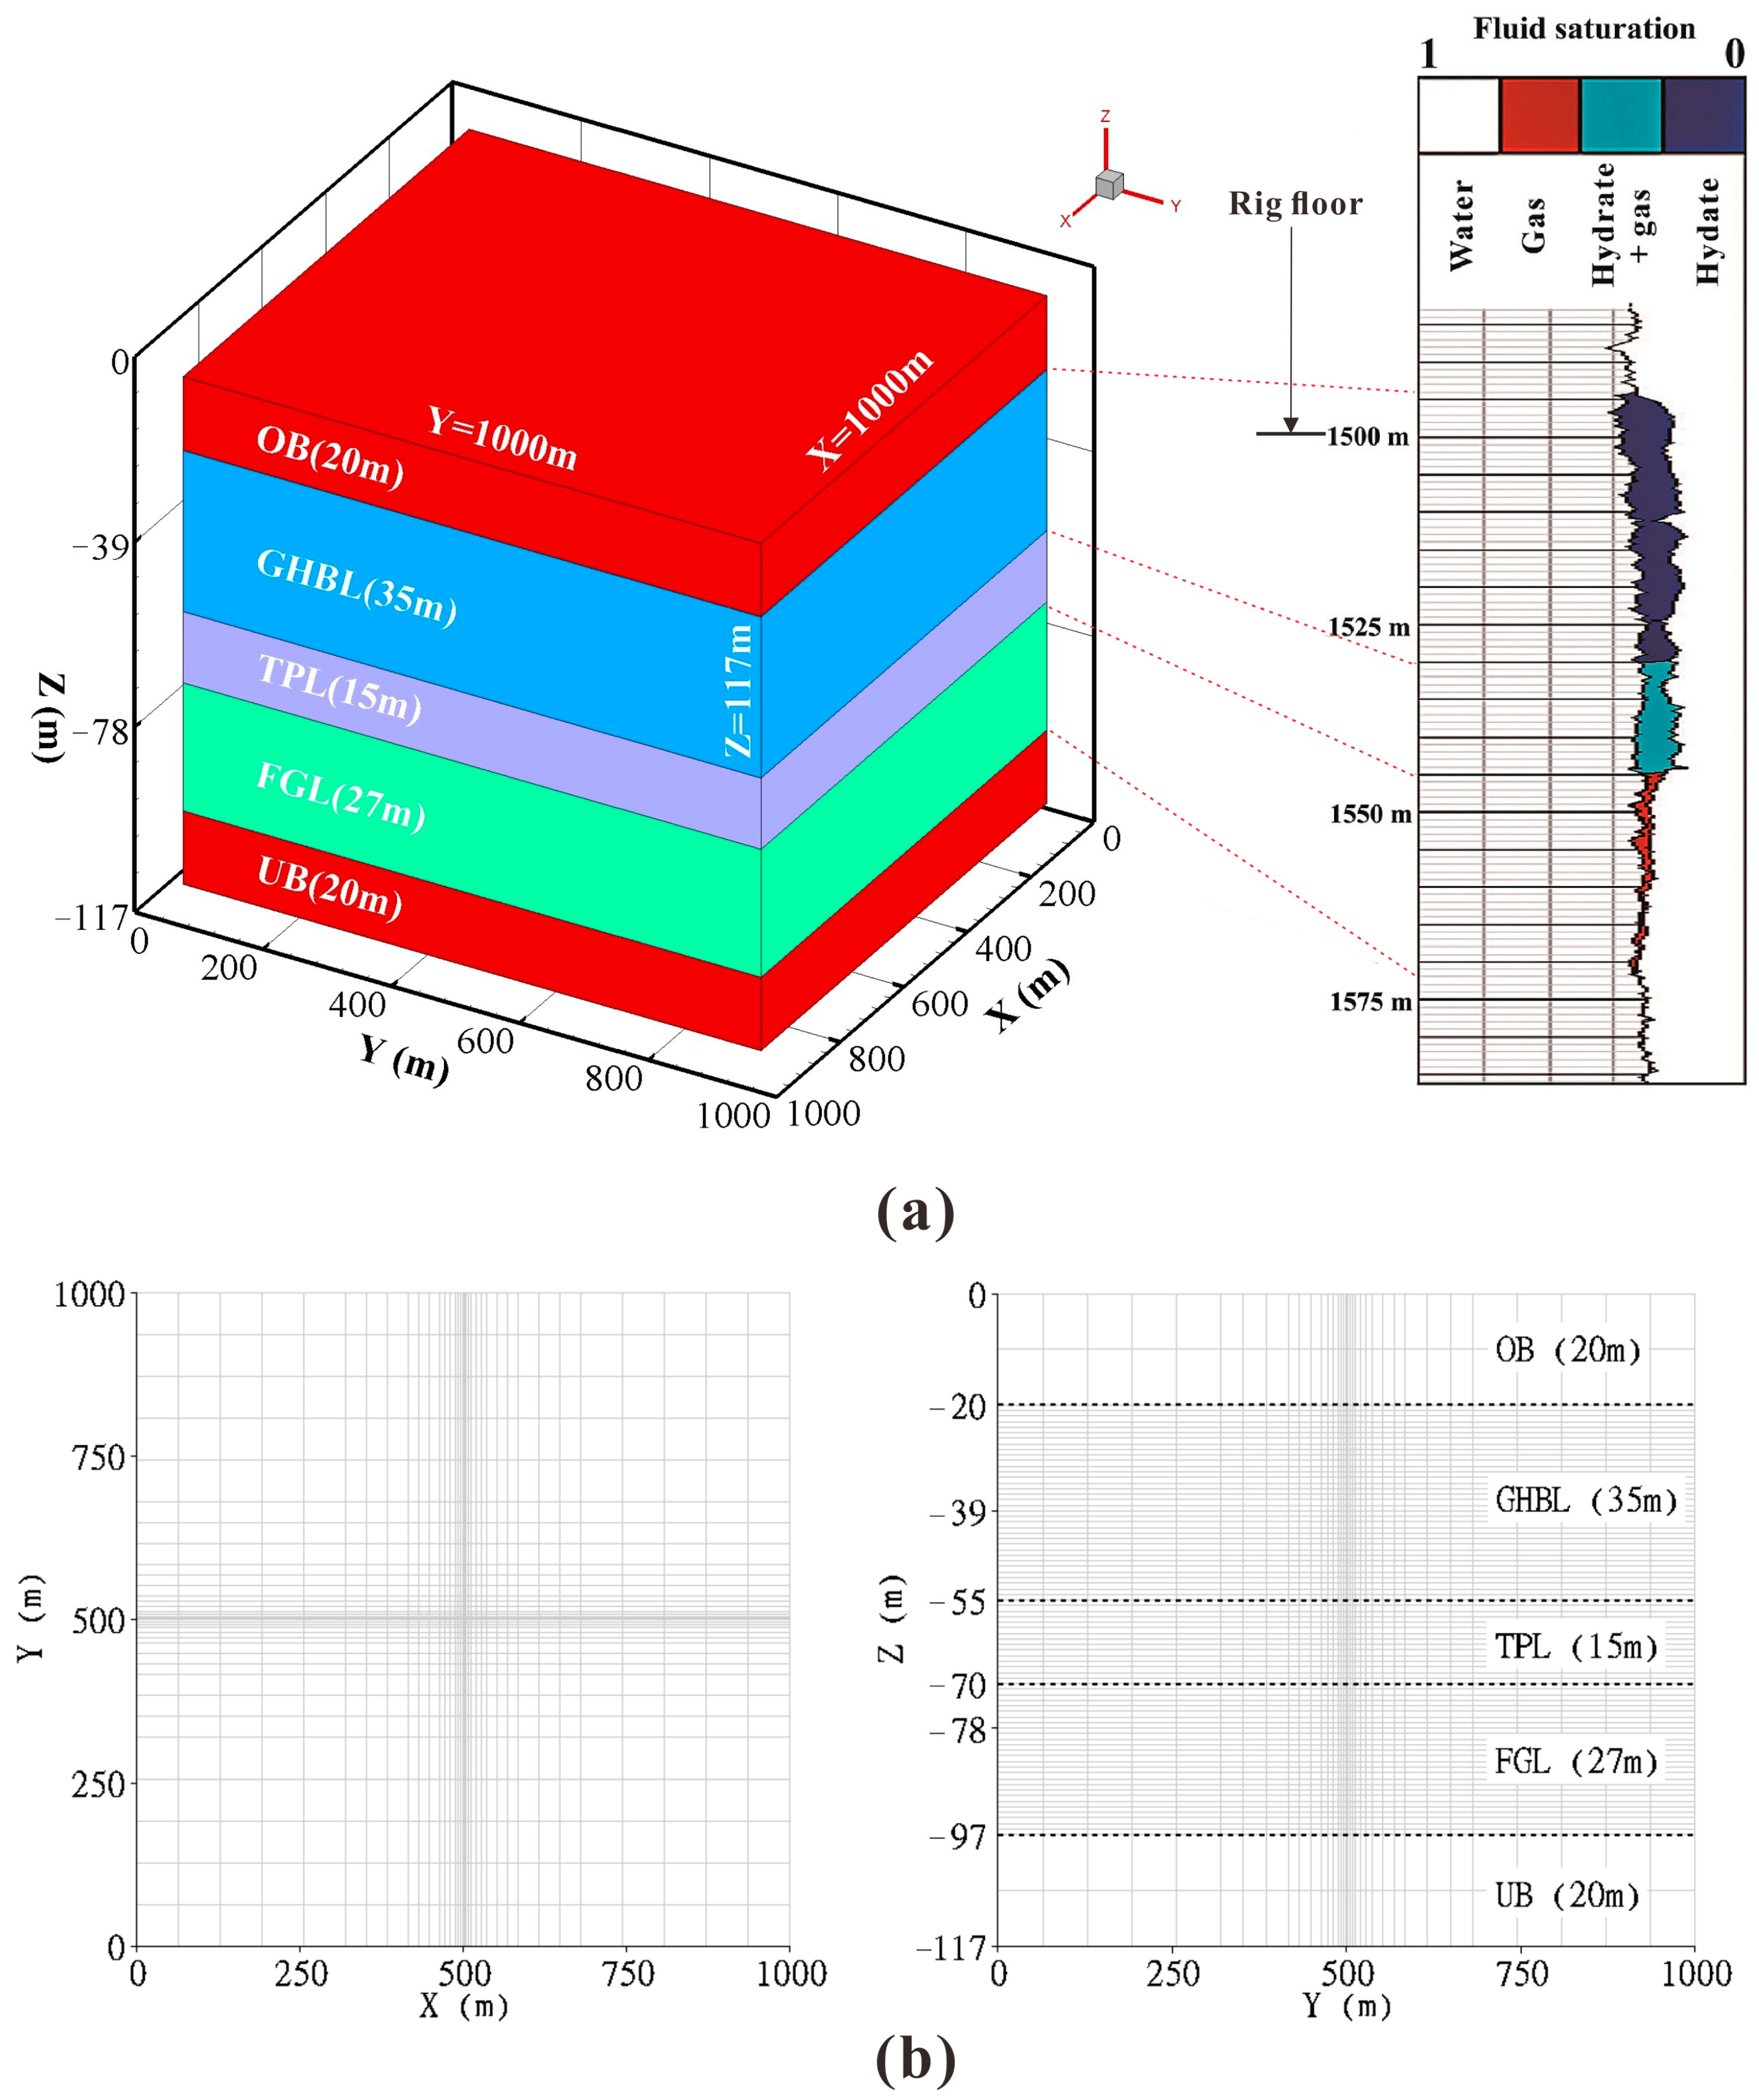
2.3. Model Construction

The size of the model is 1000 × 1000 × 117 m in (x, y, z) (Figure 2a). The thicknesses of the underburden (UB) and overburden (OB) are set to be 20 m [35,36]. This work created twelve simulated cases to assess the impacts of various heating parameters, with each case including a 70 m long vertical well deployed at the center of the model (model’s −21 and −91 m) with a wellbore radius of 0.1 m. The reservoir properties used in the simulation are summarized in Table 1.
The model is discretized into 37 × 37 × 81 grids in (x, y, z), with a total of 110,889 grids (Figure 2b). Here, the x-y plane discretization is carried out separately. To capture subtle changes in the physical properties of the reservoir around the wellbore, the mesh near the wellbore is appropriately refined, the minimum grid size near the wellbore is set to be 1.0 m and then extruded along the z-axis into a 3D discretized grid. The grid size of the hydrate reservoir along the z-axis is set to be 1.0 m.

2.4. Model Initialization

To obtain the model’s initial pressure, temperature, and saturation steady-state conditions (Figure 3), we separately simulated three subdomains (GHBL, TPL, and FGL). We achieved consistent heat flux between the subdomains’ contact surfaces by fine-tuning the geothermal gradient. Finally, we merged them to complete the initialization of the model [37,38,39,40,41,42,43]. The capillary pressure calculation adopted the van Genuchten model, where the maximum reference aqueous saturation SmxA is 1, the irreducible aqueous saturation SirA is 0.30, the porosity distribution index λ is 0.45, and the initial capillary pressure P0 is 1 × 10⁴ Pa [24,44,45,46]. The capillary force varies with the change in aqueous saturation SA. The relative permeability calculation adopted the Stone model, where KrA is the aqueous phase relative permeability and KrG is the gas phase relative permeability. The irreducible aqueous saturation SirA and irreducible gas saturation SirG are 0.30 and 0.03, respectively, and the aqueous phase permeability reduction index nA and gas phase permeability reduction index nG are 3.5 and 2.5, respectively [24,44,45,46]. KrA varies with the change in aqueous saturation SA, while KrG varies with the change in gas saturation SG. The above model parameter settings are based on previous research work (Li et al., 2018; Cao et al., 2023; Sun et al., 2019; Ma et al., 2020) that verified the applicability of these models and parameters in this sea area [44,45,46]. During the simulation process, the wellbore grids were considered as a “pseudo porous medium” and given a fixed production pressure difference of 4MPa. The porosity of the wellbore grids is 1, and the permeability is 10,000 D, without considering capillary force, the relative permeability varies linearly with the saturation of each phase and has extremely low residual gas saturation [43]. The assumption was made that the OB and UB layers had a permeability of 2.0 mD and porosity of 0.3, respectively [44]. The detailed parameters of the model are summarized in Table 2.

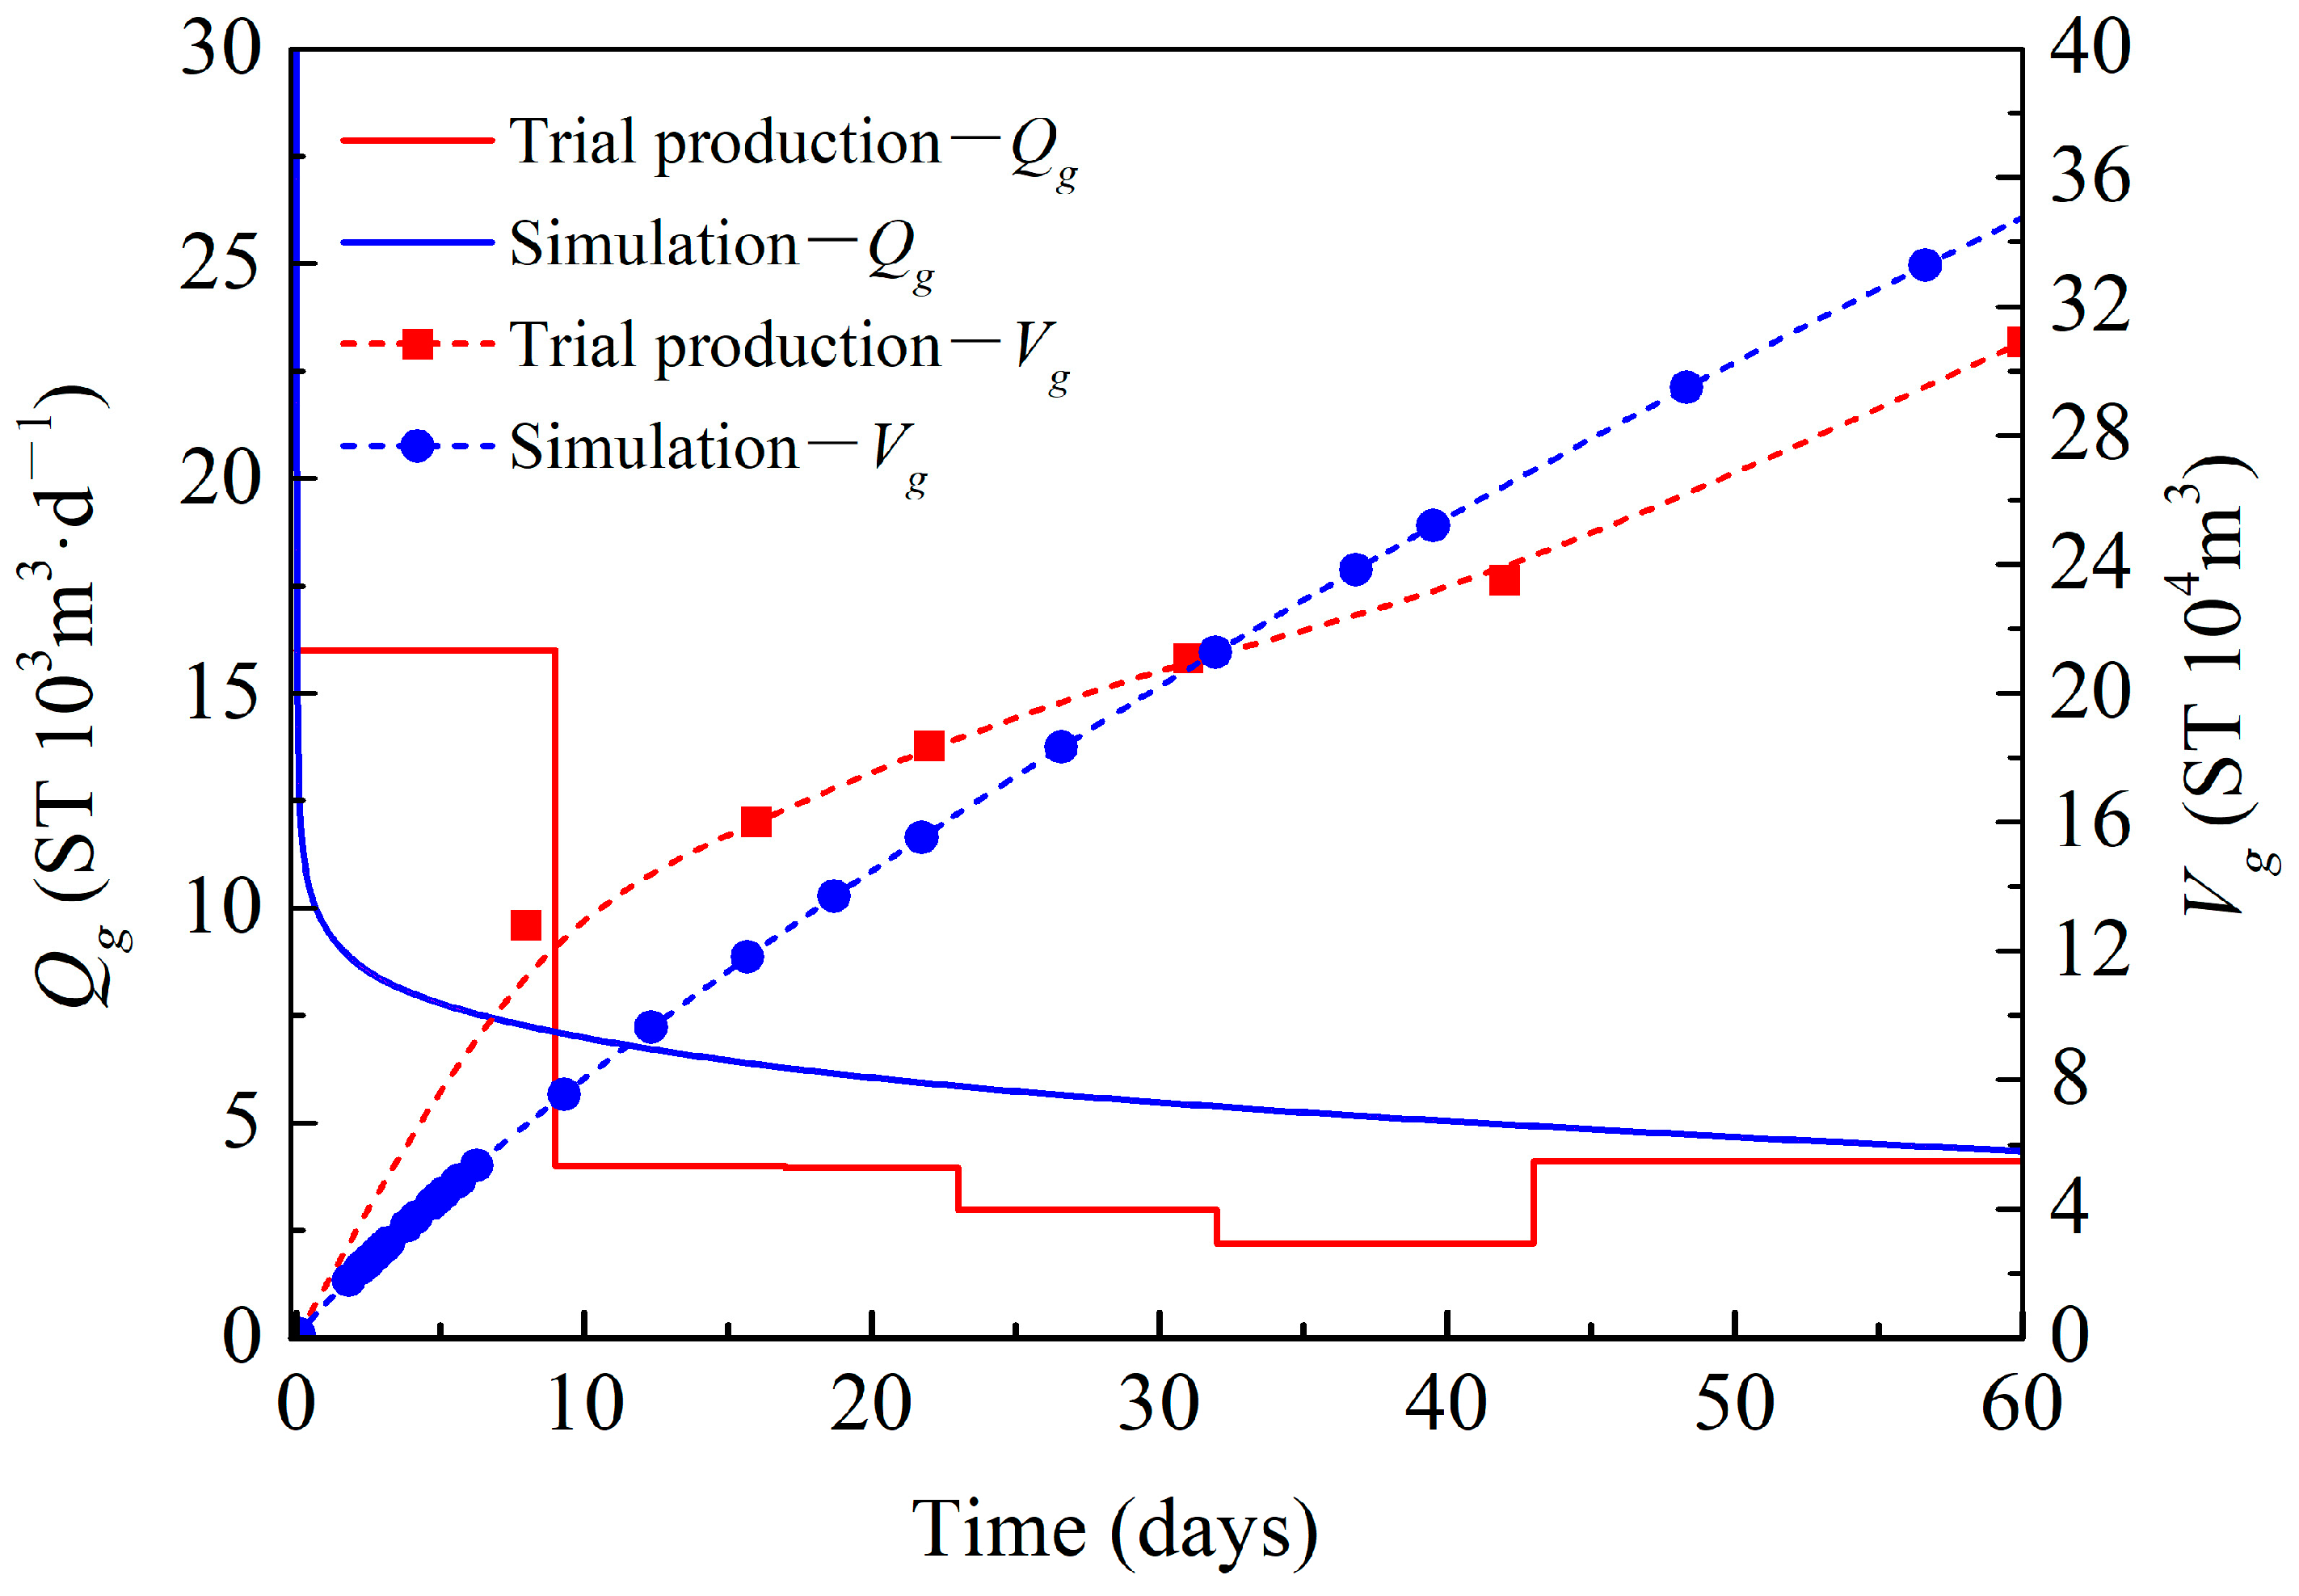
2.5. Model Validation

The model’s effectiveness was validated by the data from China’s first round of offshore NGH trial production. A vertical wellbore was placed in the center of the model with a length of 70 m (model’s −21 and −91 m) and a pressure difference of 3 MPa [47]. As shown in Figure 4, the fitting results indicate that the gas production rate Qg and cumulative gas production Vg both are within the acceptable range. We used the same model and mesh discretization as the model validation in this study.

3. Results and Analysis

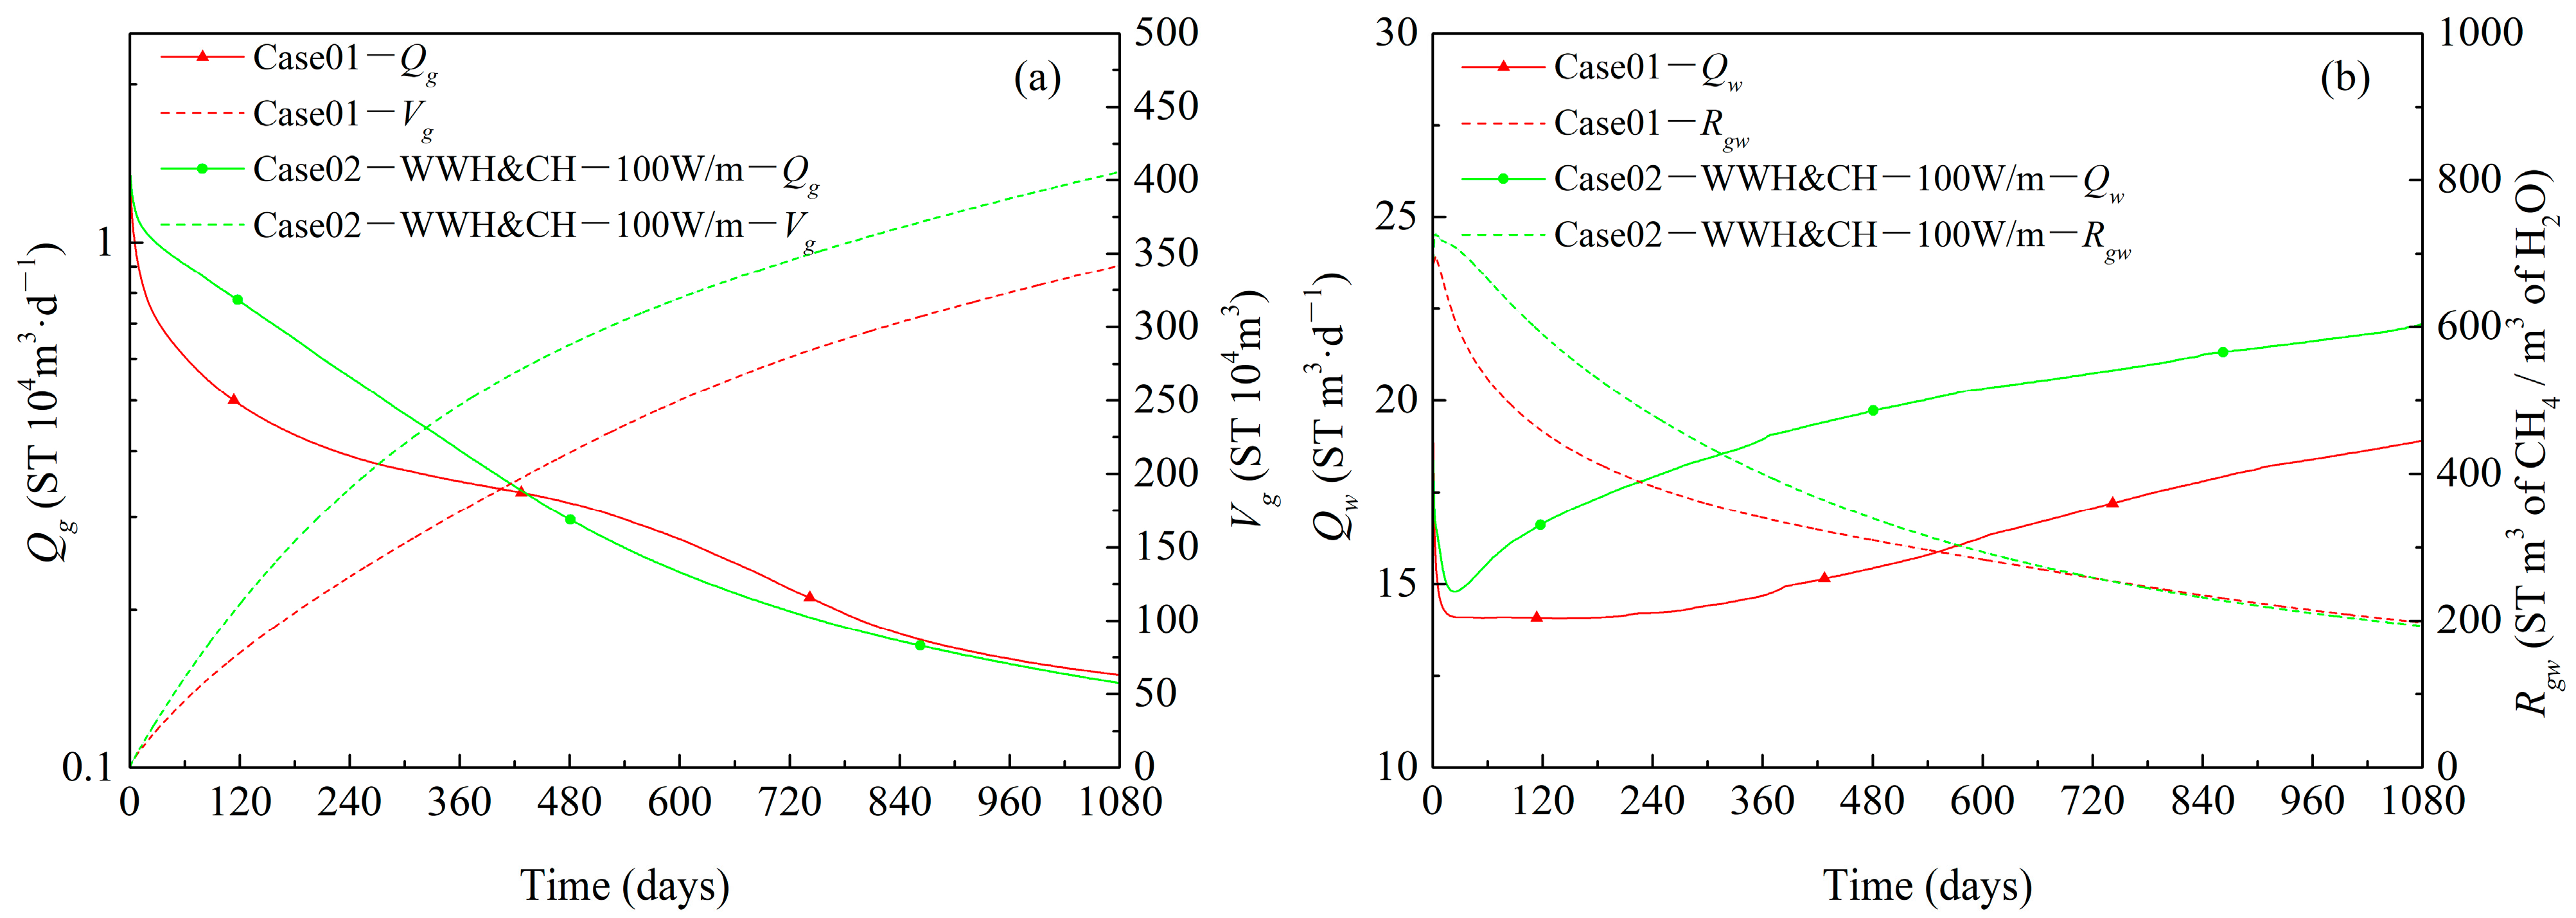
3.1. Gas and Water Production

Figure 5a depicts the trends in Qg and Vg both for the cases without and with whole wellbore heating (WWH) and continuous heating (CH) within 1080 days of production. The Qg in the heating case (heating power set to 100 W/m) is higher than in the case without heating, and in the case assisted with heating, the Vg increases from 3.420 × 10⁶ to 4.055 × 10⁶ ST m3, an increase of 118.56%. The simulation results show that heating technology has a good effect on increasing the production of hydrate depressurization mining. It is worth noting that after approximately 420 days of production, the Qg of the case without heating begins to exceed that of the heating case, and then the Qg of both is consistent around 900 days. This may be caused by the following reasons: firstly, around 420 days, the bottom warm water of the case without heating began to enter the wellbore, and the high-saturation secondary hydrates formed at the TPL began to accelerate dissociation. Secondly, in the heating case, because the high saturation secondary hydrates were not formed around the wellbore, and the gas around the wellbore was quickly extracted, while the gas further away from the wellbore slowly into the wellbore. Thirdly, the non-fluid heating method can only heat the reservoir at a certain distance around the wellbore, and the heating effect gradually weakened in the later stage. The water production rate Qw and gas-to-water ratio Rgw evolutions within 1080 days of production are depicted in Figure 5b. The Qw curve trends in every case are in line with the Qg and show that heating has a positive effect on gas production as well as making it easier to produce water, which raises the Qw. The heating results in a slightly higher Rgw than the case without heating in the first 720 days.

3.2. Reservoir Physical Property Evolution

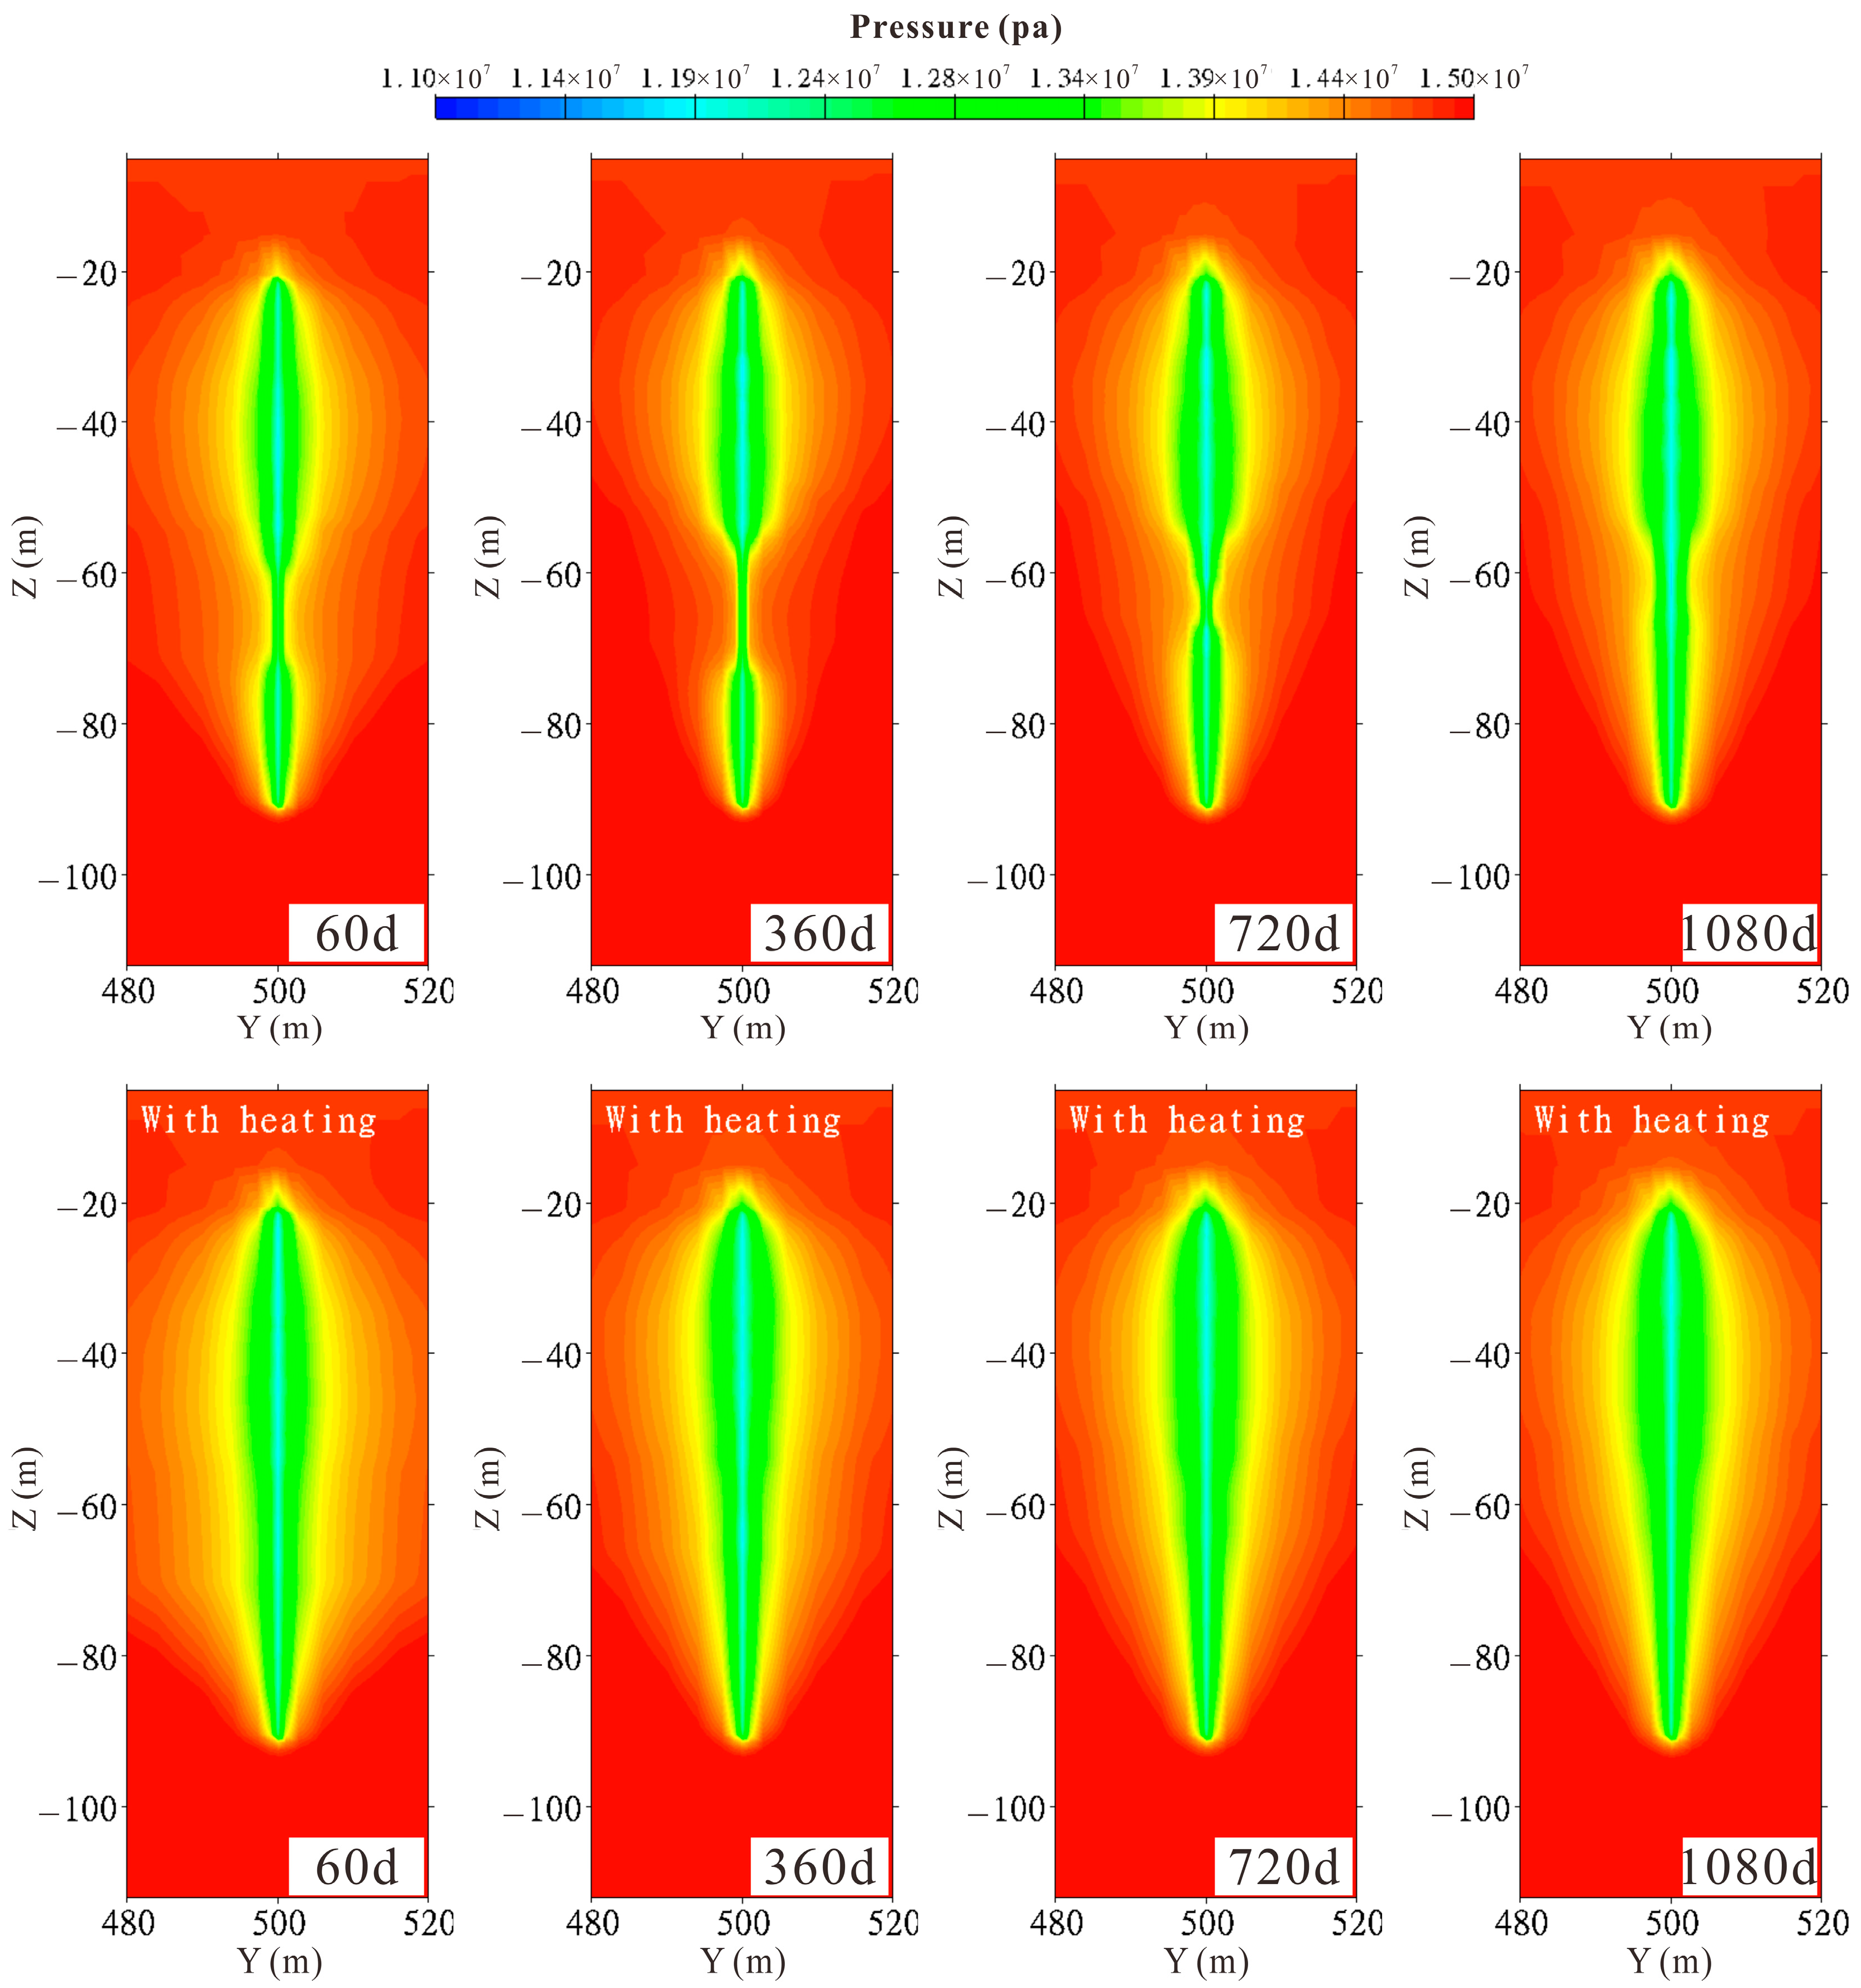
3.2.1. Pore Pressure

Figure 6 presents the evolution diagram of pore pressure (P) for the cases without and with heating within 1080 days. In the pressure field diagram of the case without heating, it can be observed that the wellbore located in the TPL is severely affected by secondary hydrates, resulting in limited pressure propagation. Especially at 360 days, the saturation of the secondary hydrates is highest and the pressure limitation is most obvious. In the heating case, the wellbore located in the TPL did not form significant high-saturation secondary hydrates throughout the entire production cycle, so its pressure propagation was not restricted.

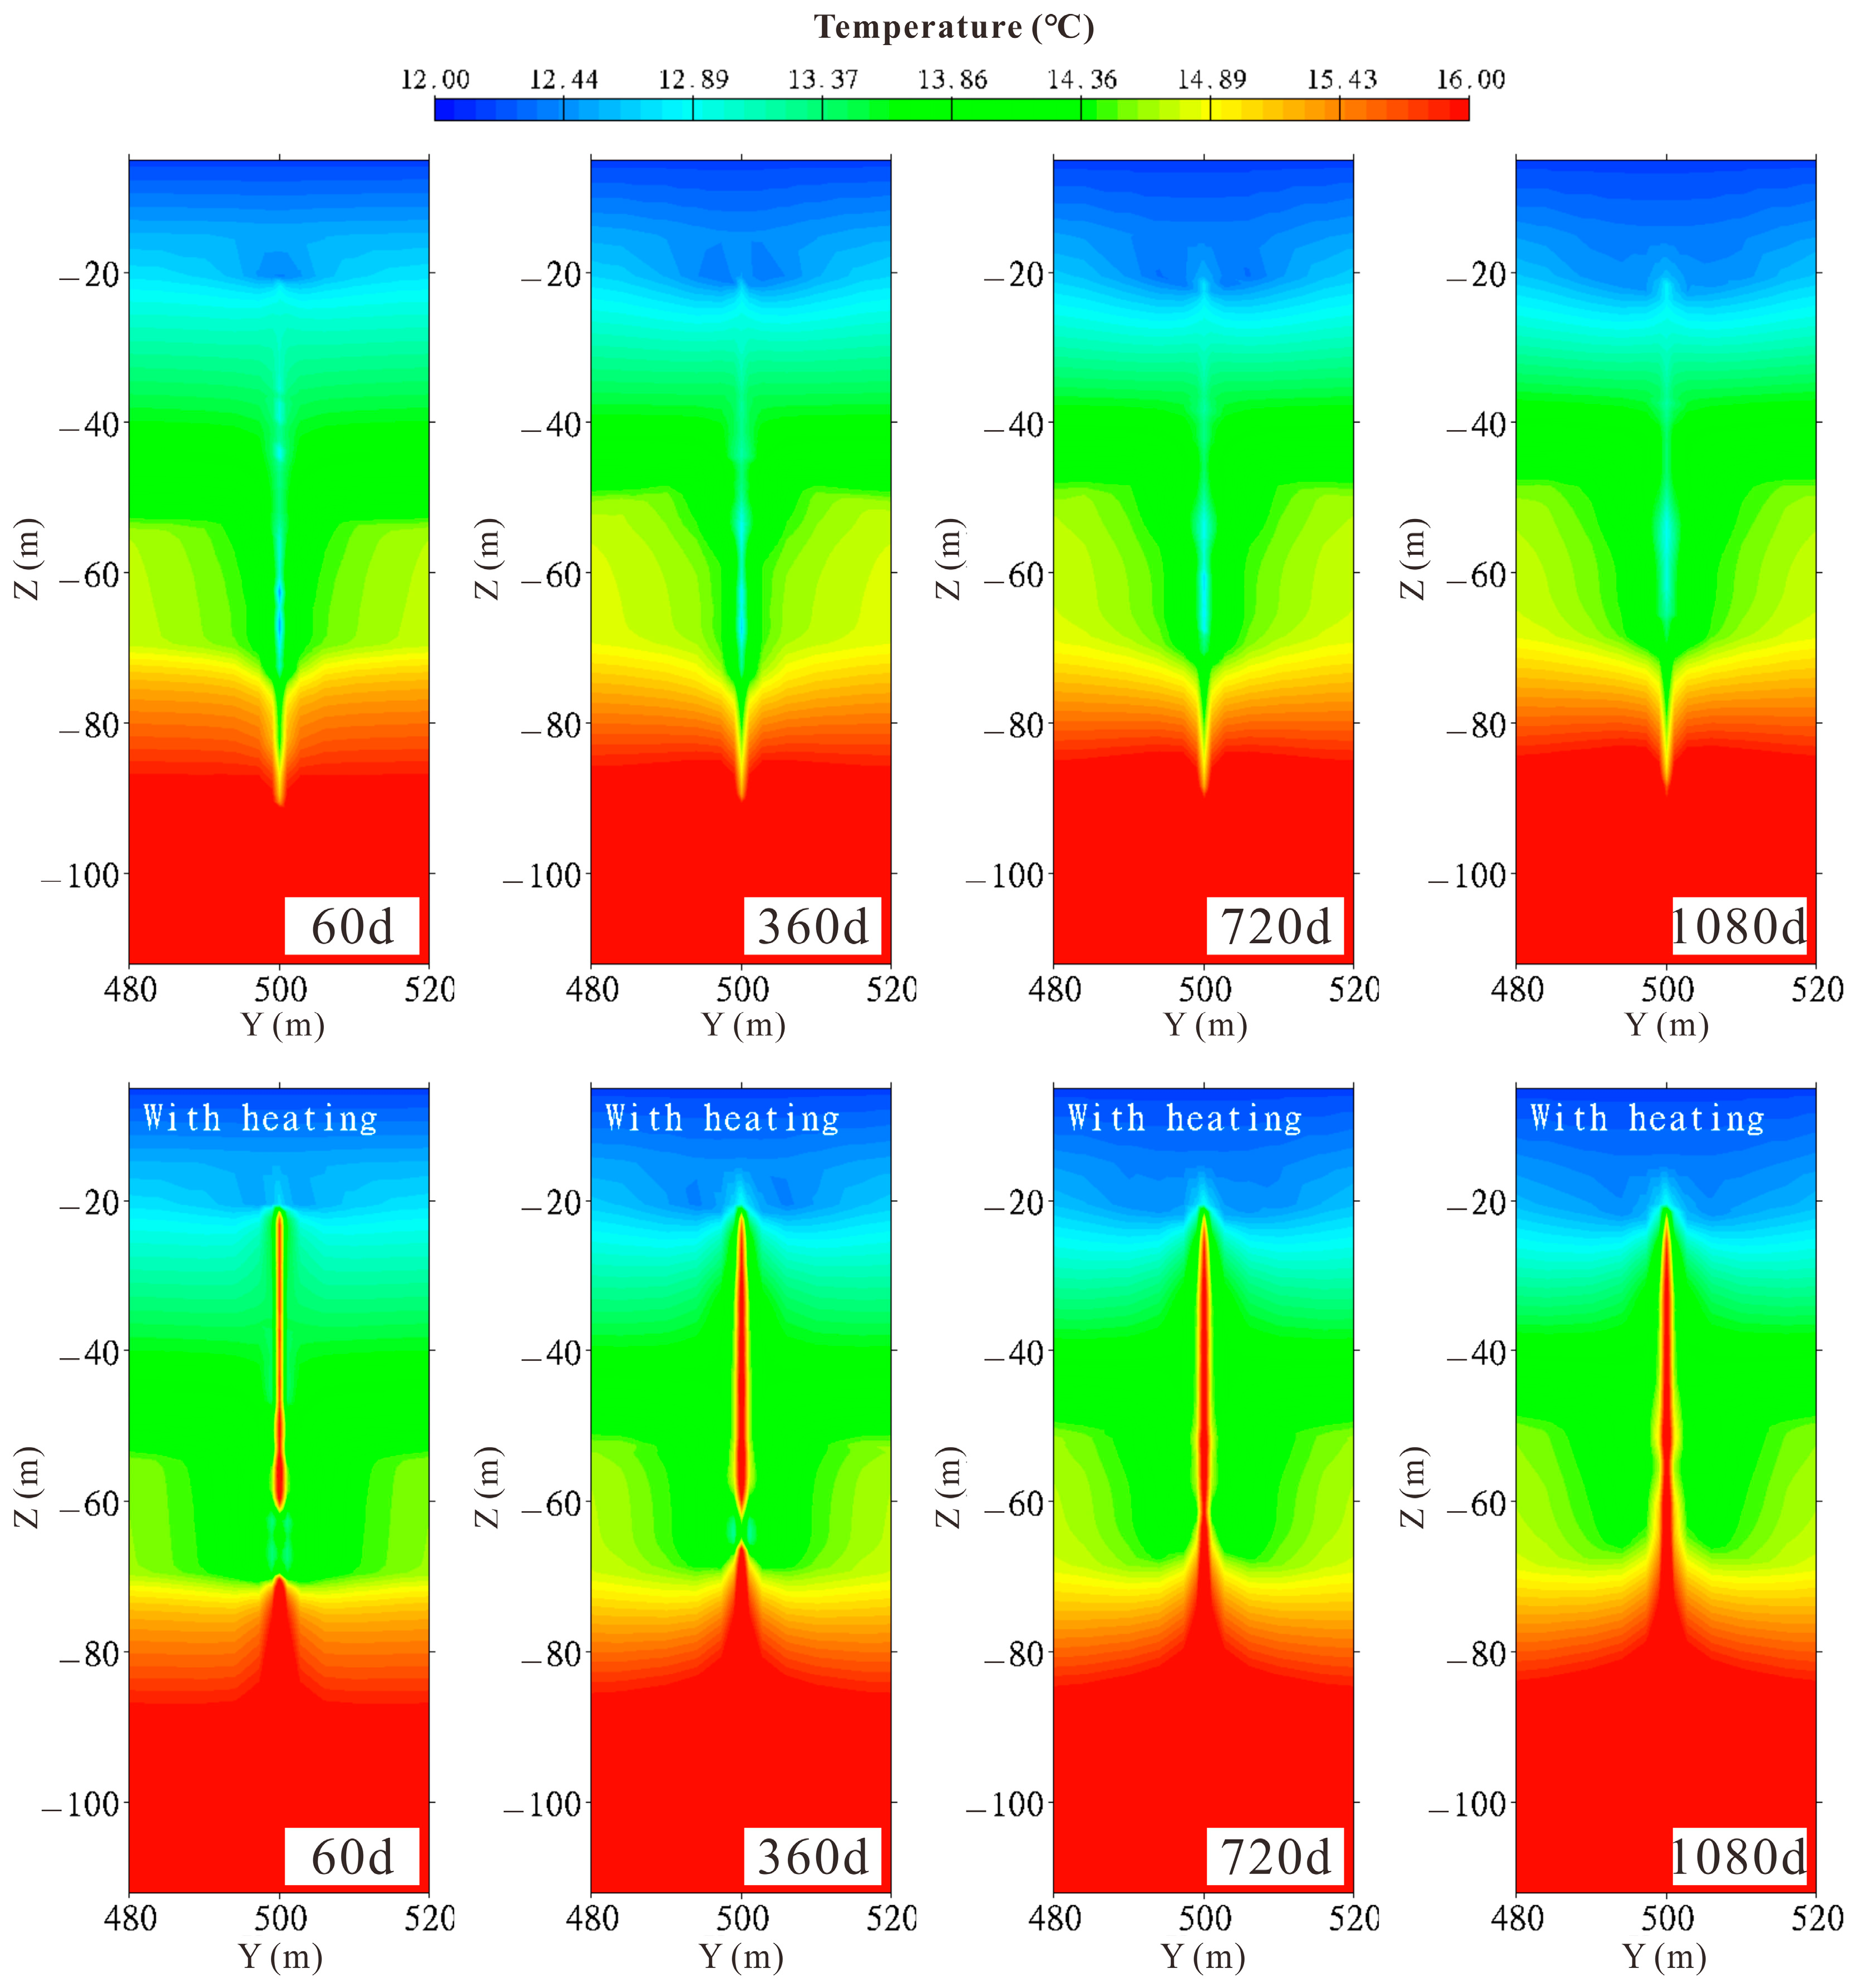
3.2.2. Reservoir Temperature

Figure 7 presents the evolution diagram of reservoir temperature (T) for the cases without and with heating within 1080 days. Initially (60 days), a low-temperature area in the TPL of the reservoir close to the wellbore can be observed in the case without heating. This is because there is a substantial Joule–Thomson effect due to the significant amount of highly saturated free gas entering the wellbore from the TPL, and the wellbore contact area is only around 9.4 m2. With the warm bottom water entering the wellbore, the reservoir temperature around the wellbore gradually increases during the latter period (360 days to 1080 days). In the temperature field diagram (60 days) of the heating case, this phenomenon can also be observed. A heating power of 100 W/m is not enough to completely offset the Joule–Thomson cooling effect located in the TPL. Therefore, a corresponding low-temperature region is also observed here. However, as production progresses, the temperature of the reservoir around the wellbore gradually increases because of the weakening of the Joule–Thomson effect, sustained electrical heating, and bottom warm water entering the wellbore.

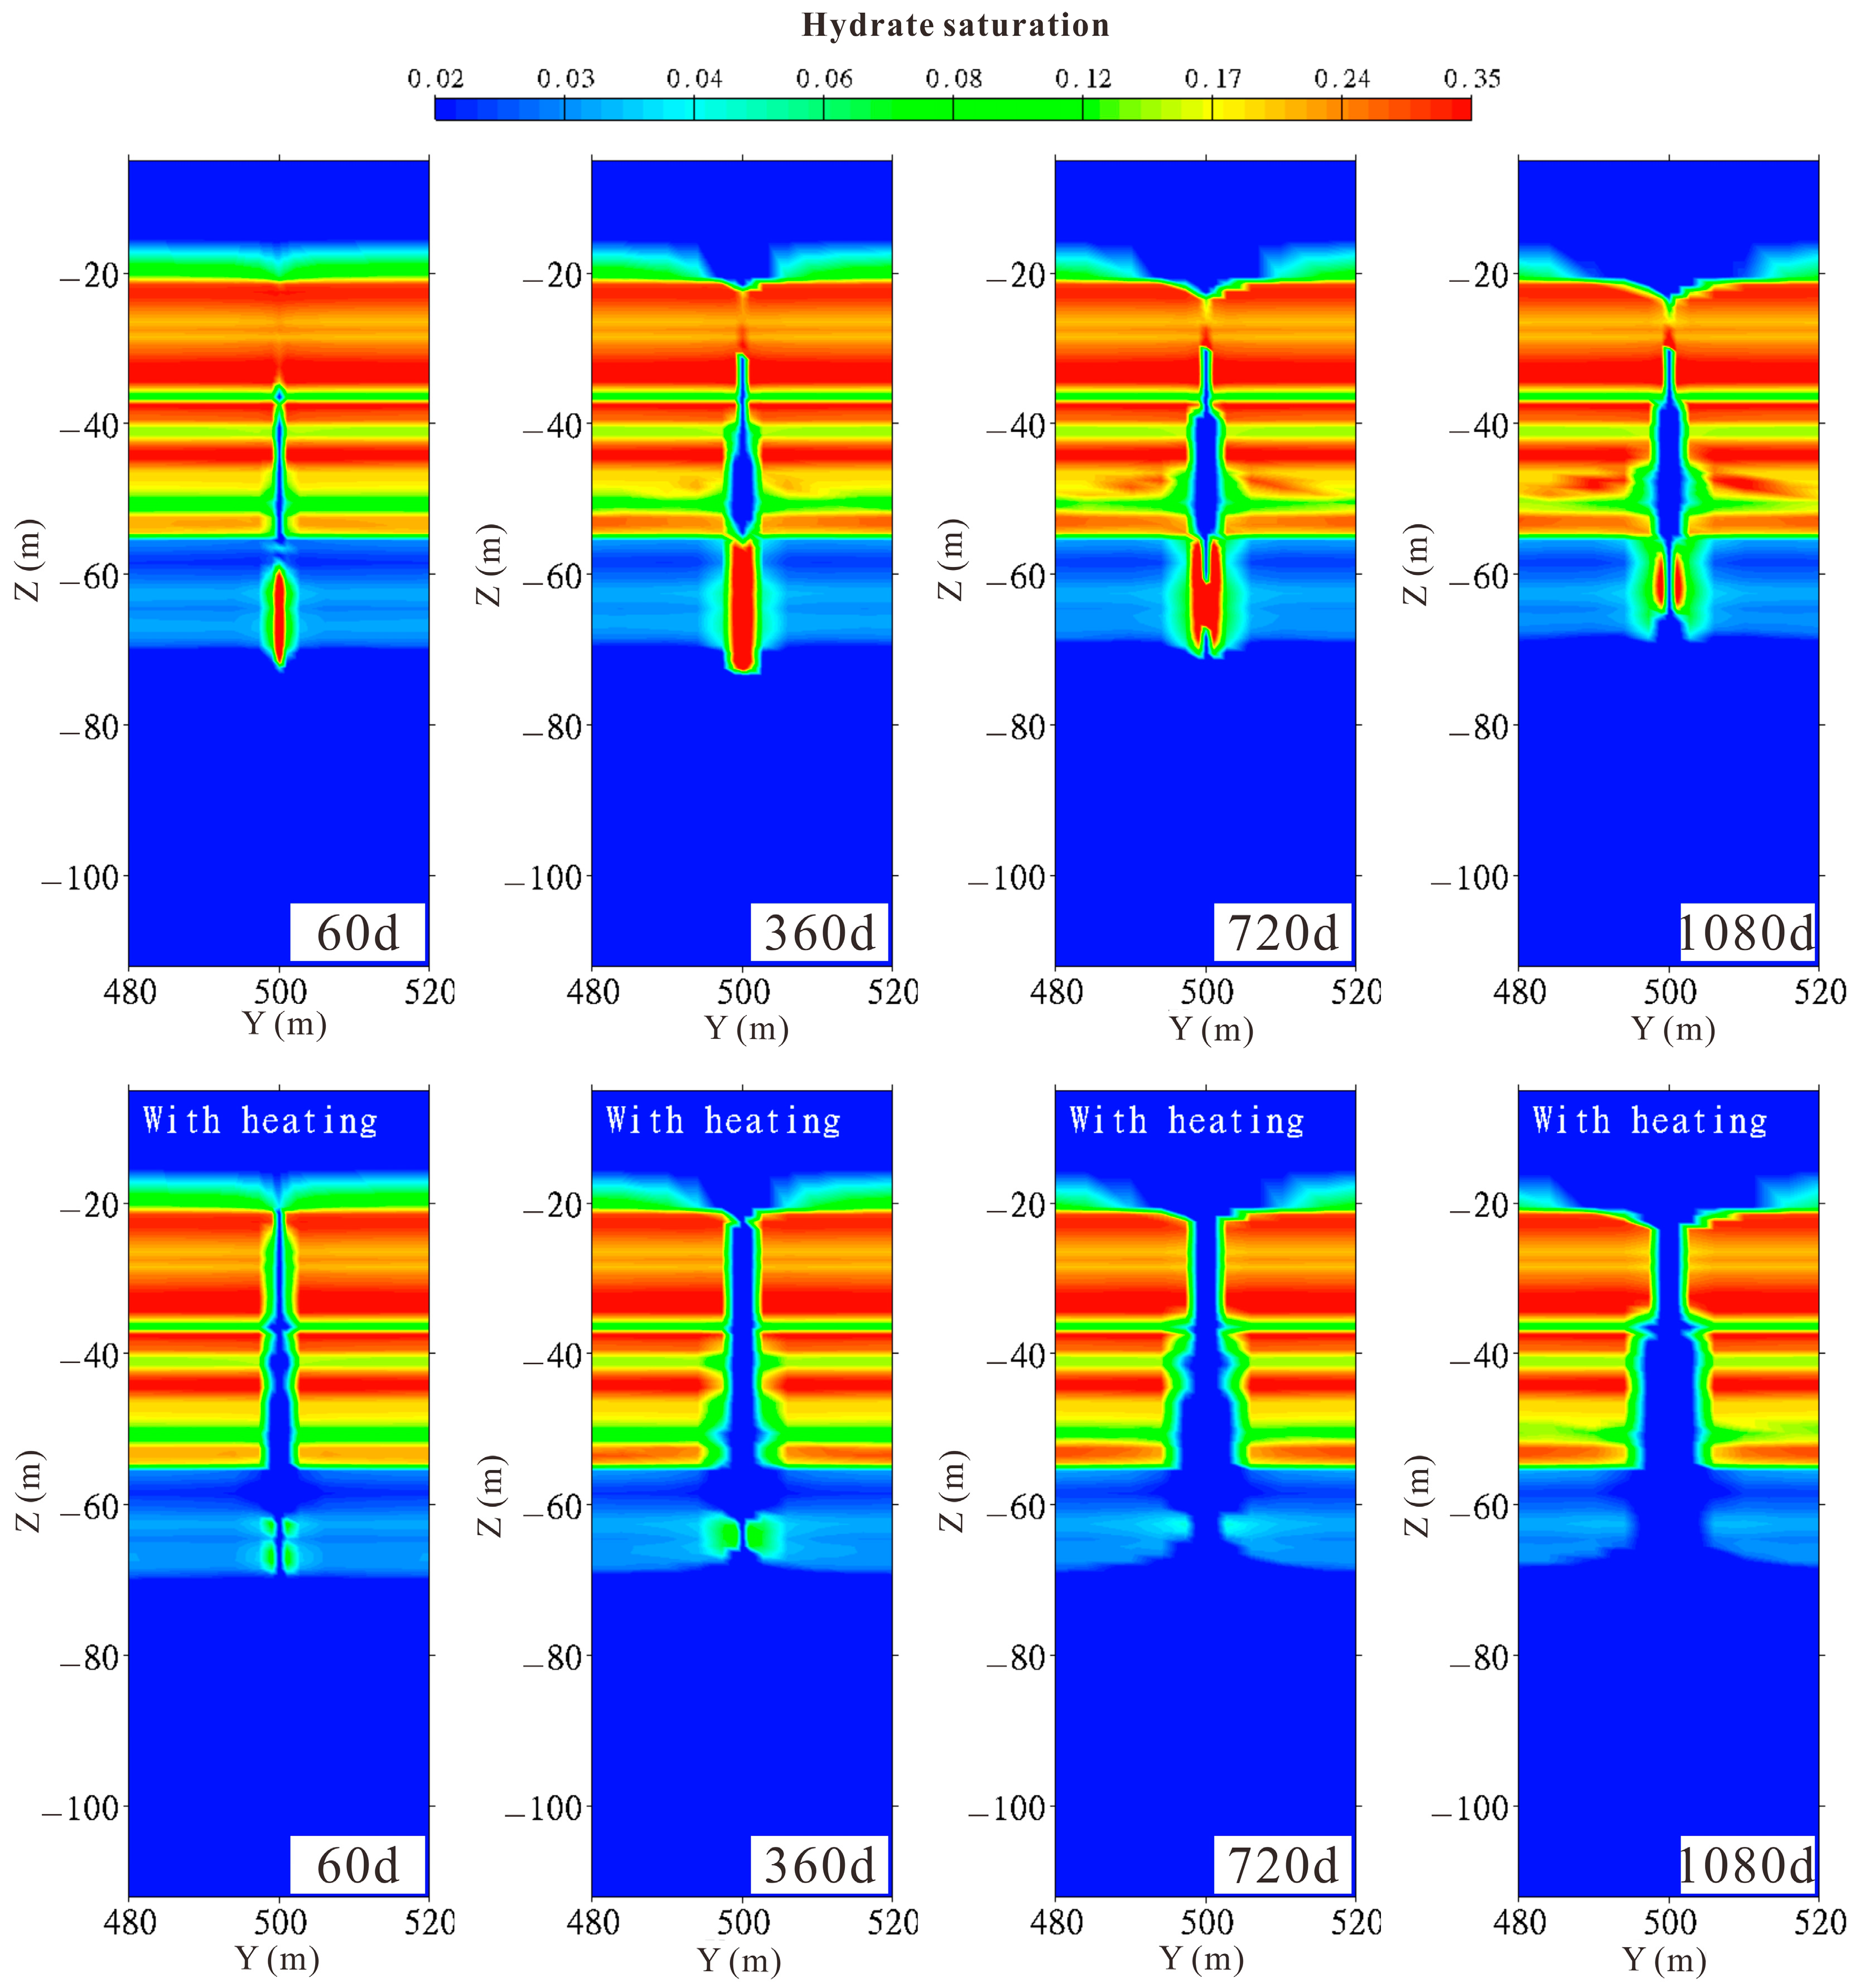
3.2.3. Hydrate and Gas Saturation

Figure 8 depicts the evolution of hydrate saturation (Sh) for both cases without and with heating within 1080 days. According to the hydrate saturation field diagram for the case without heating, high-saturated secondary hydrates were formed in the reservoir near the wellbore in the TPL after 60 days of production and secondary hydrate saturation peaked about 360 days later. The temperature of the reservoir near the wellbore rises as bottom warm water enters the wellbore, causing the high-saturation secondary hydrates in the TPL to dissociate faster, boosting the gas production rate Qg. Only a limited quantity of low-saturated secondary hydrates accumulated in the reservoir around the TPL’s wellbore during the first production stage (60 days) and peaked at roughly 360 days, as seen in the heating case’s hydrate saturation field diagram. However, in the later stage, all secondary hydrates in this region were decomposed. Under a 4 MPa pressure difference, 100 W/m of heating power is insufficient to avoid secondary hydrate formation around the wellbore. Meanwhile, it is noticed that the hydrate dissociation front advances quicker and deeper in the heating condition. After 1080 days of production, the heating case has a wider range of hydrate dissociation in the GHBL, around 2–5 m.
Figure 9 presents the evolution diagram of gas saturation (Sg) for the cases without and with heating within 1080 days. Comparing the gas saturation field diagrams, it can be found that because of heating, the reservoir around the wellbore maintains a smooth flow channel. At the same time, more gas accumulates around the wellbore of the heating case, and most of the high-saturation free gas near the wellbore is extracted around 360 days. In the field diagram of the case without heating, it can be observed that the high-saturation secondary hydrates generated in the reservoir around the TPL block the flow channel here and force the high-saturation free gas near the wellbore located in the TPL to migrate to the upper and lower reservoirs and wellbore, respectively.

4. Discussion

The heating power, heating location, heating time, and heating mode are the primary parameters that can be changed during production. This section discusses the impact of these primary parameters on productivity.

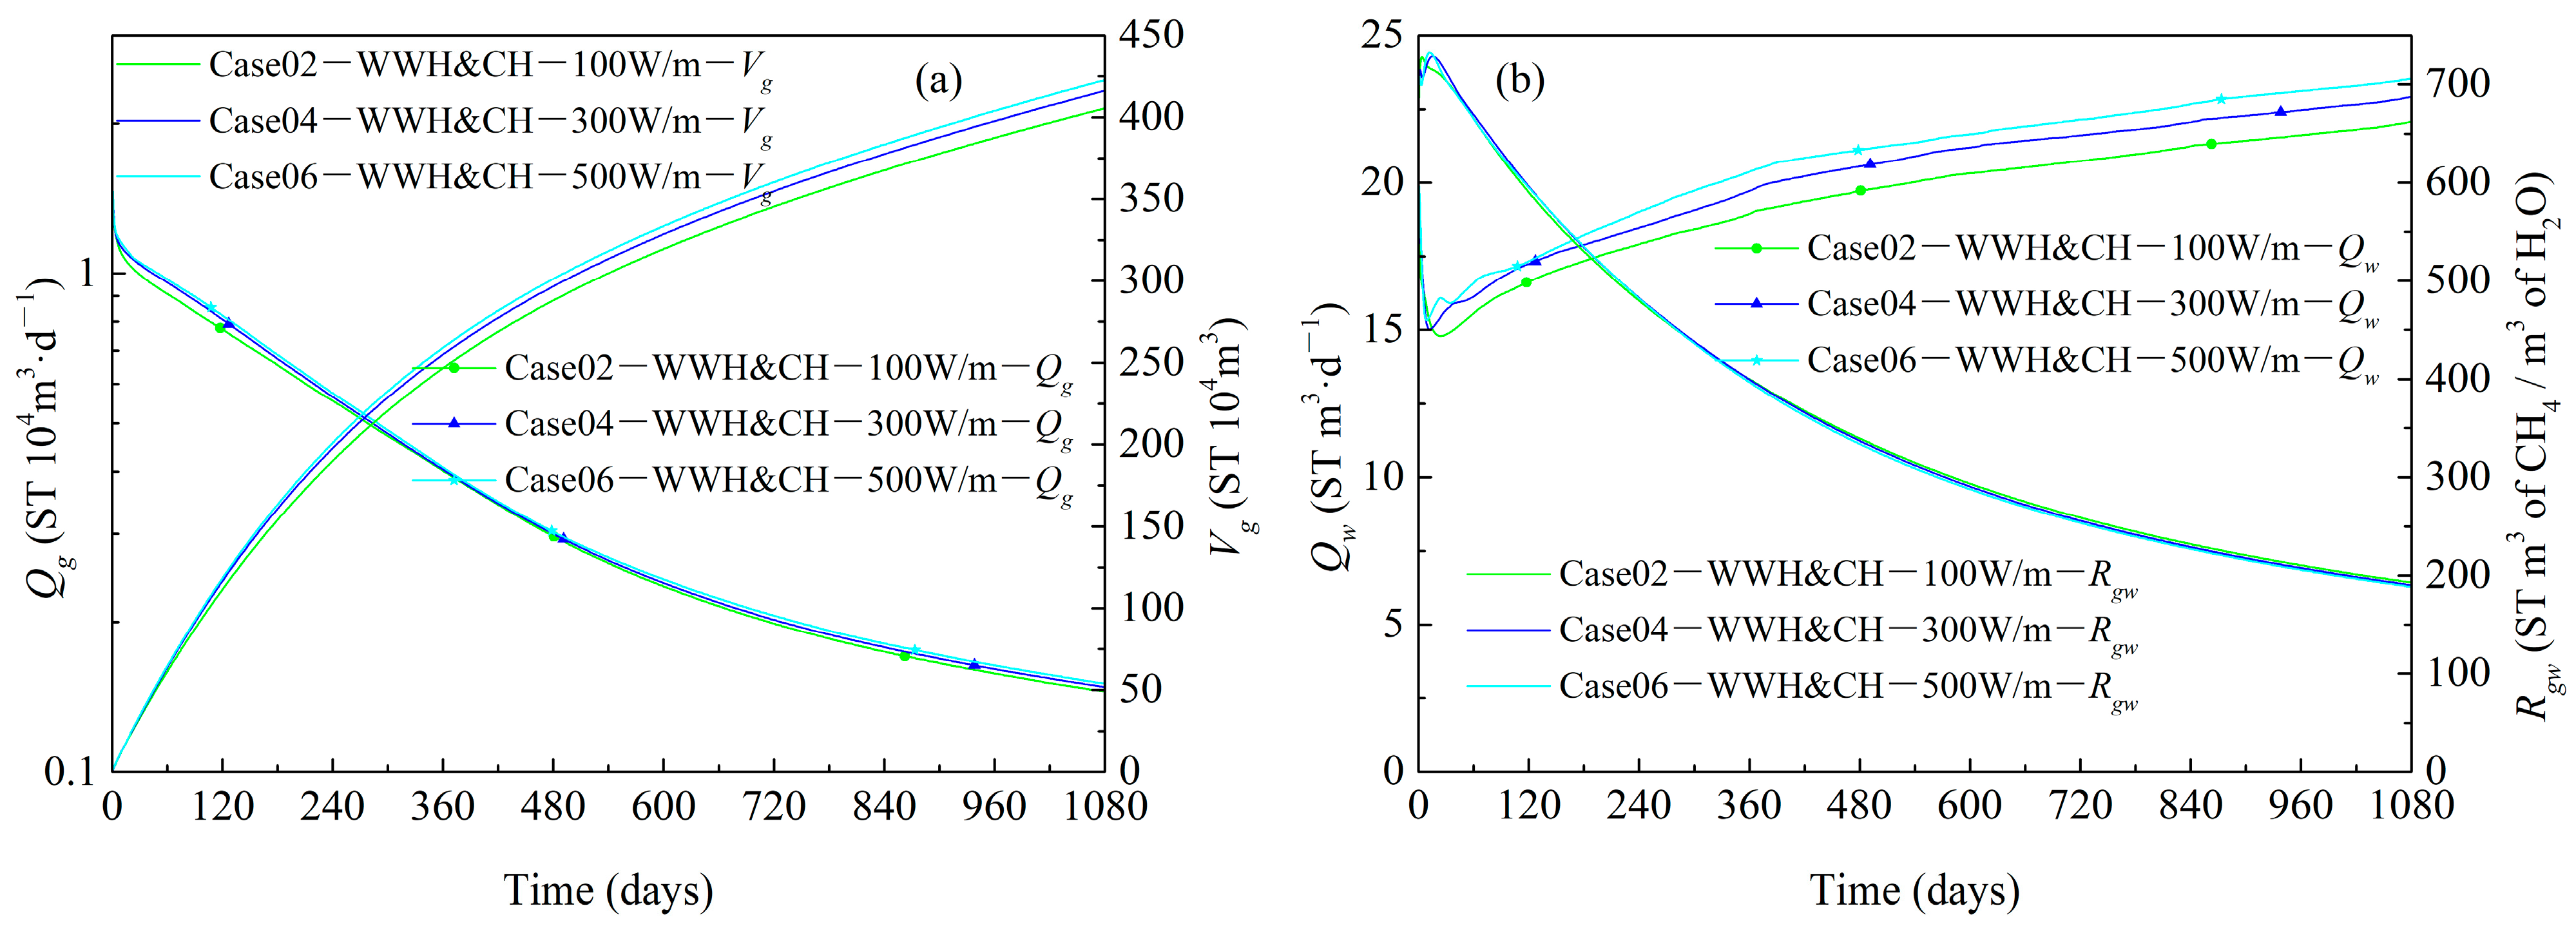
4.1. Effects of Heating Power

Figure 10 depicts the effects of heating power on the Vg and Rgw within 1080 days with WWH&CH. When the heating power is increased from 100 to 200, 300, 400, and 500 W/m, the Vg increases from 4.055 × 10⁶ to 4.120 × 10⁶, 4.161 × 10⁶, 4.197 × 10⁶, and 4.227 × 10⁶ ST m3, increasing by 101.60%, 102.61%, 103.05%, and 104.24%, respectively. The results show that a heating power of 100 W/m is sufficient to prevent the formation of secondary hydrates in the TPL when the production pressure difference is set to 4 MPa. Increasing heating power further does not significantly increase gas output. A heating power of 100 W/m offers an almost identical heating effect as a 500 W/m heating power but with less heating energy consumption. The Rgw in the aforementioned cases stays around 200 after 1080 days of production, showing no discernible change.
To further investigate the relationship between the calorific value of increased production and the additional heat to drive production, we introduced a custom production efficiency index EROIcustom based on previous work [48,49,50,51]. The specific definition is as follows:
EROIcustom = EO/EI
where EO is the energy output, which is the increased gas production times the heating value of natural gas (approximately 35.8 MJ/m3), and EI is the energy input, which is the energy consumed by in situ electric heating [48,49,50,51]. Figure 11 shows the EROIcustom curves with different heating power. All curves show a trend of first increasing and then decreasing and tend to remain constant in the later stage. The peak value of the curve indicates that heating has the most significant effect on increasing production in the initial stages of production. Among them, a heating power of 100 W/m has the best energy output-to-input ratio.

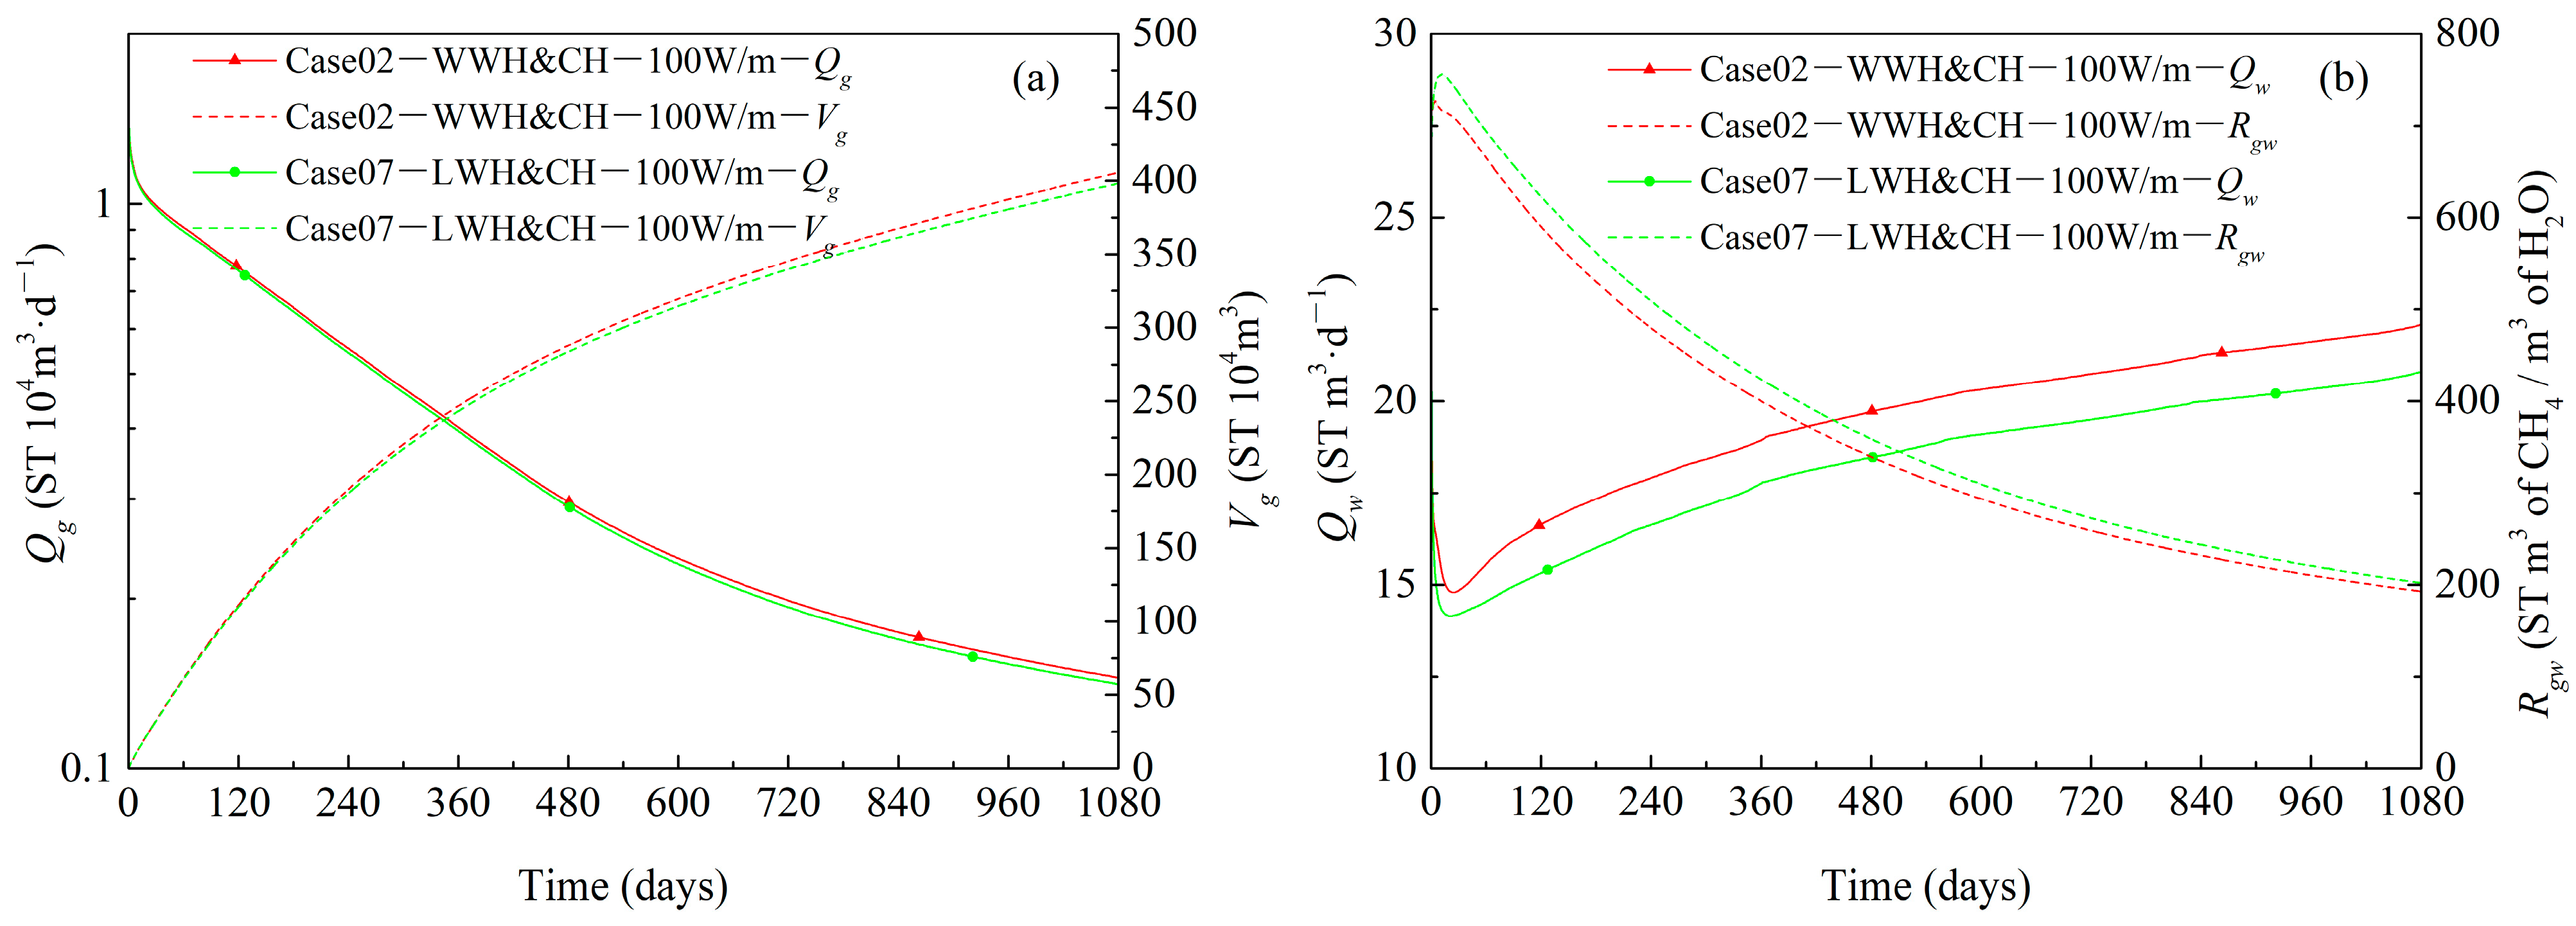
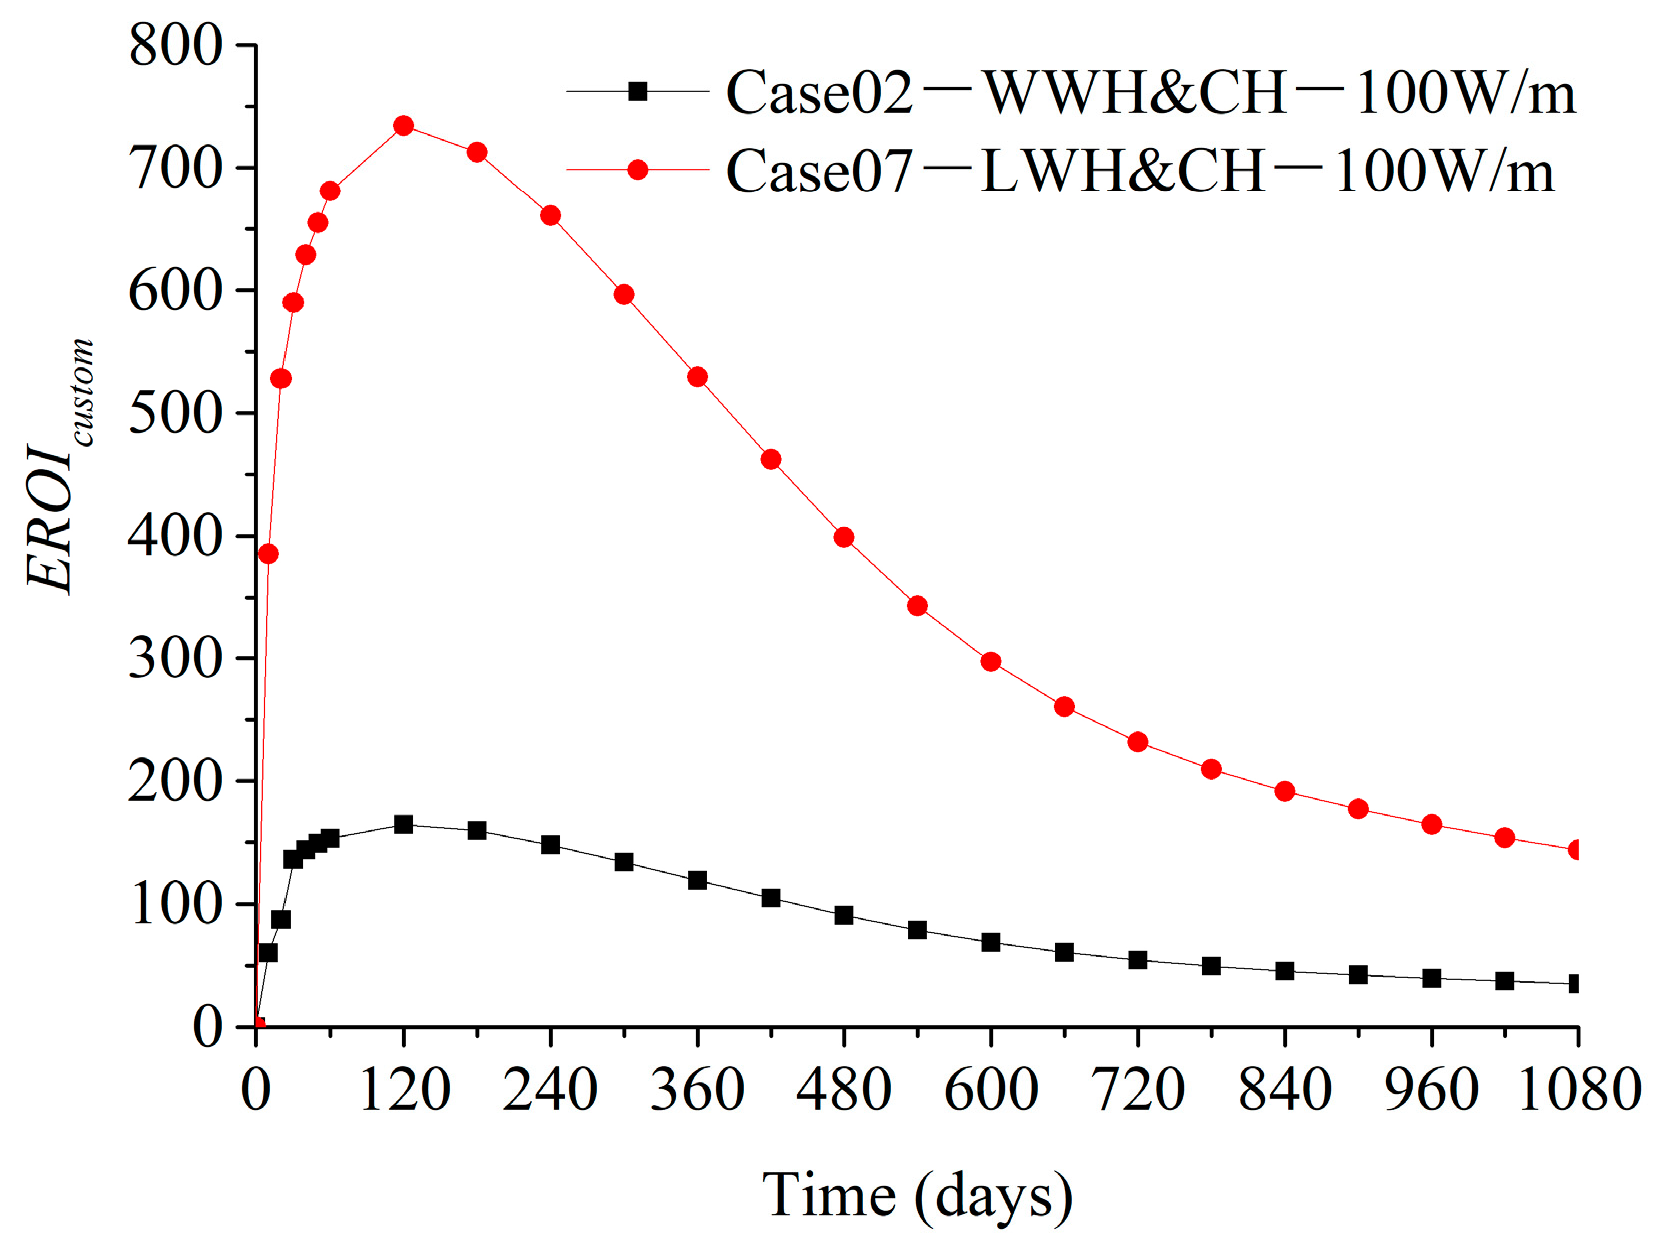
4.2. Effects of Heating Location

Figure 12 depicts the effects of heating location on the Vg and Rgw within 1080 days. When adopting local wellbore heating (LWH) and CH, separately heating the 15 m wellbore located in the TPL, the Vg after 1080 days of production is 3.982 × 10⁶ ST m3. Under the same heating power of 100 W/m, compared with WWH&CH, the Vg just decreases by 1.8%. This also indicates that in the Class-1 type hydrate reservoir, when adopting vertical well depressurization production, the secondary hydrates generated in the reservoir around the TPL are the key factor affecting production capacity. The cumulative heat input of LWH&CH is only 21.42% of that of WWH&CH. After 1080 days of production, the Rgw in the above cases remains around 200, and there is no significant difference.
As shown in Figure 13, the EROIcustom curve of local wellbore heating (LWH) is significantly higher than that of whole wellbore heating (WWH), which indicates that LWH heating has a better energy output-to-input ratio.

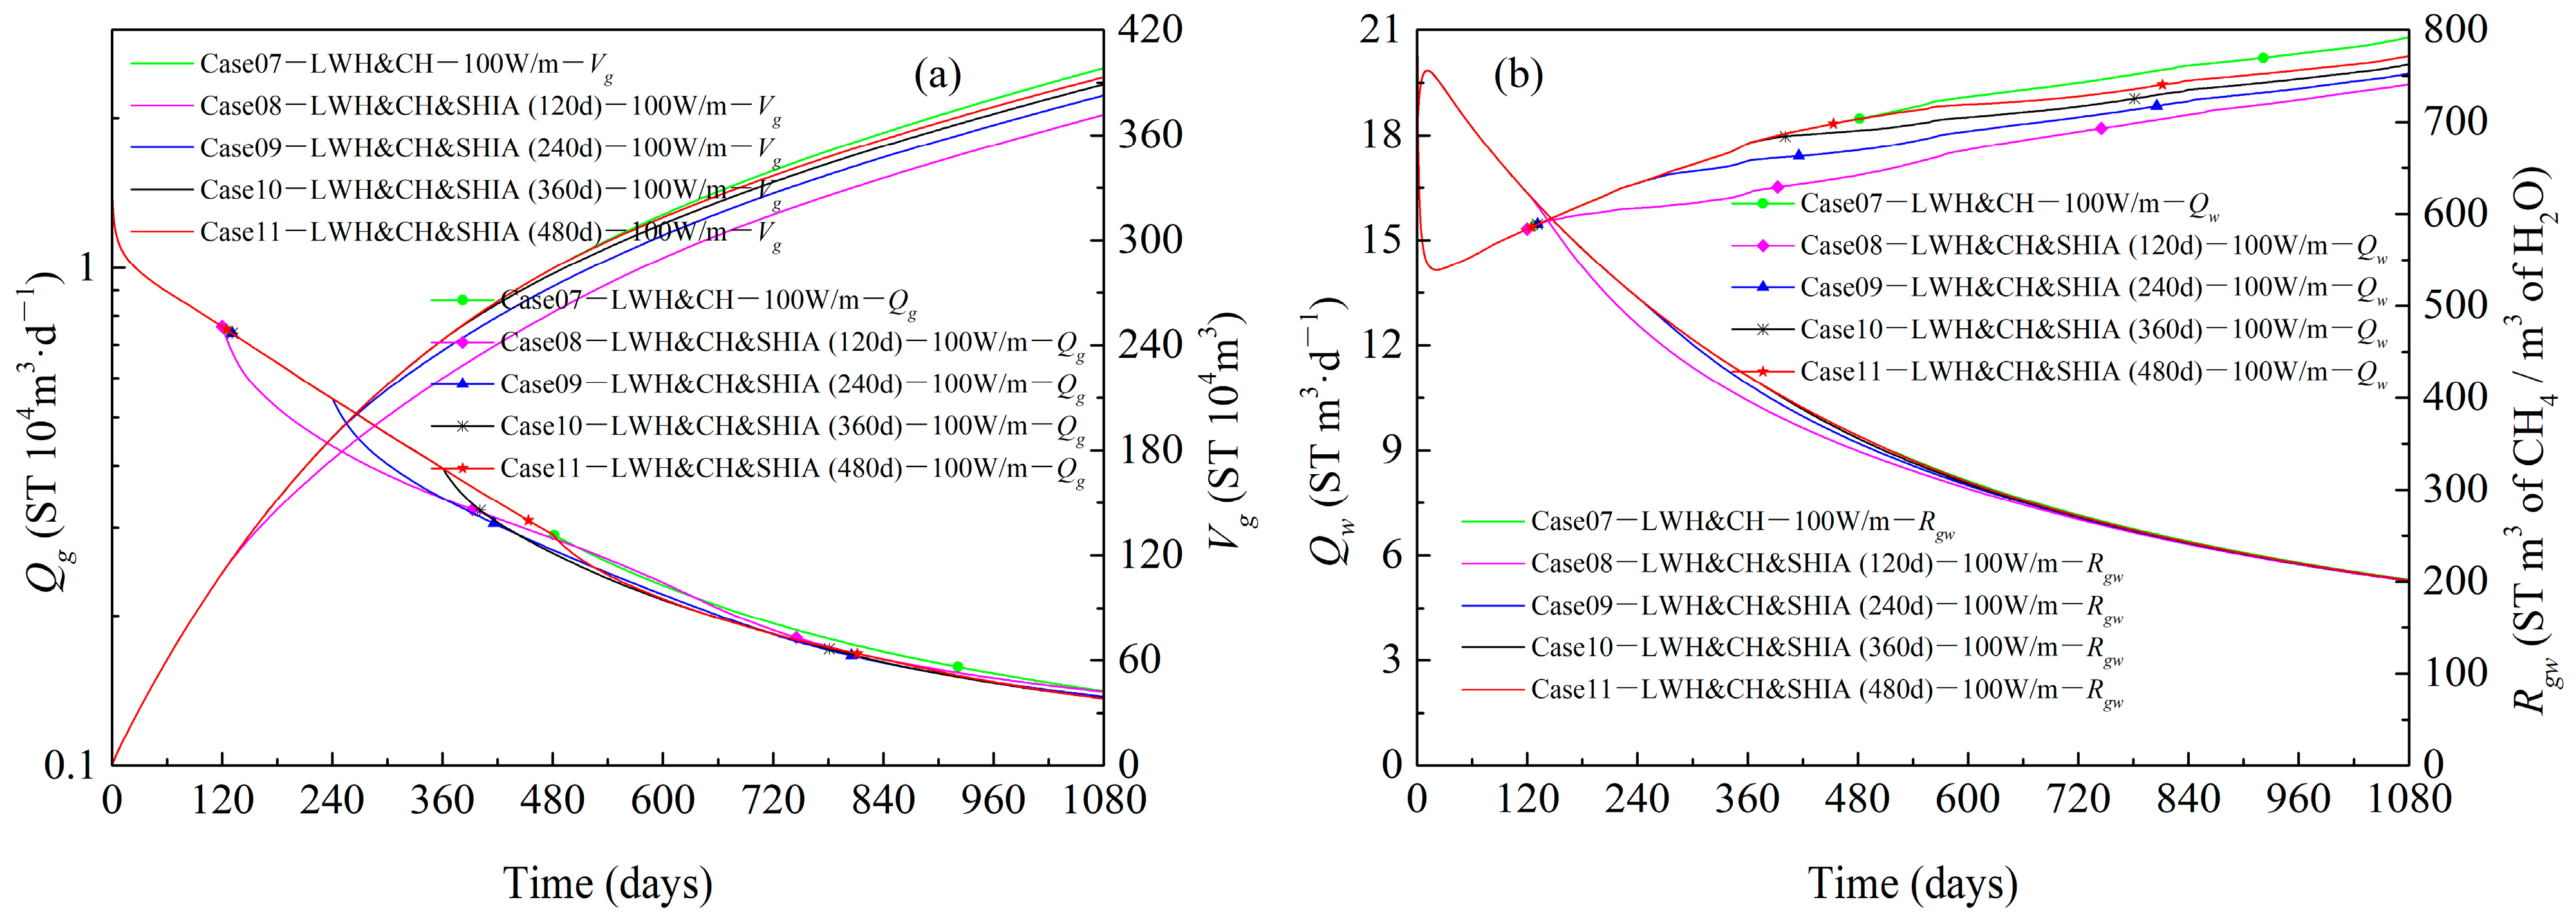
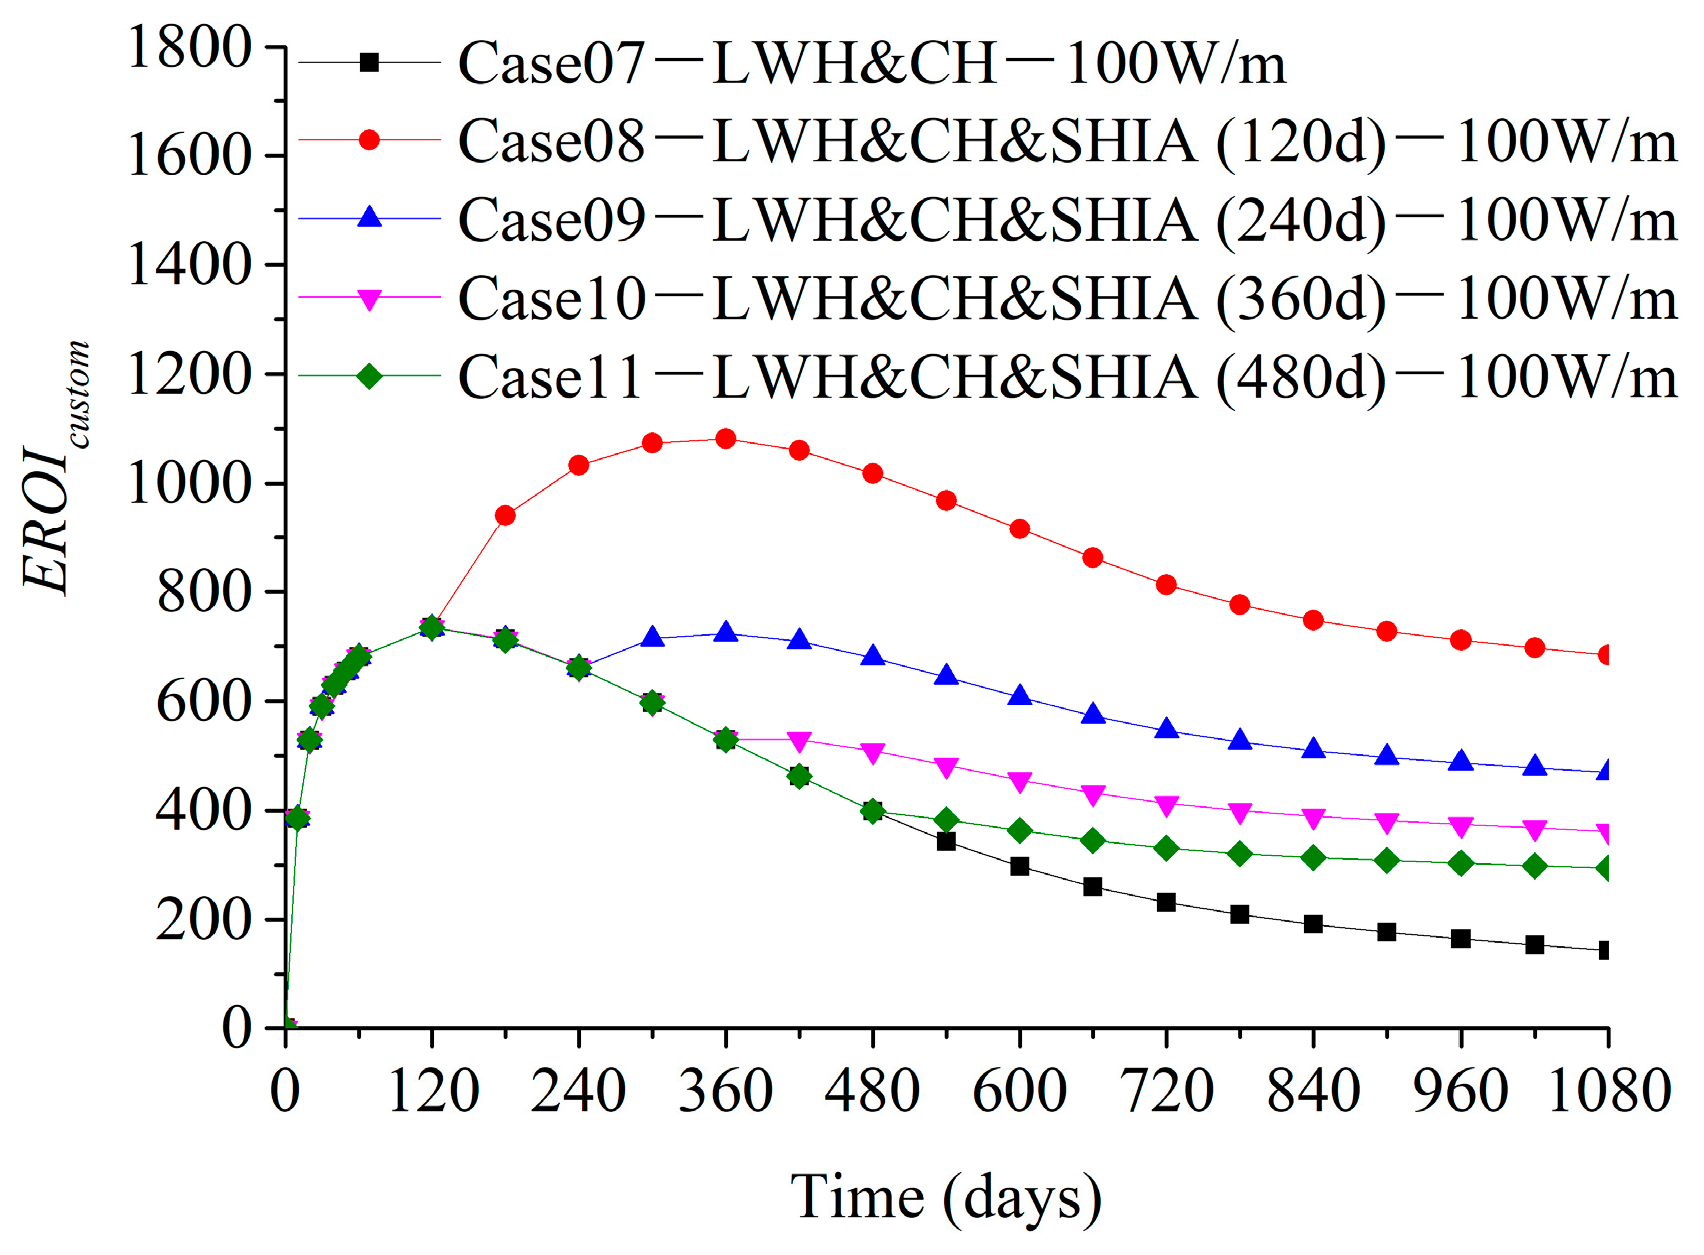
4.3. Effects of Heating Time

Figure 14 depicts the effects of the heating time on the Vg and Rgw within 1080 days with LWH&CH. With stop heating in advance (SHIA) at 120, 240, 360, and 480 days, the Vg decreases from 3.982 × 10⁶ to 3.716 × 10⁶, 3.827 × 10⁶, 3.890 × 10⁶, and 3.931 × 10⁶ ST m3, decreasing by 6.68%, 3.89%, 2.31%, and 1.28%, respectively. The simulation results indicate that when LWH&CH is applied to the wellbore located in the TPL and stops heating in advance at 480 days, the Vg just decreases by 1.28% during the 1080-day production cycle. However, the cumulative heat input of LWH&CH&SHIA (480 d) is only 44.44% of the LWH&CH heating production. Compared with the WWH&CH production, the Vg only decreases by 3.06%, but the cumulative heat input is only 9.52%. After 1080 days of production, the Rgw in the above cases remains around 200, and there is no significant difference.
Figure 15 shows the EROIcustom curves of continuous heating and stop heating in advance. Compared with continuous heating, all EROIcustom curves that stop heating in advance show an increasing trend at the time of stopping heating, followed by a decreasing trend, and tend to stabilize in the later stage. Obviously, stop heating in advance has a better energy output-to-input ratio than continuous heating.

4.4. Effects of Heating Mode

Figure 16 depicts the effects of the heating mode on the Vg and Rgw within 1080 days with LWH&SHIA (480 d). When the heating mode changes from CH to intermittent heating (IH) and the heating interval is 30 days, the Vg decreases from 3.931 × 10⁶ to 3.869 × 10⁶ ST m3. The result is consistent with the findings of Li et al., who experimentally studied the dissociation and gas production behavior of hydrates under two hot brine injection modes. Their results indicate that continuous thermal injection produces more gas than intermittent thermal injection [52]. Compared with the LWH&CH&SHIA (480 d) production, the Vg of LWH&IH&SHIA (480 d) just decreases by 1.58% during the 1080-day production cycle, and the cumulative heat input is only 50.00% of the LWH&CH&SHIA (480 d) production. Compared with the WWH&CH production, the Vg only decreases by 4.59%, but the cumulative heat input is only 4.76% of the WWH&CH production. After 1080 days of production, the Rgw in the above cases remains around 200, and there is no significant difference.
As shown in Figure 17, the EROIcustom curve of intermittent heating mode is higher than that of the continuous heating mode, which indicates that the intermittent heating mode has a better energy output-to-input ratio.

5. Conclusions

Based on the comprehensive analysis of the effects of various heating parameters, including heating power, heating location, heating time, and heating mode, on the vertical well depressurization production performance of the Class 1-type NGH reservoir in the Shenhu Sea area, the following results were obtained:
(1)
In situ electric heating has a good effect on increasing production capacity, and its main mechanism is to promote the dissociation of hydrates and eliminate secondary hydrates. When the vertical wellbore with a completion length of 70 m is deployed in the center of the model and continuously mined for 1080 days under a production pressure difference of 4 MPa, the Vg of the whole wellbore heating case is increased to 118.56% compared with the case without heating.
(2)
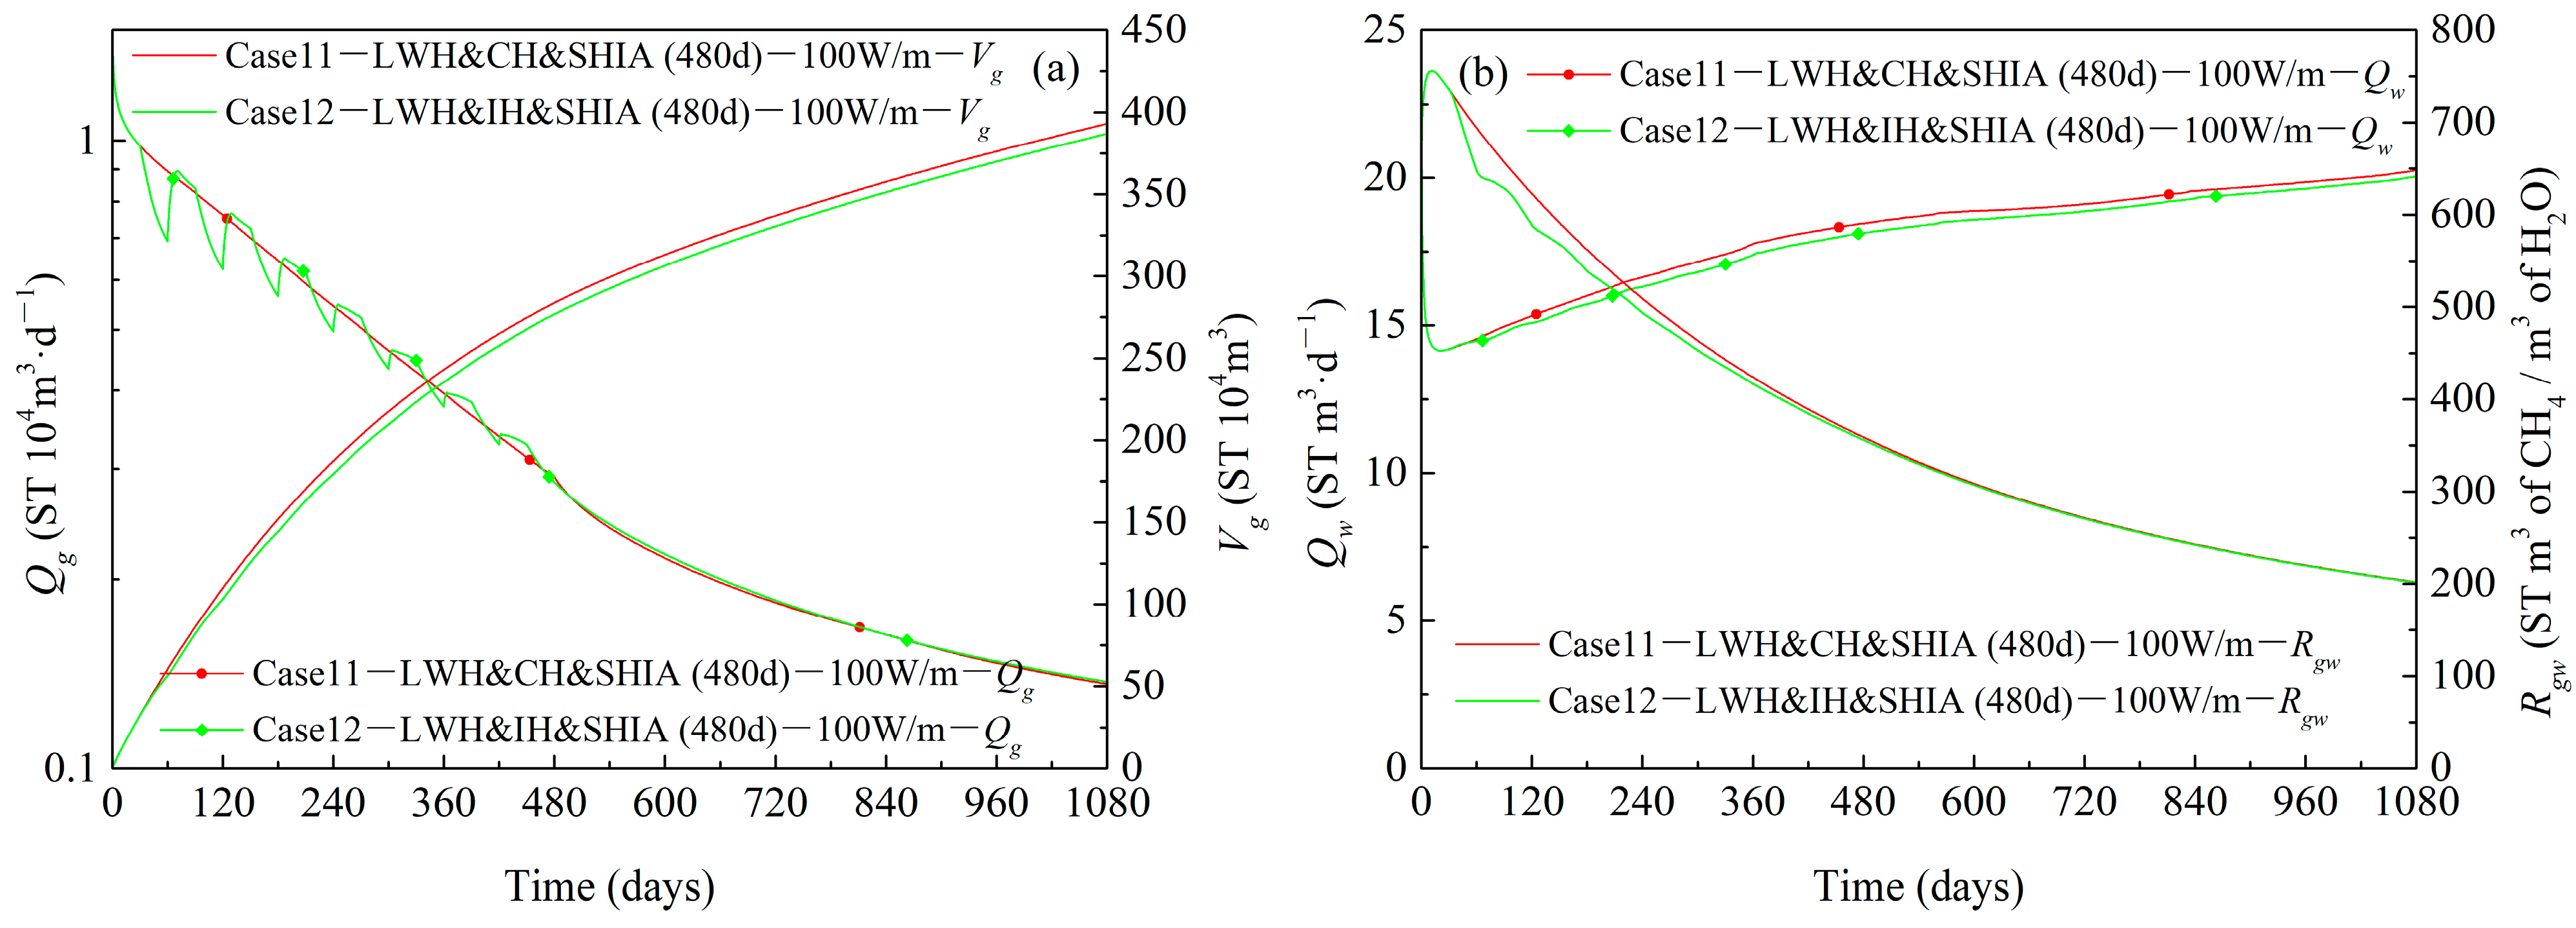
When intermittent heating is applied to the local wellbore (15 m) located in the TPL (with an interval of 30 days) and stop heating in advance at 480 days, there is no significant difference in the Vg after 1080 days of production compared to the whole wellbore heating, and the cumulative heat input is only 4.76% of the whole wellbore heating. We recommend considering intermittent heating of the local wellbore and stopping heating in advance during vertical well depressurization, which can greatly save heating energy consumption while increasing production capacity.
(3)
Intermittent heating of the local wellbore may be an effective strategy to maintain high production capacity while reducing energy consumption during vertical well depressurization. In the future, we will combine methods such as complex structured wells and reservoir reconstruction to further study the effects of intermittent heating of local wellbore on natural gas and water production in different types of hydrate reservoirs.

Author Contributions

T.W.: conceptualization, methodology, software, and writing—original draft. Z.L.: formal analysis and investigation. H.L.: funding acquisition. L.T.: formal analysis and investigation. M.W.: writing—review and editing and supervision. Z.C.: resources. Q.L.: data curation and visualization. J.Q.: data curation and visualization. J.W.: supervision and project administration. All authors have read and agreed to the published version of the manuscript.

Funding

The authors would like to thank the National Key Research and Development Program of China (No. 2021YFB3401405); the National Key Research and Development Program of China (No. SQ2023YFC2800361); the Guangdong Basic and Applied Basic Research Foundation (No. 2022A1515011902); the Guangzhou Science and Technology Program (No. 202206050002); and the Director General’s Scientific Research Fund of Guangzhou Marine Geological Survey, China (No. 2023GMGSJZJJ00027), for providing financial assistance for this research.

Institutional Review Board Statement

Not applicable.

Informed Consent Statement

Not applicable.

Data Availability Statement

The raw data supporting the conclusions of this article will be made available by the authors on request.

Conflicts of Interest

All authors were employed by the Guangzhou Marine Geological Survey. The funder was not involved in the study design, collection, analysis, interpretation of data, the writing of this article or the decision to submit it for publication.

Nomenclature

Symbols
M κ mass accumulation of component κ, (kg/m3)
F κ mass flux of component κ, kg/(m2·s)
q κ sink/source of component κ, kg/(m3·s)
M θ energy accumulation (J/m3)
F θ energy flux, J/(m2·s)
q θ sink/source of heat, J/(m3·s)
V volume (m3)
Γ surface area (m2)
ttime (s)
KΘcomposite thermal conductivity
kdrydry thermal conductivity
kwewet thermal conductivity
φprosity
λIaverage thermal conductivity of ice
Pcap capcapillary pressure (Pa)
P0initial capillary pressure (Pa)
S*saturation for capillary pressure
Sβsaturation of phase β
SmxAmaximum reference aqueous saturation of capillary
SirAirreducible saturation of aqueous phase
krelative permeability of phase β
SirGirreducible saturation of gas phase
nApermeability reduction index for aqueous phase
nGpermeability reduction index for gas phase
λporosity distribution index
FϕScoefficient of permeability reduction
keffective permeability of the sediment
k0inherent permeability of the sediment
φeffective porosity of the sediment
φ0original porosity of the sediment
φccritical porosity
npermeability reduction index
EROIcustomenergy output and input ratio (dimensionless)
EOcalorific value of increased production (MJ)
EIadditional heat to drive production (MJ)
Abbreviations
SCSSouth China Sea
OBoverburden layer
UBunderburden layer
GHBLgas hydrate bearing layer
TPLthree-phase layer
FGLfree gas layer
NGHnatural gas hydrate
WWHwhole wellbore heating
LWHlocal wellbore heating
CHcontinuous heating
SHIAstop heating in advance
IHintermittent heating

References

  1. Sloan, E.D. Fundamental principles and applications of natural gas hydrates. Nature 2003, 426, 353–359. [Google Scholar] [CrossRef]
  2. Boswell, R. Is gas hydrate energy within reach? Science 2009, 325, 957–958. [Google Scholar] [CrossRef]
  3. Chong, Z.; Yang, S.; Babu, P.; Linga, P.; Li, X. Review of natural gas hydrates as an energy resource: Prospects and challenges. Appl. Energy 2016, 162, 1633–1652. [Google Scholar] [CrossRef]
  4. Boswell, R.; Collett, T.S. Current perspectives on gas hydrate resources. Energy Environ. Sci. 2011, 4, 1206–1215. [Google Scholar] [CrossRef]
  5. Sloan, E.D.; Koh, C.A. Clathrate Hydrates of Natural Gases; CRC Press: New York, NY, USA, 2008; pp. 2–3. [Google Scholar]
  6. Yamamoto, K.; Terao, Y.; Fujii, T.; Ikawa, T.; Seki, M.; Matsuzawa, M.; Kanno, T. Operational Overview of the First Offshore Production Test of Methane Hydrates in the Eastern Nankai Trough. In Proceedings of the Offshore Technology Conference, Houston, TX, USA, 5–8 May 2014. [Google Scholar]
  7. Yamamoto, K.; Wang, X.X.; Tamaki, M.; Suzuki, K. The second offshore production of methane hydrate in the Nankai Trough and gas production behavior from a heterogeneous methane hydrate reservoir. RSC Adv. 2019, 9, 25987–26013. [Google Scholar] [CrossRef] [PubMed]
  8. Li, J.; Ye, J.; Qin, X.; Qiu, H.; Wu, N.; Lu, H.; Xie, W.; Lu, J.; Peng, F.; Xu, Z.; et al. The first offshore natural gas hydrate production test in South China Sea. China Geol. 2018, 1, 5–16. [Google Scholar] [CrossRef]
  9. Ye, J.; Qin, X.; Xie, W.; Lu, H.; Ma, B.; Qiu, H.; Liang, J.; Lu, J.; Kuang, Z.; Lu, C.; et al. The second natural gas hydrate production test in the South China Sea. China Geol. 2020, 3, 197–209. [Google Scholar] [CrossRef]
  10. Okwananke, A.; Hassanpouryouzband, A.; Farahani, M.; Yang, J.; Tohidi, B.; Chuvilin, E.; Istomin, V.; Bukhanov, B. Methane recovery from gas hydrate-bearing sediments: An experimental study on the gas permeation characteristics under varying pressure. J. Pet. Sci. Eng. 2019, 180, 435–444. [Google Scholar] [CrossRef]
  11. Zhang, L.; Sun, L.; Sun, M.; Lv, X.; Dong, H.; Miao, Y.; Yang, L.; Song, Y.; Zhao, J. Analyzing spatially and temporally visualized formation behavior of methane hydrate in unconsolidated porous media. Magn. Reson. Imaging 2019, 61, 224–230. [Google Scholar] [CrossRef] [PubMed]
  12. Farahani, M.; Guo, X.; Zhang, L.; Yang, M.; Hassanpouryouzband, A.; Zhao, J.; Yang, J.; Song, Y.; Tohidi, B. Effect of thermal formation/dissociation cycles on the kinetics of formation and pore-scale distribution of methane hydrates in porous media: A magnetic resonance imaging study. Sustain. Energy Fuels 2021, 5, 1567–1583. [Google Scholar] [CrossRef]
  13. Wu, N.; Li, Y.; Wan, Y.; Sun, J.; Huang, L.; Mao, P. Prospect of marine natural gas hydrate stimulation theory and technology system. Nat. Gas Ind. B 2021, 40, 173–187. [Google Scholar] [CrossRef]
  14. Zheng, R.; Li, S.; Li, X. Sensitivity analysis of hydrate dissociation front conditioned to depressurization and wellbore heating. Mar. Pet. Geol. 2018, 91, 631–638. [Google Scholar] [CrossRef]
  15. Zhao, E.; Hou, J.; Ji, Y.; Liu, Y.; Bai, Y. Enhancing gas production from Class II hydrate deposits through depressurization combined with low-frequency electric heating under dual horizontal wells. Energy 2021, 233, 121137. [Google Scholar] [CrossRef]
  16. Xu, T.; Zhang, Z.; Li, S.; Li, X.; Lu, C. Numerical evaluation of Gas hydrate production performance of the depressurization and backfilling with an in situ supplemental heat Method. ACS Omega 2021, 6, 12274–12286. [Google Scholar] [CrossRef] [PubMed]
  17. Li, B.; Ye, Y.; Zhang, T.; Wan, Q. Numerical Investigation into the Gas Production from Hydrate Deposit under Various Thermal Stimulation Modes in a Multi-Well System in Qilian Mountain. Entropy 2021, 23, 800. [Google Scholar] [CrossRef] [PubMed]
  18. Zhao, E.; Hou, J.; Du, Q.; Liu, Y.; Ji, Y.; Bai, Y. Numerical modeling of gas production from methane hydrate deposits using low-frequency electrical heating assisted depressurization method. Fuel 2021, 290, 120075. [Google Scholar] [CrossRef]
  19. Liu, S.; Li, H.; Wang, B.; Sun, B. Accelerating gas production of the depressurization-induced natural gas hydrate by electrical heating. J. Pet. Sci. Eng. 2022, 208, 109735. [Google Scholar] [CrossRef]
  20. Zhao, E.; Hou, J.; Ji, Y.; Liu, Y.; Bai, Y. Energy recovery behavior of low-frequency electric heating assisted depressurization in Class 1 hydrate deposits. Fuel 2022, 309, 122185. [Google Scholar] [CrossRef]
  21. Wang, B.; Liu, S.; Wang, P. Microwave-assisted high-efficient gas production of depressurization-induced methane hydrate exploitation. Energy 2022, 247, 123353. [Google Scholar] [CrossRef]
  22. Zhang, Q.; Wang, Y. Numerical Simulations of Combined Brine Flooding with Electrical Heating–Assisted Depressurization for Exploitation of Natural Gas Hydrate in the Shenhu Area of the South China Sea. Front. Earth Sci. 2022, 10, 843521. [Google Scholar] [CrossRef]
  23. Zhang, Q.; Wang, Y. Comparisons of different electrical heating assisted depressurization methods for developing the unconfined hydrate deposits in Shenhu area. Energy 2023, 269, 126828. [Google Scholar] [CrossRef]
  24. Moridis, G.; Kowalsky, M.; Pruess, K. TOUGH+ Hydrate V1.0 User’s Manual; Report LBNL-0149E; Lawrence Berkeley National Laboratory: Berkeley, CA, USA, 2008. [Google Scholar]
  25. Uddin, M.; Wright, F.; Coombe, D. Numerical study of gas evolution and transport behaviours in natural gas-hydrate reservoirs. J. Can. Pet. Technol. 2011, 50, 70–89. [Google Scholar] [CrossRef]
  26. Masuda, Y.; Yamamoto, K.; Tadaaki, S.; Ebinuma, T.; Nagakubo, S. Japan’s methane hydrate R&D program progresses to phase 2. Nat. Gas Oil 2018, 304, 285–4541. [Google Scholar]
  27. White, M.; Wurstner, S.; McGrail, B. Numerical studies of methane production from Class 1 gas hydrate accumulations enhanced with carbon dioxide injection. Mar. Pet. Geol. 2011, 28, 546–560. [Google Scholar] [CrossRef]
  28. Zhang, W.; Liang, J.; Lu, J.; Wei, J.; Su, P.; Fang, Y.; Guo, Y.; Yang, S.; Zang, G. Accumulation features and mechanisms of high saturation natural gas hydrate in shenhu area, northern south china sea. Pet. Explor. Dev. 2017, 44, 708–719. [Google Scholar] [CrossRef]
  29. Su, P.; He, J.; Liang, J.; Zhang, W. Natural gas hydrate migration and accumulation system and its controlling factors on northern deep water slope of the South China Sea. Mar. Geol. Front. 2017, 33, 1–10. [Google Scholar]
  30. Hao, Y.; Yang, F.; Wang, J.; Fan, M.; Li, S.; Yang, S.; Wang, C.; Xiao, X. Dynamic analysis of exploitation of different types of multilateral wells of a hydrate reservoir in the South China sea. Energy Fuels 2022, 36, 6083–6095. [Google Scholar] [CrossRef]
  31. Su, Z.; Moridis, G.J.; Zhang, K.; Wu, N. A huff-and-puff production of gas hydrate deposits in Shenhu area of South China Sea through a vertical well. J. Pet. Sci. Eng. 2012, 86–87, 54–61. [Google Scholar] [CrossRef]
  32. Yin, Z.; Moridis, G.; Chong, Z.R.; Linga, P. Effectiveness of multi-stage cooling processes in improving the CH4-hydrate saturation uniformity in sandy laboratory samples. Appl. Energy 2019, 250, 729–747. [Google Scholar] [CrossRef]
  33. Zhang, K.; Moridis, G.; Wu, Y.; Pruess, K. A domain decomposition approach for large-scale simulations of flow processes in hydrate-bearing geologic media. In Proceedings of the 6th International Conference on Gas Hydrates (ICGH 2008), Vancouver, BC, Canada, 6–10 July 2008. [Google Scholar]
  34. Kowalsky, M.; Moridis, G. Comparison of kinetic and equilibrium reaction models in simulating gas hydrate behavior in porous media. Energy Convers. Manag. 2007, 48, 1850–1863. [Google Scholar] [CrossRef]
  35. Yuan, Y.; Xu, T.; Xin, X.; Gong, Y.; Li, B. Enhanced gas production from clayey-silt hydrate reservoirs based on near-well reservoir reconstruction using the high-pressure jet grouting technology. J. Nat. Gas Sci. Eng. 2021, 94, 104121. [Google Scholar] [CrossRef]
  36. Yuan, Y.; Xu, T.; Jin, C.; Zhu, H.; Gong, Y.; Wang, F. Multiphase flow and mechanical behaviors induced by gas production from clayey-silt hydrate reservoirs using horizontal well. J. Clean. Prod. 2021, 328, 129578. [Google Scholar] [CrossRef]
  37. Zhang, J.; Yin, Z.; Li, Q.; Li, S.; Wang, Y.; Li, X. Comparison of fluid production between excess-gas and excess-water hydrate-bearing sediments under depressurization and its implication on energy recovery. Energy 2023, 282, 128315. [Google Scholar] [CrossRef]
  38. Yu, T.; Guan, G.; Wang, D.; Song, Y.; Abudula, A. Numerical investigation on the long-term gas production behavior at the 2017 Shenhu methane hydrate production site. Appl. Energy 2021, 285, 116466. [Google Scholar] [CrossRef]
  39. Sun, J.; Zhang, L.; Ning, F.; Lei, H.; Liu, T.; Hu, G.; Lu, H.; Lu, J.; Liu, C.; Jiang, G.; et al. Production potential and stability of hydrate-bearing sediments at the site GMGS3-W19 in the South China Sea: A preliminary feasibility study. Mar. Pet. Geol. 2017, 86, 447–473. [Google Scholar] [CrossRef]
  40. Yuan, Y.; Xu, T.; Xin, X.; Xia, Y. Multiphase Flow Behavior of Layered Methane Hydrate Reservoir Induced by Gas Production. Geofluids 2017, 2017, 7851031. [Google Scholar] [CrossRef]
  41. Moridis, G.; Kowalsky, M.; Pruess, K. Depressurization-induced gas production from class 1 hydrate deposits. SPE Reserv. Eval. Eng. 2007, 10, 458–481. [Google Scholar] [CrossRef]
  42. Feng, Y.; Chen, L.; Suzuki, A.; Kogawa, T.; Okajima, J.; Komiya, A.; Maruyama, S. Enhancement of gas production from methane hydrate reservoirs by the combination of hydraulic fracturing and depressurization method. Energy Convers. Manag. 2019, 184, 194–204. [Google Scholar] [CrossRef]
  43. Moridis, G.J.; Reagan, M.T.; Kim, S.J.; Seol, Y.; Zhang, K. Evaluation of the Gas Production Potential of Marine Hydrate De-posits in the Ulleung Basin of the Korean East Sea. SPE J. 2007, 14, 759–781. [Google Scholar] [CrossRef]
  44. Sun, Y.; Ma, X.; Guo, W.; Jia, R.; Li, B. Numerical simulation of the short- and long-term production behavior of the first offshore gas hydrate production test in the South China Sea. J. Pet. Sci. Eng. 2019, 181, 106196. [Google Scholar] [CrossRef]
  45. Ma, X.; Sun, Y.; Liu, B.; Guo, W.; Jia, R.; Li, B.; Li, S. Numerical study of depressurization and hot water injection for gas hydrate production in China’s first offshore test site. J. Nat. Gas Sci. Eng. 2020, 83, 103530. [Google Scholar] [CrossRef]
  46. Cao, X.; Sun, J.; Qin, F.; Ning, F.; Mao, P.; Gu, Y.; Li, Y.; Zhang, H.; Yu, Y.; Wu, N. Numerical analysis on gas production performance by using a multilateral well system at the first offshore hydrate production test site in the Shenhu area. Energy 2023, 270, 126690. [Google Scholar] [CrossRef]
  47. Qin, X.; Liang, Q.; Yang, L.; Qiu, H.; Xie, W.; Liang, J.; Lu, J.; Lu, C.; Lu, H.; Ma, B.; et al. The response of temperature and pressure of hydrate reservoirs in the first gas hydrate production test in South China Sea. Appl. Energy 2020, 278, 115649. [Google Scholar] [CrossRef]
  48. Murphy, D.; Hall, C.; Dale, M.; Cleveland, C. Order from chaos: A preliminary protocol for determining the EROI of fuels. Sustainability 2011, 3, 1888–1907. [Google Scholar] [CrossRef]
  49. Hu, Y.; Hall, C.; Wang, J.; Feng, L.; Poisson, A. Energy Return on Investment (EROI) of China’s conventional fossil fuels: Historical and future trends. Energy 2013, 54, 352–364. [Google Scholar] [CrossRef]
  50. Kong, Z.; Jiang, Q.; Dong, X.; Wang, J.; Wan, X. Estimation of China’s production efficiency of natural gas hydrates in the South China Sea. J. Clean. Prod. 2018, 203, 1–12. [Google Scholar] [CrossRef]
  51. Jin, G.; Peng, Y.; Liu, L.; Su, Z.; Liu, J.; Li, T.; Wu, D. Enhancement of gas production from low-permeability hydrate by radially branched horizontal well: Shenhu Area, South China Sea. Energy 2022, 253, 124129. [Google Scholar] [CrossRef]
  52. Li, S.; Zheng, R.; Xu, X.; Chen, Y. Dissociation of methane hydrate by hot brine. Pet. Sci. Technol. 2015, 33, 671–677. [Google Scholar] [CrossRef]
Figure 1. SHSC4 well location diagram [30]. (Adapted from the Ref. [30]. Copyright 2022 American Chemical Society).
Applsci 14 06203 g001
Figure 2. Model schematic diagram. (a) Geological model and logging curve of the SHSC-4 well. (b) Model mesh.
Applsci 14 06203 g002
Figure 3. Model’s initial pressure, temperature, hydrate saturation, and gas saturation.
Applsci 14 06203 g003
Figure 4. On-site gas production fitting.
Applsci 14 06203 g004
Figure 5. Gas and water production curve with and without heating within 1080 days. (a) Gas production rate and cumulative gas production. (b) Water production rate and gas-to-water ratio.
Applsci 14 06203 g005
Figure 6. Evolution diagram of pore pressure without and with heating within 1080 days.
Applsci 14 06203 g006
Figure 7. Evolution diagram of reservoir temperature without and with heating within 1080 days.
Applsci 14 06203 g007
Figure 8. Evolution diagram of hydrate saturation without and with heating within 1080 days.
Applsci 14 06203 g008
Figure 9. Evolution diagram of gas saturation without and with heating within 1080 days.
Applsci 14 06203 g009
Figure 10. Gas and water production curve with different heating powers within 1080 days. (a) Gas production rate and cumulative gas production. (b) Water production rate and gas-to-water ratio.
Applsci 14 06203 g010
Figure 11. EROIcustom curve with different heating powers within 1080 days.
Applsci 14 06203 g011
Figure 12. Gas and water production curve with different heating locations within 1080 days. (a) Gas production rate and cumulative gas production. (b) Water production rate and gas-to-water ratio.
Applsci 14 06203 g012
Figure 13. EROIcustom curve with different heating locations within 1080 days.
Applsci 14 06203 g013
Figure 14. Gas and water production curve with different heating times within 1080 days. (a) Gas production rate and cumulative gas production. (b) Water production rate and gas-to-water ratio.
Applsci 14 06203 g014
Figure 15. EROIcustom curve with different heating times within 1080 days.
Applsci 14 06203 g015
Figure 16. Gas and water production curve with different heating modes within 1080 days. (a) Gas production rate and cumulative gas production. (b) Water production rate and gas-to-water ratio.
Applsci 14 06203 g016
Figure 17. EROIcustom curve with different heating modes within 1080 days.
Applsci 14 06203 g017
Table 1. Detail setting of simulation cases.
IDHeating LocationHeating PowerHeating ModeTime to SHIA
Case 01----
Case 02WWH100 W/mCH-
Case 03WWH200 W/mCH-
Case 04WWH300 W/mCH-
Case 05WWH400 W/mCH-
Case 06WWH500 W/mCH-
Case 07LWH 100 W/mCH-
Case 08LWH 100 W/mCH and SHIA120 d
Case 09LWH 100 W/mCH and SHIA240 d
Case 10LWH 100 W/mCH and SHIA360 d
Case 11LWH 100 W/mCH and SHIA480 d
Case 12LWH 100 W/mIH and SHIA480 d
Note: WWH is whole wellbore heating; LWH is local wellbore heating; CH is continuous heating; SHIA is stop heating in advance; IH is intermittent heating.
Table 2. Model parameters.
ParameterValue and Unit
OB and UB thickness [35,36]20 m
GHBL thickness [8,44,45,46]35 m
TPL thickness [8,44,45,46]15 m
FGL thickness [8,44,45,46]27 m
OB and UB initial permeability2.0 mD
GHBL initial permeability [8,44,45,46]2.9 mD
TPL initial permeability [8,44,45,46]1.5 mD
FGL initial permeability [8,44,45,46]7.4 mD
Wellbore radius [44,45,46]0.1 m
Salinity [44,45,46]3.5%
GHBL and TPL initial hydrate saturation [8,44,45,46]Extracted from logging curve (Figure 2a)
FGL initial free gas saturation [8,44,45,46]Extracted from logging curve (Figure 2a)
OB and UB porosity0.30
GHBL porosity [8,44,45,46]0.35
TPL porosity [[8,44,45,46]0.33
FGL porosity [8,44,45,46]0.32
Grain density [44,45,46]2600 kg/m3
Geothermal gradient [44,45,46]43.653 °C/km
Grain specific heat [44,45,46]1000 J·kg−1·K−1
Gas composition [44,45,46]100% CH4
Dry thermal conductivity [24,44,45,46]1.0 W·m−1·K−1
Wet thermal conductivity [24,44,45,46]3.1 W·m−1·K−1
Composite thermal conductivity [24,44,45,46]KΘ = kdry + (SA1/2 + SH1/2)(kwetkdry) + φSIλI
Capillary pressure model [24,44,45,46] P c a p = P 0 S 1 λ 1 1 λ ,   S = S A S i r A S m x A S i r A
Maximum reference aqueous saturation SmxA [24,44,45,46]1
Porosity distribution index λ [24,44,45,46]0.45
Initial capillary pressure P0 [24,44,45,46]104 Pa
Relative permeability model [24,44,45,46]KrA  = [ ( S A SirA ) / ( 1 SirA ) ] nA ,   K rG = [ ( S G SirG ) / ( 1 SirA)]nG
Permeability reduction index for aqueous nA [24,44,45,46]3.5
Permeability reduction index for gas nG [24,44,45,46]2.5
Residual gas saturation SirG [24,44,45,46]0.03
Residual aqueous saturation SirA [24,44,45,46]0.30
Permeability reduction model [24,44,45,46] k k 0 = F ϕ S = ( ϕ ϕ c ϕ 0 ϕ c ) n
Critical porosity φc [24,44,45,46]0.05
Permeability reduction index n [24,44,45,46]3
Disclaimer/Publisher’s Note: The statements, opinions and data contained in all publications are solely those of the individual author(s) and contributor(s) and not of MDPI and/or the editor(s). MDPI and/or the editor(s) disclaim responsibility for any injury to people or property resulting from any ideas, methods, instructions or products referred to in the content.

