Article

Two-Parameter Probabilistic Model and Experimental Research on Micron Particle Deposition

School of Measurement and Communication Engineering, Harbin University of Science and Technology, Harbin 150080, China
*
Author to whom correspondence should be addressed.
Appl. Sci. 2024, 14(14), 6200; https://doi.org/10.3390/app14146200
Submission received: 27 May 2024 / Revised: 29 June 2024 / Accepted: 10 July 2024 / Published: 17 July 2024

Abstract

:
The deposition of micron particles in gas pipelines has always been an important problem in ultra-clean ventilation technology in the modern laser fusion, precision electronics, aerospace, and biomedical fields. Combining the mathematical expression of the migration, collision, and deposition of micron particles in a gas pipeline with a simulation of flow fields, a two-parameter particle probability deposition model based on v i n l , θ c r and collision probability coefficient P P is established, and the distribution law of particle deposition, considering two deposition targets of the pipe wall and deposition layer, is given. Combined with an experiment on particle migration and deposition in a gas pipeline, an interpretation and verification of the particle deposition distribution law are given, and the difference between the model and experiment is discussed through particle deposition efficiency mass distribution. Studies have shown the following: Under the premise of two kinds of deposition targets, different particle sizes in the gas pipeline present different deposition laws; the deposit morphology is a spot deposit of 10 µm particles and a flake deposit of 40 µm particles; the deposit position shows a uniform distribution and a lower wall dominance; and the deposit concentration area of 40 µm shows a more significant distribution. The results are very important for the selection and optimization of gas pipelines for clean spaces.

1. Introduction

The research on the deposition law of micron particles in gas transmission pipelines has been the focus of attention in ultra-clean ventilation technology in the modern laser fusion, precision electronics, aerospace, and biomedical fields. The space cleanliness control of ventilation technology based on the deposition law of micron particles, such as microorganisms and impurities, has become a key factor affecting the development of science and technology in these fields.
In the field of laser fusion, the contamination damage of optical elements caused by the deposition of micron-level nonvolatile inorganic particle pollutants is the main factor affecting the service life of high-power laser optical systems driven by large-scale inertial confinement fusion, such as the National Ignition Facility (NIF) of the United States and the Laser Megajoule (LMJ) of France, and the Shenguang series laser devices of China have been exposed to mirror contamination problems during construction and use [1,2,3,4,5]. The air knife purging method is adopted, which is the mainstream ventilation technology method for clean control in the field of laser fusion at home in China and abroad at present. Ventilation transmits high-purity inert gas to purge the mirror surface with an air knife and remove particles on the mirror surface. After blowing by the air knife, the particles can easily rebound against the wall and cause repeated deposition pollution, with the secondary pollution of mirror deposition at different places after moving along the ventilation airflow, thus seriously affecting the stable operation and service life of a high-power laser optical system [6,7]. In the field of electronic manufacturing, micron-scale particle deposition pollution can greatly affect the product yield of integrated circuits [8,9,10]. In the manufacturing process, if micro-scale particle deposition occurs on the silicon substrate, or if micro-scale particle deposition occurs on the mask plate, it will cause a short circuit, open circuit, scratch, or pattern transfer defect in the chip circuit, which will affect the performance and reliability of the integrated circuit, and even lead to scrapping it [11]. In the aerospace field, micron particle deposition pollution may exist in the whole process of spacecraft ground production, storage and transportation, low-temperature vacuum operation, etc. Pollution will affect the performance of aerospace products and their payloads, and shorten the life of spacecraft and their payloads, which is undoubtedly a key problem to be controlled for aerospace vehicles with a high reliability and high investment capital and technology density [12]. Among them, ultra-clean ventilation technologies such as vacuum cleaning and blowing removal are widely used in the manufacture and assembly of aerospace products, the removal of particulate pollutants in the final assembly, test, storage, transportation, and launch stages of spacecraft [13,14], and to ensure the removal efficiency of pollutants and pay attention to the problem of system cross-contamination. In the field of medical engineering, surgical infection is a problem that society, hospitals, and patients pay close attention to. For surgical operations, the incision infection rate is as high as 25.7%, and one quarter of these surgical infections are caused by bacteria floating in the air as micron-sized particles and falling into open wounds [15]. Ultra-clean ventilation technology is recognized as the best way to prevent air infection during surgery. By controlling the flow mode of clean airflow, the effective removal of contaminated particles in the air in the operating room can be realized, and the pollution transmission route of exogenous microorganisms deposited on the surgical wound with particles as carriers can be cut off, to ensure the cleanliness of the wound. While reducing the surgical infection rate of patients, it can reduce the dosage of antibiotics before and after surgery and avoid the imbalance of body flora and immune function caused by the long-term application of broad-spectrum antibiotics [16]. To sum up, the application of ultra-clean ventilation technology has had an inestimable impact on the progress of modern science and technology, and it has become one of the core conditions for scientific and technological progress in the civil and national defense fields. The key to ultra-clean ventilation technology lies in the control of the migration and deposition of micron particles in the ventilation gas phase. Therefore, it is of great theoretical and engineering significance to study the deposition of micron particles in gas pipelines.
At present, numerical simulation and experimental simulation are mainly used to study the deposition of micron particles, and the Lagrangian particle trajectory method is the main method of numerical simulation. Simulations usually assume that the particle mass concentration in the airflow is very small, and the particles in the turbulence do not affect the turbulence structure. Li and Ahmadi [17] have simulated the deposition law of particles in smooth channels, considering Stokes drag, shear lift, and the Brownian diffusion of gravity. It is proved that the walled settlement of large particles in the inertial region of particles is affected by wall rebound. Uijttewaal and Oliemans [18] simulated the deposition of large-size particles in vertical circular pipes by the direct numerical simulation (DNS) and the large eddy simulation (LES) methods, and obtained the finding that the deposition rate of particles in an inertial buffer zone on the wall surface will decrease with the increase in particle size. Brooke [19,20] used the DNS method to simulate vertical migration, and the Lagrangian method was used to track particles in a particle diffusion collision zone only considering particle drag force. Chen [21] numerically simulated vertical migration using the DNS method, and then simulated particle deposition in the channel using the particle motion equation with optimized lift. Mao Shang [22] studied the influence of different pipe shapes on particle deposition in supercritical CO2 and found that rectangular ribs and semicircular ribs arranged in the pipe are conducive to particle deposition, and that the deposition efficiency of a rectangular ribbed pipe is higher than that of a semicircular ribbed pipe. Sun Jinze [23] analyzed the deposition process of MgO particles and a calcium carbonate mixed system on a copper heat exchange surface by a molecular dynamics simulation method, and discussed the influence of concentration on deposition characteristics of mixed scales by changing the calcium carbonate concentration. Yang [24] established a finite difference–lattice dynamics coupling model to analyze the deposition characteristics of calcium carbonate on the heat transfer surface of microchannels, and discussed the influence of the distribution spacing and height of surface microstructure units on scaling behavior. Most of the studies described above assume that particles collide with clean walls, and mechanical analysis at the moment of collision is used as the basis for determining whether particles are deposited. However, in the actual deposition process, particles not only collide directly with the wall, but also collide with the deposited particles on the wall. The difference between the two deposition targets will inevitably lead to a change in the basis for judging particle deposition, which will lead to a difference in particle deposition efficiency and deposition distribution calculation, and thus lead to inaccurate results of the particle deposition law.
On the other hand, experimental simulation is the key means to reveal the complex physical mechanism of movement and the mechanical characteristics of the flow field in the study of the migration and deposition law of micron-sized particles [25]. The relative objectivity of the test results means experimental simulation is often used to measure the flow data related to particle deposition and verify the mathematical models of flow simulation and computational fluid dynamics calculation results. Sehme [26] found that particles were deposited on both the bottom and top surfaces of horizontal pipes, and the amount of particles deposited on the top surface of pipes increased with the increase in particle size. Zhijin Zhang [27] simulated the particle pollution distribution on insulators by setting up a wind dynamic field experiment. Different gas flow directions led to the non-uniform deposition distribution of particle pollution. Piskunov [28] tested three tubes of a different roughness (smooth glass tube, roughness height k = 0.5 and 1.5); the deposition velocity of a rough surface increases with increasing roughness, that is, the roughness produced by particle deposition makes the deposition phenomenon more obvious. Similarly, Deng Rining [29] showed that the critical heat flux of a 3 μm SiO2 deposited surface can be increased by 77.4% compared with that of a non-deposited surface, based on the comparison of the deposition of silicon dioxide (SiO2) on the deposited surface and non-deposited surface, which also confirmed that deposited particles will present different deposition states due to different collision objects, and gave experimental characteristics of deposition of 1 μm and 3 μm particles. Similar to the simulation studies, experimental results also confirm that the cleanliness of the sedimentary wall has an obvious influence on the actual particle migration and deposition; that is, the difference between the two deposition targets will lead to inaccurate results of the particle deposition law.
Therefore, judging deposition targets is the premise for deciding whether particles deposit or not. Based on the deposition calculation method which can be generally applied to all forms of particle collision, the deposition law of particles of a micron size on different-cleanliness wall surfaces is further explored, and the influence of different conditions on particle deposition efficiency and deposition distribution is understood. Especially, the deposition law of micron particles in a gas transmission pipeline is analyzed, from the two angles of simulation and experimental simulation. It is of great significance, to serve the development of major scientific engineering and manufacturing science and technology fields.

2. Particle Deposition Model

2.1. Model Assumptions

The specific model assumptions used in this paper are as follows:
  • It is assumed that the gas fluid is an incompressible medium, and no temperature change occurs in the study;
  • It is assumed that the particles are monodisperse spherical particles of the same diameter with the same physical and chemical properties;
  • It is supposed that the influence of particles on the fluid and particles is ignored;
  • It is assumed that the work of the adhesion force and the elastic force can be linearly superimposed, and the deposited particles no longer deform when colliding.

2.2. Particle Migration

The migration’s description of micron particles in the air is the precursor of particle deposition and the basis of the particle deposition model. This section mainly deals with the selection of a mathematical model describing the airflow field and force acting on particles in a flow field.

2.2.1. Mathematical Model of Flow Field

In this paper, the re-normalization group k-ε (RNG k-ε) turbulence model commonly used in the field is used to simulate the time mean flow field, and its higher adaptability to the strain rate and the applicability of the streamline bending degree is used to fit the flow characteristics of particles affected by the insufficient development of near-wall turbulence during the migration and sedimentation process. In the RNG k-ε model, k and ε can be described as [30]:
t ( ρ k ) + x i ( ρ k v i ) = x j ( α k μ e f f k x j ) + G k ε ρ
t ( ρ ε ) + x i ( ρ ε v i ) = x j ( α ε μ e f f ε x j ) + C 1 ε ε k G k C 2 ε ρ ε 2 k R ε
where ρ is fluid density, v i is the velocity vector, μ e f f is the effective dynamic viscosity, G k is the turbulent kinetic energy generation term, α k and α ε are, respectively, the reciprocal of the effective Prandtl number k and ε , C 1 ε and C 2 ε are empirical constants, and R ε is ε.

2.2.2. Migration Force of Particulate Matter in Flow Field

The migration process of micron-sized particles in the air is closely related to the migration force, such as drag force, gravity force, Basset force, and Saffman force. The force balance equation of the particles can be simplified as follows [31,32,33]:
m d v P d t = G + F D + F S + F B
G = m g x ( ρ P ρ f ) ρ P
F D = C D π ρ f ( v f v P ) 2 d P 2 8
F S = 1 . 61 ( μ ρ f ) 1 2 d P ( v f v P ) | d v P d y | 1 2
F B = 3 2 d P 2 ( π μ ρ f ) 1 2 t 0 t d τ d d τ ( v f v P ) ( t τ ) 1 / 2
where G , F D , F S , and F B represent gravity, drag force, Saffman force, and Basset force respectively, where ρ f is fluid density, ρ P is particle density, m is particle mass, C D is the drag coefficient, d P is the particle diameter, g x is acceleration caused by gravity, μ is dynamic viscosity of the fluid, v P represents particle velocity, and v f represents the fluid phase velocity.
The C D is a parameter determined by the Reynold number Re P of particles, which has a great influence on the forces and motion trajectories of particles. According to different experimental data and applicable scopes, many empirical and semi-empirical formulas have been given by the authors’ predecessors. Among them, the more widely used is the lift-Gauvin formula, as follows [34]:
C D = 24 Re P ( 1 + 0.15 Re P 0.687 ) + 0.42 1 + 4.25 × 10 4 Re P 1.16
where Re P can be expressed as [34]:
Re P = ρ f | v f v P | d P μ
For spherical particles, the ratio of eddy pressure differential force to viscous friction resistance is 1:2 under the condition of Re P 0 . When the Re P increases to the Newtonian resistance region ( Re P > 1000 ), the proportion of viscous resistance in the total drag force is very small, and the total drag force is basically determined by the eddy pressure difference force, and the C D also approaches to a fixed value of 0.44. The object of study in this paper is the particles in gaseous fluid, whose Re P < 1000 . The expression of C D as shown in Formula (10) can be obtained from the Shiller–Naumann relation, and the error is estimated to be between −4% and 5% [35].
C D = { 24 Re P , Re P 1 24 Re P ( 1 + 0.15 Re P 0.687 ) , 1 < Re P 1000

2.3. Two-Parameter Particle Probability Deposition Model

Based on the foregoing, the particle deposition model is established through the depositional judgment and deposition probability description of normal and tangential parameters.

2.3.1. Two-Parameter Determination of Particle Deposition
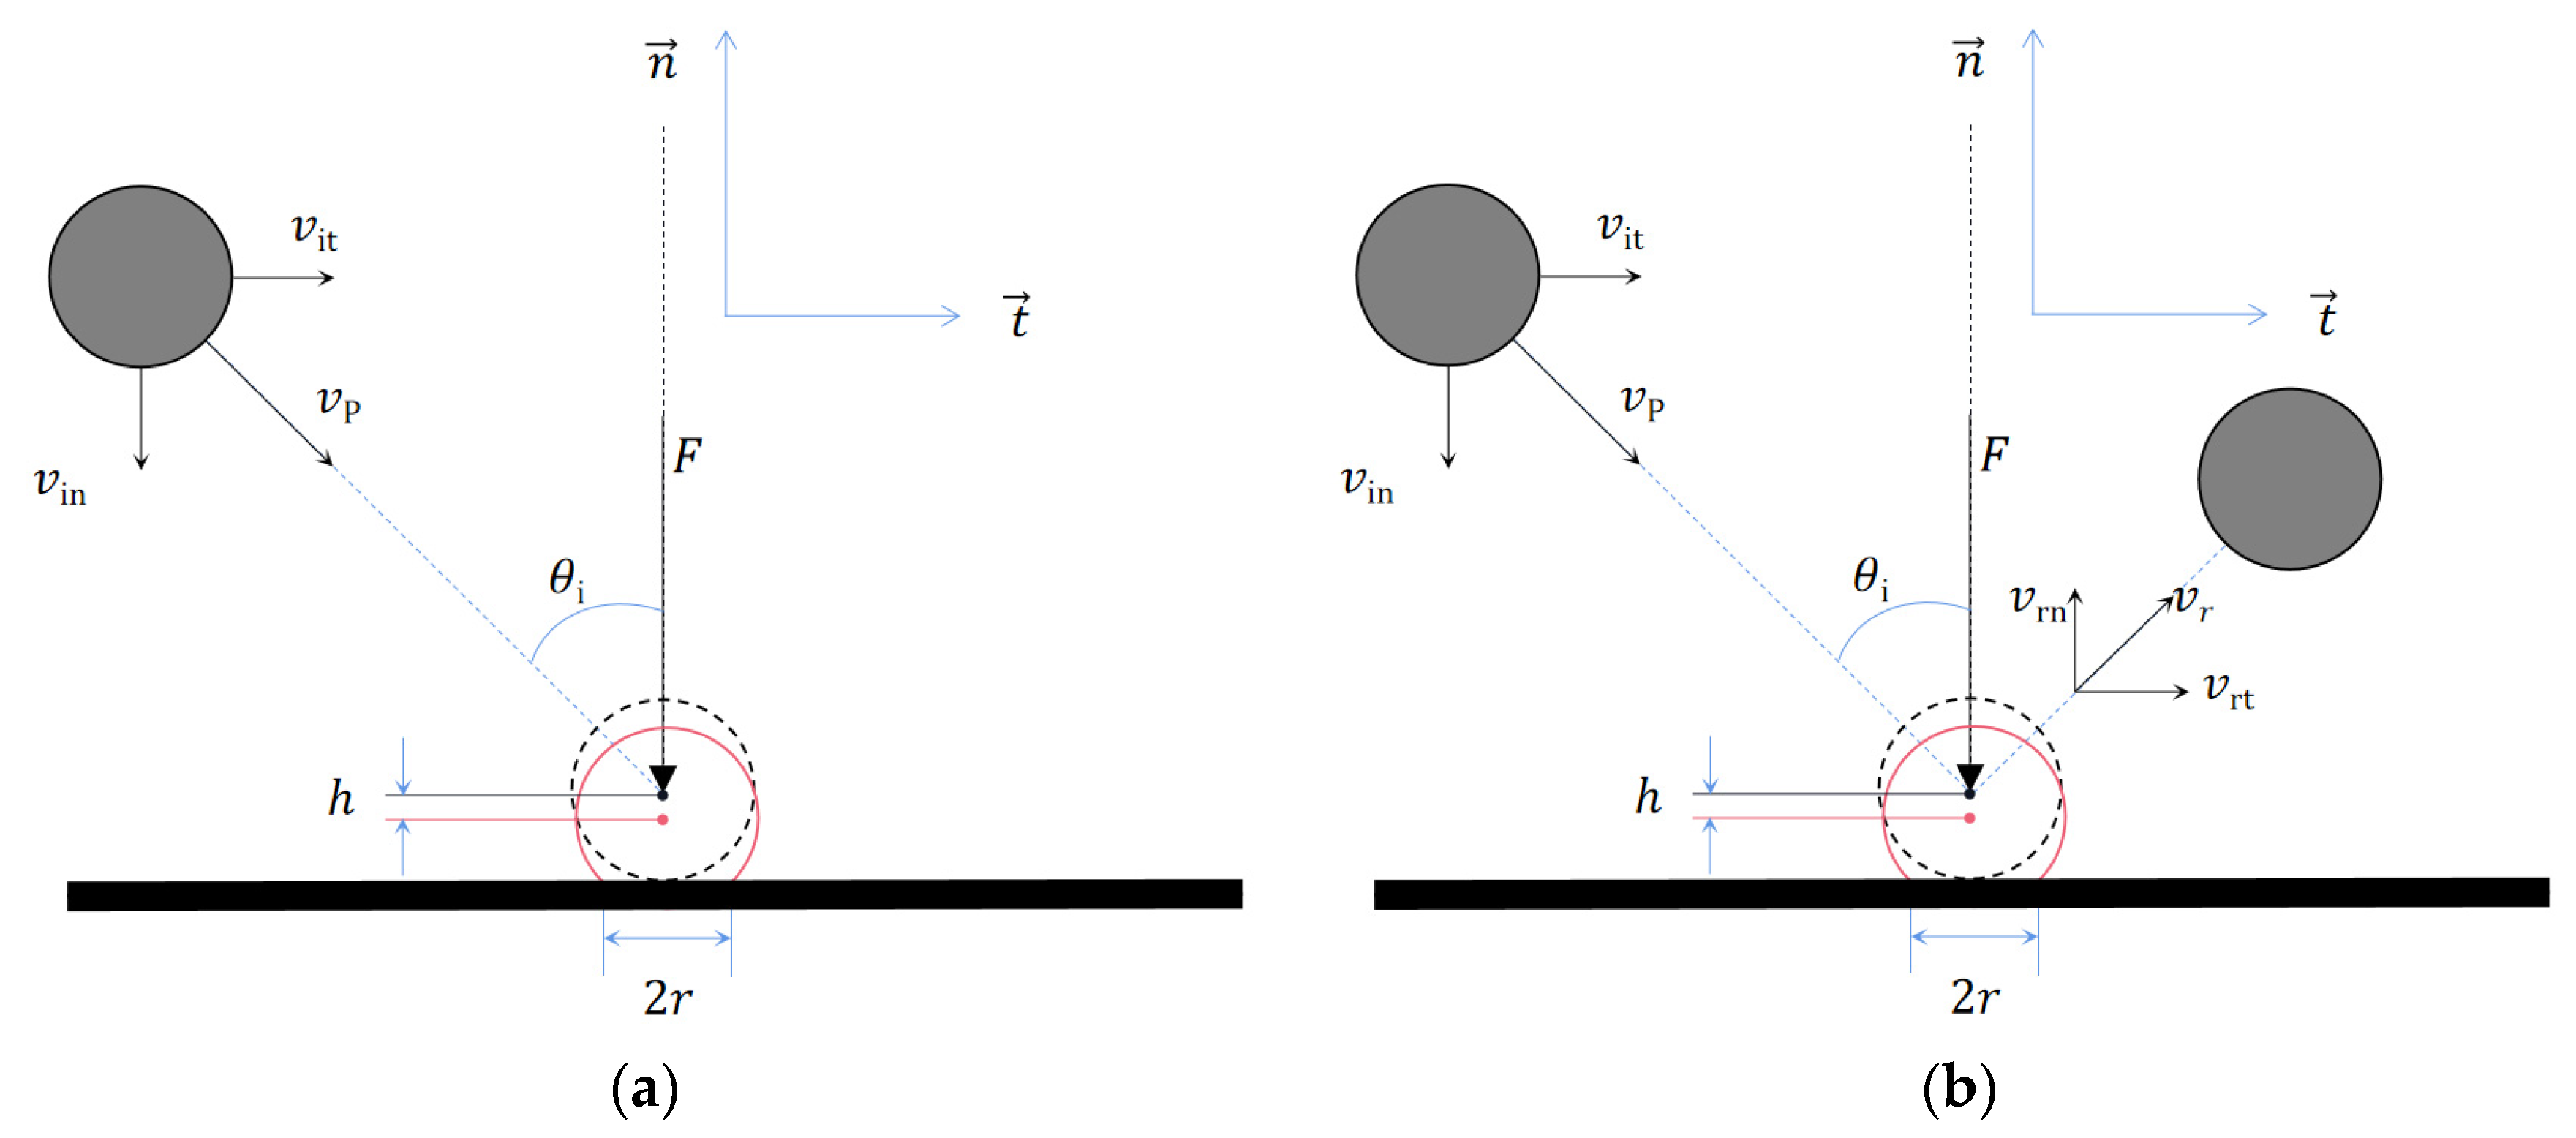
As shown in Figure 1, θ i represents the angle between the particle velocity and the normal direction of the wall surface. The particle velocity v P is decomposed into v i n and v i t . v i n is the normal incident velocity perpendicular to the wall surface, and v i t is the tangential incident velocity parallel to the wall surface. Through the energy conservation situation in the collision deformation process of particulate matter, the two dimensions of normal deposition and tangential deposition are used to obtain the determination criteria for the deposition desorbed. Among them, the degree of collision deformation and the mutual transformation of the kinetic energy and elastic potential energy of the particulate matter during the collision are mainly affected by the normal collision speed, so it needs to be characterized by the critical speed of facies deposition. The friction and sliding between the particulate matter and the sedimentary wall are mainly affected by the tangential collision speed, so it is necessary to use the tangential critical speed. Measured from the angle of collision, the two together determine whether particulate matter is deposited. When the particulate matter meets tdesorbed conditions during the collision process, the particulate matter will desorb to the sedimentary wall at the speed of rebound v r ; otherwise, it will stick to the sedimentary wall to form a particulate matter sedimentary layer.
Figure 2a shows the elastic deformation of the particulate matter during the collision, Figure 2b shows the critical elastic deformation, and Figure 2c shows the elastic–plastic deformation. The degree of deformation is determined by the center sinking scale h of the particulate matter, the radius of the deformed contact surface r , and the contact load F . In the event of a critical elastic deformation collision, the corresponding deformation contact radius and contact load and the initial degree of center sinking are characterized by r e l , F e l , and h e l respectively.
In the collision process of the normal dimension, according to the deformation process of particle collision, the normal energy conservation equation can be used to describe the mutual conversion process of the kinetic energy–elastic potential energy–plastic potential energy of the particle. Taking into account the two possibilities of the elastic deformation or elastic–plastic deformation of particulate matter during the collision, it can be used to describe the introduction of the critical elastic deformation characterization parameters r e l , F e l , and h e l described earlier. The energy conservation equation for the collision deformation process of particulate matter is as follows [36]:
{ Q i n + Q a ( F ) = Q e l + Q e ( F ) + Q e o ( F ) Q i n = 1 2 m v i n 2 Q a ( F ) = ζ π ( r e l 2 + F F e l π y ) Q e l = π 5 d P 2 y 5 480 E * 4 Q e ( F ) = 1 2 h e l ( F F e l ) Q e o ( F ) = ( F F e l ) 2 4 π d P y
where Q i n is the normal kinetic energy of the particulate matter; Q a is the surface adhesion energy of the particulate matter deposition wall facing the particulate matter; Q e l is the critical elastic energy; Q e is the elastic energy stored when the particulate matter undergoes plastic deformation; Q e o is the energy lost by the plastic deformation of the particulate matter; ζ is the surface free energy of the particulate matter; E * is the equivalent Young’s modulus; and y is the critical elastic stress, which can be expressed as particulate matter yield stress Y as y = 3.2 Y .
The relationship between the equivalent Young’s modulus E * and the Poisson’s ratio ν P of the particulate matter, the elastic modulus E P , and the Poisson’s ratio ν 1 and the elastic modulus E 1 of the dust accumulation wall is as follows [37]:
1 E * = 1 ν P 2 E P + 1 ν 1 2 E 1
When only the elastic deformation of the particulate matter occurs, the sinking scale of the center of the particulate matter satisfies h < h e l , and the particulate matter conforms to the Hertz elastic contact theory. The pressure in the contact surface is elliptically distributed, and the maximum stress p max appears in the center of the contact surface corresponding to the center of the particulate matter. At this time, the contact load F of the particulate matter on the contact area, the deformation (elasticity) contact radius r , and the sinking scale of the center of the particulate matter h are as follows [38]:
F = 2 3 π r 2 p max
r = ( R * F 4 3 E * ) 1 3
h = r 2 R * = F 2 / 3 ( R * ) 1 / 3 ( 4 3 E * ) 2 / 3
where R * is the effective contact radius of curvature, and the relationship between the radius of curvature of the particulate matter d P and the radius of curvature of the deposited wall surface R 1 of the particulate matter can be expressed as [37]:
1 R * = 1 d P + 1 R 1
When the particulate matter is transformed from elastic deformation to the critical elastic state of plastic deformation, the critical sinking scale h e l , the critical elastic contact radius r e l , and the critical contact load F e l of the particle center can be expressed as follows [38]:
F e l = ( 2 3 π ) 3 R * 2 ( 4 3 E * ) 2 y 3
r e l = π R * 2 E * y
h e l = ( 2 3 π ) 2 R * ( 4 3 E * ) 2 y 2
When the particle is in elastic–plastic deformation, the sinking scale of the particle center satisfies h > h e l , and the contact radius of deformation (elastic–plastic) satisfies r > r e l . The deformation of particles accords with Hill’s elastic–plastic cavity theory. With the increase in the subsidence scale of the center point, plastic deformation occurs in the middle part of the contact region between the particles and wall surface, the plastic deformation region expands outward with the increase in the subsidence scale of the center point, and elastic deformation occurs in the surrounding annular region. The stress in the plastic deformation region is uniformly distributed, and the magnitude is the critical elastic load y , while the stress in the surrounding annular elastic deformation region is generally considered to conform to the Hertz contact theory. The corresponding particle contact radius r and contact load F can be expressed as [38]:
r 2 = r e l 2 + r P 2
F = π r P 2 y 2 π R * ( h h e l ) y
where r P is the radius of the contact region of the particle for plastic deformation, and the radius of the critical elastic region r e l is equivalent to the converted radius of the annular elastic deformation region around the plastic deformation contact region.
When the plastic deformation stage of the particles is over, it enters the elastic unloading stage of the contact load, which is still in line with the Hertz elastic contact theory. At this time, the particles overcome the adhesion of the deposited wall surface and work until desorbed. By combining Formulas (12)–(21) and Formula (11), the adhesion energy Q a r that the particles need to overcome for being desorbed can be expressed as:
Q a r = 2 π d P 2 ( 1 cos 2 ( d P h ) d P ) ζ R *
Therefore, the deformation type of the particles is judged according to the deformation variable in which the particles are located; the corresponding contact load F and contact radius r are determined; and the elastic energy Q e stored when the particles undergo plastic deformation, the critical elastic energy Q e l , the surface adhesion energy Q a of the particle deposition wall facing the particles, and the particle desorbed are required to overcome the adhesion energy Q a r .
If the sum of Q e l and Q e is greater than Q a r , the particles can overcome the adhesion energy of the dust accumulation surface and desorb, and vice versa, they are deposited on the wall. Therefore, based on the above description of the conservation relationship of particle energy, the description of the normal-phase critical deposition velocity v i n l for the solution of particle deposition can be obtained, as shown below:
v i n l = Q a r Q a + Q e o 1 / 2 m
The sedimentation determination conditions of the tangential dimension collision process need to be given by analyzing the energy changes of the particles in the tangential direction. In the previous description, during the collision between the particles and the wall, due to the presence of the surface adhesion energy Q a of the particle deposition wall facing the particles, the plastic deformation loss energy Q e o of the particles, etc., there is a loss of momentum after the particles are desorbed, and this energy loss also causes the direction of particle rebound to change. The tangential critical collision angle θ c r of the particles is introduced to characterize the minimum angle between the particles and the wall surface when the particles are desorbed relative to the original direction after the particles collide. When the particle collision angle θ i is greater than the tangential critical collision angle θ c r , the particles desorb and rebound, making it extremely difficult to be captured by the deposited wall. In the literature [39], Konstandopoulos studied the collision between particles that exceed the tangential critical collision angle and the wall surface, finding that the particles change from oblique incidence to parallel sliding close to the wall surface after the collision and will not be attached to the wall surface.
At this time, the calculation of the tangential critical collision angle can be solved by analyzing the tangential kinetic energy of the particles and the minimum energy required to destroy their contact area, according to the principle of conservation of particle energy. Contact failure occurs when the normal contact force is equal to the drag force of the JKR theory, which can be expressed as [39]:
F t μ * F a
F t = k t v i t Δ t
F a = 3 π d P Γ
where F a is the adhesion of the particles, μ * characterizes the effective coefficient of friction of the particles, Γ is the surface energy between the particles, and k t is the tangential stiffness value of the particles.
The failure tangential impact energy E t can be expressed as:
E t = 1 2 k t ( v i t Δ t ) 2 = ( μ * F a ) 2 2 k t
The forward adhesion energy E a n that must be overcome can be expressed as [39]:
E a n = 2 π a 2 Γ
where a is the adhesive contact radius at the moment of contact failure due to sliding. Let k t 8 G * a , where G * is the effective shear modulus, which can be expressed as:
E t E a n = 9 π 32 μ * 2 Γ R 2 G * a 3
The contact radius r when no slippage occurs can be expressed as:
r = ( 9 Γ π R 2 E * ) 1 3
By introducing the equivalent coefficient of the particulate contact radius β = a / r , the tangential critical collision angle θ c r of the particulate matter can be described:
v t v n = E t E n = tan θ c r = μ * 32 β 3 E * G * 0.034021 f β 2 / 3 4 2 ν P 1 ν P
where f is the coefficient of friction of the wall surface.
Based on the above analysis, after the collision between the particulate matter and the particulate matter deposition wall, there will only be two kinds of particulate matter–particulate matter deposition wall relationship (i.e., deposition or desorbed). In order to facilitate subsequent analysis, the state coefficient PP is introduced to describe the relationship between the particulate matter and the particulate matter deposition wall at this time. If the particulate matter collides with the deposited wall of the particulate matter and is attached to the wall, the particulate matter is deposited on the surface (i.e., v r = 0), and ϒ P takes 0, indicating that the relationship between the particulate matter and the deposited wall of the particulate matter is deposited at this time; if the particulate matter collides with the deposited wall of the particulate matter, it is not deposited by the wall. If the surface is attached, the particulate matter is desorbed to the surface (i.e., v r ≠ 0). At this time ϒ P takes 1, which means that the relationship between the particulate matter and the deposited wall of the particulate matter is desorbed. The established two-parameter determination criteria for desorbed particulate matter deposition based on the critical velocity v i n l of normal-phase deposition and the tangential critical collision angle θ c r can be described as:
ϒ P = { 0 ,   θ i θ c r v i n v i n l 1 , θ i > θ c r ( θ i θ c r v i n > v i n l )
  • If the particle collision angle θ i is less than or equal to the tangential critical collision angle θ c r ( θ i θ c r ) and the normal incident velocity v i n of the particle is less than or equal to the normal critical deposition velocity v i n l ( v i n v i n l ), the particle will show a wall deposition state ( ϒ P = 0);
  • If the collision angle θ i of the particulate matter is greater than or equal to the tangential critical collision angle θ c r ( θ i > θ c r ), the particulate matter will show a wall desorbed state ( ϒ P = 1). If the normal incidence velocity v i n is greater than the normal critical deposition velocity v i n l ( v i n > v i n l ), the desorption of particles will rebound from the wall surface and return to the continuous-phase fluid. Otherwise, the desorption of particles will be parallel to the wall surface;
  • When the collision angle θ i is less than or equal to the tangential critical collision angle θ c r ( θ i θ c r ) and the normal incidence velocity v i n is greater than the normal critical deposition velocity v i n l ( v i n > v i n l ), the particles still exhibit a wall desorption state ( ϒ P = 1), and the desorption behavior of particles is that they rebound from the wall and return to the continuous-phase fluid.

2.3.2. Determination of Collision Probability of Particle Deposition

To establish the deposition desorption model of adaptive particle–particle deposition wall and particle–particle deposition layer collision, firstly, the collision process between the particles and deposition layer should be analyzed, and the motion state judgment of particles and deposition layer collision based on the two-parameter particle deposition desorption judgment criterion proposed above can be realized by modifying the characteristic parameters of the particles. Then, by introducing the collision probability coefficient P P of the particles, the judgment criteria for the collision of particles entering the near-wall region are determined, so that the particle deposition desorption models of adaptive particle–particle deposition wall collision and particle–particle deposition layer collision are established.
Collision between the particles and sedimentary layer is similar to the collision process with sedimentary wall surface. As shown in Figure 3, particles actually collide with particles adhered to and deposited on the sedimentary layer. At this time, the collided-with sedimentary particles (with plastic deformation) are difficult to desorb (bounce or move horizontally) due to collision impact of particles, due to the adhesion force of the surrounding sedimentary particles and deposited wall surface. It can be assumed that they are inherent parts of the sedimentary wall surface, as shown in Figure 3a. Therefore, considering only the collision between particles and a single deposited particle, due to the symmetry of particle spherical morphology, the maximum stress of this collision process always exists on the line connecting the spherical centers of two particles. The deposition desorption judgment of this collision can be approximately described by Section 2.2.2.
When the discrete particles are spherical particles with a uniform particle size, the parameters such as the curvature radius, elastic modulus, and Poisson’s ratio of the contact surface between the particles and deposited particles are the same, which can further simplify the two-parameter particle deposition desorption criterion.
As for the collision between particles and deposited particles, it belongs to two-dimensional eccentric collision on an x-y plane, as shown in Figure 3b. In order to simplify the calculation process, the sinking scale of the particle center of the plastic deformation of the deposited particles at this time can be taken as a critical sinking scale (i.e., h = h e l ), and the distance between the particles and deposited wall surface is l, so the incident angle θ i of the particles relative to the deposited particles can be expressed as,
θ i = θ i cos 1 l d P + h e l 2 d P
Substituting the above parameters into the two-parameter particle deposition judgment criteria, it is not difficult to obtain the conditions of the two-parameter particle deposition judgment criteria suitable for particle–particle deposition collision.
When particles collide near the wall, the collision object of the particles should be determined, and the corresponding criteria for determining deposition desorption should be selected. The collision probability coefficient P P between the particles and deposited particles is introduced to describe the collision situation of the particles, and the collision probability coefficient P P between the particles and deposited particles can be expressed by calculating the percentage of surface area occupied by the deposited particles in a unit wall, such as:
P P = {   N π d P A s u b × 100 % ,   0 < P P < 100 % 100 % , P P 100 %
where A s u b is the unit area of the wall surface of the particulate matter deposition; and N is the number of deposited particles in the unit area.
Whenever a particle enters the near-wall area and will collide, it needs to be judged by the two-parameter particle deposit judgment criteria, and a random function is called upon to generate a random integer N R , which is compared with the P P value at this time. If N R × 100 % P P , the determination criteria for the deposition and desorbing of the particulate matter–particle deposition wall are used for this particulate matter; otherwise, the determination criteria for the deposition and desorbing of the particulate matter–particle deposition layer are used.

2.3.3. Deposition Calculation Flow of Two-Parameter Particle Probability Deposition

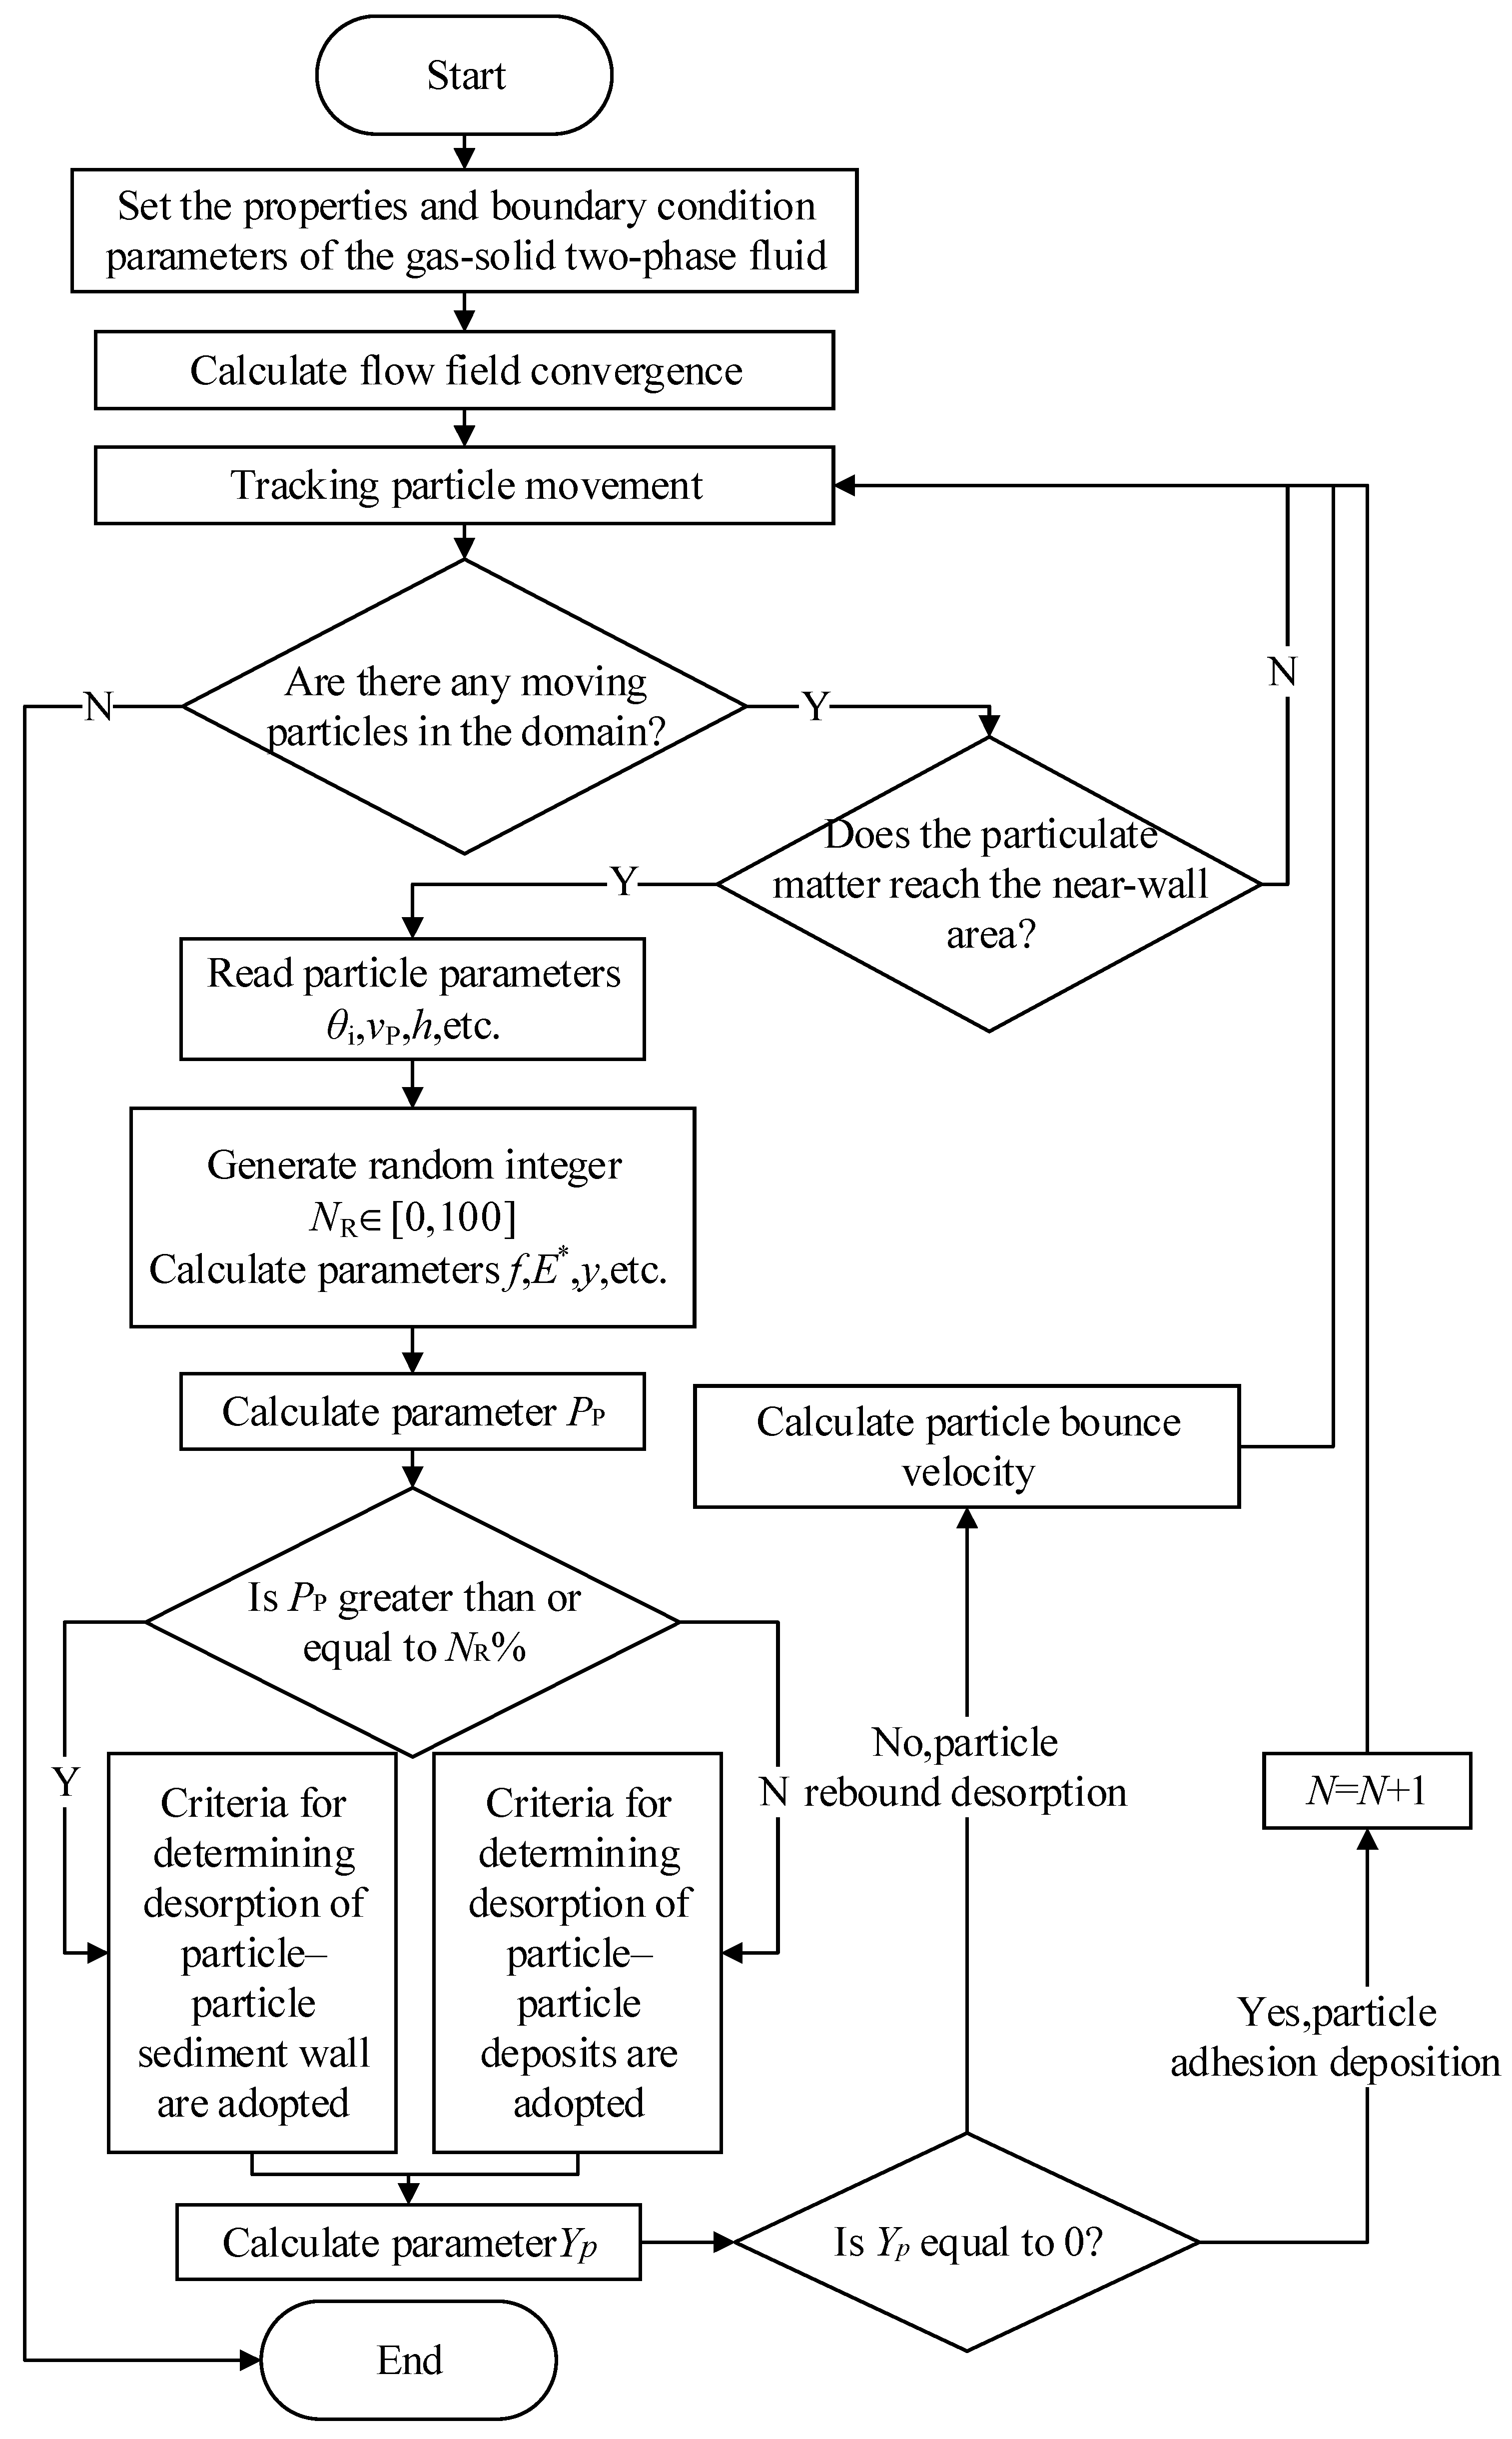
  • Start the calculation and set the necessary input parameters, including gas–solid two-phase fluid properties, boundary conditions and other setting parameters, the UDF transmission particle deposition desorbed determination criteria, and other conditional functions;
  • According to the input spherical particle force condition function, the Euler–Lagrangian equation is used to calculate the flow field parameters of the gas–solid two-phase particles, and capture the trajectory of the particles in the calculation domain;
  • If particulate matter enters the specified near-wall area (the specified near-wall grid), it is considered that the particulate matter will collide with the target surface (particle deposition wall or particle deposition layer); if the particulate matter is not recognized to enter the specified near-wall area (the specified near-wall grid), it is considered that the particulate matter will collide with the target surface (particle deposition wall or particle deposition layer) in the near-wall grid; then continue to track the trajectory of particulate matter in the calculation domain;
  • For particles that are about to collide, read the collision angle θ i , particle velocity v P , particle coordinates, center sinking scale h , and other parameters, and calculate the critical stress of the particles y , the equivalent Young’s modulus E * , and the sinking area of the specified unit (grid), and intermediate parameters such as particle number N ;
  • Call the random function in Fluent to randomly generate an integer N R greater than or equal to 0 and less than or equal to 100;
  • The collision probability coefficient P P of particulate matter and deposited particles is obtained through the calculated intermediate parameters, and the size of the N R and P P values is compared. If N R × 100 % P P , the determination criteria for the deposition and desorbing of the particulate matter–particle deposition wall are used for the particulate matter; otherwise, the determination criteria for the deposition and desorbing of the particulate matter–particle deposition layer are used;
  • According to the corresponding criteria, combined with the calculated intermediate parameters, the state coefficient of the particulate matter and particulate matter deposition wall surface ϒ P is obtained. If ϒ P = 0, it means that the relationship between the particulate matter and particulate matter deposition wall surface at this time is deposition, and the number of particles accumulated in the area of the specified unit (grid) is N value plus 1, and the particles are removed from the calculation domain; otherwise, it means that the relationship between the particulate matter and the deposited wall of the particulate matter is desorbed; calculate the rebound desorbed velocity v r of the particulate matter, and the particles re-enter the flow field calculation domain at the same time;
  • Repeat the calculation step (2) until there are no moving particles in the calculation domain, and reach end the calculation.
The specific calculation process steps are shown in Figure 4:

3. Results and Discussion

3.1. Particle Migration and Deposition Simulation

Coupling the two-parameter particle probability deposition model with the solver of the commercial fluid calculation software ANSYS FLUENT 2021 R2, a long straight dust removal airway of 0.6 m × 0.6 m × 30 m (L = 50 D) was selected as the background space, and based on the discrete phase model (DPM), the working wind speed and air were regarded as the continuous phase, and the micron-level polluted silica particles were regarded as the discrete phase. In order to obtain a faster convergence velocity, the coupling of pressure and velocity is calculated by using the SIMPLE algorithm, and the discrete form adopts the standard method except for the pressure term, and the rest of the convection term and viscous term are discretized by the second-order welcome style.
Among them, the wind speed of the working conditions is based on the “in the vertical and horizontal pipelines, for light mineral particles, the minimum dust removal air velocity is 12 m/s and 14 m/s”, respectively, according to the records in the industrial dust prevention manual, and considering the principle of maximizing dust removal efficiency and economic benefits, the parameters of the air velocity in the simulated working conditions are set for 12 m/s. The selection of the particle size of filthy silica particles paid attention to the 10 µm particulate matter mentioned in the important index of the ambient air quality index (AQI), as well as the 40 µm particulate matter with a critical particle size defined as fine dust under industrial conditions.

3.2. Particle Migration and Deposition Experiment

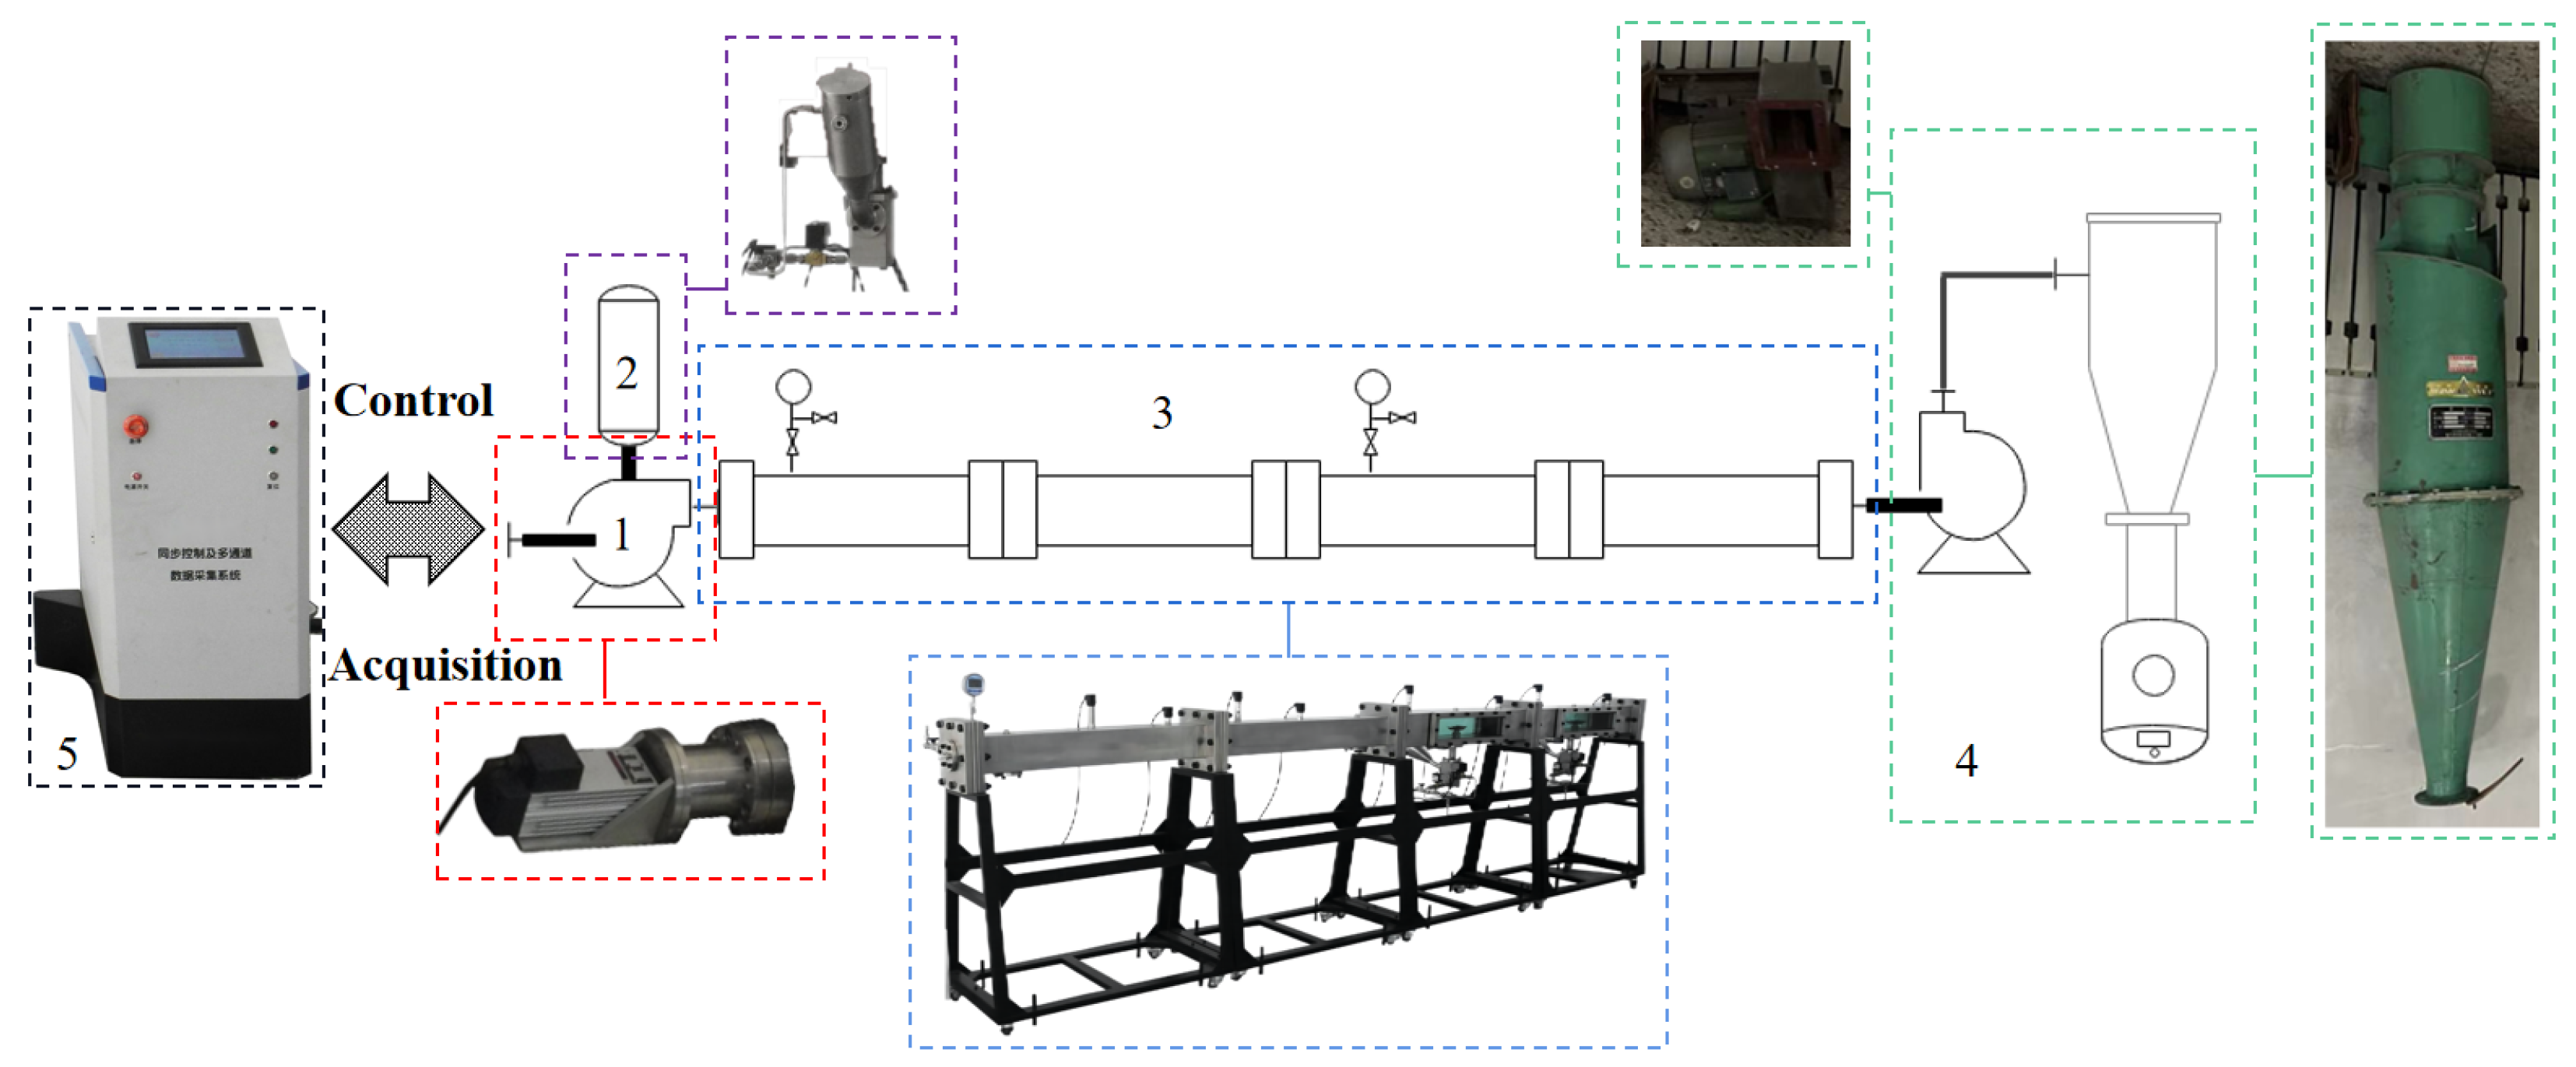
3.2.1. Experimental Platform for Particle Migration and Deposition Simulation

Based on the experimental platform for particle migration and deposition simulation, the micron-scale pollution particle migration and deposition test was carried out under working conditions, and the experimental platform is shown in Figure 5.
In order to achieve the simulation of the whole process of particle migration, it is equipped with a flow field generator equipped with an explosion-proof fan. The fan speed is adjustable from 0 to 6000 rpm, and the blades can be replaced. Through a suitable ratio, it can provide a uniform working condition of 0~15 m/s in the inlet section. Environmental wind speed experimental conditions can be set for particles with the deflector. The experimental simulation of migration and deposition provides a stable flow field environment.
The particle disperser is equipped with a gas-phase agitation device composed of four magnetic fans at different angles to each other, which is used to fully and evenly disperse a large volume of gas–solid two-phase flow. During the test, the particles are injected into the cavity through a V-shaped particle deflector under micro-pressure to achieve the uniform dispersion of the particles input.
The particle transport and deposition pipeline adopts a segmented design, and the main body of the pipeline is a double-layer stainless steel structure with a square section, which can be freely connected through flanges and angle adapters. The inner diameter of the nozzle D = 150 mm, square section, the length of each section L = 10 D = 1500 mm, and the maximum working pressure is 4 MPa. The pipeline can be divided into two types: an optical observation pipeline and optical measurement pipeline. Among them, the optical observation pipeline has two pairs of circular optical glass observation windows with an opening diameter of 90 mm, two groups of temperature and pressure acquisition sensors, and one group of hot-wire wind speed acquisition sensors. Meanwhile, it is equipped with a precision proportional gas distribution device, a pressure relief bursting disc, and multiple groups of detachable installation flanges for detecting the expansion of sensors. The optical measurement pipeline is provided with four-way omni-directional optical glass visible windows, which are respectively arranged at the upper and lower wall surfaces and the left and right wall surfaces of the pipeline in the middle position; each group of optical windows is strictly parallel; the window size is 1200 mm×135 mm; high-purity fused silica glass is adopted; the transmittance is greater than 90 percent; the transmission wavelength range is 200–1000 nm; the surface accuracy is 1/4 wavelength (328 nm); and optical detection conditions, such as particle velocity measurement and the like, can be met. In addition, each pipeline is equipped with a particle deposition collection plate and an installation groove, which can be used to change the roughness of the pipe wall, the material of the pipe wall, and the morphology of the collected particle deposition.
The particle collection system consists of a centrifugal fan, a cyclone dust collector, a gas–liquid separation device, and an exhaust gas filtration device, which can realize the pollution-free collection and discharge of experimental particles, waste liquid, and exhaust gas.
A multi-channel data acquisition controller, with a 12-channel synchronous data acquisition function, maximum sampling time of 6 s, and sampling time interval of 0.2 ms, can realize the electrical access of sensing signals, such as pressure, temperature, wind speed, vibration, flame light, etc., and the accurate control of external trigger acquisition systems such as electromagnetic flow valves and high-speed cameras. Equipped with a remote start controller and data wireless transmission module, it can realize the remote start and stop of particle migration and deposition experiments.

3.2.2. Test Samples

For the silica (SiO2) particles used in the experiment, the sample parameters are shown in Table 1.
The sample pretreatment is as follows:
  • Cleaning and pretreatment: The experimental samples of silica (SiO2) particles are first dissolved with acetone on the surface of the experimental samples, then washed with deionized water many times to remove the surface stains of the experimental samples, and finally dehydrated with absolute ethanol.
  • Drying pretreatment: The silica (SiO2) particle experimental sample is stored in a dark and dry area. Before the experiment, according to the experimental needs, take an appropriate amount of the sample and put it into the drying oven to heat it to 110 °C and dry it for 12 h, and then put it into the dryer for later use, so as to reduce the humidity of the experimental sample and reduce the influence of capillary force between the particles of the experimental sample on the experimental results during the experiment.
  • Electrostatic pretreatment: In the storage area where the silica (SiO2) particle experimental sample is located, a suspended ionizing fan is used to remove the electrostatic neutralization in the environmental space, reducing the electrostatic carryover of the experimental samples and reducing the influence of Coulomb force between the experimental sample particles on the experimental results during the experiment.
The LS-909 laser particle size analyzer from Omic was utilized to verify the particle size of silicon dioxide (SiO2) particles in the experimental samples, using the dry circulation injection method. The tested median particle size was found to be consistent with the data provided by the sample manufacturer.

3.2.3. Experimental Process

The test environment is maintained at room temperature with an ambient humidity not exceeding 30%RH. The time interval between removing the sample from the dryer and using it in the experiment should not exceed 30 min. The particle transport experiment will be conducted using silica (SiO2) ellipsoidal particles with diameters of 10 μm and 40 μm under a wind speed of 12 m/s working conditions. The specific experimental procedures are as follows:
  • Ensure that the components of the particle migration deposition simulation experimental platform are reliably connected and effectively bonded to the ground;
  • When the machine is turned on, the particle migration and deposition simulation experimental platform self-checks the working state, and the ventilation is self-cleaning;
  • Open the flow field generator and particle collection system through the software operation of the host computer; the system automatically configures the fan speed according to the set conditions, after the flow field is stable for 3 min, where the wind speed in the particle migration and deposition pipeline is collected through the hot-wire anemometer to meet the experimental setting; if it has been reached, the next experimental process can be carried out; if it is not reached, continue to wait for 5 min and re-measure; if the measured wind speed is still not reached, the experimental conditions need to be re-compared, and the power supply should be turned off and the wind power device and the pipeline interface of the experimental platform should be carefully checked, and step 2 should be repeated to re-start the self-test;
  • Open the lid of the particle disperser, put in the pretreated particle samples that meet the quality of the experimental calculation, tighten the lid of the chamber, turn on the gas-phase disturbance through the host computer software, close the disturbance device after a sufficient disturbance, and after a delay of 10 s, the gas–solid two-phase flow mixture is evenly put into the flow field through the deflector, the sensor group collects the simulation data, and the velocity measurement device is triggered synchronously to measure the velocity of the particles and flow field, and the single experiment is completed after the experimental termination condition is reached;
  • Carefully take out the sampling plate, clean the pipe, and prepare for the next experiment.

3.3. Simulation Results and Test Results

3.3.1. Particle Concentration Distribution of Simulation Results

Figure 6 is the cloud map of particle concentration distribution in a symmetrical section of the gas transmission pipeline obtained by a simulation of the two-parameter particle probability deposition model when the wind speed is 12 m/s. When the particle size is 10 μm, the particles fill the pipe under the action of airflow, and there is a high concentration area near the axis of the pipe, as shown in Figure 6a; when the particle size is 40 μm, the particles show gravity settling and inertia settling, and the high concentration area of the particles gradually deviates from the axis of the pipe along the length of the pipe and tends to the lower wall area, as shown in Figure 6d.
In order to better observe the variation in high particle concentration area along the pipe diameter direction, a vertical section extraction was carried out at 15 m (Y= 25 D) along the pipe length for Figure 6a and d, respectively. Among them, when the particle size is 10 μm, the concentration distribution in the pipeline is mainly concentrated near the center of the cross-section, and the high-concentration area is approximately rectangular. Under the complex flow pattern near the wall, the particles are deviated by turbulence and irregular fluid motion inertia, and present a partial high-concentration distribution, as shown in Figure 6b. However, the particles with a particle size of 40 μm are obviously affected by gravity, the particle concentration on the upper wall surface decreases obviously, the concentration distribution area on both side walls also tends to decrease gradually towards the lower wall surface with the increase in particle size, and the high-concentration area deviates from the center of the cross-section and moves downward, as shown in Figure 6d.
To observe the low-velocity region of the corner of the square tube, the angle between the left side wall and the lower wall in Figure 6b,e is extracted by magnification. When particles with a particle size of 10 µm migrate in the gas transmission pipeline, there are obvious low particle concentration areas at the corners of the pipe wall. This is mainly due to the difference in fluid viscosity and laminar velocity of the pipe wall affecting the lower-speed angular flow region. Due to small inertial force, particles have difficulty breaking through due to inertia. Turbulence in low-velocity region hinders entry into the corner low-velocity region, as shown in Figure 6c; particles with a particle size of 40 µm settle down obviously from inertia, and some particles enter the corner low-velocity region by inertia force outside turbulence direction, as shown in Figure 6f.

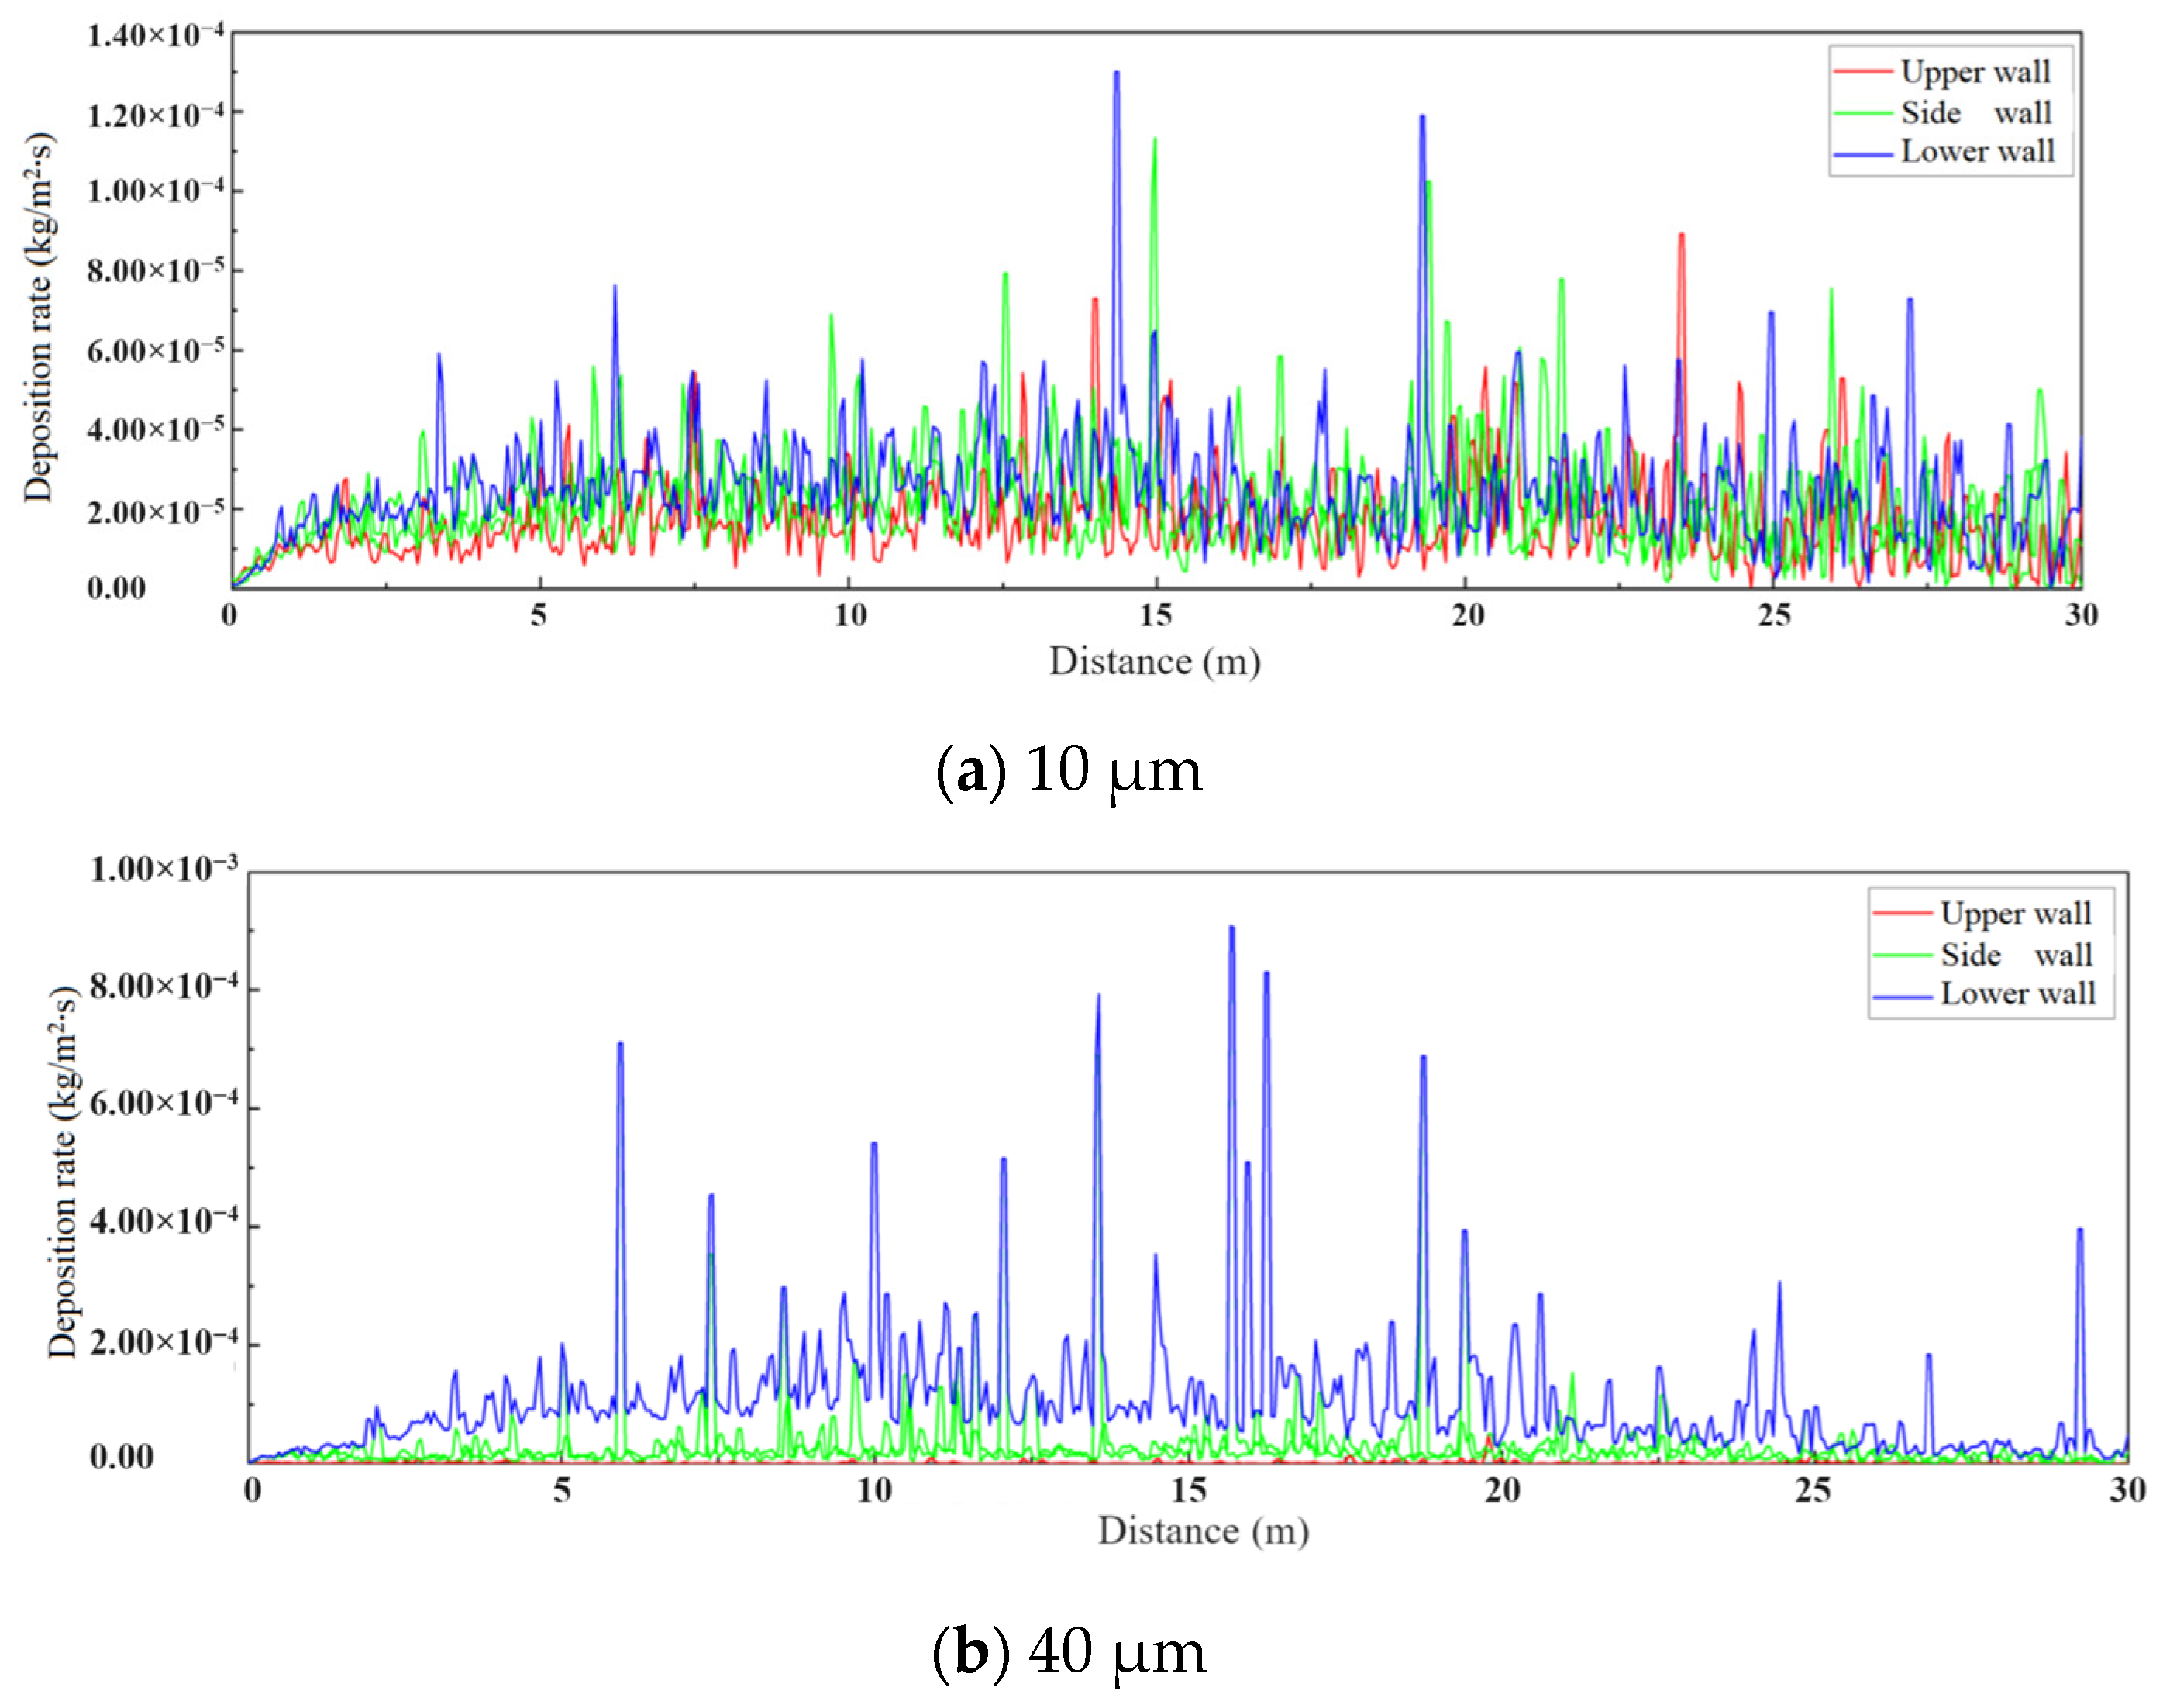
3.3.2. Particle Deposition of Simulation Results

In order to visually characterize the influence of particle size on deposition position, combined with the two-parameter probability deposition model proposed in this paper, the deposition position distribution of the particles is quantified by extracting the deposition mass per unit area recorded in the UDM, and the particle deposition efficiency results of each pipe wall in the gas transmission pipeline are expanded along the pipe length and characterized by a broken line diagram, as shown in Figure 7.
Figure 7a shows the particle deposition efficiency of the particles with a particle size of 10 μm on each pipe wall in the gas transmission pipeline. It can be seen that particle deposition occurs on all four wall surfaces, among which the total deposition efficiency of the lower wall is 6.07 × 10⁻⁴ kg/s, slightly higher than the average total deposition efficiency of the right wall and the left wall of 5.67 × 10⁻⁴ kg/s and that of the upper wall of 3.77 × 10⁻⁴ kg/s. However, there is no quantitative difference in particle deposition efficiency on each wall surface. The deposition efficiency of the 10 μm particles fluctuates slightly along the pipe length, and the maximum deposition interval is not significant. The above deposition rules are mainly due to the diffusion deposition mode of 10 μm particles; the difference in deposition rules on each wall surface is small, and the deposition positions are relatively scattered and random. The particle deposition efficiency of particles with a particle size of 40 μm on each pipe wall in the gas transmission pipeline is shown in Figure 7b, in which the deposition distribution is dominated by the lower wall, reaching 1.57 × 10⁻³ kg/s. The average total deposition efficiency of the right wall and the left wall is 3.63 × 10⁻⁴ kg/s, which is much higher than that of the upper wall (1.59 × 10⁻⁴ kg/s), and the maximum deposition interval is obvious. The sedimentation efficiency has a peak value in the region of 13 D~28 D (the sedimentation efficiency in this region exceeds the total sedimentation efficiency by 52.04%), which is mainly due to the sedimentation of 40 μm particles, mainly manifested by gravity sedimentation and inertia sedimentation. The sedimentation distribution law is obviously dominated by the lower wall region, and the sedimentation efficiency has a peak value in the region of 13~28 units in the aspect ratio of the gas transmission pipeline.
After entering the flow field, particles with a diameter of 10 μm are partially deposited with the airflow in the turbulent region where the flow field is not fully developed, and the velocity is lower than the critical deposition velocity of the law. The kinetic energy loss caused by the collision and rebound of the undeposited particles at the entrance of the square tube results in the particles reentering the flow field and accelerating, and then waiting for the next collision or being carried away by the fluid; the particles are deposited almost all over the channel. After entering the fluid, particles with a particle size of 40 μm mainly show inertial deposition and gravity deposition, and the deposition distribution is mainly on the lower wall surface, which is consistent with the particle concentration distribution law; after repeated collisions between undeposited particles and the wall surface, the critical deposition velocity gradually decreases, with kinetic energy to be adhered to the wall surface in the middle part of the pipeline, and the deposition efficiency peak appears, and the rest of the particles are accelerated again under the action of the fluid until they collide again and are captured by the wall surface to be deposited or overflow from the end of the pipeline.

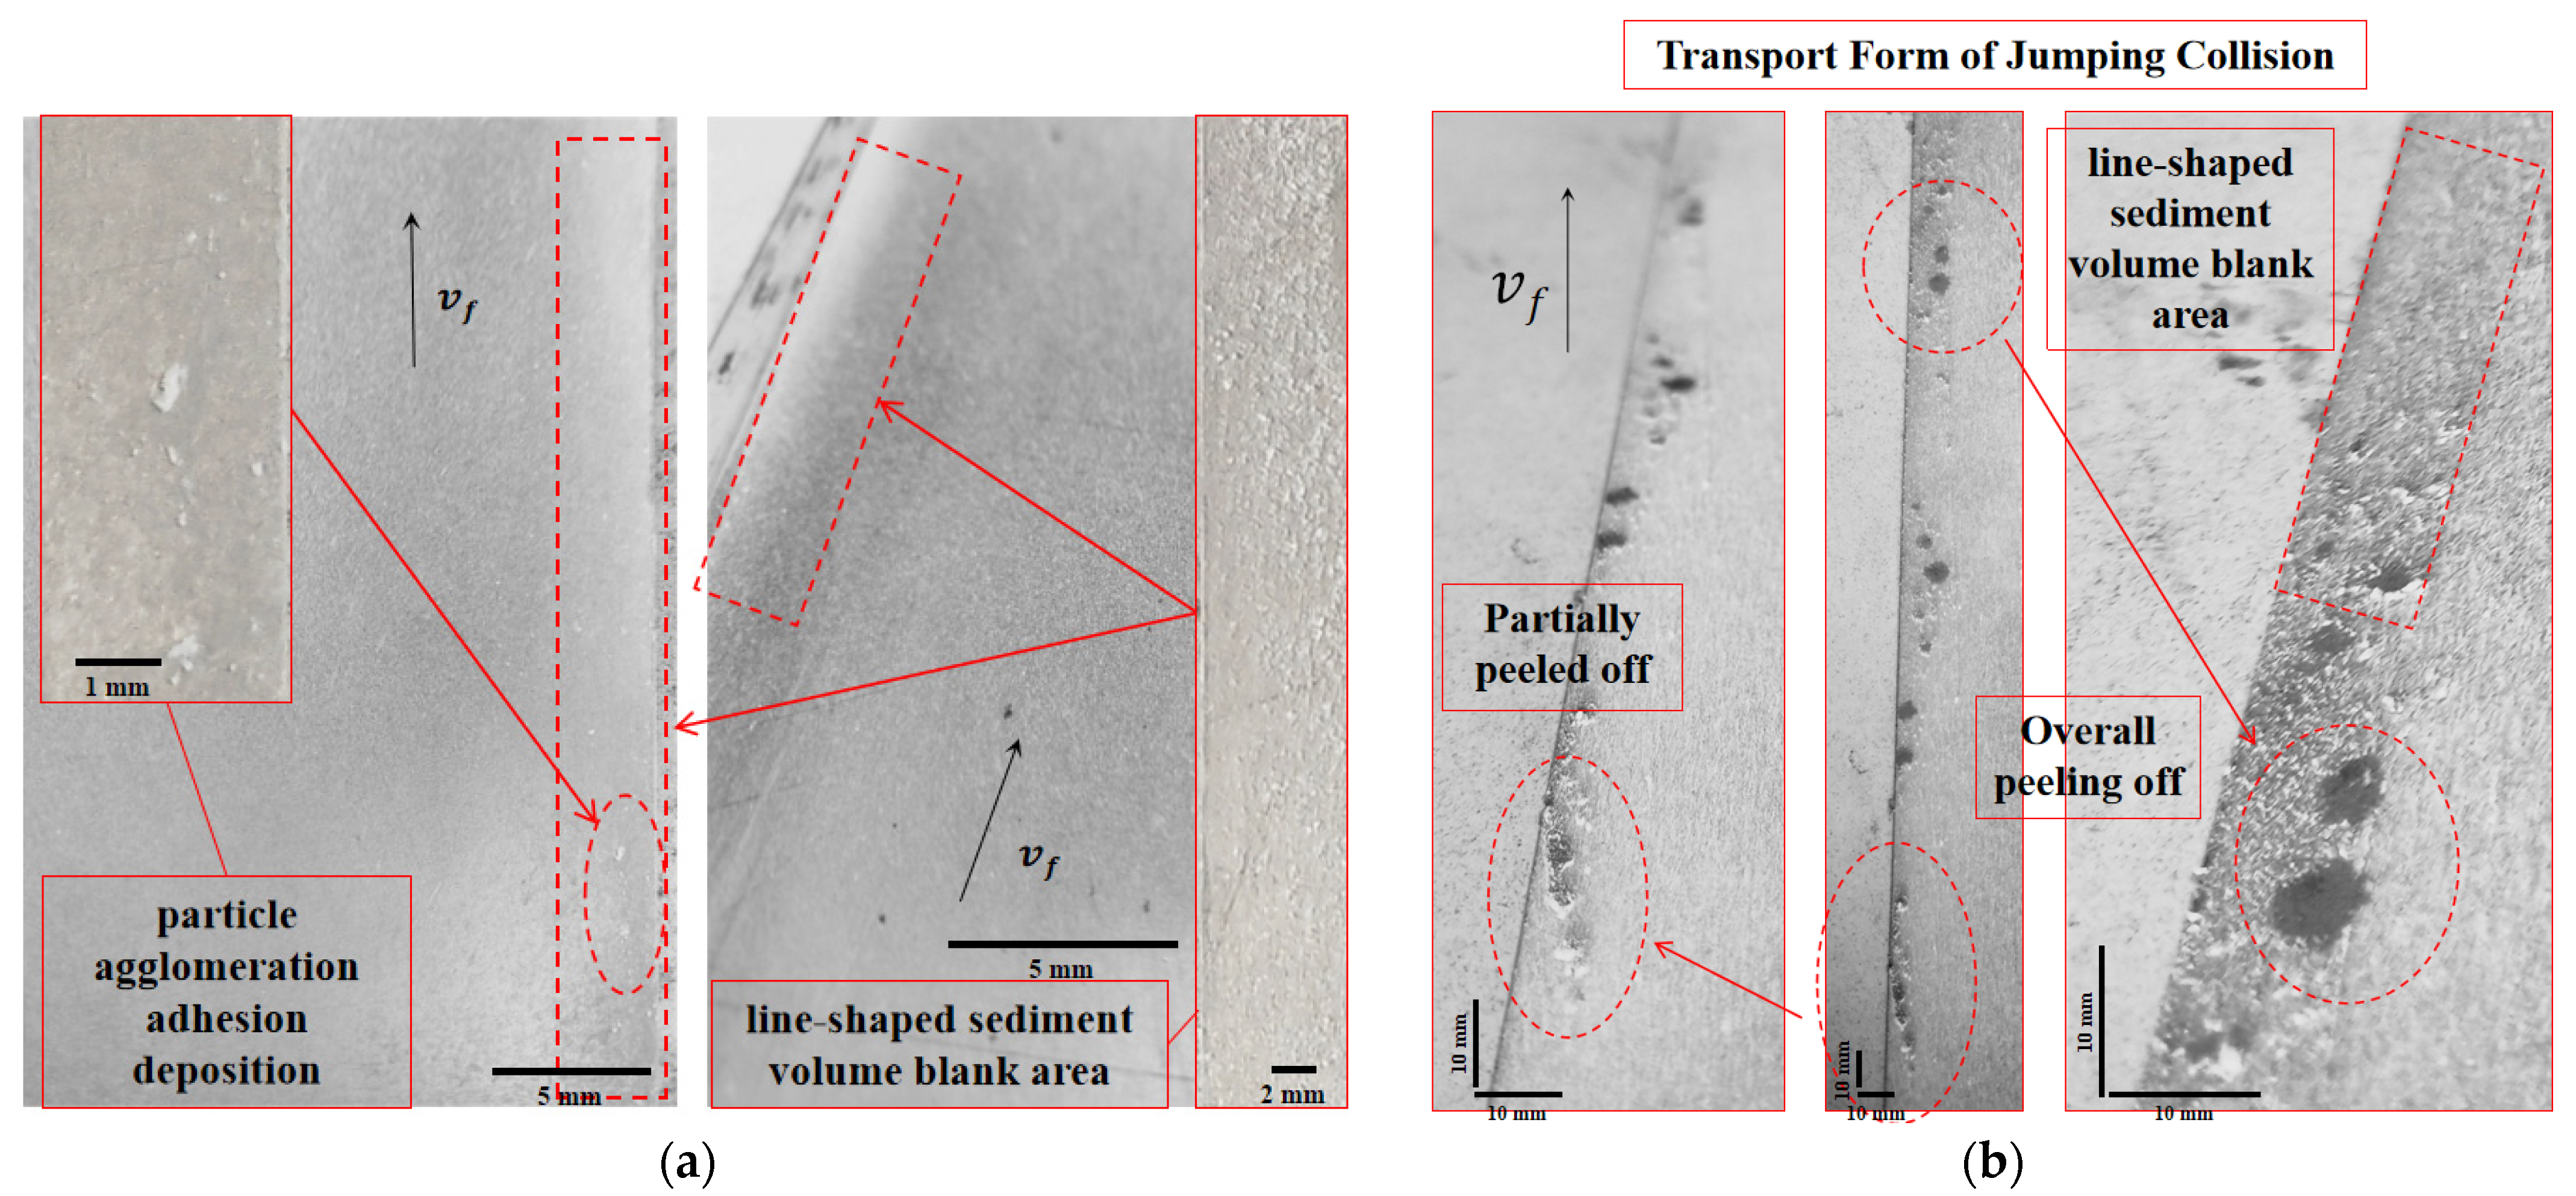
3.3.3. Particle Deposition Morphology of Test Results

In the particle migration and deposition test under 12 m/s wind speed conditions, the deposition conditions of two groups of 30 D particle-sampling plates on the lower, left, and right walls were obtained (because the hot-wire wind speed sensor probe was installed on the upper wall of the particle transport pipeline, a sampling plate could not be arranged).
Observe the overall deposition status of 10 µm silicon dioxide (SiO2) sample 1, as shown in Figure 8a; the deposition morphology of the three wall surfaces is streamlined, the particle deposition amount of the head-piece is higher than the end-piece, and the particle deposition at the angle between the left wall and the lower wall of the head-piece is lower, among which, the particle deposition amount of the lower wall is obviously higher than the left wall and the right wall; the head-piece particle deposition is obvious, accompanied by impact residue, flake peeling, and a sliding mark after the agglomeration of large-scale particles, and some deposition layers have an obvious thickness.
Observe the overall deposition condition of 40 µm silicon dioxide (SiO2) sample 2, as shown in Figure 8b; the deposition morphology of the three wall surfaces presents a streamlined shape, the particle deposition amount of the head-piece is higher than the end-piece, there is an obvious particle deposition low-density area at the angle between the left wall and the lower wall of the head-piece, the particle deposition amount of the lower wall is obviously higher than the left wall and the right wall, and the particle deposition rate is more significant.
The streamlined direction of particle deposition morphology is consistent with the flow field direction, and the particle deposition amount of the head-piece is higher than the end-piece, which can also be found in the experimental results of sample 1, which accords with the morphology characteristics of particle deposition under the action of single-phase air fluid. There is an obvious lower-density area of particle deposition at the angle between the left wall and the lower wall of the head-piece, which can also be found in the experimental results of sample 1, but it is more obvious in the experiment of sample 2, which indicates that the deposition phenomenon of sample 2 occurs more frequently under the same wind speed. Compared with sample 1, the deposition amount on the three walls increases to varying degrees. The particle deposition quantity of the lower wall is obviously higher than that of the left wall and right wall, and the particle deposition distribution is farther from the inlet, which indicates the deposition distribution form of sample 2 under a wind speed of 12 m/s. This is consistent with the law obtained by the numerical simulation that “the deposition distribution in gas transmission pipeline is mainly concentrated in the lower wall from Head-piece to Mid-piece, Left wall and Right wall near the lower wall, where the lower wall is the deposition interval with the largest area. This is mainly due to the increase of particle size, which changes the main deposition form of particles from the original diffusion deposition to gravity deposition and inertia deposition”.
The deposition morphology of particles on the lower wall is shown in Figure 9. Among them, sample 1 has a uniform spot deposition morphology as a whole, which conforms to the particle deposition law, as shown in Figure 9a. The particle spot deposition process is mainly due to the particle adhesion phenomenon in the process of impacting the wall surface, which may be caused by the large surface area of the particle or the high friction coefficient of the wall surface. After particle deposition, the appearance of the area exposed to the airflow transforms from a flat surface lacking particle deposition to a convex surface with a certain deposition thickness, causing the upstream morphology of the wall surface to change. The airflow velocity at the protrusion where sedimentation has occurred is greater than that at the flat area where sedimentation has not occurred, leading to a higher airflow velocity and lower pressure at the sedimentation site, while the flow velocity and pressure at the non-sedimentation site are relatively smaller and result in a pressure difference. Under this pressure difference, the airflow velocity near the wall follows the airflow path. Particles exhibit a tendency for movement from the undeposited flat area to the already deposited area, making them more prone to adhesive deposition, thereby intensifying the particle adhesion effect in the flow near the wall surface. At the same time, due to the increase in deposition thickness, the capture ability of sliding desorption particles without adhesive deposition on the wall surface is also improved, and such a change increases with the limited increase in the number of adhesive particles; the punctiform deposition presented by sample 2 is intensified into flake deposition, and the deposition appearance is different from the deposition thickness, as shown in Figure 9b, which can be understood as the consistency manifestation of punctiform deposition. Compared with the uniform spot deposition of sample 1, the deposition phenomenon of sample 2 is more obvious, and the boundary between the deposition flake area and the adjacent deposition low-density area is clear, showing the deposition appearance of particles “conformity”, which is related to the complex turbulence structure near the wall, the morphology specificity of the particles, the orientation of the particles during collision, and the roughness of the wall surface. However, in a mathematical characterization, particles tend to deposit more easily in an area with more deposited particles per unit area. This shows that the mathematical idea of introducing collision probability PP between the particles and the deposited particles into the particle transport model to adapt a collision criterion is correct. The phenomenon of the selective deposition of particles is not closely related to the influence of constant parameters such as wall roughness on deposition behavior, but more inclined to the description of the irregular turbulent structure near the wall and particle collision probability. The particle transport model characterization is consistent with the experimental simulation results.
It should be noted that the particle deposition morphology of sample 1 and sample 2 at the left wall and right wall near the lower wall of the mid-piece are observed, and there are linear deposition low-density areas and partial particle agglomeration adhesion deposition, as shown in Figure 10. The difference is that the boundary of the low-density area of linear deposition of sample 1 is relatively clear, and the spot deposition scale of some particles is relatively small, as shown in Figure 10a; meanwhile, the boundary of the low-density area of linear deposition of sample 2 is relatively blurry, and some particles are aggregated and adhere at similar positions, and the deposition scale is relatively large, and even flake deposition peeled-off and jump collision traces appear, as shown in Figure 10b.
For the left wall and the right wall, there is a low-density area of linear deposition near the lower wall; combined with the phenomenon of partial particle agglomeration and adhesion deposition in the low-density area, it can be shown that the flow velocity in this area is slower than that in other areas, which may be caused by two reasons: The first is that the flow field provided by the flow field generator has difficulty maintaining absolute uniformity, and the flow changes sharply at the interface. The other is that a low-velocity flow field will be formed due to the abrupt change in corner curvature in the square cross-section pipe of the particle transport. The above two reasons may also act simultaneously. Combined with the numerical simulation of particle migration and deposition, there are four triangular low-velocity regions at the four corners of the gas pipeline. In this region, particles with a smaller inertial force (sample 1) do not easily to enter and escape, so there are line-like low-density regions of deposition and partial particle agglomeration adhesion deposition. But particles with a larger inertia force (sample 2) find it easier to enter the low-velocity region and concentrated larger-scale sedimentation occurs, and then due to the complex turbulence in the region, incomplete desorption occurs, forming large-scale aggregated particles in the airflow; and then, due to the influence of irregular airflow near the wall, a continuous jumping impact occurs at the left wall during the migration process. Because the experiment failed to achieve high-speed camera capture, this paper can only give a guess as to the cause of formation; more rigorous interpretation is needed for later research.

3.3.4. Comparison of Simulation Results and Test Results

In order to measure the difference between the simulation results of the two-parameter particle probability deposition model and the experimental results, collect and weigh the sedimentary particles on the lower wall of sample 2 with a relatively obvious deposition in the experimental simulation, and compare them with the simulation results (comparison range: 0 D ≤ L ≤ 30 D), as shown in Figure 11. K is defined as the ratio of the mass of the bottom-deposited particles per unit length D to the total mass of the whole bottom-deposited particles, Ks is the simulation result, and Kt is the experimental simulation result.
It can be seen that there are peaks in both the experimental and simulation results, but the peak range of particle deposition efficiency (6 D~16 D) in the experimental simulation is more concentrated than that in the simulation results (13 D~28 D), and it is closer to the inlet of the gas transmission pipeline. The difference may be caused by the following two reasons: On the one hand, the particle collection system installed at the end of the particle migration and deposition simulation platform, using centrifugal fans to recover particles, may interfere with the wind speed field where particles migrate and deposit, resulting in a low deposition efficiency in the latter half of the particle migration and deposition pipeline. On the other hand, in order to improve experimental efficiency and obtain simulation results of the particle deposition law with a relatively large sample size, the mass of particles input should be higher than that of the clean gas transmission pipeline under actual working conditions, so that the samples after pretreatment may still be aggregated due to electrostatic force and van der Waals force, so that the peak range of particle deposition efficiency is closer to the gas transmission pipeline.

4. Conclusions

  • Combining a mathematical expression of the migration, collision, and deposition of micron particles in the gas pipeline with a simulation of the flow field, a two-parameter particle probability deposition model based on a collision probability coefficient is established, which can show the fouling characteristics of micron particles in the gas pipeline in detail, and an algorithm for the distribution of pollution particles considering the two deposition targets of the pipe wall and sediment layer is presented.
  • For 10 μm particles, deposition in the gas transmission pipeline is influenced by turbulent diffusion and presents spot deposition and a random deposition distribution law on each wall of the gas transmission pipeline; 40 μm particle deposition presents flake deposition and concentrates on the lower wall and the two side walls close to the lower wall; for the lower wall, the two-parameter particle probability deposition model simulated a peak deposition efficiency range of (13 D~28 D), and the peak deposition efficiency range of particles in the experimental simulation is (6 D~16 D), which is mainly caused by the difference in the wind field and test samples in the gas transmission pipeline simulation.
  • The proposed two-parameter particle probability deposition model is only based on the particle spherical hypothesis, which explores the migration and deposition characteristics of pollutant particles in a long direct gas pipeline, and it still has a large room for improvement in the analysis object and background conditions.
  • In the future, based on this model, the deposition law of mixed material and particle-size composite pollution particles under different gas pipeline backgrounds can be explored, and reference suggestions for the gas pipeline selection of different main pollution particles can be given. At the same time, the influence of pipe length, pipe type, and pipe material on the deposition characteristics of composite pollutants can be further studied by simulation and experiment, and optimization suggestions for a standard gas transmission pipeline in different environments are given.

Author Contributions

Conceptualization, C.N. and Z.Z.; methodology, C.N.; software, C.N. and J.Q.; validation, C.N., X.Y. and Z.Z.; formal analysis, C.N.; investigation, J.Q.; resources, Z.Z.; data curation, C.N.; writing—original draft preparation, C.N.; writing—review and editing, C.N. and J.Q.; visualization, X.Y.; supervision, J.Q.; project administration, J.Q.; funding acquisition, Z.Z. All authors have read and agreed to the published version of the manuscript.

Funding

This research received no external funding.

Institutional Review Board Statement

Not applicable.

Informed Consent Statement

Not applicable.

Data Availability Statement

Laboratory data will not be uploaded to the database for the time being. If necessary, please email the corresponding author for consultation.

Conflicts of Interest

The authors declare no conflicts of interest.

References

  1. Neauport, J.; Cormont, P.; Lamaignère, L.; Ambard, C.; Pilon, F.; Bercegol, H. Concerning the impact of polishing induced contamination of fused silica optics on the laser-induced damage density at 351 nm. Opt. Commun. 2008, 281, 3802–3805. [Google Scholar] [CrossRef]
  2. Ling, X.; Wang, G.; Zhao, Y.; Liu, X.; Shao, J. Laser-induced damage of the optical coatings due to organic contamination in vacuum. Appl. Surf. Sci. 2013, 270, 346–351. [Google Scholar] [CrossRef]
  3. Cheng, X.; Miao, X.; Wang, H.; Qin, L.; Ye, Y.; He, Q.; Ma, Z.; Zhao, L.; He, S. Surface Contaminant Control Technologies to Improve Laser Damage Resistance of Optics. Adv. Condens. Matter Phys. 2014, 2014, 974245. [Google Scholar] [CrossRef]
  4. Zhang, X.; Zheng, W.; Wei, X.; Jing, F.; Sui, Z.; Su, J.; Li, M.; Zhu, Q.; Peng, Z.; He, S.; et al. Preliminary Experimental Results of Shenguang III Technical Integration Experiment Line. In High-Power Lasers and Applications III; SPIE: Bellingham, WA, USA, 2005. [Google Scholar]
  5. Jiang, W.; Cho, M.K.; Wu, F.; Wang, M.; Wang, B.; Miao, X.; Cheng, X.; Wu, W. Status of cleanliness maintaining in target beam enclosures in SG III facilities and contamination sources analysis. In 7th International Symposium on Advanced Optical Manufacturing and Testing Technologies: Large Mirrors and Telescopes; SPIE: Bellingham, WA, USA, 2014. [Google Scholar]
  6. Wei, C.; Wang, Y.; Qiu, Y.; Guo, X. Influence of the Sphericity Coefficient on the Deposition Characteristics of Aerosol Particles on the Surface of Photovoltaic (PV) Modules: Numerical Simulation. Appl. Sci. 2023, 13, 8658. [Google Scholar] [CrossRef]
  7. Aharoni, H.; Ohmi, T.; Oka, M.M.; Nakada, A.; Tamai, Y. Analysis of n + p silicon junctions with varying substrate doping concentrations made under ultraclean processing technology. J. Appl. Phys. 1997, 81, 1270–1288. [Google Scholar] [CrossRef]
  8. Niu, L.; Liu, H.; Miao, X.; Lv, H.; Yuan, X.; Zhou, H.; Yao, C.; Zhou, G.; Li, Q. Cleaning mechanism of particle contaminants on large aperture optical components by using air knife sweeping technology. In Fourth International Symposium on Laser Interaction with Matter; SPIE: Bellingham, WA, USA, 2017. [Google Scholar]
  9. Den, W.; Bai, H.; Kang, Y. Organic airborne molecular contamination in semiconductor fabrication clean rooms: A review. J. Electrochem. Soc. 2006, 153, G149. [Google Scholar] [CrossRef]
  10. Sawamura, F.; Ngu, C.Y.; Hanazaki, R.; Kozuki, K.; Kado, S.; Sakai, M.; Kudo, K. Dry Printing of Ag–Ni Conductive Particles Using Toner-Type Printed Electronics. Appl. Sci. 2022, 12, 9616. [Google Scholar] [CrossRef]
  11. Choi, K.-M.; Lee, J.-E.; Cho, K.-Y.; Kim, K.-S.; Cho, S.-H. Clean Room Structure, Air Conditioning and Contamination Control Systems in the Semiconductor Fabrication Process. J. Korean Soc. Occup. Environ. Hyg. 2015, 25, 202–210. [Google Scholar] [CrossRef]
  12. Straka, S.A.; Olson, K.R.; Folgner, K.A.; Ternet, G.K. Effects of vacuum-ultraviolet radiation on the desorption of molecular contaminants. In Optical System Contamination: Effects, Measurements, and Control; SPIE: Bellingham, WA, USA, 2008. [Google Scholar]
  13. Lignier, H.; Picard, E.; Dubois, S. Controlling surface contamination issues in the fabrication environment of high efficiency crystalline silicon-based homojunction solar cells. Energy Procedia 2017, 124, 745–751. [Google Scholar] [CrossRef]
  14. Volkov, A.G.; Dyugaeva, N.A.; Kuvyrkin, G.N.; Morozov, A.N. Studying the change in characteristics of optical surfaces of a spacecraft. Cosm. Res. 2017, 55, 124–127. [Google Scholar] [CrossRef]
  15. Baur, S.D. Cleaning of Operating Rooms as Factor Affecting Clean Room Products. Pharm. Ind. 2010, 72, 1077–1080. [Google Scholar]
  16. Baxter, R.; Baxter, H.; Campbell, G.; Grant, K.; Jones, A.; Richardson, P.; Whittaker, G. Quantitative analysis of residual protein contamination on reprocessed surgical instruments. J. Hosp. Infect. 2006, 63, 439–444. [Google Scholar] [CrossRef] [PubMed]
  17. Li, A.; Ahmadi, G. Deposition of aerosols on surfaces in a turbulent channel flow. Int. J. Eng. Sci. 1993, 31, 435–451. [Google Scholar] [CrossRef]
  18. Uijttewaal, W.S.J.; Oliemans, R.V.A. Particle dispersion and deposition in direct numerical and large eddy simulations of vertical pipe flows. Phys. Fluids 1996, 8, 2590–2604. [Google Scholar] [CrossRef]
  19. Brooke, J.W.; Kontomaris, K.; Hanratty, T.J.; McLaughlin, J.B. Turbulent deposition and trapping of aerosols at a wall. Phys. Fluids A Fluid Dyn. 1992, 4, 825–834. [Google Scholar] [CrossRef]
  20. Brooke, J.W.; Hanratty, T.J.; McLaughlin, J.B. Free-flight mixing and deposition of aerosols. Phys. Fluids 1994, 6, 3404–3415. [Google Scholar] [CrossRef]
  21. Chen, M.; McLaughlin, J.B. A new correlation for the aerosol deposition rate in vertical ducts. J Colloid Interface Sci. 1995, 169, 437–455. [Google Scholar] [CrossRef]
  22. Mao, S.; Zhou, T.; Liao, Y.; Tang, J.; Liu, X. Particle deposition characteristics of supercritical CO2 in different ribbed tubes. J. Colloid Interface Sci. 2023, 193, 1115–1121. [Google Scholar]
  23. Sun, J.; Cui, X.; Xu, Z.; Jia, Y.; Wang, J. Molecular Dynamics Simulation of the Deposition Characteristics MgO Particles and Calcium Carbonate Composite Fouling on Copper Heat Transfer Surfaces. Proc. CSEE 2023, 193, 2311–2318. [Google Scholar]
  24. Yang, J.-H.; Gao, M.; Wang, D.-M.; Dong, W.-H.; Zuo, Q.-R. Lattice Boltzmann simulation of the effect for adding a ghost fluid layer on the simulation accuracy of a sessile droplet on a heated surface. Int. J. Therm. Sci. 2023, 193, 108525. [Google Scholar] [CrossRef]
  25. Jia, X.; Gan, M.; Williams, R.; Rhodes, D. Validation of a digital packing algorithm in predicting powder packing densities. Powder Technol. 2007, 174, 10–13. [Google Scholar] [CrossRef]
  26. Sehmel, G.A. particle velocities eddy diffusivities and deposition for isothermal flow and smooth surfaces. Aerosol Sci. 1973, 4, 125–138. [Google Scholar] [CrossRef]
  27. Zhang, Z.; Qiao, X.; Yang, S.; Jiang, X. Non-Uniform Distribution of Contamination on Composite Insulators in HVDC Transmission Lines. Appl. Sci. 2018, 8, 1962. [Google Scholar] [CrossRef]
  28. Piskunov, V. Parameterization of aerosol dry deposition velocities onto smooth and rough surfaces. J. Aerosol Sci. 2009, 40, 664–679. [Google Scholar] [CrossRef]
  29. Rining, D.; Jiejin, C. Experimental Study of Flow Boiling in Layer-by-layer Deposition of SiO2 to Simulate CRUD Layer on Surface of Fuel Cladding. At. Energy Sci. Technol. 2023, 57, 1911–1917. [Google Scholar]
  30. Yakhot, V.; Orszag, S.A. Renormalization group analysis of turbulence. I. Basic theory. J. Sci. Comput. 1986, 1, 13–51. [Google Scholar] [CrossRef]
  31. O’Neill, M. A sphere in contact with a plane wall in a slow linear shear flow. Chem. Eng. Sci. 1968, 23, 1293–1298. [Google Scholar] [CrossRef]
  32. Saffman, P.G. The lift on a small sphere in a slow shear flow. J. Fluid Mech. 1965, 22, 385–400. [Google Scholar] [CrossRef]
  33. Chen, H.; Ding, W.; Wei, H.; Saxén, H.; Yu, Y. A Coupled CFD-DEM Study on the Effect of Basset Force Aimed at the Motion of a Single Bubble. Materials 2022, 15, 5461. [Google Scholar] [CrossRef]
  34. Clift, R.; Gauvin, W.H. Motion of entrained particles in gas streams. Can. J. Chem. Eng. 1971, 49, 439–448. [Google Scholar] [CrossRef]
  35. Zhan, F.; Zhuang, D.; Ding, G.; Tang, J. Numerical model of particle deposition on fin surface of heat exchanger. Int. J. Refrig. 2016, 72, 27–40. [Google Scholar] [CrossRef]
  36. A Siegel, J.; Nazaroff, W.W. Predicting particle deposition on HVAC heat exchangers. Atmos. Environ. 2003, 37, 5587–5596. [Google Scholar] [CrossRef]
  37. Derjaguin, B.; Landau, L. Theory of the stability of strongly charged lyophobic sols and of the adhesion of strongly charged particles in solutions of electrolytes. Acta Phys. Chim. Sin. URSS 1941, 14, 662–663. [Google Scholar] [CrossRef]
  38. Tomeczek, J.; Wacławiak, K. Two-dimensional modeling of deposits formation on platen superheaters. Fuel 2009, 88, 1466–1471. [Google Scholar] [CrossRef]
  39. Konstandopoulos, A.G. Particle sticking/rebound criteria at oblique impact. J. Aerosol Sci. 2006, 37, 292–305. [Google Scholar] [CrossRef]
Figure 1. Particle–wall collision escape process. (a) Particulate deposition; (b) particle rebound desorption.
Applsci 14 06200 g001
Figure 2. Particle–wall collision deformation process. (a) Elastic deformation of particles; (b) elastic–plastic deformation of particles occurs; (c) plastic deformation of particles.
Applsci 14 06200 g002
Figure 3. Particles–sedimentary particles collision escape process. (a) Particulate deposition; (b) particle rebound desorption.
Applsci 14 06200 g003
Figure 4. Calculation flow chart of spherical particle migration model in flow field.
Applsci 14 06200 g004
Figure 5. Experimental platform for particle migration and deposition simulation. 1—Flow field generator; 2—particle disperser; 3–particle sedimentation migration pipeline; 4—particle collection system; 5—multi-channel data acquisition controller.
Applsci 14 06200 g005
Figure 6. Cloud map of particle concentration distribution of gas pipeline at 12 m/s wind speed. (a) Cloud map of 10 µm particle concentration distribution. (b) Cloud map of 10 µm particle concentration distribution at Y = 25 D cross-section. (c) Partial enlarged cloud view of (b). (d) Cloud map of 40 µm particle concentration distribution. (e) Cloud map of 40 µm particle concentration distribution at Y = 25 D cross-section. (f) Partial enlarged cloud view of (e).
Applsci 14 06200 g006
Figure 7. Simulation results of particle deposition in gas pipelines at 12 m/s wind speed. (a) 10 µm; (b) 40 µm.
Applsci 14 06200 g007
Figure 8. Experimental collection of particle transport at 12 m/s wind speed. (a) 10 µm; (b) 40 µm.
Applsci 14 06200 g008
Figure 9. Lower wall deposition diagram of samples. (a) Spot deposition of sample 1; (b) flake deposition of sample 2.
Applsci 14 06200 g009
Figure 10. Deposition diagram near lower wall of sample 1 and sample 2. (a) Clear boundary of lower-density area, small-scale spot deposition of sample 1; (b) blurred boundary of lower-density area, flake deposition peeled off, and jump collision transport form of sample 2.
Applsci 14 06200 g010
Figure 11. Scatter plot comparing simulation results and experimental results of lower wall particle deposition for sample 2.
Applsci 14 06200 g011
Table 1. Sample parameters.
Sample NumberNameSizeCompositionPurityDensityProduct Batch
Number
1Spherical silica
particles
10 μmSiO29.99%2.32 g/cm3KG-24
2Spherical silica
particles
40 μmSiO29.99%2.32 g/cm3KG-22
Disclaimer/Publisher’s Note: The statements, opinions and data contained in all publications are solely those of the individual author(s) and contributor(s) and not of MDPI and/or the editor(s). MDPI and/or the editor(s) disclaim responsibility for any injury to people or property resulting from any ideas, methods, instructions or products referred to in the content.

