Abstract
Most airport surface surveillance systems focus on monitoring and commanding cooperative objects (vehicles) while neglecting the location and detection of non-cooperative objects (humans). Abnormal behavior by non-cooperative objects poses a potential threat to airport security. This study collects surveillance video data from civil aviation airports in several regions of China, and a non-cooperative abnormal behavior localization and detection framework (NC-ABLD) is established. As the focus of this paper, the proposed framework seamlessly integrates a multi-scale non-cooperative object localization module, a human keypoint detection module, and a behavioral classification module. The framework uses a serial structure, with multiple modules working in concert to achieve precise position, human keypoints, and behavioral classification of non-cooperative objects in the airport field. In addition, since there is no publicly available rich dataset of airport aprons, we propose a dataset called IIAR-30, which consists of 1736 images of airport surfaces and 506 video clips in six frequently occurring behavioral categories. The results of experiments conducted on the IIAR-30 dataset show that the framework performs well compared to mainstream behavior recognition methods and achieves fine-grained localization and refined class detection of typical non-cooperative human abnormal behavior on airport apron surfaces.
1. Introduction
As airports continue to grow in size, accidents occurring on airport surfaces have accounted for 90 percent of civil aviation accidents for the past 20 years [1]. The operational safety of airport surfaces is the core of civil aviation safety. However, due to the imperfection of surveillance facilities, trespassing into restricted airport areas and unlawful interference with airport orders occur from time to time [2]. Therefore, real-time and robust surveillance of individual targets on the airport surface, especially around the fuselage, is essential. Existing airport surface surveillance technologies can be divided into two categories: cooperative and non-cooperative surveillance.
The cooperative surveillance systems must install radio transponders on the surveillance objects [3]. This results in the monitoring of fixed targets only and poor flexibility. The non-cooperative surveillance techniques provide only the distance and location of the target [4]. This results in limited information and higher costs. In contrast, video surveillance systems have several advantages, including their low investment cost, wide monitoring range, automation, and intelligent analysis [5].
Current video surveillance devices can usually only capture and save video images, with insufficient capabilities for more advanced functions and intelligent analyses [6]. Only after a hazardous event has occurred can the saved surveillance video be analyzed manually to understand the details and process of the event. This approach is prone to response delays when dealing with sudden hazardous events. This makes it difficult to obtain information for decision-making in real time [7]. Therefore, there is an urgent need to design an airport surface terminal surveillance system that can autonomously analyze the behavior of humans moving on the airport surface based on captured video sequences in real time [8].
As shown in Figure 1, typical non-cooperative objects in airport scenes are small in size in surveillance videos. This makes it difficult to accurately capture the detailed characteristics of this target. At the same time, special vehicles and aircrafts moving across the airport field can also obscure typical non-cooperative objects [9]. The first core task of this research is to build an intelligent surveillance framework that integrates modules for target detection, human keypoint detection, and behavioral classification to address these problems.
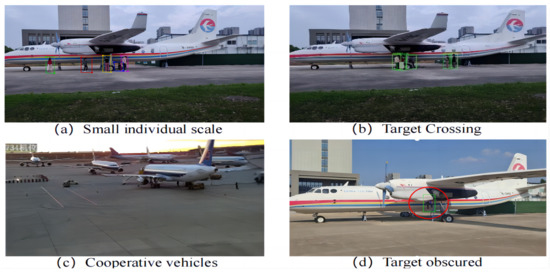
Figure 1.
Disturbance of non-cooperative subjects in airport scenes. (a) Small individual scale. (b) Individual targets are obscured each other. (c) Cooperative vehicles. (d) Individual targets are obscured by cooperative vehicles.
The non-cooperative object detection module builds on the collaborative processing of multiple telephoto auto-zoom lenses. The overall detection task can be viewed as a two-stage “coarse to fine” process.
The first stage is regular surveillance. The surveillance camera maintains a wide-angle model to monitor the apron area in all directions. The initial target detection is for all the people within the surveillance area. When a suspicious person is detected entering the apron area, the surveillance camera will be switched to the telephoto model autonomously to reduce the coverage of the surveillance area and to pay close attention to the targets within the local surveillance area.
In the second stage, with the multi-scale non-cooperative object localization mode, we can capture the behavioral details of this part of the target and overcome the effects of factors such as lighting and target texture. This module uses deep learning [10] for precise target localization and behavioral recognition to extract the key features of the target. At the same time, the module uses adaptive feature extraction and correction techniques for problems such as lighting and target texture changes to ensure an accurate analysis of the target behavior.
Through this multi-stage surveillance and analysis process, the problem of scale inconsistency in airport surface surveillance images caused by the distance and angle of surveillance cameras can be overcome. Moreover, a multi-stage framework can provide a comprehensive understanding and analysis of the behavioral details of non-cooperative objects, providing more reliable support for airport security management and risk identification. Notably, in the second stage, we use keypoints to construct a human skeleton that characterizes different behavioral categories. Unlike the classification of behaviors based on pixel features, the keypoint representations are more abstract and high-level, focusing on the pose and movement characteristics of the human body. It can ignore background information and focus on the movements of the human body itself. The main contributions of this paper are summarized as follows:
(1) A coarse-to-fine two-stage framework, NC-ABLD, is proposed for locating and detecting abnormal behaviors of typical non-cooperative subjects in airport aprons, enabling categories of abnormal behaviors and the range of duration in the time dimension.
(2) In the first stage, a dynamic target detection strategy is designed to mitigate the problem of inconsistent target scales due to the varying proximity of the person to the camera, which reduces the detection accuracy.
(3) In the second stage, based on the extracted target features of non-cooperative objects, a behavioral recognition module and a duration range localization strategy for abnormal behaviors are designed to solve the problematic recognition problem of sudden abnormal behaviors of non-cooperative objects.
2. Related Works
This section briefly describes three topics related to the research in this paper: airport scene surveillance, human keypoint detection, and behavioral recognition.
2.1. Airport Scene Surveillance
As the demand for security technology at airport surfaces continues to increase, Surface monitoring and control systems (SMGCS) have emerged and become the core equipment for safe and efficient operations at major airports worldwide. Currently, the mainstream surface monitoring system installed in most large airports at home and abroad is the Advanced Surface Movement Guidance and Control System (A-SMGCS), which combines ADS-B, MLAT, and SMR. This system combines surveillance techniques. Still, it relies on sending information such as the velocity and position of the acquired surveillance target to a surveillance center. This system could be more efficient as the field structure becomes more complex and digitized information increases.
In recent years, a low-cost, video-based field surveillance technology has emerged and gradually replaced expensive radar-based surveillance systems. It is mainly implemented through the arrangement of multiple omnidirectional cameras to collect the visible video in the field. Using machine vision for real-time detection of the captured video, we can obtain the real-time trajectory of the target, enabling more efficient monitoring of the field. The INTERFACE and AVITRACK, developed by the European Union at the beginning of the 21st century, are the first generation of airport surface surveillance systems [11]. These methods enable the detection, identification, and tracking of aircrafts, vehicles, and people, as well as their movements on the ramp, and they output the corresponding bounding boxes. However, they are not capable of human behavior recognition and anomaly localization. For small passenger airports located in remote areas, due to the visual blindness of traditional towers nearby, Sweden’s SAAB Group put the first remote tower system into use at airports in 2015, which puts video images of all critical areas on a panoramic high-definition large screen in the remote control center through cameras in real-time. It combines visual image technology and radar data to display a variety of information synchronously. This field surveillance system improves the efficiency of the monitoring work. Still, it cannot make more intelligent judgments on the behaviors of non-cooperative targets.
2.2. Human Keypoint Detection
A 2D skeleton map of the human body is formed by obtaining the 2D coordinates of the human keypoints through the human keypoint detection algorithm and connecting them according to the structural features of the human skeleton, thus forming the structure of the skeleton map of the human body [12]. In deep learning, the human keypoint detection task is divided into single human keypoins detection [13,14,15] and multiple human keypoint detection [16,17]. Currently, the most commonly used methods of human keypoint detection are based on deep learning. In deep learning-based methods, the regression method of human keypoints directly impacts the effectiveness of human keypoint detection. Two regression methods exist for human keypoint detection: coordinate regression and heat map regression.
The first method that introduced deep neural networks (DNNs) to human keypoint detection in 2014 was DeepPose [18], which is a direct regression coordinate model that applies a cascaded CNN structure to regress the coordinate values of human skeleton points forcibly. This model, which mimics the detection of critical points on the face, does not apply to the detection of the human skeleton, as it changes constantly with movement and posture. To address the disadvantages of this model, in the same year, Tompson et al. [19] proposed a method called Joint-CNN-MRF, which combines a CNN with the Markov random field and innovatively uses a decoding heatmap to obtain the positions and categories of human keypoints. This achieves higher accuracy and proves that the heatmap-based approach performs better than the direct regression approach. However, in some cases, the single-person pose estimation algorithm may output vague or inaccurate pose estimation results due to the limitations of image quality, pose angle, or other factors.
Furthermore, human keypoint detection methods can be classified into two types according to the architecture of the network: top-down and bottom-up human keypoint detection algorithms. In 2016, Iqbal et al. [20] first proposed a top-down skeleton point detection algorithm that constructs a full connectivity graph based on the human body connectivity edges and then uses an integer linear program (ILP) to obtain the optimal connections. It can handle the case of the human body being occluded or truncated. Since then, due to the more rapid and mature development of human body detectors, most scholars have focused on the algorithmic innovation of a single human skeleton point, represented by SimpleBaseline and HRNet, in which SimpleBaseline constructs a simple and effective skeleton point detection model by adding an inverse convolution module at the end of ResNet. At the same time, HRNet designs an advanced feature extraction network based on parallel multi-resolution subnets, which can maintain high-resolution output and achieve ultra-high-accuracy skeleton point recognition. However, when human keypoints are obscured, the accuracy of human keypoint detection is reduced greatly.
2.3. Behavioral Recognition
Existing behavioral recognition research [21] has been explored and developed by various feature representation modalities such as RGB frames, optical flow, audio waves, and human skeletons. Among these modes, human skeleton-based action recognition has received attention from a wide range of researchers due to its better focus on the structure of the human body and its ability to capture movement details. A group of researchers built 2D convolutional neural networks to detect human key points and skeleton information for 2D human pose estimation to perform the action recognition task. Duan et al. [22] proposed a new representation of human motion, i.e., a dynamic encoder used to generate fixed-size representations from the heat maps of these body joints. Lu et al. [23] proposed a single-stage pose estimation framework, RTMO, which can be used for human action recognition by using a single-stage pose estimation framework in the YOLO architecture using dual one-dimensional heat map representations of crucial points to integrate coordinate classification for action recognition seamlessly. These approaches only consider spatial information and cannot directly model temporal action sequence videos. As a result, several researchers have started to turn their attention to 3D convolutional neural networks for video action recognition tasks. 3D-CNN is a natural extension of 2D-CNN for spatial feature learning in the temporal dimension. Hua et al. [24] proposed an attention-based comparative learning framework for skeleton representation learning called SkeAttnCLR, which integrates skeleton-based local similarities and the global features of action representations. Liu et al. [25] proposed a deeply supervised encoder distillation (DSED) network for keypoint detection and proposed a skeleton-guided human shape fitting (SSF) approach to implement explicit occlusion action inference. Although these state-of-the-art action recognition methods based on pose estimation perform well in terms of detection performance, they still need to be thoroughly investigated for the precise identification and duration localization of abnormal behaviors.
3. Method
3.1. Overview
As shown in Figure 2, the proposed framework is composed of two stages: multi-scale non-cooperative human object location and matching and human keypoint detection and behavioral classification.
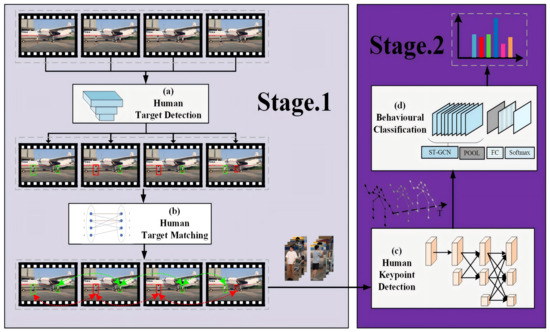
Figure 2.
Two-stage framework for behavioral recognition of non-cooperative human objects on the airport apron. (a) Human target detection. (b) Human target matching. (c) Human keypoint detection. (d) Behavioral classification.
3.2. Multi-Scale Non-Cooperative Human Object Location and Matching
3.2.1. Improving YOLOX-s Localization Accuracy for Small Targets Using ECA
The sub-module of non-cooperative object localization detects the position of the human body in the image. It outputs the corresponding bounding box and their coordinates of the human body’s 2D coordinate in the image area. YOLOX-s [26] is chosen as the base target detector, and the attention mechanism is introduced to determine the location of the small human body in the airport field surveillance area.
As shown in Figure 3, the backbone network of YOLOX-s uses CSPDarknet as its primary structure, and CSP modules are used in each residual structure to achieve fast dimensionality reduction. The input three-channel single-frame image is spatially spliced to form a composite image. The composite image is passed to the CBS module for image feature preprocessing. The Resblock5 has a residual structure [27] and is the backbone for feature map generation. Resblock5 outputs the number of feature channels up to 768. An ECA attention [28] mechanism is connected after the output of Resblock5 to capture cross-channel interactions. The feature maps improved by the ECA model are inputted into FPN to fuse multi-scale feature representation [29,30].
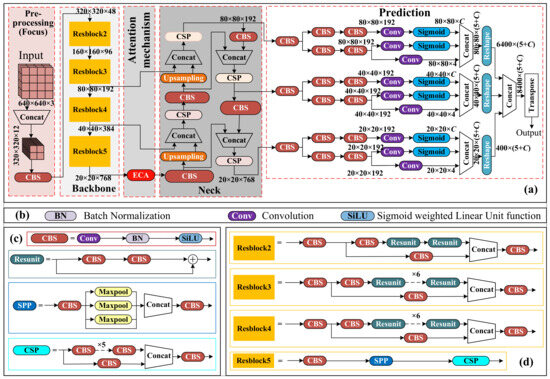
Figure 3.
Improvements in the detailed structure of the YOLOX-s network. (a) Improved YOLOX-s main network structure. (b) Introduction of main module names. (c) Internal structure of the main modules. (d) Specific details of the 4-layer residual structure.
In the process, the third, fourth and fifth tandem modules each generate an additional branch. These extra branches generate additional feature representations for input into the neck network. The neck network fully aggregates semantic entity information and robust localization information. The prediction module outputs information about the location of the prediction box, the category confidence, and other relevant target attributes.
The ECA module is a local cross-channel interaction strategy without dimensionality reduction. Suppose the output of a Resblock is , where , and s are the width, height, and channel dimensions, respectively. is the feature map of the i-th channel. Feature aggregation is achieved by adopting global average pooling to generate a vector , where the n-th element is calculated as follows:
The structure of the ECA module is shown in Figure 4. The ECA module allows all channels to share the weight information. The vector is the output obtained by convolving C in one dimension and then feeding it into the sigmoid function. ECA proposes an idea of adaptively generating the convolution kernel size according to the number of channels, which is calculated as shown in Formula (2).
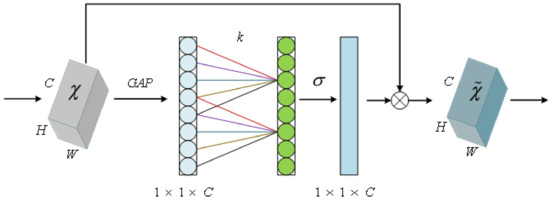
Figure 4.
Structure of channel attention module ECA.
3.2.2. Multi-Frame Human Target Matching Strategy
Human target matching aims to associate identities to specific targets after localization between temporal neighboring frames in a video. The whole process can be divided into two subtasks: prediction and matching.
As shown in Figure 5, a Kalman filter [31] is introduced to predict the location of the target appearing in the frame k according to the target-related parameters captured in frame . If the target in frame k can be successfully detected, the target information detected in frame is associated with the target information in frame k.
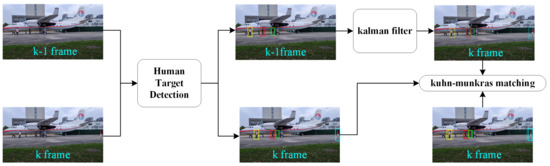
Figure 5.
Multi-frame human target matching strategy.
State feature vector X is as in Formula (3), where u and v denote the horizontal and vertical coordinates of the centroid of each detection target, s and r denote the size and aspect ratio of the bounding box area of the detection target, and , , and represent the velocity components of the centroid coordinates as well as the speed of change of the bounding box area. The motion of the human body in the video is considered as a uniform motion with time interval 1. The relationship between the state variables in the k and frame can be expressed as shown in Formula (4). The a priori estimated equation of state and observation equations are established on this basis, as shown in Formula (5). and are the state values at the current moment versus the previous moment. A and B are the state transfer matrix and the input modulation matrix. and are the system noise and observation noise at moment k, respectively. The coordinates of the position of the center point can be obtained as the distance between the target and the observation point, denoted as the observation matrix H.
The Kuhn–Munkres algorithm [32] is introduced to complete the matching task. It is done by calculating the IoU value and cosine similarity of the same target between neighboring video frames to create a cost matrix.
3.3. Human Keypoint Detection
The first stage achieved multi-scale non-cooperative human object locations and matching. The matched single human target is cropped out of the original video frame and fed into human keypoint detection. The HRNet-w32 [33] network is used to extract specific keypoint features from the human target. A convolutional layer is added to the last layer of the HRNet-w32 output to handle the prediction of the location of each keypoint. By using the regression method of heat maps, the predicted keypoint locations can be mapped back onto the original image to gain the exact locations of the keypoints in the image.
As shown in Figure 6, HRNet-w32 is a four-stage network consisting of one high-resolution main branch with the highest resolution and three high-to-low resolution branches that are added to the network one by one in parallel at the beginning of each new stage. The input for this stage is the sub-image from the original RGB surveillance image, and it is determined by the bounding box of each detected target. The first stage typically generates a feature map, where each pixel contains rich channel information (256 channels), and the spatial dimensions (i.e., the width and height of the feature map) are reduced to one-fourth of the original image size. In the subsequent second, third, and fourth stages, features are progressively extracted and integrated through parallel and multi-scale feature fusion.
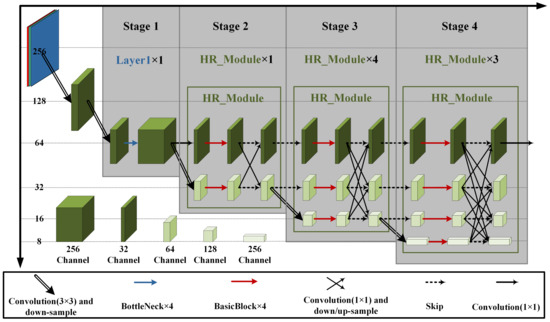
Figure 6.
HRNet-w32 network structure.
As shown in Figure 7, the four different scales of the feature maps in stage 4 are fused to obtain the final high-resolution feature output, which is mapped into a 64 × 48 × k heat map feature after one more 1 × 1 convolution operation. k represents the number of human keypoints. Figure 7 illustrates the prediction of each human keypoint locations using heat maps. According to the target frame information of target detection, the corresponding human target area is extracted.The region is input to the human keypoint detection network. The heat map features of each part of the human body are inputted at the regression side of the network in the form of regression heat maps. The argmax function is applied to compute the coordinates of the maximum response probability in the heat map, and these coordinates are then scaled and mapped back to the original image to obtain the final predicted coordinates of the human keypoints. The heat map is calculated as follows.
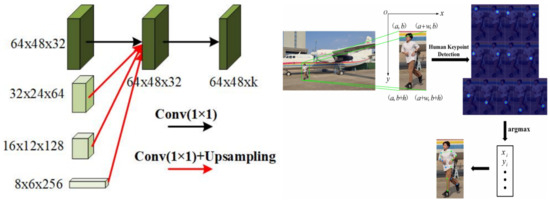
Figure 7.
Heat map regression method for human keypoints.
denotes the ground truth heat map, and denote the height and width of the heat map, respectively, K denotes the number of channels, and c denotes the standard deviation value.
3.4. Behavioral Classification
The input for this stage is the human keypoint information from the output of the human keypoint detection. It is determined by the 2D coordinate of each detected keypoint and its corresponding heat map. This stage is divided into two components: skeleton diagram construction and abnormal behavior recognition and recording.
3.4.1. Skeleton Diagram Construction
As shown in Figure 8, we utilize spatio-temporal graphs to form hierarchical representations of skeleton sequences. In particular, we construct a skeleton sequence of an undirected spacetime graph with N joints and T frames within interframe connections. The set of human keypoint nodes can be expressed as , where t represents the number of different frames and i represents the keypoint categories. The feature vector of a single node consists of its coordinates as well as the confidence level s. The set of edges can be denoted as , where one subset represents the natural connectivity relationship of the human skeleton morphology, H is the set of human keypoints, and the other subset represents the temporal relationship of the same keypoint categories between neighboring frames.
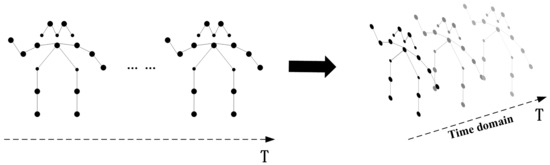
Figure 8.
The structure of the space–time skeleton diagram.
3.4.2. Abnormal Behavior Recognition and Recording
The spatio-temporal graph convolutional network (ST-GCN) [34] is introduced to perform feature extraction of human keypoints in graph structures. As shown in Figure 9, the unit of ST-GCN consists of an adjacency matrix, a weight matrix with learnable edge weights, a spatial graph convolution, a temporal graph convolution, and a residual structure (used to introduce the original skeleton information). The adjacency matrix is a matrix of size (V is the number of keypoint categories) obtained from the maximum paths of predefined neighboring points. It describes the connection relationship between each skeleton point. At each layer of the convolutional unit, a learnable weight matrix is introduced for the adjacency matrix. This weight matrix is of the same size as the adjacency matrix. It is initialized as an all-ones matrix and is updated along with the model training implementation.
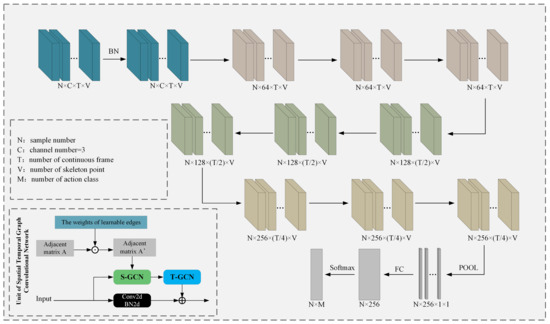
Figure 9.
ST-GCN network structure.
The ST-GCN network accomplishes the behavior recognition task through graph structure feature extraction and behavior classification. Specifically, the batch normalization (BN) layer performs normalization operations on the input data. The nine spatio-temporal map convolutional units are divided into three groups. The output channel dimensions of the units in the three groups are 64, 128, and 256. Finally, the feature vectors are sequentially fed into the pooling layer, the fully connected layer, and Softmax to output the behavioral category labels. The graph convolution operation at position x in the input feature map can be expressed as follows:
where is a sampling function that traverses the region around position x according to the index. is the weighting function.
In order to accurately record the time points at which abnormal behaviors occur, it is necessary to capture the beginning and ending moments of the abnormal behavior in the video. The task of recording abnormal behavior can be divided into two stages. In the first stage, a sliding window algorithm is designed to implement the classification of timing behaviors. In the second stage, the system traverses the category records for each frame and judges them to determine if the behavior is abnormal.
The flow of abnormal behavior detection based on a sliding window is shown in Figure 10. The length of the sliding window is predefined as n. The entire process pseudo-code is shown in Algorithm 1. During the process of performing the timing of abnormal behavior detection task, frame-level behavioral information is recorded for each target subject that occurs.
| Algorithm 1 Pseudo-code for timing behavior detection based on the sliding window mechanism |
Input: keypoint information for non-cooperative targets:
|
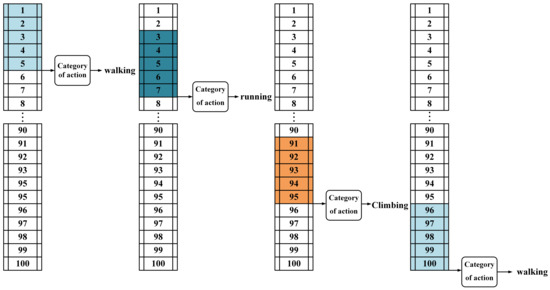
Figure 10.
Sliding window-based timing behavior detection.
4. Experiments
This section presents the results of qualitative and quantitative experiments using the NC-ABLD framework on the IIAR-30 dataset.
4.1. Datasets
Generally, datasets consisting of training, testing, and validation sets are significant in researching deep learning-based algorithms. Nevertheless, up to now, no public dataset can be used to evaluate the model’s performance for human abnormal behavior detection in an airport scene. Therefore, a unique dataset has to be constructed for abnormal behavior recognition on airport surfaces: the IIAR-30, which is used to evaluate the performance of each module in the NC-ABLD framework.
The IIAR-30 dataset is derived from the surveillance videos of two civil airports that contain three sub-datasets: the target detection dataset, the human keypoint dataset, and the behavioral classification dataset. The target detection dataset is used to train the human body detector and evaluate the network performance. The human keypoints dataset is used to train the human keypoint detection network and evaluate the network performance. The software LabelMe 3.16.7 was used to annotate human targets and keypoints according to the format provided by the dataset COCO. The details of each dataset are shown in Table 1.

Table 1.
Detailed information on the IIAR-30 dataset.
4.2. Experimental Details
4.2.1. Experimental Configuration
The platform used for the experimentswass a desktop workstation with the following device parameters: CPU model 12th Gen Intel(R) Core(TM) i9-12900K, 64 GB of RAM, GPU model GA102 [GeForce RTX 3090 Ti], 24 GB of video memory, operating system Ubuntu20.04. The language used for programming was Python3.9.12, and the experimental environments all usde the Pytorch deep learning framework and were configured with CUDA11.1 to invoke GPU-accelerated computation.
4.2.2. Evaluation Indicators
Mean average precision (mAP) is used to measure the positioning accuracy of an index in a dataset that contains multiple categories of situations. It calculates the average precision (AP) value for each category and then computes the average of these AP values. AP is calculated based on the area under the precision–recall (PR) curve. The PR curve plots precision on the x-axis and recall on the y-axis. The area under this curve is a crucial indicator for evaluating the performance of a detector. A higher AP value indicates better detector performance. The core indicator for evaluating the performance of a detector is the AP value, with higher values indicating better performances. Precision measures the ratio of correctly detected airport field targets to all targets detected by the sensor. Recall measures the ratio of correctly detected airport field targets to all actual targets on the ground. The calculation method for both Precision and Recall is shown in Formula (8).
The mean average accuracy of the object keypoint similarity (OKS) calculation is chosen as the criterion for judging the accuracy of human keypoint detection. OKS determines the network performance by calculating the similarity between the predicted skeleton points and the actual locations on the ground and setting different scaling ranges. It is calculated as shown in Formula (9). s and represent the category and Euclidean distance of the skeleton points, respectively, and is the scale factor of the target.
4.2.3. Parameter Settings
The dataset samples are divided into training sets, validation sets, and test sets in the ratio of 7:2:1, and the same computing platform is used for all comparison experiments.
A multi-scale non-cooperative object localization module uses a training batch size of 16 and is trained for 200 epochs. The training employs a stochastic gradient descent (SGD) optimizer with an initial learning rate of 1 × 10⁻². The learning rate is attenuated using the cosine annealing method with a decay coefficient of 5 × 10⁻⁴.
The human keypoint detection module applies image enhancement techniques such as mirror flipping and scale scaling to the samples during training. The pre-trained weights from the COCO dataset are utilized. The training iteration is set to 200 epochs.
In the behavioral classification module, each video is sampled with 30 frames of frame-by-frame nudged temporal skeleton point data. This frame-by-frame nudged sampling serves as a form of dataset augmentation. The training process utilizes the Adam optimization strategy with a learning rate of 10 × 10−3 and a batch size of 16. The training is performed for 30 epochs. These parameters are the optimal parameters that we have obtained after many epochs of experiments and tests. When this framework is applied in different scenarios, one can use this parameter to complete the pre-training and then further adjust the parameters according to their own evaluation results.
4.3. Quantitative Comparison with Other Methods
We completed training in IIAR-30 on the six behaviors (standing, walking, running, climbing, touch paddle, squatting) of the current mainstream methods in Table 2. The parameters of the model were counted. We used metrics such as GFOPS and FPS for evaluation in the GPU-3090ti (NVIDIA, Santa Clara, CA, USA). and Jetson-Orin-AGX devices (NVIDIA, Santa Clara, CA, USA). The NC-ABLD framework achieves 67FPS on the GPU-3090ti and 15FPS on the edge-side device Jetson-Orin-AGX inference despite having a high computational complexity of 98.7GFLOPs. The code is avaliable at https://github.com/3083156185/NC-ABLD.git accessed on 12 July 2024.
Table 2.
Comparison of NC-ABLD computational complexity.
The performance of SSD, Fast-RCNN, YOLOv3, YOLOv5-s, YOLOX-s, and the improved model used in this paper are compared. The evaluation metrics used are the average precision AP value and recall AR value introduced in the previous section. The metrics of the six models are compared, as shown in Table 3.
Table 3.
Comparison of experimental results with other algorithms.
As observed from the Table 3 data, the YOLOX-s target detection model demonstrates greater robustness compared to other popular target detection networks in terms of performance. It exhibits higher adaptability to the complex backgrounds found in airport field aprons and targets with significant scale variations. The improved model achieved a 1.7% increase in AP value compared to the baseline model, and the recall rate was improved by 1.2%.
Based on the final predictions of human keypoint detection, a coordinate error analysis was conducted, and the results are presented in Table 4. The table includes the minimum, maximum, and average error values for the 13 skeleton points. The error values represent the absolute pixel Euclidean distances between the actual and predicted values. From Table 5, it can be seen that the prediction value of the detection of human keypoints has a low error compared to the true value.
Table 4.
Error statistics of the predicted results and labels of the skeleton points of the model in this paper (unit: pixels).
Table 5.
Experimental error statistics for localization of abnormal behavior.
When recording abnormal behavior, we always pushed back time nodes in time according to the length of the sliding window intervals, and we used the time nodes obtained from the pushed back time nodes as the final prediction results. We take the error between the prediction result and the real time node as the evaluation index, and the six sets of experimental results obtained are shown in Table 5.
The experimental results show that the average error of the temporal node localization of abnormal behavior in the field was 0.4 s, which was almost equivalent to the ability of human eyes to identify abnormal behavior.
4.4. Ablation Study
4.4.1. Comparison of the Results of Ablation Experiments with Improved YOLOX-s
In order to verify the enhancement of the mosaic data strategy, attention mechanism module, and loss function optimization on the performance of the benchmark network, ablation comparison experiments of the modules were carried out on the constructed airport field target detection dataset. The experimental results are shown in Table 6.
Table 6.
Comparison of ablation experiment results for improved networks.
For the results of each method in Table 2 and each configuration in Table 5, it is a good suggestion to see the differences in the results.
As shown in Figure 11, when only the mosaic data enhancement strategy is used, the AP value grows from 85.2% to 85.8%, and the recall rate grows from 88.2% to 88.6%. When only the attention module is added, the AP value grows from 85.2% to 85.6%. The recall rate grows from 88.2% to 88.5%. When only the loss-of-confidence function is optimized, the AP value grows from 85.2% to 85.8%. The recall grows from 88.2% to 88.7%, indicating that all three modules can improve detection precision and recall.
4.4.2. Type of Behavior Predicted
The experiment yielded a confusion matrix, as shown in Figure 12. The recognition results indicate that the accuracy of recognizing standing, walking, and climbing actions, which possess distinctive skeleton feature information, can reach 100%. However, due to the simultaneous occurrence of standing and touch paddle actions, there is a minimal misclassification rate for these actions. Similarly, the initial stages of squatting and running actions are often mistaken for standing and walking actions, respectively. As a result, there are misclassifications, such as 3% of squatting actions being recognized as standing, 1% of running actions being recognized as walking, and 1% of touch paddle actions being recognized as standing.
Overall, the adopted spatiotemporal graph convolutional network is highly accurate when applied to skeleton-based human behavior recognition in the field, which meets the requirements for adequate recognition of personnel behavior in real-field apron surveillance.
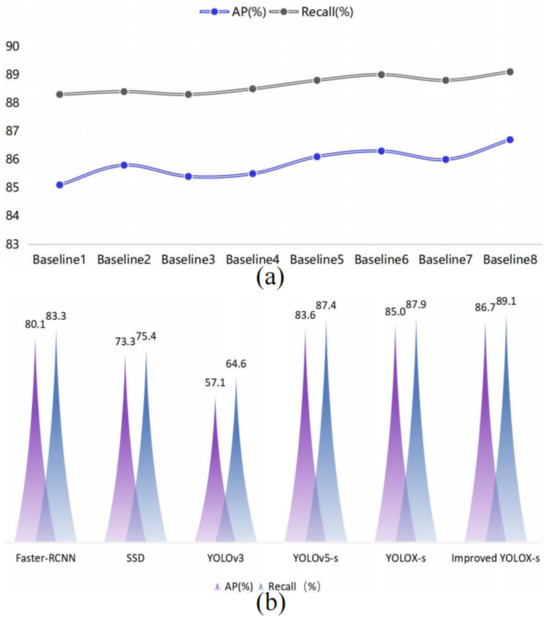
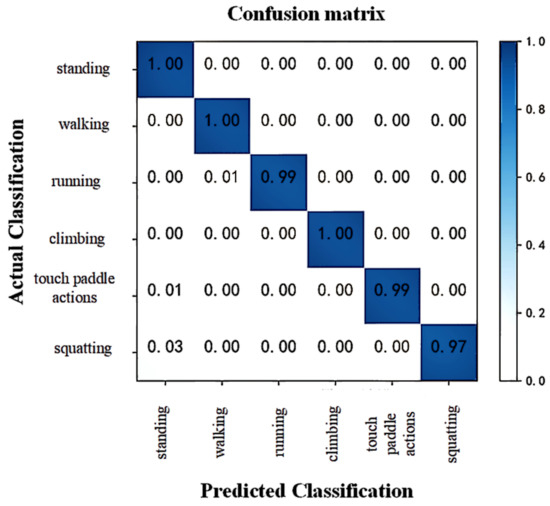
Figure 12.
Predicted results for behavioral categories.
4.5. Visualization of Experimental Results
To compare the prediction error more intuitively and further validate the robustness of the human keypoint detection module, the visualization results of the actual skeleton points with and without occlusion are shown in Figure 13, where only part of the region containing the human body target is intercepted due to the large size of the original image. The green skeleton points in the figure indicate the actual values, and the red skeleton points indicate the predicted values. It can be seen by comparing the experimental results that the human keypoint detection model can still accurately detect the position of each human keypoint when it is used for skeleton point recognition in the scene with occlusions. As shown in Figure 14, comparing Figure 14b,c, it can be seen that the improvement of YOLOX-s reduces missed detection due to occlusions.
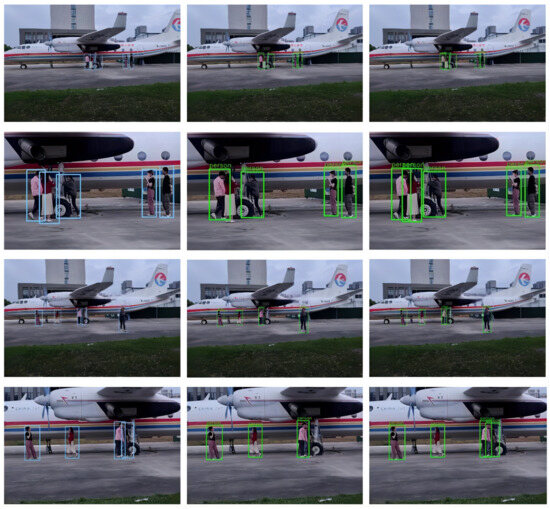
Figure 13.
Label and prediction results display plot with and without occlusions.
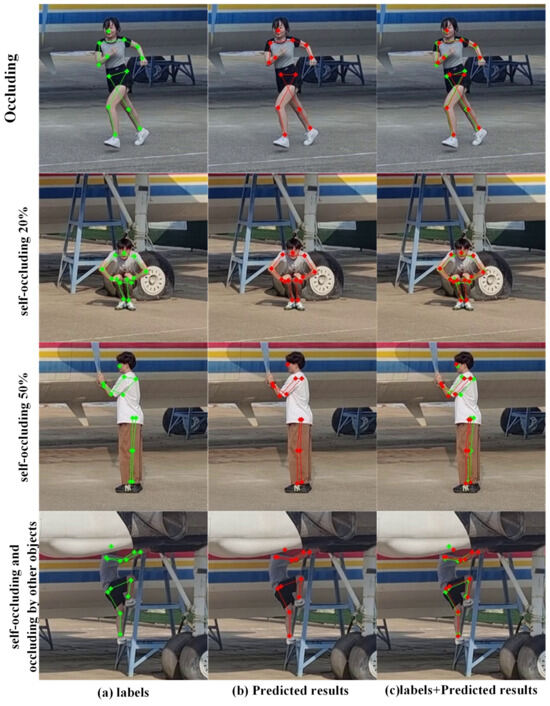
Figure 14.
Label and prediction results display plot with and without occlusions. (a) Location of key points manually labeled. (b) Location of key points for model predictions. (c) Manual labeling and model prediction of key point locations are simultaneously restored in the original drawing.
Six abnormal behavior localization experiments were conducted, involving both single-person and multi-person scenes. Figure 15 presents the experimental results for one group of single and multi-person instances at specific time nodes in the time series. The time series is divided into frames, and the blue circle in the figure represents normal behavior exhibited by the corresponding target in a specific frame. The red circle denotes the period when abnormal behavior occurs in the video sequence.
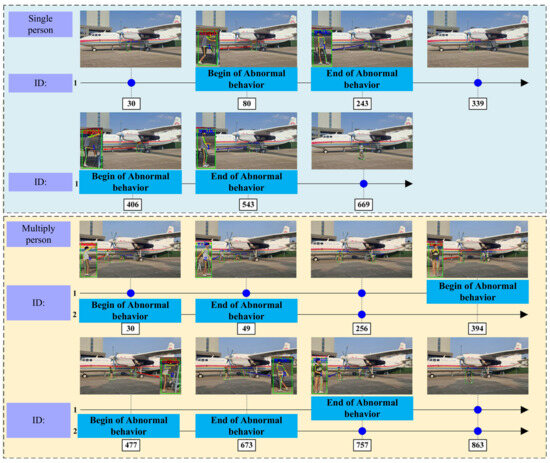
Figure 15.
Visualization of experimental results for single versus multi-person abnormal behavioral scenarios.
To visually represent the detection effect after joint inference of the models on the visual graph, the visualization includes human body bounding boxes, tracked identity IDs, human body skeleton maps, and the classification results of the temporal behaviors.
The temporal action detection method employed in this chapter uses a sliding window with a length of 30 frames. Behavioral classification is not performed when the number of image frames containing the target is less than 30 frames. The results of each experiment shown here start from the 30th frame onward.
Taking the example of a single person, in the first frame of the experiment, the timing behavior category of person 1 is outputted. In the 80th frame, the person is detected as climbing, which is an abnormal behavior. The abnormal behavior continues until the 243rd frame, when the behavior returns to normal. In the 404th frame, the person is detected as touching the paddle, which is another abnormal behavior. The abnormal behavior persists until the 439th frame, when the behavior returns to normal.
5. Conclusions and Future Works
In this paper, we propose a new scheme for autonomous monitoring of non-cooperative object behavior in civil aviation airport scenarios, which provides new ideas for the application of abnormal behavior detection algorithms in specific industrial areas. An NC-ABLD framework for the localization and detection of abnormal behaviors of typical non-cooperative targets in airport areas has been developed through the design of three modular networks ranging from coarse to fine-grained. In addition, an IIAR-30 airport video dataset is proposed on which the overall performance of NC-ABLD is validated, and a dataset contribution is provided for subsequent studies targeting specific industrial areas. The NC-ABLD framework achieves 67 FPS on the GPU-3090ti and 15 FPS on the edge-side device Jetson-Orin -AGX inference despite having a high computational complexity of 98.7 GFLOPs. As Table 5 shows, the average error of the temporal node localization of abnormal behavior in the field is 0.4 s, which is almost equivalent to the ability of human eyes to detect abnormal behavior.
Although the framework performs well in handling detection in light-occlusion situations, there are still some limitations. For example, when the human body is highly occluded or the shape of the occluder is similar to that of the target object, the model may fail to recognize the target correctly or produce incorrect detection results. In addition, our model detects poorly in low-light environments. In future work, we will also explore the use of infrared cameras to improve the performance of the system in low-visibility conditions, thereby increasing its robustness and reliability in a variety of operational situations.
Author Contributions
J.L. searched and processed experimental data and wrote the code. X.D. wrote the paper and analyzed the data. All authors have read and agreed to the published version of the manuscript.
Funding
This work was supported by the National Natural Science Foundation of China (No. U2033201), the Fundamental Research Funds for the Central Universities (No. NJ2023029), Open Project Funds for the Key Laboratory of Space Photoelectric Detection and Perception (Nanjing University of Aeronautics and Astronautics), Ministry of Industry and Information Technology (No. NJ2023029-2), and Aeronautical Science Foundation of China (No. 20220058052001).
Institutional Review Board Statement
Not applicable.
Informed Consent Statement
Not applicable.
Data Availability Statement
This dataset can be obtained by contacting the corresponding author by email.
Conflicts of Interest
The authors declare no conflicts of interest.
References
- Lopez Meyer, G. Safety Report 2018; Technical Report; International Air Transport Association: Montreal, QC, Canada, 2019. [Google Scholar]
- Lopez Meyer, G. Safety Report 2019; Technical Report; International Air Transport Association: Montreal, QC, Canada, 2020. [Google Scholar]
- Schultz, M.; Olive, X.; Rosenow, J.; Fricke, H.; Alam, S. Analysis of airport ground operations based on ADS-B data. In Proceedings of the 2020 International Conference on Artificial Intelligence and Data Analytics for Air Transportation (AIDA-AT), Singapore, 3–4 February 2020; pp. 1–9. [Google Scholar] [CrossRef]
- Perl, E. Review of airport surface movement radar technology. In Proceedings of the 2006 IEEE Conference on Radar, Verona, NY, USA, 24–27 April 2006. [Google Scholar] [CrossRef]
- Ding, M.; Zhou, W.; Xu, Y.; Xu, Y. Two-Stage Framework for Specialty Vehicles Detection and Classification: Toward Intelligent Visual Surveillance of Airport Surface. IEEE Trans. Aerosp. Electron. Syst. 2024, 60, 1912–1923. [Google Scholar] [CrossRef]
- Han, X.; Liu, H.; Sun, F.; Zhang, X. Active Object Detection with Multistep Action Prediction Using Deep Q-Network. IEEE Trans. Ind. Inform. 2019, 15, 3723–3731. [Google Scholar] [CrossRef]
- Ding, M.; Zhang, X.; Chen, W.H.; Wei, L.; Cao, Y.F. Thermal infrared pedestrian tracking via fusion of features in driving assistance system of intelligent vehicles. Proc. Inst. Mech. Eng. Part G J. Aerosp. Eng. 2019, 233, 6089–6103. [Google Scholar] [CrossRef]
- Lu, H.L.; Kwan, J.; Fong, A.; Cheng, V. Field Testing of Vision-Based Surveillance System for Ramp Area Operations. In Proceedings of the 2018 Aviation Technology, Integration, and Operations Conference, Atlanta, GA, USA, 25–29 June 2018. [Google Scholar] [CrossRef]
- Van Phat, T.; Alam, S.; Lilith, N.; Tran, P.N.; Nguyen, B.T. Aircraft push-back prediction and turnaround monitoring by vision-based object detection and activity identification. In Proceedings of the 10th SESAR Innovation Days, Virtual, 7–10 December 2020. [Google Scholar]
- Hassanin, M.; Anwar, S.; Radwan, I.; Khan, F.S.; Mian, A. Visual attention methods in deep learning: An in-depth survey. Inf. Fusion 2024, 108, 102417. [Google Scholar] [CrossRef]
- Besada, J.; Garcia, J.; Portillo, J.; Molina, J.; Varona, A.; Gonzalez, G. Airport surface surveillance based on video images. IEEE Trans. Aerosp. Electron. Syst. 2005, 41, 1075–1082. [Google Scholar] [CrossRef]
- Dong, X.; Wang, X.; Li, B.; Wang, H.; Chen, G.; Cai, M. YH-Pose: Human pose estimation in complex coal mine scenarios. Eng. Appl. Artif. Intell. 2024, 127, 107338. [Google Scholar] [CrossRef]
- Zhang, F.; Bazarevsky, V.; Vakunov, A.; Tkachenka, A.; Sung, G.; Chang, C.L.; Grundmann, M. MediaPipe Hands: On-device Real-time Hand Tracking. arXiv 2020, arXiv:2006.10214. [Google Scholar]
- Newell, A.; Yang, K.; Deng, J. Stacked hourglass networks for human pose estimation. In Proceedings of the Computer Vision–ECCV 2016: 14th European Conference, Amsterdam, The Netherlands, 11–14 October 2016; Proceedings, Part VIII 14. Springer: Berlin/Heidelberg, Germany, 2016; pp. 483–499. [Google Scholar]
- Chu, X.; Yang, W.; Ouyang, W.; Ma, C.; Yuille, A.L.; Wang, X. Multi-Context Attention for Human Pose Estimation. In Proceedings of the IEEE Conference on Computer Vision and Pattern Recognition (CVPR), Honolulu, HI, USA, 21–26 July 2017. [Google Scholar]
- Liu, Z.; Chen, H.; Feng, R.; Wu, S.; Ji, S.; Yang, B.; Wang, X. Deep Dual Consecutive Network for Human Pose Estimation. In Proceedings of the IEEE/CVF Conference on Computer Vision and Pattern Recognition (CVPR), Nashville, TN, USA, 19–25 June 2021; pp. 525–534. [Google Scholar]
- Xue, N.; Wu, T.; Xia, G.S.; Zhang, L. Learning Local-Global Contextual Adaptation for Multi-Person Pose Estimation. In Proceedings of the IEEE/CVF Conference on Computer Vision and Pattern Recognition (CVPR), New Orleans, LA, USA, 18–24 June 2022; pp. 13065–13074. [Google Scholar]
- Wang, M.; Tighe, J.; Modolo, D. Combining Detection and Tracking for Human Pose Estimation in Videos. In Proceedings of the IEEE/CVF Conference on Computer Vision and Pattern Recognition (CVPR), Seattle, WA, USA, 13–19 June 2020. [Google Scholar]
- Toshev, A.; Szegedy, C. DeepPose: Human Pose Estimation via Deep Neural Networks. In Proceedings of the IEEE Conference on Computer Vision and Pattern Recognition (CVPR), Columbus, OH, USA, 23–28 June 2014. [Google Scholar]
- Iqbal, U.; Gall, J. Multi-person pose estimation with local joint-to-person associations. In Proceedings of the Computer Vision–ECCV 2016 Workshops: Amsterdam, The Netherlands, 8–10 and 15–16 October 2016,Proceedings, Part II 14; Springer: Berlin/Heidelberg, Germany, 2016; pp. 627–642. [Google Scholar]
- Asghari-Esfeden, S.; Sznaier, M.; Camps, O. Dynamic Motion Representation for Human Action Recognition. In Proceedings of the IEEE/CVF Winter Conference on Applications of Computer Vision (WACV), Snowmass Village, CO, USA, 1–5 March 2020. [Google Scholar]
- Duan, H.; Zhao, Y.; Chen, K.; Lin, D.; Dai, B. Revisiting Skeleton-Based Action Recognition. In Proceedings of the IEEE/CVF Conference on Computer Vision and Pattern Recognition (CVPR), New Orleans, LA, USA, 18–24 June 2022; pp. 2969–2978. [Google Scholar]
- Lu, P.; Jiang, T.; Li, Y.; Li, X.; Chen, K.; Yang, W. RTMO: Towards High-Performance One-Stage Real-Time Multi-Person Pose Estimation. arXiv 2024, arXiv:2312.07526. [Google Scholar]
- Hua, Y.; Wu, W.; Zheng, C.; Lu, A.; Liu, M.; Chen, C.; Wu, S. Part Aware Contrastive Learning for Self-Supervised Action Recognition. arXiv 2023, arXiv:2305.00666. [Google Scholar]
- Liu, Q.; Zhang, Y.; Bai, S.; Yuille, A. Explicit occlusion reasoning for multi-person 3d human pose estimation. In Proceedings of the European Conference on Computer Vision, Tel Aviv, Israel, 23–27 October 2022; Springer: Berlin/Heidelberg, Germany, 2022; pp. 497–517. [Google Scholar]
- Ge, Z.; Liu, S.; Wang, F.; Li, Z.; Sun, J. YOLOX: Exceeding YOLO Series in 2021. arXiv 2021, arXiv:2107.08430. [Google Scholar]
- He, K.; Zhang, X.; Ren, S.; Sun, J. Deep Residual Learning for Image Recognition. In Proceedings of the IEEE Conference on Computer Vision and Pattern Recognition (CVPR), Las Vegas, NV, USA, 27–30 June 2016. [Google Scholar]
- Wang, Q.; Wu, B.; Zhu, P.; Li, P.; Zuo, W.; Hu, Q. ECA-Net: Efficient Channel Attention for Deep Convolutional Neural Networks. In Proceedings of the IEEE/CVF Conference on Computer Vision and Pattern Recognition (CVPR), Seattle, WA, USA, 13–19 June 2020. [Google Scholar]
- Lin, T.Y.; Dollar, P.; Girshick, R.; He, K.; Hariharan, B.; Belongie, S. Feature Pyramid Networks for Object Detection. In Proceedings of the IEEE Conference on Computer Vision and Pattern Recognition (CVPR), Honolulu, HI, USA, 21–26 July 2017. [Google Scholar]
- Li, H.; Xiong, P.; An, J.; Wang, L. Pyramid Attention Network for Semantic Segmentation. arXiv 2018, arXiv:1805.10180. [Google Scholar]
- Weng, S.K.; Kuo, C.M.; Tu, S.K. Video object tracking using adaptive Kalman filter. J. Vis. Commun. Image Represent. 2006, 17, 1190–1208. [Google Scholar] [CrossRef]
- Singh, V.K.; Wu, B.; Nevatia, R. Pedestrian Tracking by Associating Tracklets using Detection Residuals. In Proceedings of the 2008 IEEE Workshop on Motion and Video Computing, Copper Mountain, CO, USA, 8–9 January 2008; pp. 1–8. [Google Scholar] [CrossRef]
- Wang, J.; Sun, K.; Cheng, T.; Jiang, B.; Deng, C.; Zhao, Y.; Liu, D.; Mu, Y.; Tan, M.; Wang, X.; et al. Deep High-Resolution Representation Learning for Visual Recognition. IEEE Trans. Pattern Anal. Mach. Intell. 2021, 43, 3349–3364. [Google Scholar] [CrossRef] [PubMed]
- Kipf, T.N.; Welling, M. Semi-Supervised Classification with Graph Convolutional Networks. arXiv 2016, arXiv:1609.02907. [Google Scholar]
Disclaimer/Publisher’s Note: The statements, opinions and data contained in all publications are solely those of the individual author(s) and contributor(s) and not of MDPI and/or the editor(s). MDPI and/or the editor(s) disclaim responsibility for any injury to people or property resulting from any ideas, methods, instructions or products referred to in the content. |
© 2024 by the authors. Licensee MDPI, Basel, Switzerland. This article is an open access article distributed under the terms and conditions of the Creative Commons Attribution (CC BY) license (https://creativecommons.org/licenses/by/4.0/).