1. Introduction
Rolling stock, a crucial part of railway transportation systems with a limited operational lifespan, requires replacement to keep services efficient. Within today’s budget constraints, railroad and transit operators inevitably face decisions on the most suitable equipment for specific services. This raises questions about what equipment is best suited to replace existing ones, and various agencies and operators employ diverse metrics to determine the optimal rolling stock configurations [
1]. In the realm of rolling stock performance, it is widely acknowledged that passengers prioritize clean, comfortable vehicles that facilitate easy boarding and alighting. The challenge lies in determining the relative importance of these factors, including comfort level. Estimating the effects of improving rolling stock on ride quality is possible by relating these improvements to fares and In-Vehicle Time (IVT) metrics. Improved ride quality can increase passenger satisfaction, which may result in higher ridership levels or longer journey times [
2,
3]. For example, if a 10% improvement in passenger satisfaction leads to a 2% increase in ridership or a 5% decrease in the perceived In-Vehicle Time (IVT), this could be used to estimate the impact on fare revenue or operational costs. Transportation planning also faces environmental challenges, particularly in terms of noise and vibration associated with railways. Vibrations originating at the vehicle–track interface can affect passengers and infrastructure, contributing to structural noise. Vibrations can cause fatigue, muscle strain, headaches, dizziness, nausea, and other health issues when experienced for extended periods or at high intensities [
4,
5]. In railway environments, vibrations are generated by train movement on tracks, track irregularities, wheel–rail interaction forces, and pantograph–catenary interaction [
6,
7]. The discomfort caused by vibration is influenced by frequency content (low frequencies generally cause more discomfort), amplitude, duration, and pattern. Additionally, vibrations within the track can accelerate wear on components such as sleepers, pads, and fastenings.
Noise exposure can lead to temporary or permanent hearing loss, sleep disturbances, stress, anxiety, and other adverse health effects [
4,
5]. In railway environments, noise sources include rolling stock engines, wheelsets, brakes, air conditioning systems, passenger interactions, track-borne noise (e.g., rail joint clatter), pantograph–catenary interaction, and structure-borne vibration transmission from the train to its surroundings. The discomfort caused by noise is influenced by factors such as sound pressure level, frequency content, duration, and pattern.
The combined effect of vibration and noise on comfort can be assessed using subjective measures like annoyance ratings or objective physiological responses (e.g., heart rate variability). Several studies have investigated the relationship between these two factors in various transportation contexts, including railways. These investigations often involve controlled laboratory experiments where participants are exposed to different vibration and noise levels while completing tasks related to their comfort perception or performance under such conditions [
8].
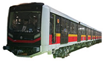
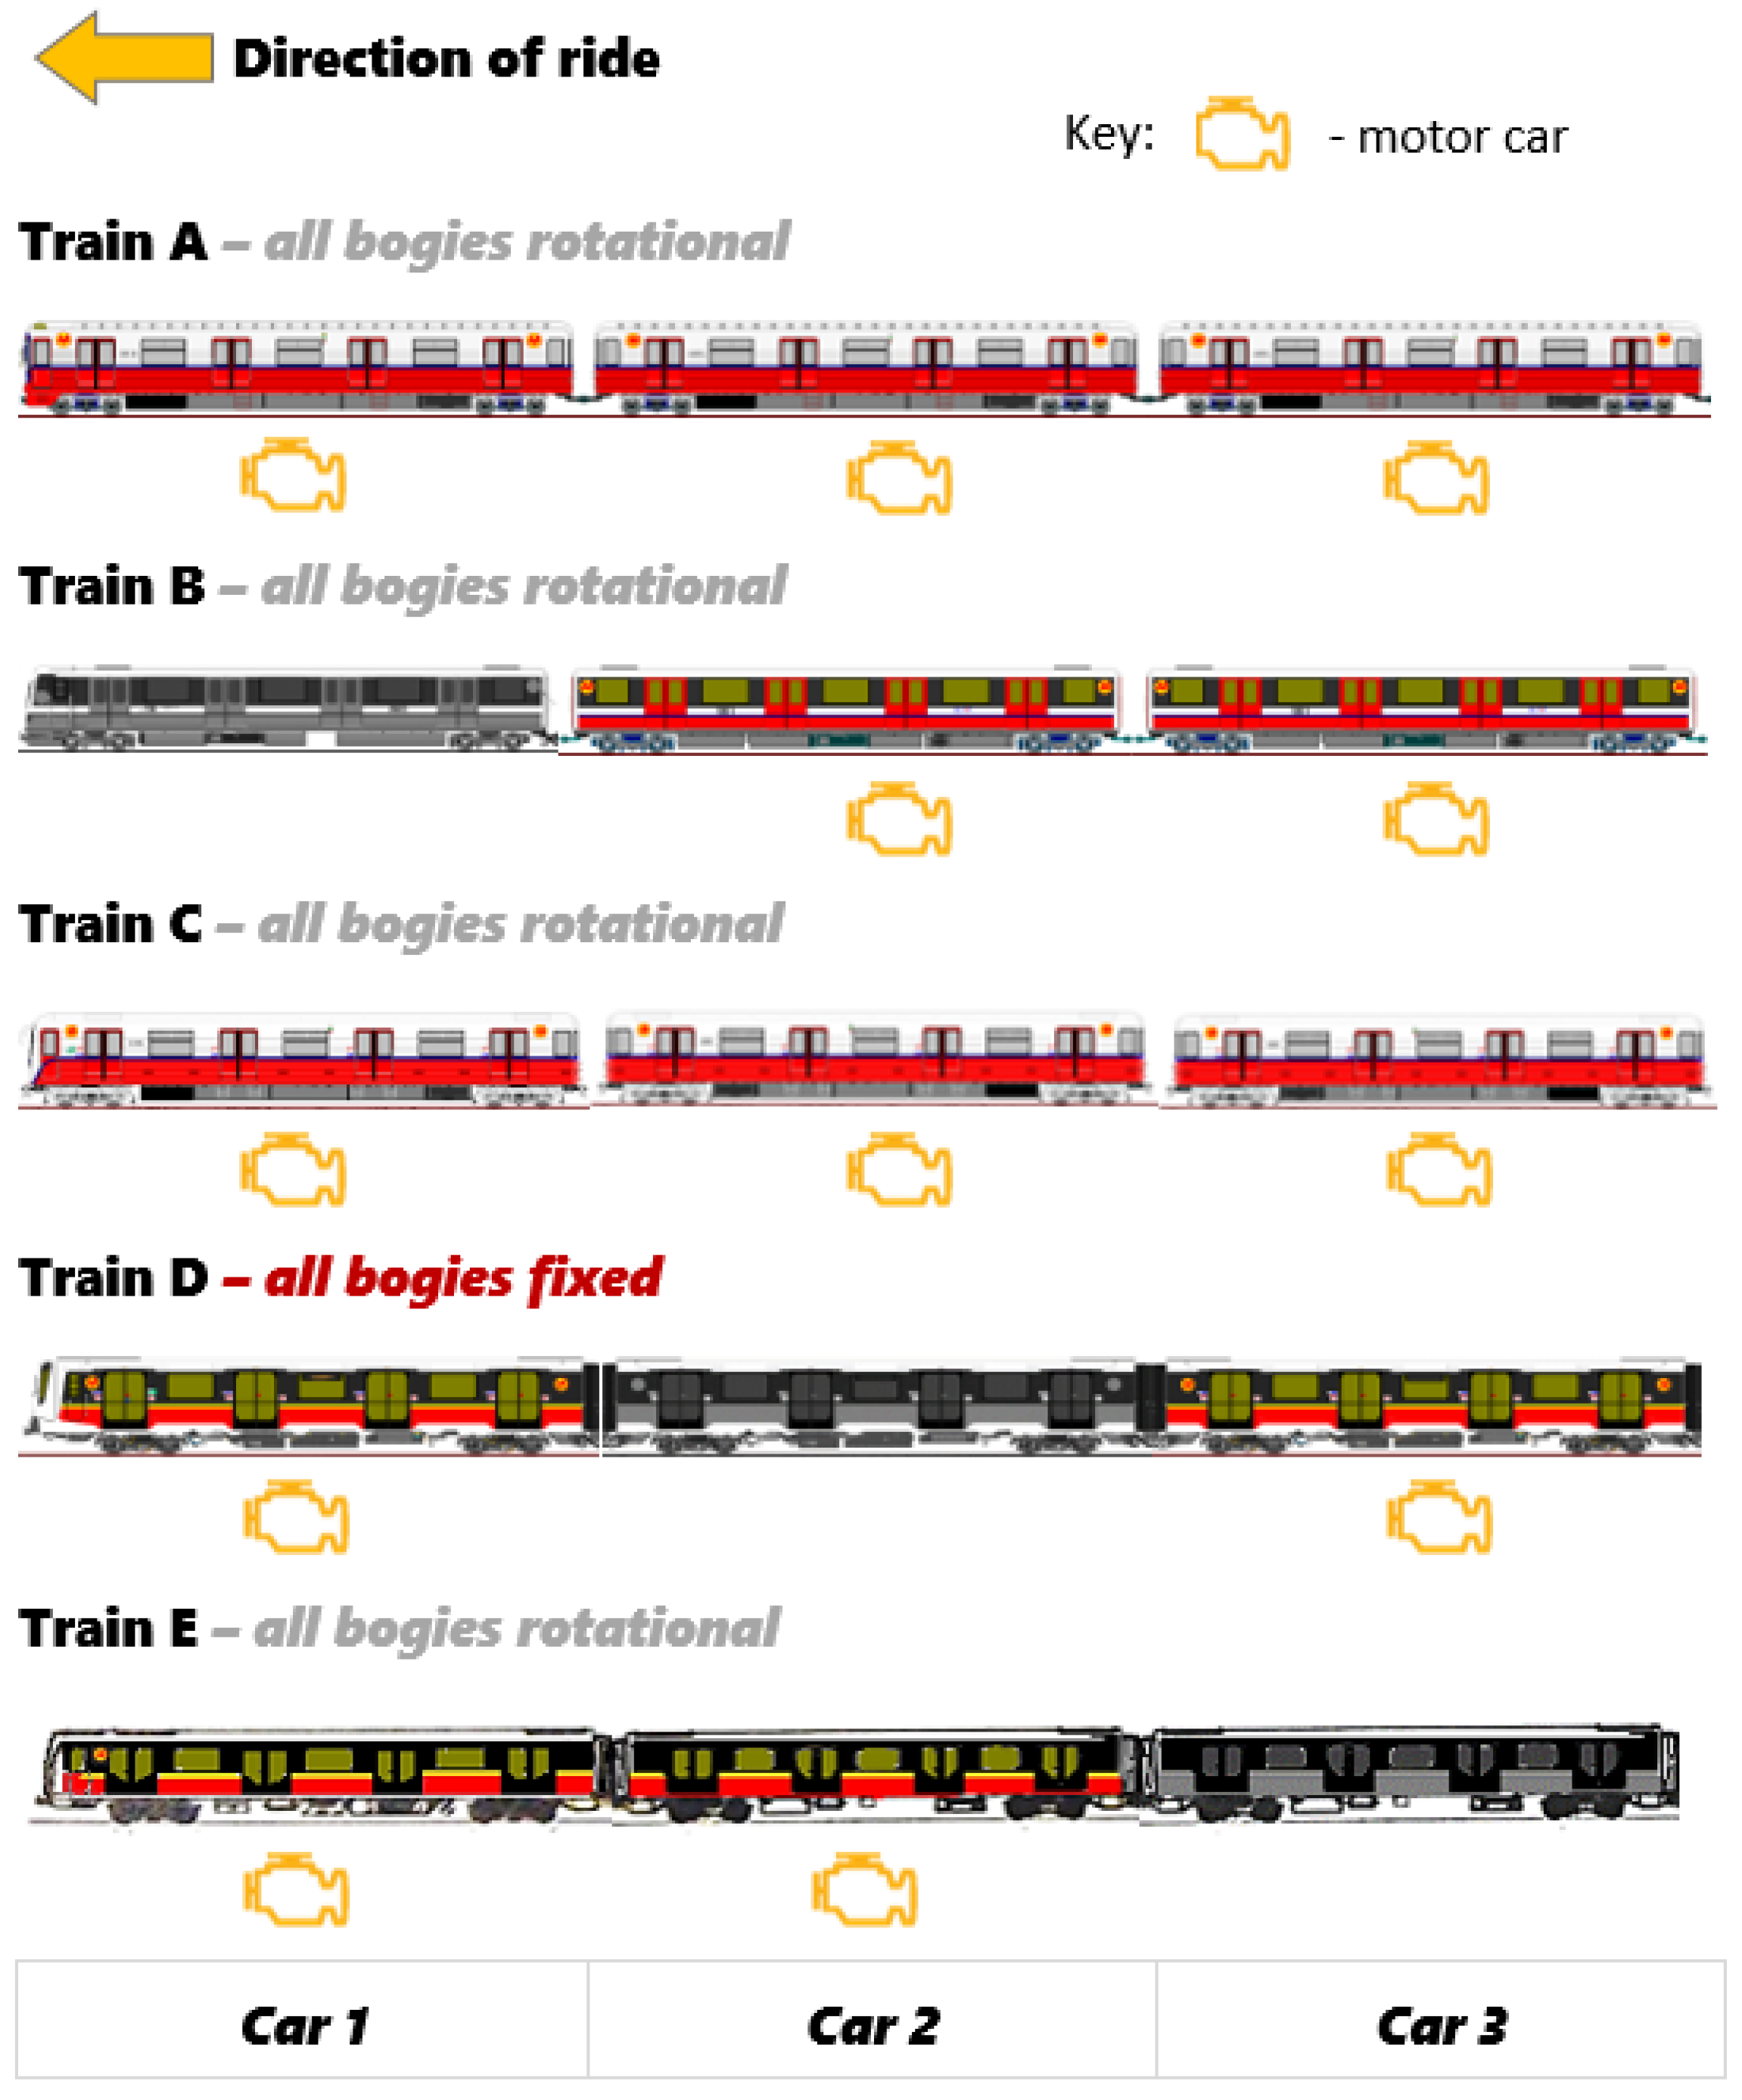
Examining the specific case of the Warsaw metro, we analyzed vibrations and noise across various metro train types, ranging from older models to the most modern ones (
Figure 1). The evaluation analyses vibration and noise levels at different positions within each train’s interior. The goal is to identify trends in vibroacoustics and assess how each type performs in terms of generating, transmitting, and mitigating vibrations. While there have been extensive studies on vibroacoustic phenomena in railways, there is still a gap in understanding how these factors collectively influence overall passenger comfort. Additionally, there is a need for convenient rating scales to compare different train types. The implications of these findings are substantial for transportation planning and operation, emphasizing the importance of considering multiple factors to improve the overall passenger experience.
Vibrations and noise in metro trains originate from two sources: external factors, such as poor infrastructure maintenance causing wear and noise during train passage, and internal components of the metro vehicle itself. The first group includes issues like railway turnouts or curved lines in tunnels, contributing to increased noise both inside and outside the train. The second group involves vibrations and noise generated directly by individual components within the metro vehicle. Key contributors to internal noise are the converter and inverter. The converter, audible even when the train is stationary, changes voltage from the third rail for electrical equipment, often operating at 110 V. The inverter controls voltage for acceleration and braking, noticeable in specific train models like Metropolis 98b. The pneumatic system, controlling brakes and doors, produces increased noise and vibrations, particularly evident in Russian-made trains. Wheelset axle issues, including failures, defects, and damage to bearings, also impact vibrations and noise in metro vehicles. Rail vehicle body vibrations are categorized into stiff and flexible modes, affecting ride comfort. Stiff modes, like bouncing and rolling, occur at around 1 Hz, while flexible modes, impacting human balance, occur in the 4 to 12 Hz range. Minimizing stiff modes’ impact with springs and shock absorbers does not directly address flexible modes, which require distinct designs [
9,
10,
11]. Modern lightweight bodies, while reducing weight, may compromise structural stiffness. Relying solely on rigid modes for comfort analysis might overlook critical phenomena, especially considering structural flexibility’s impact on acceleration levels in the vehicle floor [
12,
13]. Proper wagon design and second-stage suspension assembly selection are crucial to prevent excessive vibrations [
14,
15,
16,
17,
18]. Noise and vibration levels are further influenced by the drive system and bogie running gear characteristics, contributing to the overall vibroacoustic climate. This paper considers rail vehicles used in the Warsaw metro. In
Table 1, basic parameters regarding the rolling stock construction are presented.
In series 81 vehicles, each train wagon is driven. In Metropolis trains, wagons 1 and 6 have non-powered bogies; in Inspiro trains, bogies in wagons 2 and 5 are not powered; and in the latest Škoda trains, non-powered bogies are used in wagons 3 and 4. Additionally, only Inspiro trains use non-rotational bogies.
The Warsaw metro uses ballast-less (concrete) and sleeper-less tracks. The concrete foundation (acts as a ballast) on the M1 line uses B25-class concrete, appropriately formed with channels. For part of the length, the rails are placed in the lagging. S60E1 and S49E1 rails are used along with a rail attachment node. Both parts are connected with anchor bolts, fixed (glued) in the concrete base using epoxy concrete. On the Kabaty–Wilanowska section, the track surface is fastened with a K-type fastening with a triple ring and a Łpa2 clamp. To the north of the Wilanowska station, Skl-3 spring clips, FC104-type vibration-isolating pads (made of cork elastomer), and FC585-type under-rail spacers are used. Thanks to these measures, the track is more flexible. The switches used are a modification of standard railway turnouts S60–1:9–190 and crossings S60–1:4444, fastened with 24/30 mm anchor bolts. Welding of contactless tracks with a track welding machine was replaced with thermite welding, and the glued-compressed joint welded into the track was replaced with a joint made on-site in the track. Preventive rail grinding was also introduced, which involved removing the decarburized layer and improving the profile of the rail head on the wheel running surface. These treatments not only reduce noise and improve travel comfort, but also extend the service life and save energy consumption [
19].
Apart from the elements shaping the passenger’s surroundings, it is essential to highlight those exclusively tied to individual attributes. The level of comfort experienced during the journey, whether positive or negative, can be impacted by factors such as weight, height, body structure, overall physical and mental health, and the passenger’s gender and age. The interpretation of comfort can vary among passengers due to factors like body posture, the unique dynamic response of the individual’s body, and even personal expectations [
20,
21,
22,
23]. The current literature predominantly focuses on the separate evaluation of different factors, often neglecting the combined impact of these factors.
The conclusions from the literature seem consistent, in that subjective assessment of the vibration level is mainly independent of the simultaneous noise occurring within the range of typical values for means of transport. However, subjective noise assessment simultaneously depends on the vibration level [
24,
25,
26,
27]. If an overall assessment of stimuli is required, noise dominates the assessment with less influence from vibration levels. The overall annoyance resulting from the combined effect of vibration and noise is greater than that of just one type of stimulus.
Several models of the total nuisance caused by noise and vibration can be found in the literature. Psychophysical models focus on the direct relationship between physical stimuli, such as the level of noise and vibration, and people’s psychological reactions, such as the level of discomfort or irritation. These models rely on experiments and measurements to understand how different levels of noise and vibration are perceived by humans. Perceptual models go a step further and consider not only sensory aspects but also psychological and cognitive factors. They include psychophysics elements and additionally consider factors such as attention, expectations, and individual differences in perception. These models focus on a more comprehensive understanding of how people evaluate noise and vibration in the context of their experience and psychology.
The combined effect of sound and vibration on human perception can be described using various mathematical models, depending on the specific application or research problem. One standard method for analyzing this interaction is to combine the individual effects of noise and vibration using a weighted sum or product.
The presented assessment of the metro vibroacoustic environment employed three distinct approaches. The initial approach is grounded in international standards addressing vibration comfort and noise in rail vehicles individually. The second approach utilizes psychophysical models [
16,
24], and the third one uses a relative measure proposed by the authors. This measure considers the combined effects of vibrations and noise, relying on objective measurements.
3. Results and Discussion
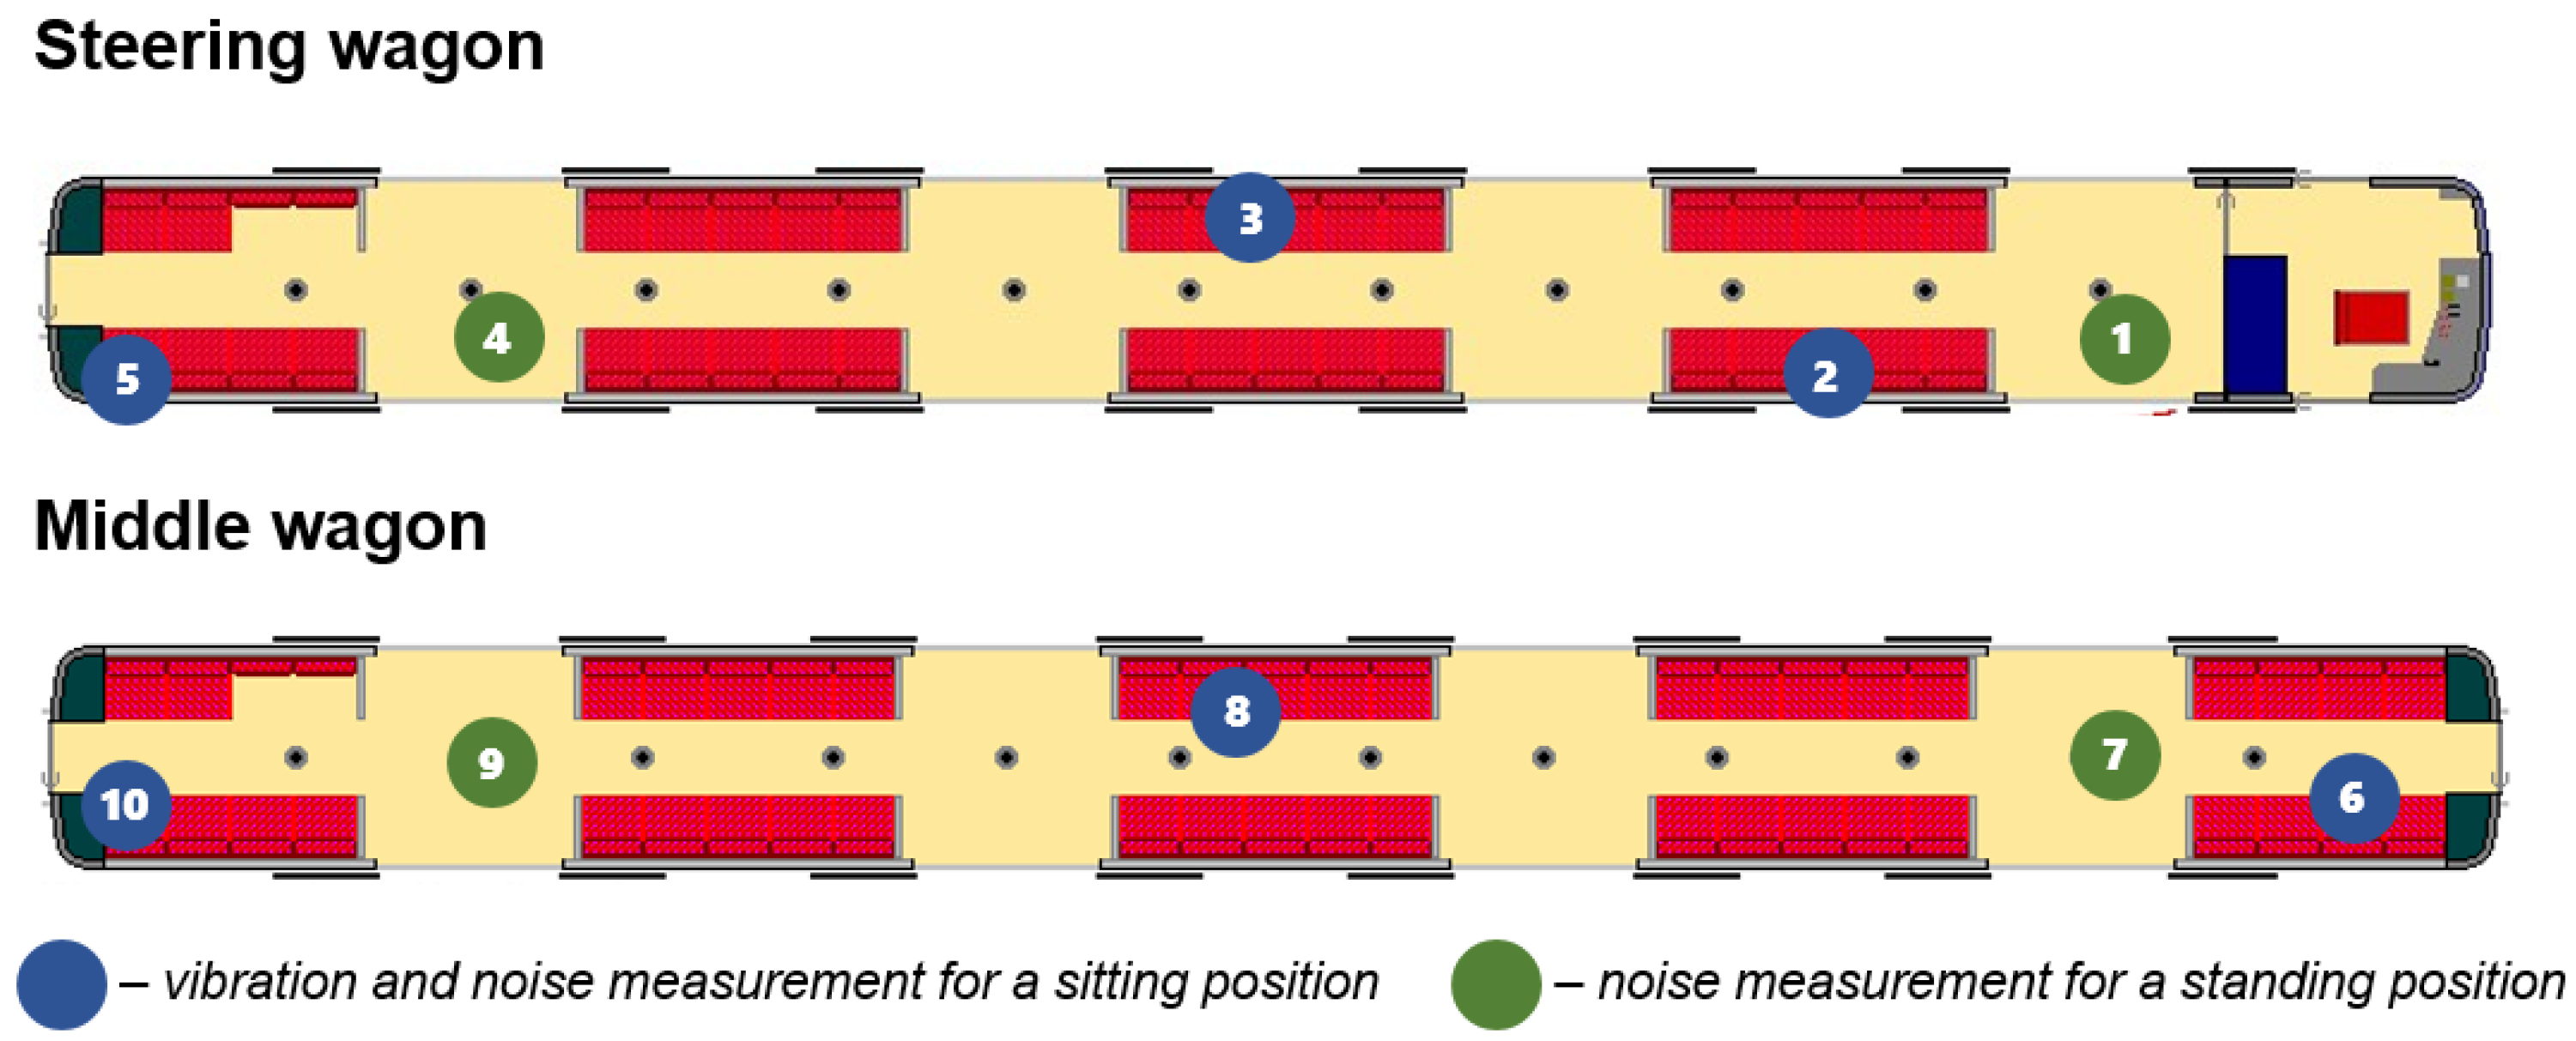
The first part of the analysis is devoted to vibrations, the second to noise, and the last to the overall assessment of the vibroacoustic climate. Measurements at individual points of a given train were performed at intervals while riding in the same section. According to the standards, the noise should be measured separately in the three different phases (acceleration, constant speed, and braking), while the vibration measurement results should refer to all phases combined.
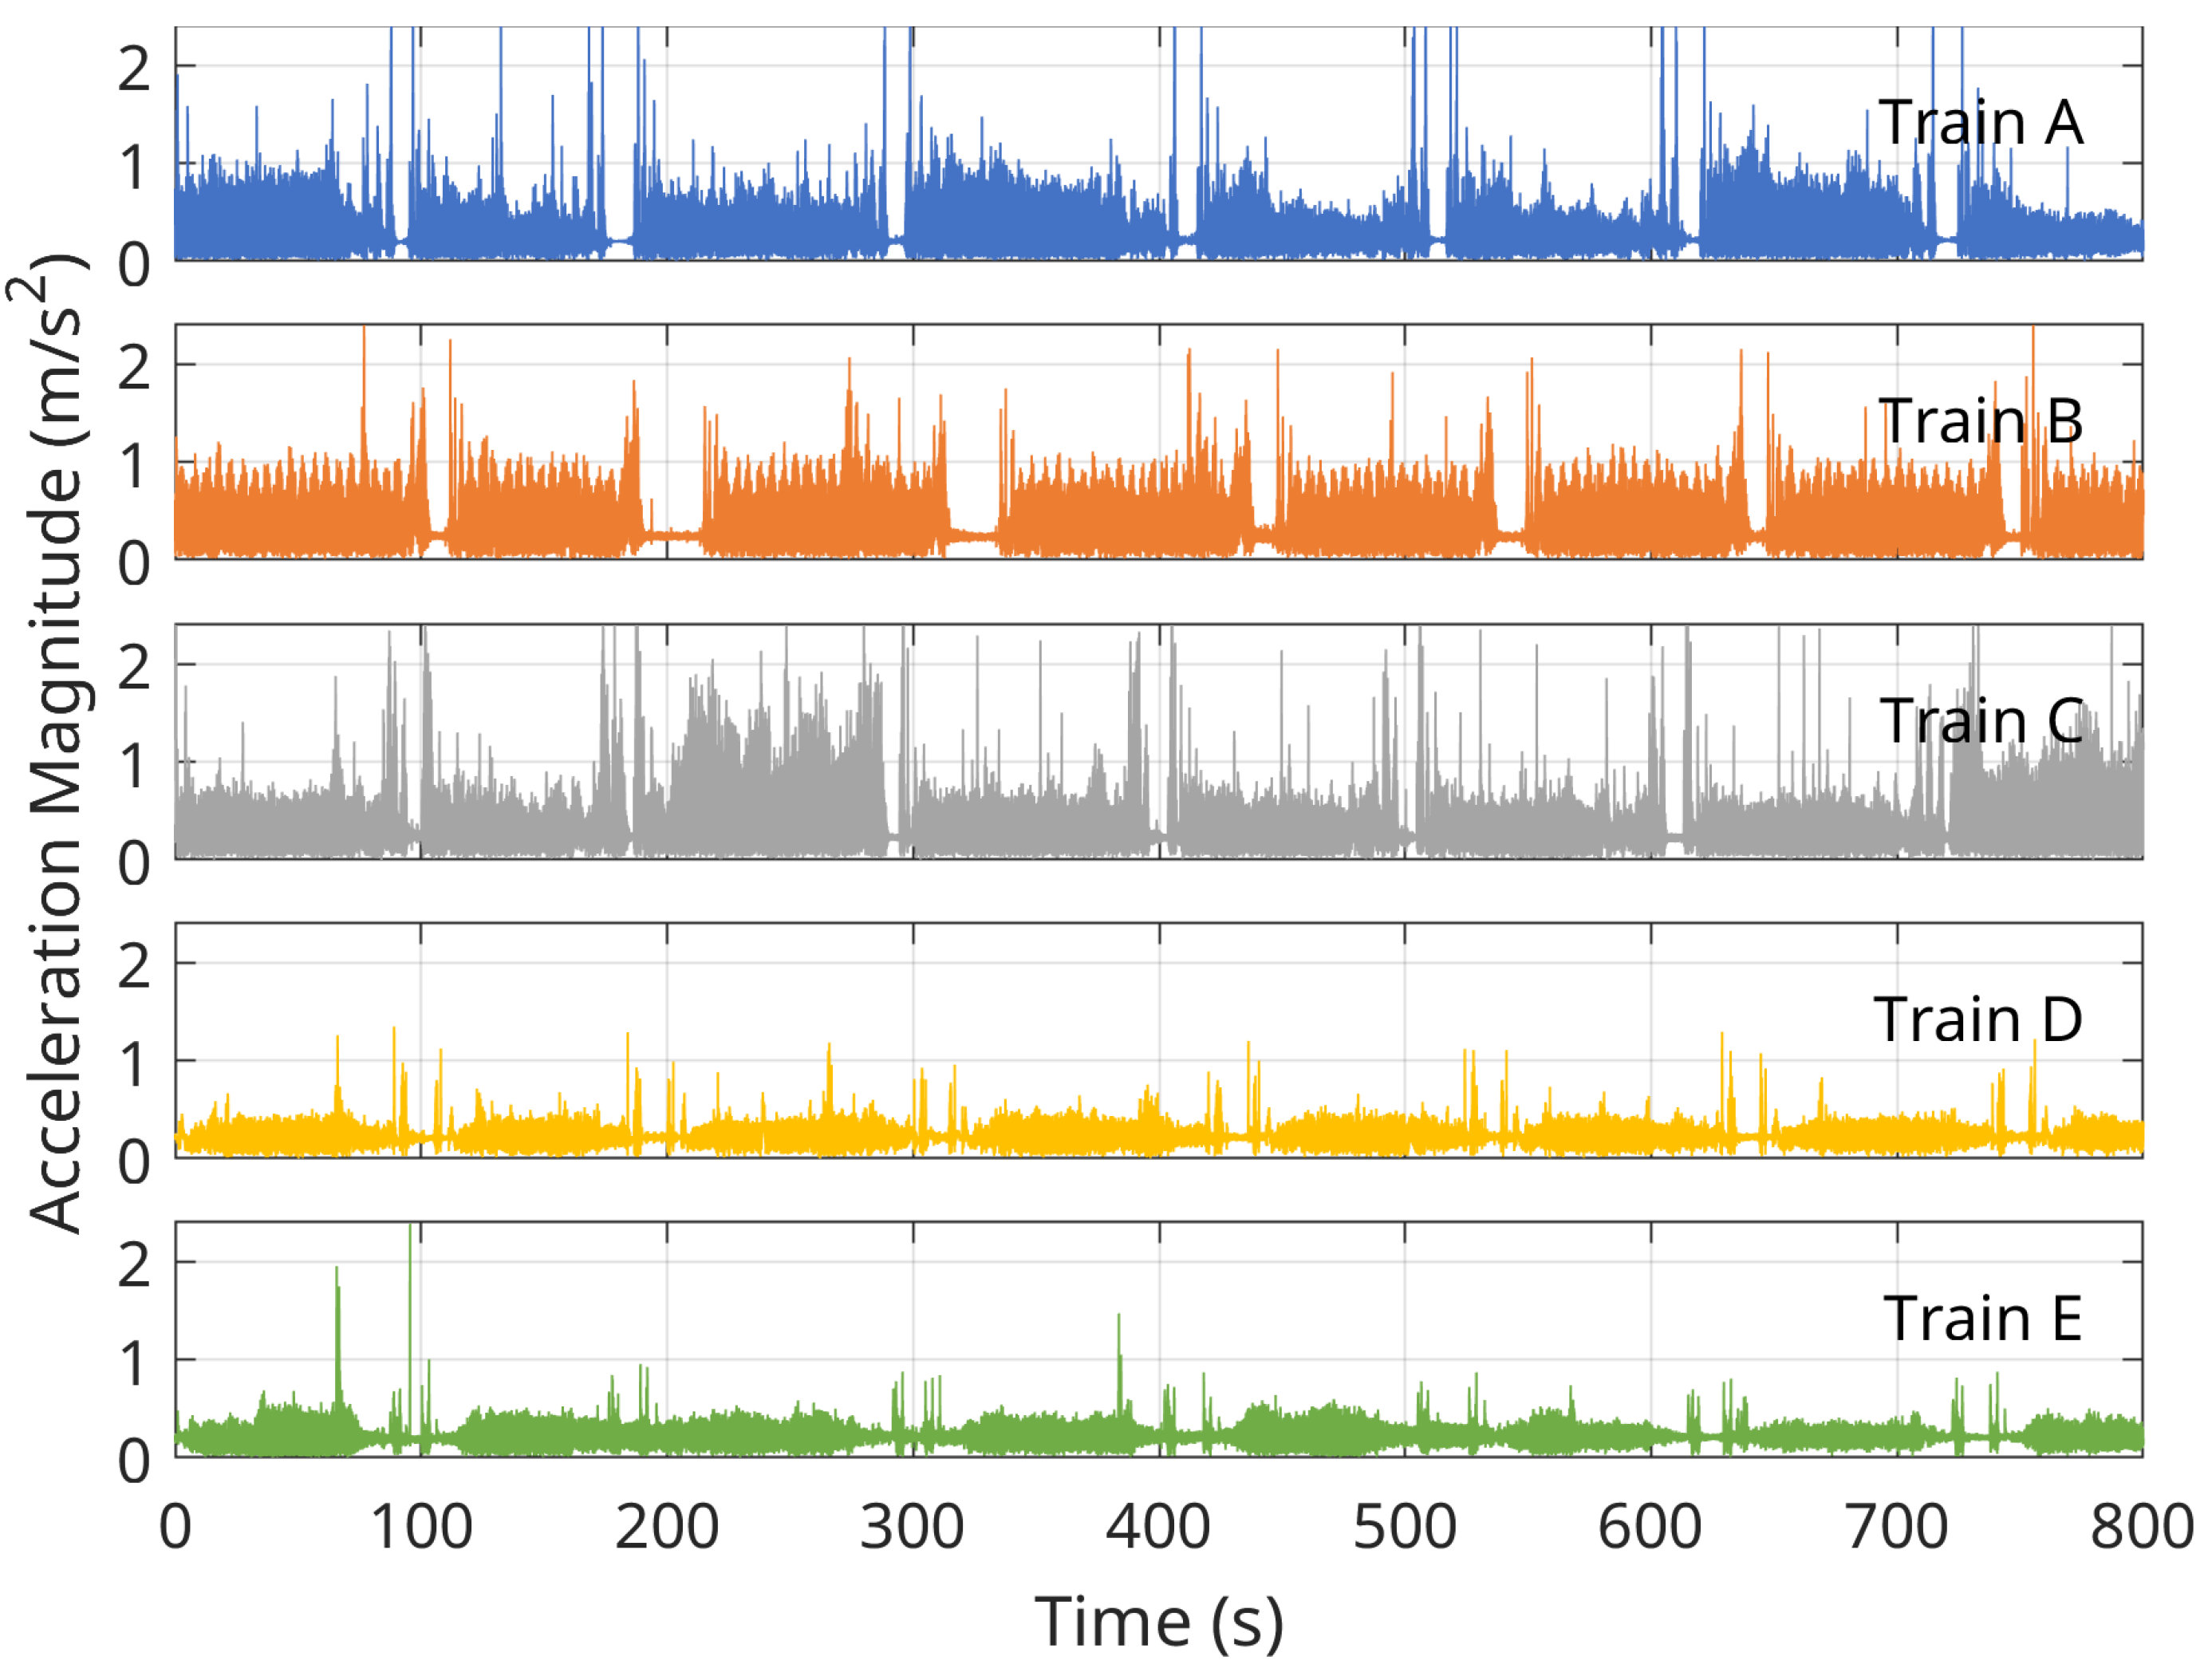
3.1. Vibration
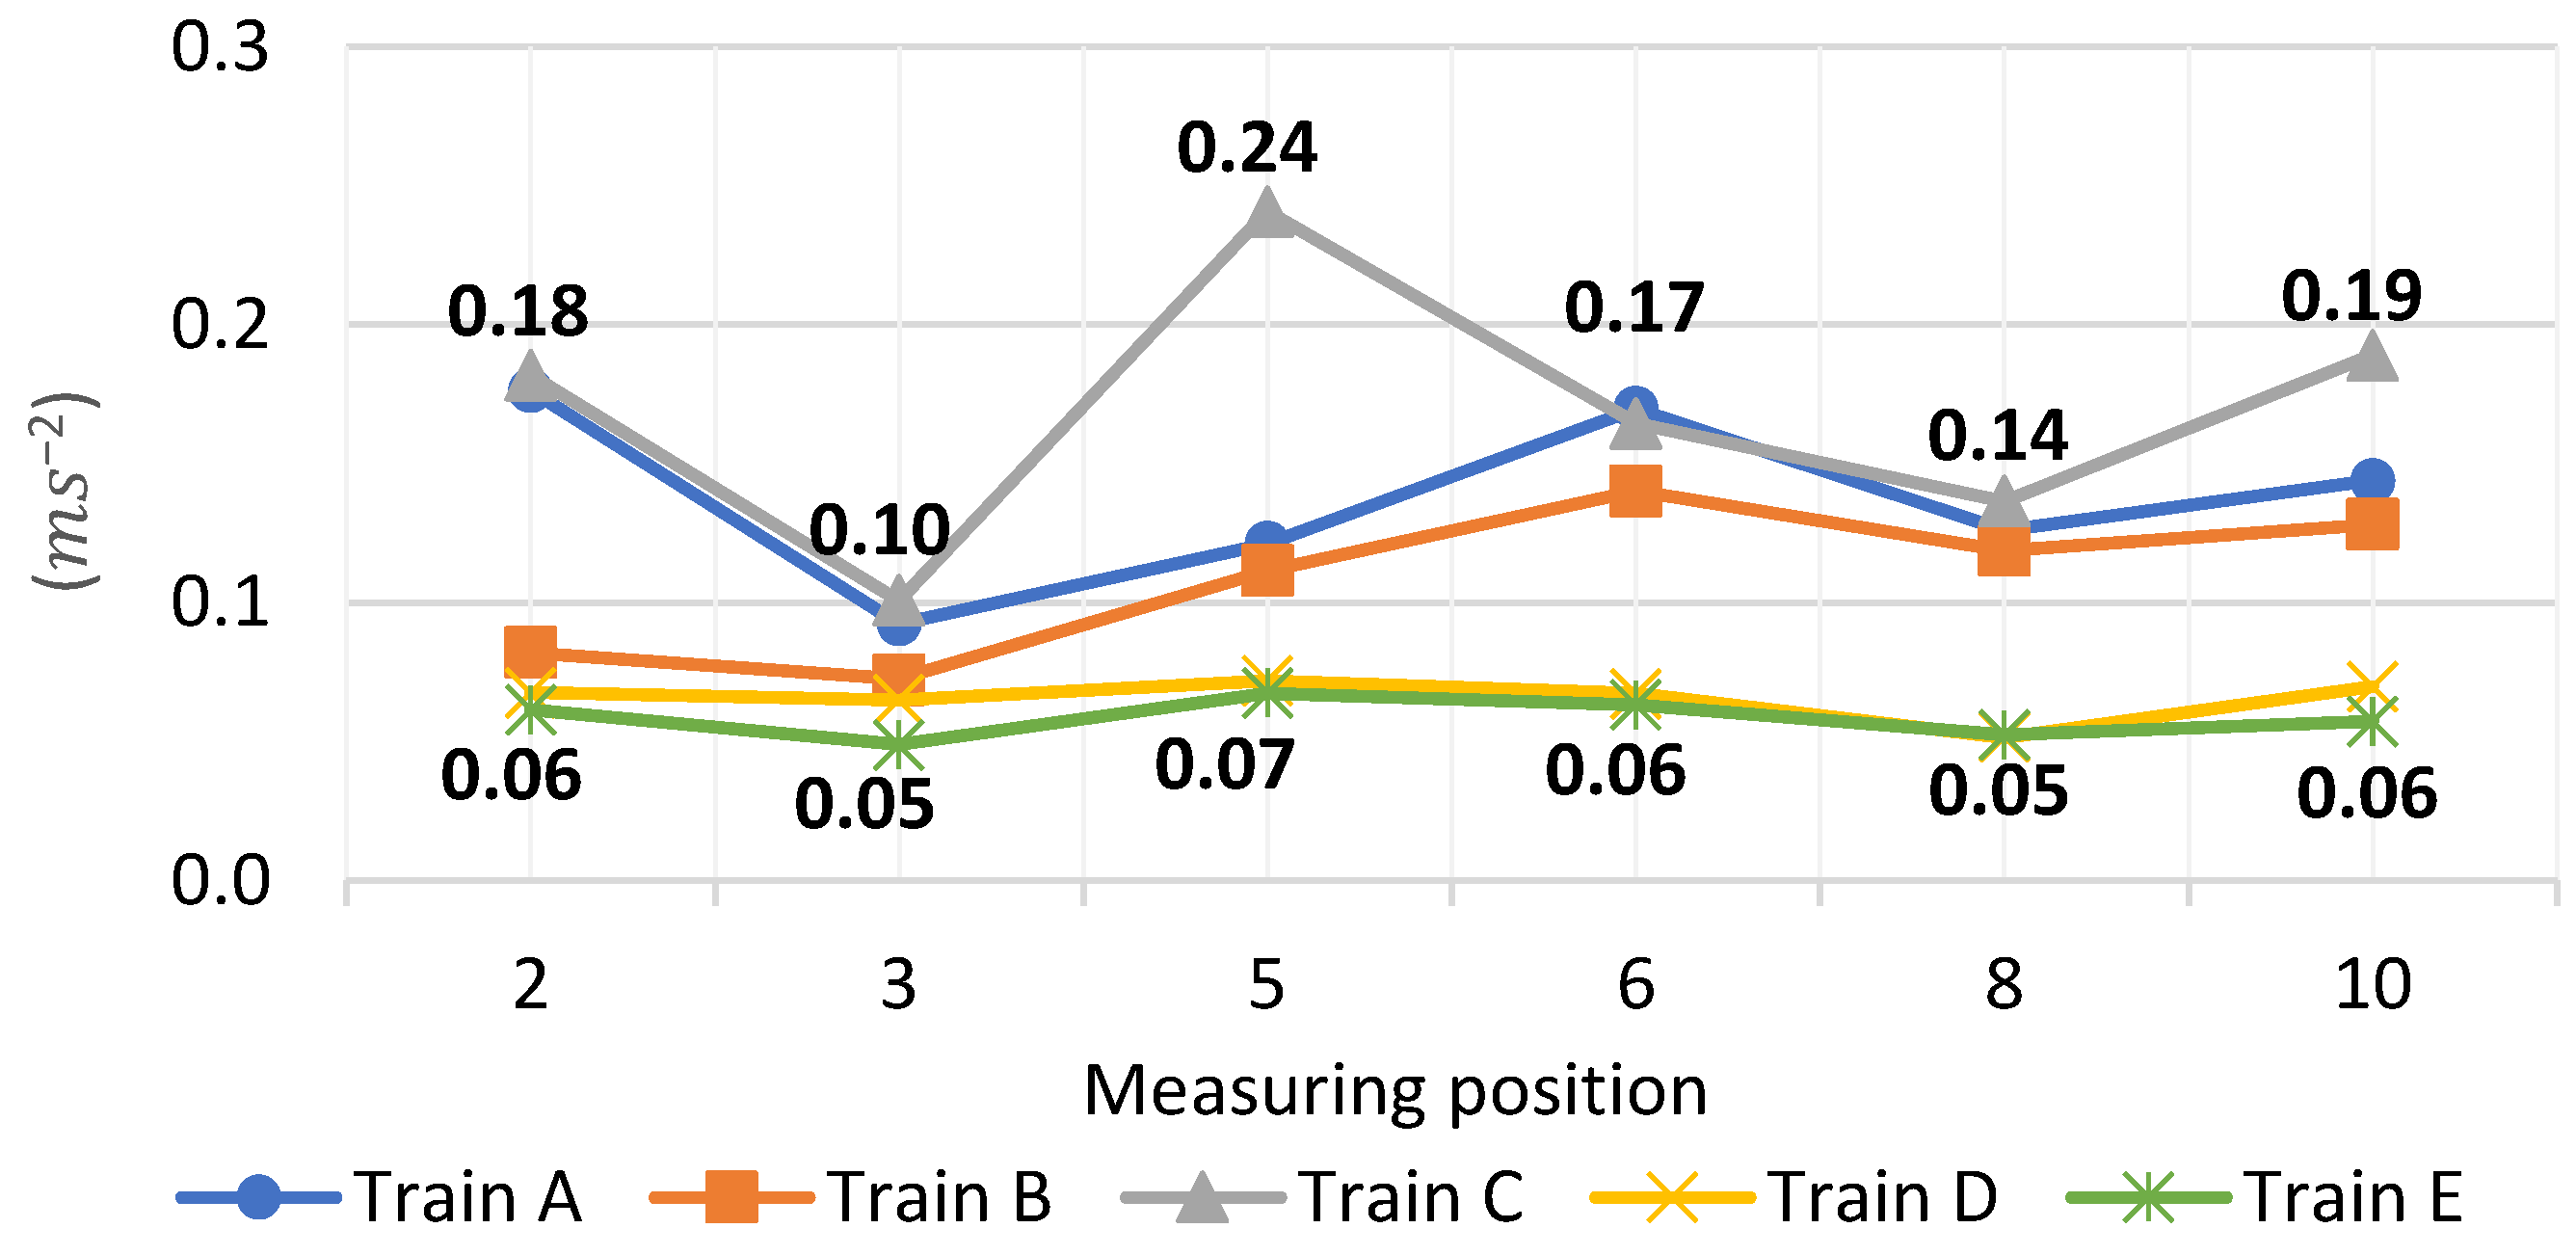
The highest average RMS acceleration of 0.17
was achieved by train C. In five of the six measurement points (2, 3, 5, 8, and 10), this train achieved the highest values of this measure (
Figure A1). In most of these points, train A, with congruent technical specifications to train C, recorded similar parameters, thus taking second place among the highest average RMS acceleration values obtained by the train. The next pair was formed by the latest metro cars, trains D and E, which achieved comparable values at all measurement points, which were the lowest in each case. Train E achieved the lowest average RMS acceleration value of 0.06
, and train D had the second smallest—0.07
.
The weighted RMS values of accelerations in the one-third-octave bands (
Figure 4) did not exceed the permissible values in any of the cases. The highest values were achieved for the vertical direction in the frequency range of 10–60 Hz for the constructions with coil springs in second-stage suspensions. In contrast, the designs with pneumatic springs have lower acceleration levels. The traction rod between train D’s bogie and car body had no adverse effect on the acceleration level relative to other vehicles. In contrast, the other vehicles without traction rods had higher acceleration levels in the horizontal plane direction. In the vertical direction, the train equipped with a traction rod had the lowest acceleration levels measured at the car’s body ends, compared to other vehicles. The levels at the car body center were higher in the 8–25 Hz frequency range but still comparable to B and E trains and less than A and C trains. The absence of a traction rod requires using a traction–torsion device at the bogie pivot, which can generate additional stiffness parallel to the second-stage springing at a level higher than the basic stiffnesses (pneumatic springs only) for the transverse and vertical guides. This may impact passenger comfort, especially with poorer track quality.
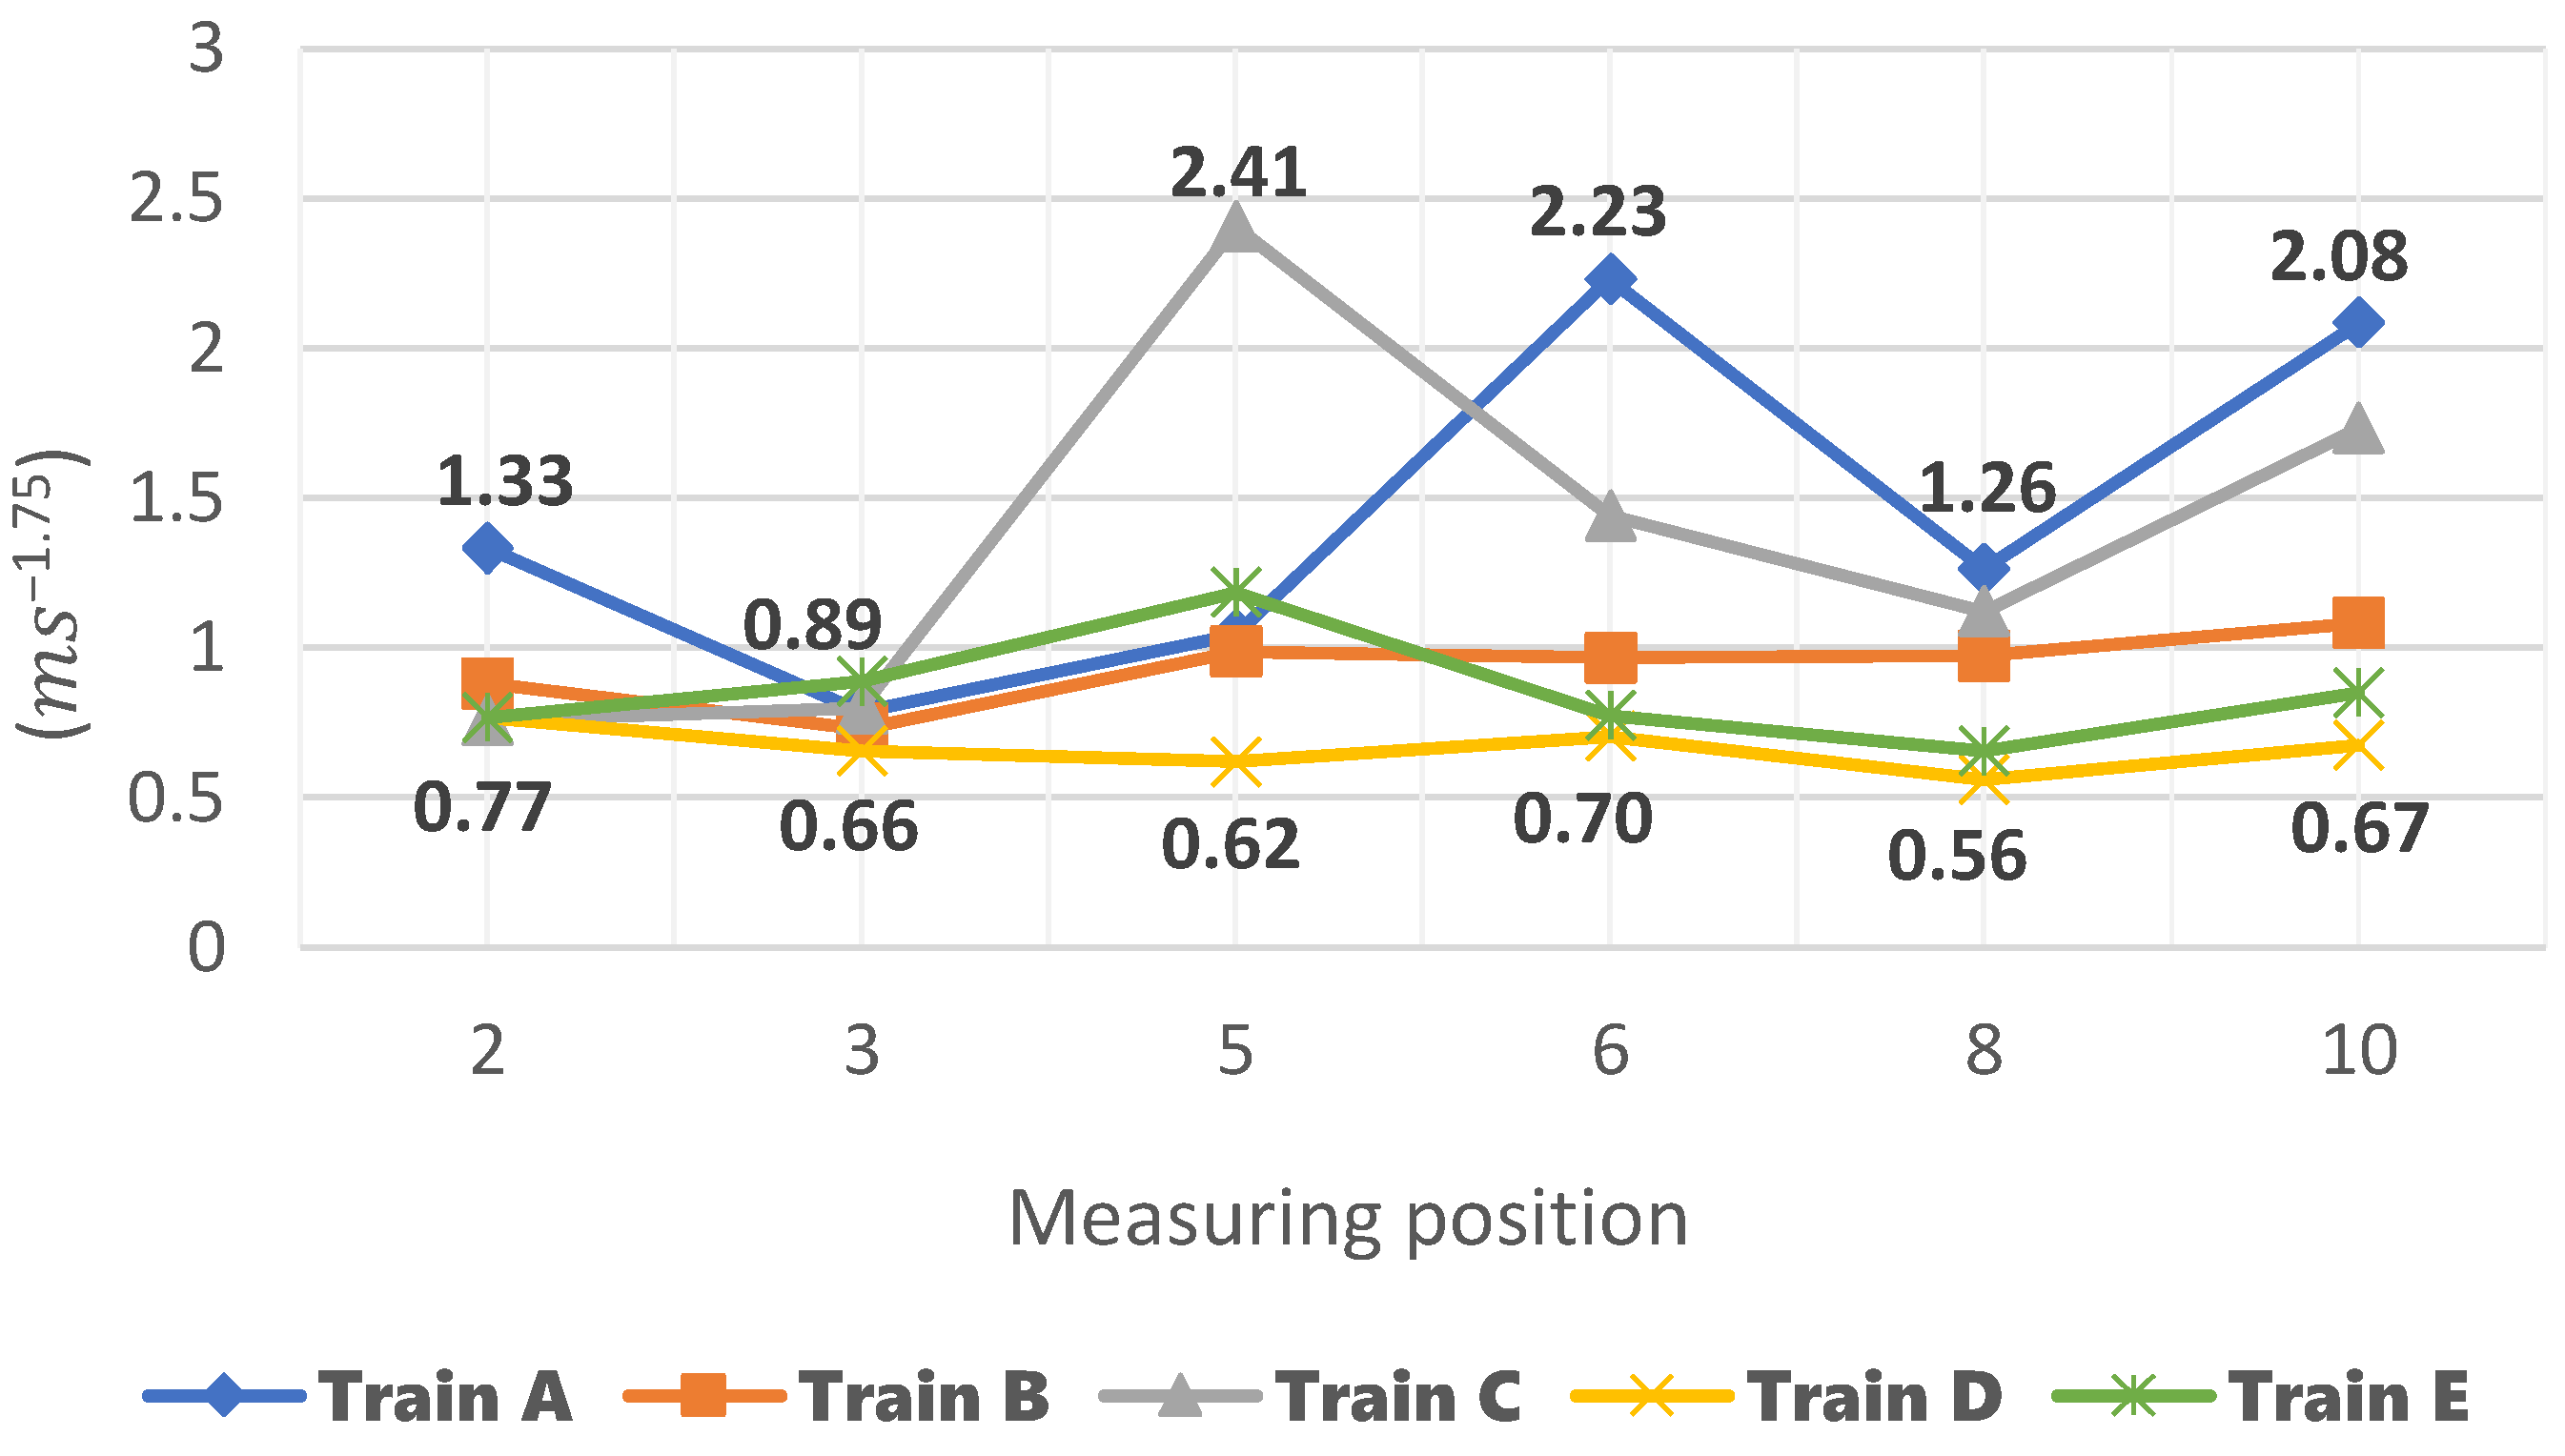
The vibration dose results for the eight-hour work period aligned with VDV vibration doses (
Figure A2) did not exceed the threshold values in any tested cases.
Crest factor values for the “x” direction were consistent across train types, with train D exhibiting the highest value of 13.1 and train B the lowest at 8.9 (
Figure A3a). Train B’s lower crest factor in the first three measurement points was attributed to the absence of a power bogie in its first wagon, reducing vibrations during acceleration and braking. Train D, equipped with fixed bogies, demonstrated higher crest factor values, particularly in curves due to increased resistance. The “z” direction crest factor differentiation was more pronounced (
Figure A3b), with train E recording the highest average value of 40.1. In contrast, train C had the lowest at 10.9, correlating with its lowest values at specific measurement points.
Train D achieved the highest crest factor values in the middle and end of both tested wagons, i.e., at points 3 (16.1), 5 (10.2), 8 (23), and 10 (16.1). Trains A and E recorded similar values at points 3, 5, and 6. The C train has the most similar values at each point. Therefore, the difference between the extreme measured coefficient values was the smallest and amounts to 4, while the largest was 17.2 for train D. The lowest average value of the crest factor in z-direction was achieved by train C (10.9). The average crest factor of train A may be puzzling because, despite the similarities in design to train C, it is over 78% higher and amounts to 19.5. In contrast to the “x” direction, train D had the second-lowest average crest factor score of 13.7, and train B had the highest crest factor value of 21.6.
3.2. Acceleration Phase—Noise
The equivalent sound pressure level (
LAeq) during acceleration in the tested trains ranged from 53.6 dB (point 2) to 70.1 dB (point 7), as illustrated in
Figure A4. The highest average value was achieved by train A (66.3 dB) and the lowest by train D (58 dB) (
Table 3).
Table 3.
Measured noise values (dB) during acceleration (a), braking (b), and riding at a constant speed (c).
These trains recorded extreme values in all measurement places (train A, the highest; train D, the lowest), creating a range for each point. The exception to this rule is the last measurement point because the lowest value of 61.1 dB was recorded for train C. Train A’s results are attributed to resistor-based starting. Interestingly, in each case, the average noise level measured in the first wagon was lower than in the third.
Slightly higher values were recorded for the maximum sound level (
LpAFmax). On average, it ranged from 62.9 dB for train D (
Table 3), through 66.6 dB (train B) and 69 dB (trains C and E), to 71.3 dB for train A. The distribution was similar to
LAeq-measured
LpAFmax values at individual measurement points. Thus, to a predominant extent, trains A and D, again, shaped the range of this coefficient—train A recorded the maximum values and vehicle D the minimum. Again, each vehicle had, on average, higher values measured at points in the third wagon. Trains A, B, C, and E achieved similar values at points 2 and 3. They ranged from 64 dB to 68.6 dB. This is interesting because train D achieved values not exceeding 59.8 dB at both points.
3.3. Constant Speed Phase—Noise
The average values of the
LAeq parameter oscillated around 70 dB (
Figure A5,
Table 3). Three trains achieved values lower than this figure—train D 65.9 dB, train B 67.7 dB, and train C 69 dB. The last two exceeded the 70 dB limit, train E by 1.7 dB and train A by 2.7 dB. As expected, the lowest
LAeq values were obtained in each of the trains at points 3, 5, 6, 8, and 10, i.e., places away from the bogies. Their values range from 58.8 dB to 74 dB and are, on average, higher in the third wagon. In 70% of the measurement locations, train D achieved the lowest values. In the case of train A, the free flow of ventilation in the passenger compartment contributes to the increase in noise level. In 60% of the measurement sites, this train achieved the highest values. Interesting data comes from train E. The differences between neighboring measurement places are the smallest for this train and amount to a maximum of 3.3 dB (points 6 and 7), which indicates the steady level of soundproofing for this type of vehicle.
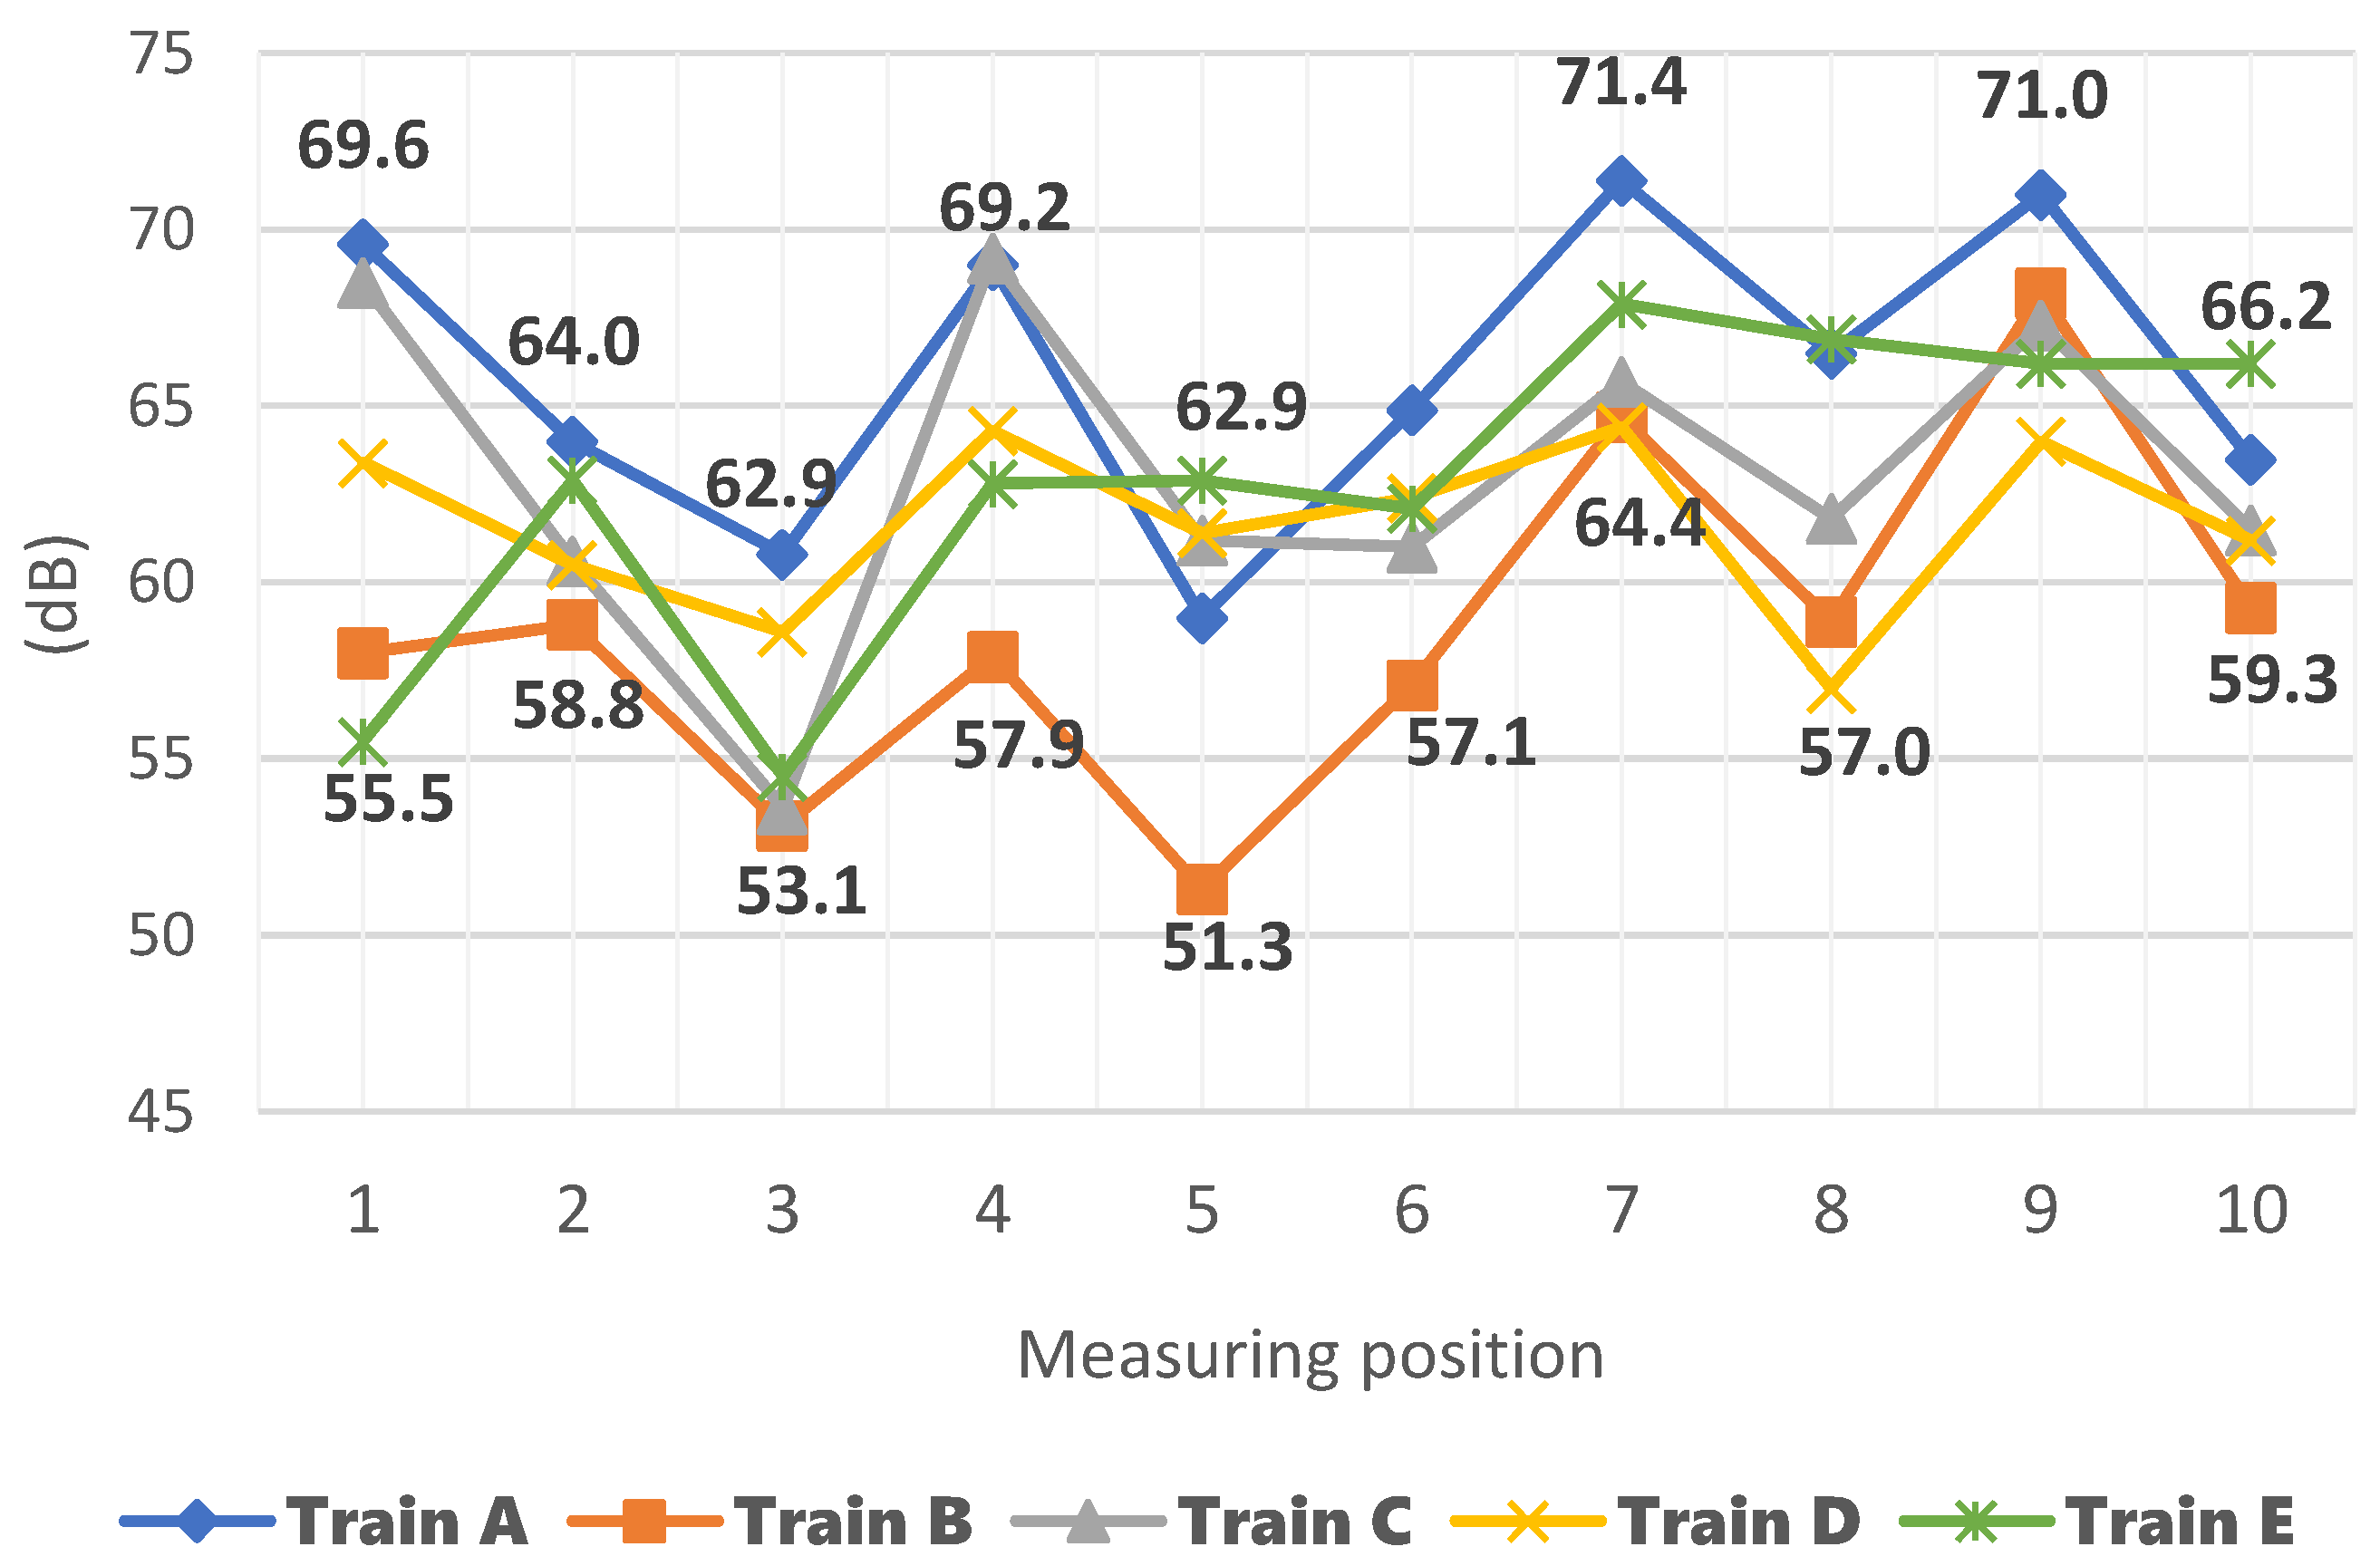
3.4. Braking Phase—Noise
The average values of the equivalent sound pressure level (
LAeq) during braking ranged from 58.7 dB for train B to 66 dB for train A (
Figure A6). Train B recorded the lowest values at six points, while train A achieved the highest values by five times. Vehicle E was the only one to record extreme values at three different points, i.e., at point 1, it achieved the lowest value of all trains, amounting to 55.5 dB, and at points 5 and 10, it achieved the highest values of 62.9 dB and 66.2 dB, respectively. Train D, this time, achieved the lowest values at three points located in the third car. Train A obtained the highest maximum sound level (
LpAFmax) for the braking period, reaching 81.8 dB at point 7, while train D achieved the lowest average value of 66 dB.
3.5. Comparative Assessment of the Metro Vehicles Structure from the Point of View of Recorded Vibrations and Noise
In order to compare the vibroacoustic climate, two different methods were used; the first is Stevens’ psychophysical model [
16] with root-sum-square (RSS) representation [
24], and the second is the authors’ combined relative measure. Stevens’ psychophysical law states that the subjective response increases exponentially with the objective physical magnitude of the stimulus. This can be expressed mathematically as follows:
where
is the subjective quantity,
k is a constant,
is the objective quantity of the stimulus, and
n is the exponent dependent on the stimulus. The stimulus can be any continuum that can affect the human senses, such as the sound intensity, magnitude of vibration, temperature, or luminescence of light. When it comes to noise and vibration, the subjective quantity can be defined as follows:
where
and
represent the subjective magnitude of noise and vibration,
and
are constants for noise and vibration, and
and
are the physical magnitude of noise and vibration with their exponents, respectively. Using this relationship, the subjective magnitude of noise and vibration can be written in logarithmic form as an equation.
Assuming
,
(or
), and
, the follow is true:
The root-sum-square model (RSS) assumes [
24] that the total discomfort caused by combined noise and vibration can be predicted by taking the square root of the discomfort caused by noise alone and vibration alone,
, where
means total discomfort,
is the discomfort caused by the noise itself, and
is discomfort caused by the vibrations themselves. The lower the value of this indicator, the lower the overall nuisance and the better the comfort. A formula was used to evaluate the obtained measurement range:
The second type of comparison was made using the relative measure
[–], where
is the reference value and
is the average value of the
j-th indicator for the
i-th train, determined for a set of
n measurement points in a given train. The reference value
x =
is the maximum value from the set of values of a given indicator
for all trains. It follows that when
x =
y, then
= 0; in any other case,
> 0 when the indicator’s value is lower than the reference level
x. The value
= 0 is the most unfavorable; it means that a given indicator
has taken the maximum value (in the case of the vibration and noise level measures used, the higher the value of a given indicator, the greater the vibration and noise level). The final assessment compares the
values, which are the average value of all relative measures
. The higher the value of this indicator, the lower the overall nuisance and the better the comfort (a higher value means that the values of individual indicators are further from the unfavorable values).
Table 4.
Final evaluation of the results obtained.
It is interesting to note the consistency of the results between the individual vibration and noise measurements (international standards) and the combined vibroacoustic measurement (
Fc, Steven’s metrics), as presented in the paper. There appears to be a general agreement between the two sets of results, with train D being the most comfortable according to individual and combined metrics while train A was the least comfortable for both metrics. However, it should be noted that the production dates of each train type vary significantly: A-train-type production started in 1976, and D-train-type production started in 2012; hence, there is a vast technological gap between their constructions, and they can be considered extreme cases. On the other hand, according to individual metrics, train B, produced in 1997, subsequently reached the second lowest noise level (
LAeq) and third lowest vibration level (VDV and RMS). Train E reached the fourth lowest noise level (
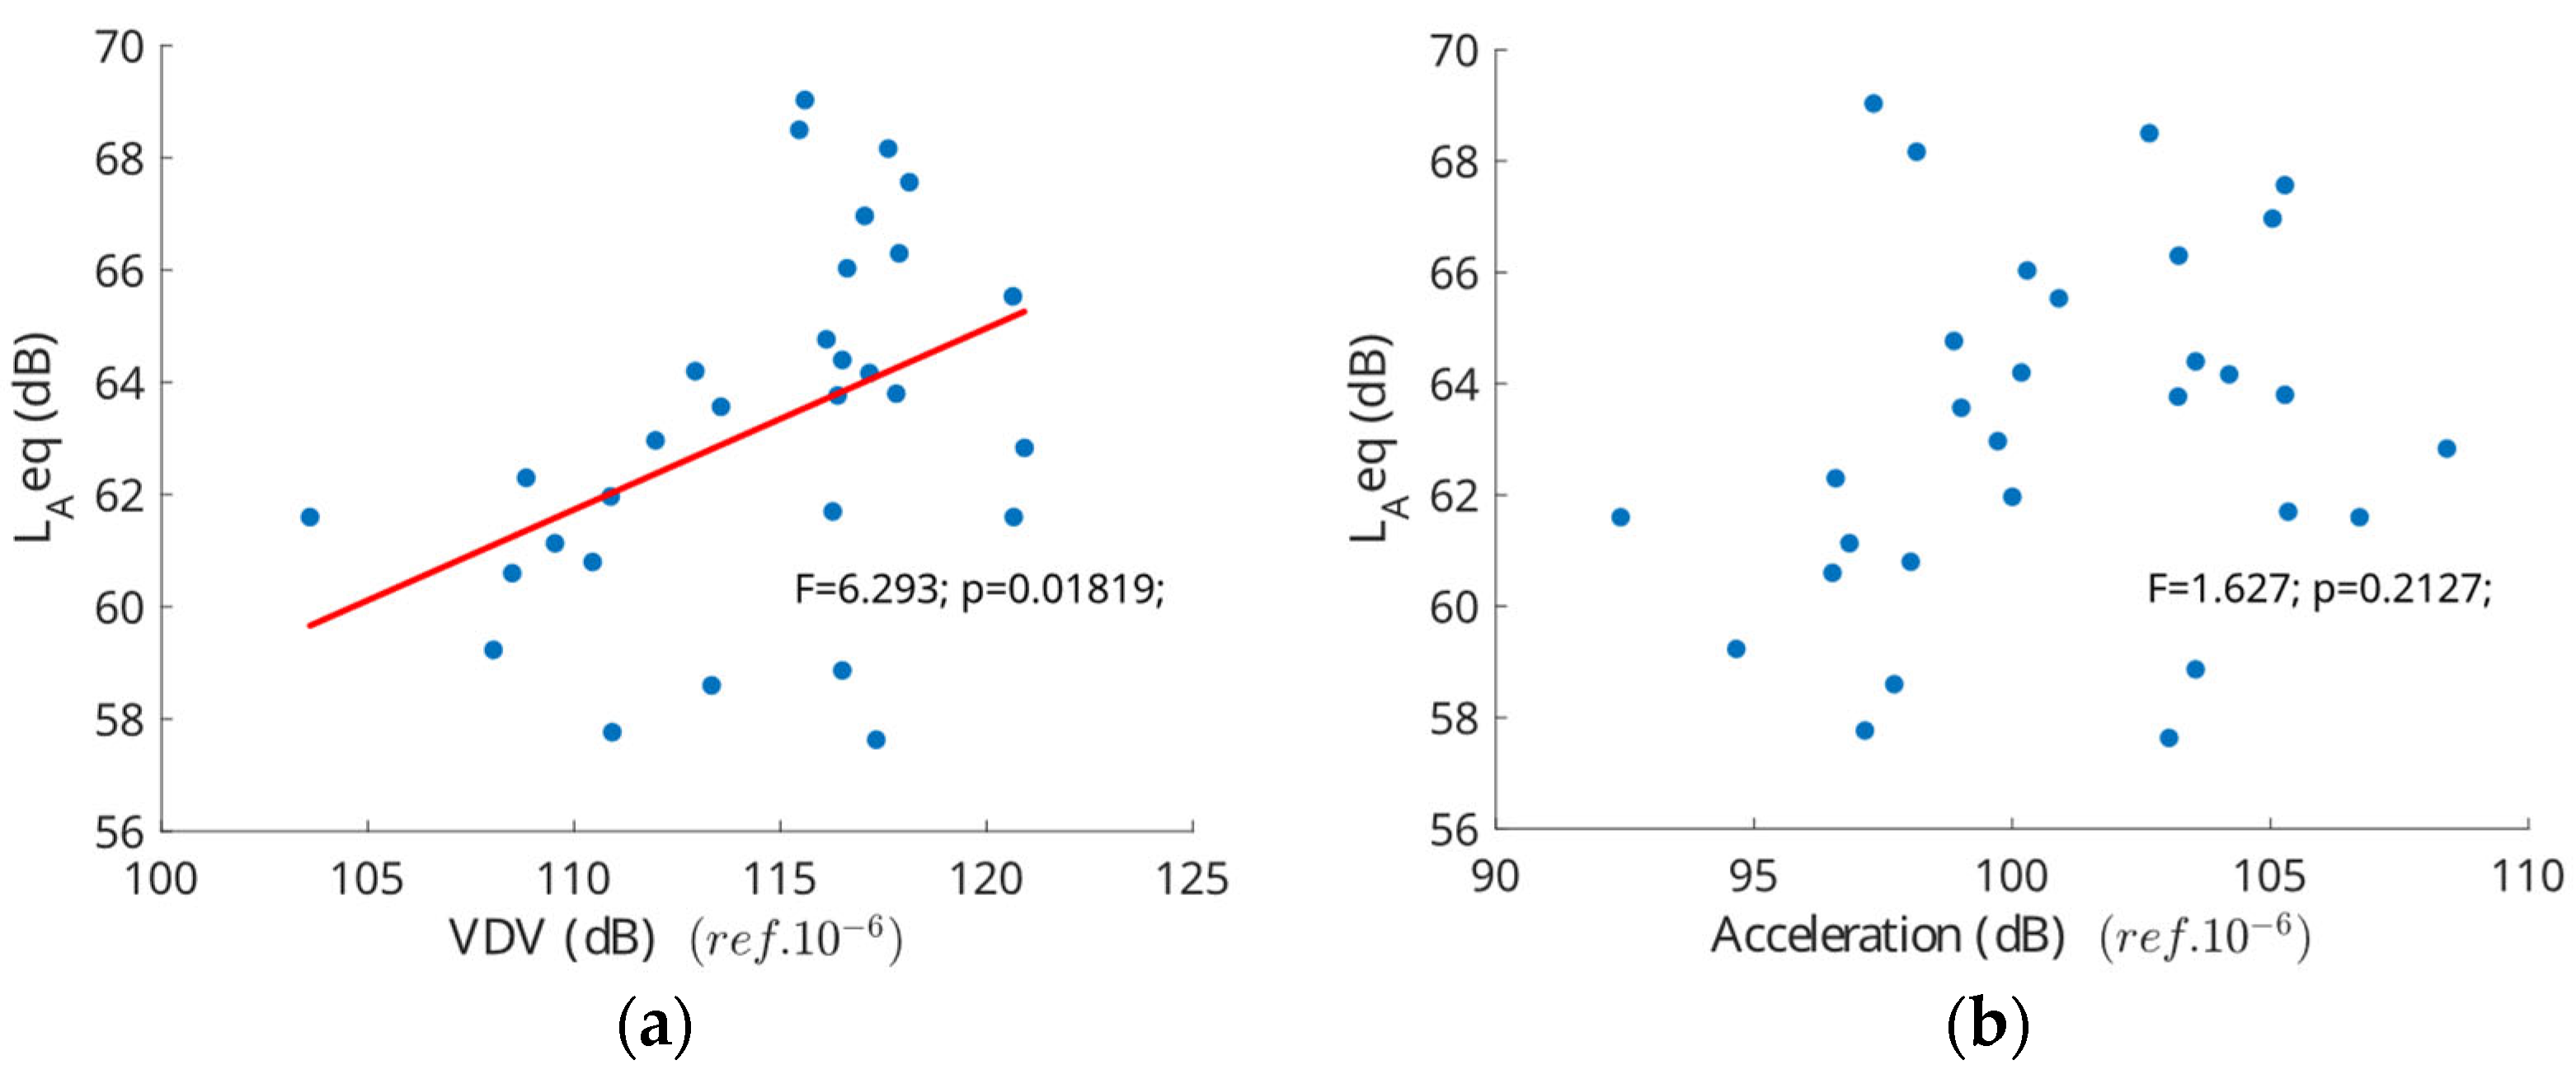
LAeq), first lowest RMS level, and second lowest VDV level. It would not be obvious to rank these trains based solely on their performance in the international standards until we use combined metrics. However, the combined metric might not always lead to significant variations from what one would expect based on the individual measurements alone due to the strong physical correlation between vibration and noise. They are closely related phenomena in rail transport, as they often have common sources and can interact. In the presented case of noise and vibration measurements, a statistically significant relationship (
p-value = 0.018, alpha = 0.05) can be observed between the equivalent noise level and vibration dose (
Figure 5a) with a moderate positive linear relationship (Pearson correlation coefficient PCC = 0.43). Compared to VDV,
LAeq is less sensitive to peaks and more focused on overall energy, whereas VDV emphasizes high-intensity peaks due to its fourth power integration. RMS provides an average power measure and is less sensitive to peaks than both VDV and
LAeq, focusing on the effective value of the signal. Each metric is designed to capture cumulative effects in their respective domains, with varying sensitivities to fluctuations and peaks in the data.
The cross-correlation between the signals is very low in the range of measured frequencies (sampling rate 2000 Hz for vibration and 48 kHz for noise). At the same time, a high correlation was observed between the vibration acceleration signals themselves, regardless of the measurement location and wagon type, and a low correlation between the acoustic signals themselves (
Table 5).
Table 5.
Normalized cross-correlation for sound and vibration signals at three locations across the wagon (3—wagon center; 2, 5—wagon ends; V—vibration, S—sound measurement).
Table 5.
Normalized cross-correlation for sound and vibration signals at three locations across the wagon (3—wagon center; 2, 5—wagon ends; V—vibration, S—sound measurement).
| Vibration–Sound |
| location | S-2 | S-3 | S-5 |
| V-2 | 0.02 | 0.06 | 0.07 |
| V-3 | 0.02 | 0.06 | 0.07 |
| V-5 | 0.01 | 0.05 | 0.05 |
| Vibration–Vibration |
| location | V-2 | V-3 | V-5 |
| V-2 | 1.00 | 0.91 | 0.87 |
| V-3 | 0.91 | 1.00 | 0.87 |
| V-5 | 0.87 | 0.87 | 1.00 |
| Sound–Sound |
| location | S-2 | S-3 | S-5 |
| S-2 | 1.00 | 0.11 | 0.11 |
| S-3 | 0.11 | 1.00 | 0.10 |
| S-5 | 0.11 | 0.10 | 1.00 |
Only two wagons in each train were tested, with train B being the only one with a steering wagon. The newest train, train E, achieved values comparable to train C in every noise category. Despite considerable design similarities between the A and C series of trains, trains C performed better than trains A. Trains A recorded the highest average values for both vibrations and noise. Noteworthy is the significantly increased CF value for the vertical vibration signal of train E. Considering that this is a new vehicle and the other indicators are at acceptable levels, this may mean that the dynamic systems in the new vehicle, such as suspension systems or braking systems, adapt and undergo specific changes during the initial period of operation. Initial factory settings and calibrations can be refined during subsequent operations.
From the acoustics point of view, the condition for admitting any rail vehicle into operation is that the vehicle only meets standards related to external noise emission. Issues related to assessing noise inside rail vehicles, except noise in the workplace, are often ignored [
35,
36]. The technical specifications for interoperability relating to the “Rolling Stock—Noise” subsystem were adopted as a reference point for permissible noise levels in rail vehicles [
37]. Some studies suggest even higher values for an acoustically comfortable metro interior space [
38].
4. Summary
While individual factors and their impact on passenger comfort have been extensively studied, their combined effect needs to be more pronounced. Each approach offers unique advantages and limitations. For instance, international standards provide a solid foundation for evaluating vibration comfort but may only capture part of the full scope of passenger perceptions and preferences. The advantage of psychophysical models is that they provide insights into how humans perceive and respond to vibrations and noise in transportation environments. This information can be valuable for designing vehicles that minimize discomfort and improve passenger experience. However, they rely on subjective data from human participants, which can vary between individuals and may not represent the entire population. Additionally, psychophysical tests can be time-consuming and expensive to conduct. The combined relative measures also offer advantages and limitations. The advantage of the combined metric is that it provides an objective measure of the overall nuisance resulting from the combined effect of vibration and noise, making it helpful in comparing trains systematically and quantitatively. However, using combined measures requires careful consideration when selecting appropriate comparison criteria, as different factors may not be directly comparable due to varying units or scales used in measuring them.
The highest average values of the equivalent and maximum sound pressure levels, corrected by filter A, occurred during the constant speed phase. The observation is consistent for all the measured vehicles (five train types, two wagons in each train;
Table 3). The signals were recorded while driving at the normal service speed at the same track section between two stations. A possible explanation is that trains traveling through the tunnel in the opposite direction influenced the noise level measured. This section of the tunnel is constructed in such a way that the distance between the track axes is approximately 4.7 m. Comfort limits for vibrations (ISO 2631-1) and noise (TSI standard) were consistently within acceptable ranges. Passenger-generated noise and driver techniques significantly impact recorded differences in results. During measurements on trains E, where drivers were still improving their skills, the operation was not consistently smooth. Vibration and noise values during constant speed and braking depend on the measurement location, with higher values above the bogie and lower values between them. During acceleration, noise levels in a given wagon remain similar in different measurement locations. However, the first carriage is usually quieter than the third. The manufacturer’s use of rolling bogies positively influences vibration reduction during speed changes, though it has negligible influence when traveling at a constant speed.
Despite receiving positive evaluations in either vibration or noise categories, a specific vehicle might have a less favorable overall rating for vibroacoustic nuisance when considering the combined effects of vibration and noise. Noise levels in metro vehicles exhibit variation based on the train type. Vehicle D emerges as the quietest during constant speed and acceleration, while train B achieves the best average result during braking. Using non-rotational bogies in vehicle D did not impede its excellent vibration results, recording the lowest average vibration dose.
Based on data from all the trains, a statistically significant relationship can be observed between the equivalent noise level and vibration dose with a moderate positive linear relationship (PCC = 0.43).
Newer trains generally record significantly lower vibration and sound levels (
Table 4). The difference between the oldest (A) and the most modern (E) vehicle type is 57% for the vibration acceleration level (0.08
RMS) and 66% for the noise level (2.2 dB
LAeq). The difference is due to several factors. Newer models feature more advanced suspension systems, superior acoustic insulation, improved aerodynamics, and more efficient and quieter propulsion and braking systems, all contributing to reduced noise and vibration levels.


