Article

Suitable Model for Rehydration of Dried Red Beets: Effect of Solid-to-Liquid Ratio on Rehydration Characteristics

by
Agnieszka Kaleta
1,
Krzysztof Górnicki
1,*,
Marko Obranović
2 and
Krzysztof Kosiorek
1
1
Institute of Mechanical Engineering, Warsaw University of Life Sciences—SGGW, 164 Nowoursynowska Street, 02-787 Warsaw, Poland
2
Department of Food Engineering, Faculty of Food Technology and Biotechnology, University of Zagreb, 6 Pierottijeva Street, 10000 Zagreb, Croatia
*
Author to whom correspondence should be addressed.
Appl. Sci. 2024, 14(14), 6132; https://doi.org/10.3390/app14146132
Submission received: 8 June 2024 / Revised: 12 July 2024 / Accepted: 12 July 2024 / Published: 15 July 2024
(This article belongs to the Special Issue Food Preservation and Analysis: Technologies and Applications)

Abstract

:
Rehydration of food products was carried out in various amounts of liquid. The effects of the solid-to-liquid ratio on rehydration characteristics of dried red beets were investigated. Six values of the solid-to-liquid ratio (1:20, 1:15, 1:10, 1:5, 1:3, and 1:1) were taken into consideration. Red beets cubes (10 mm) were dried in a forced convection (2 m/s; 60 °C) and then rehydrated in distilled water at a temperature of 20 °C. The kinetics of mass gain, dry matter loss, water gain, moisture content increase, and volume increase were modeled using the empirical Peleg model which parameters have physical meanings. Equations were formulated to make the Peleg model parameters dependent on the solid-to-liquid ratio. The obtained results indicated that the amount of rehydrating water influenced the values of the model parameters and the course of dried red beets rehydration and helped explain the rehydration kinetics. The Peleg model can be recommended for describing the kinetics of mass gain (R2 = 0.9662–0.9895), dry matter loss (R2 = 0.7042–0.9881), water gain (R2 = 0.9732–0.9913), moisture content increase (R2 = 0.9770–0.9929), and volume increase (R2 = 0.9374–0.9847) during the rehydration of dried red beet cubes at all considered values of the solid-to-liquid ratio.

1. Introduction

Nowadays, questions connected with food products, storage, and processing attract public attention. Such a situation is caused by the growing standard of people’s living [1]. Contemporary lifestyle patterns influence eating habits. Today, people willingly eat instant food, because it does not need a long time for cooking or reconstitution before consumption. The most often applied method of the reconstitution of instant food is adding such liquid as water, milk, or broth [2].
Rehydration consists of a number of simultaneous processes. At the beginning, water penetrates into solid particles; then, liquid transfers between pores and penetrates into the solid matrix. At the same time, the particles disperse into the liquid. The solid particles swelling is also an important process which accompanies the rehydration [3].
The ability of dried food reconstitution depends on the extent of damage caused to the cellular structure of the dried product after different treatments to which instant food is exposed, mainly pre-drying treatments, drying, and rehydration [4,5,6].
There are a large volume of scientific papers describing the influences of different conditions of discussed treatments on rehydration kinetics of food products. Some examples are discussed below.
Wang et al. [7] reviewed the factors influencing the dehydration−rehydration mechanism of vegetables. The authors found that the structure and composition of the cell membrane and the cell wall are the most important factors affecting the drying and rehydration of plant tissue. Integrity and permeability of the cell membrane affect water transport during the dehydration and rehydration processes. The arabinan side chains of the primary structure and fibers are important for water retention, whereas cell membrane disruption increases the drying rate. It can therefore be concluded that choosing the appropriate treatment methods allows for achievement of high-quality processed vegetables. Zhang et al. [8] studied the effect of the porous structure of dried rice noodles on their rehydration and stated that this structure influences the time of rehydration and the amount of water needed for rehydration.
Different amounts of liquid were taken to process of rehydration. Table A1 presents the solid-to-liquid ratio (mass of the sample/mass of the liquid) applied in the rehydration process of the dried product. It can be seen that the volume of the discussed ratio varied from 1:333 to 1:0.512. The authors rarely explained why such amounts of liquid were taken during investigations. Ravindra and Chattopadhyay [9] defined one of the rehydration characteristics as the optimum cooking time. The optimum value was determined as the minimum time needed for the potato cubes to become soft while boiling 5 g of the dried product in 100 mL of water. Falade and Abbo [10] applied the value of the date palm fruit-to-distilled water ratio of 1:25 to minimize the influence of leaching at the process of rehydration. Rojas and Augusto [11] immersed 3 g of dried pumpkin cylinders in 1 L of distilled water in order to avoid limiting the course of rehydration because of water availability. There is also little information about the influence of the solid-to-liquid ratio on rehydration characteristics of the dried food product and, to the best of our knowledge, no information about this question for dried red beets.
Red beet plantations are present in many places of the world. Edible red beet roots contain typically 4–12% of carbohydrate, 1.5% of protein, 0.8% of fiber, many important minerals (calcium, iron, magnesium, and potassium), phenolic acids, and vitamins (A, B, and C). Beetroots are rich in betanines having antioxidant capacity. Red beets may help in improving digestion and blood quality and also in protecting against cardiovascular diseases and cancer [12,13,14].
Taking what was written above under consideration, the aims of the present investigations were shown as follows:
  • To determine the effect of the solid-to-liquid ratio on rehydration characteristics of dried red beets (mass gain, dry matter loss, water gain, moisture content increase, and volume increase);
  • To fit the experimental rehydration data achieved to the Peleg model widely applied to describe rehydration kinetics of food products;
  • To investigate the effect of the solid-to-liquid ratio on the Peleg model parameters which have physical meanings and helped explain the rehydration process.

2. Materials and Methods

Red beets (var. Wodan F1) were procured at a Warsaw market. High-quality and fresh lots were taken. Roots initial moisture content was ca. 91% w.b. (10.1 d.b.). Just before drying, the red beets were washed, peeled and cut into cubes of 10 mm thickness. The drying process was carried in a tunnel dryer. The conditions for drying were as follows: velocity (2 m/s), temperature (60 °C), and time (360 min). After drying, the moisture content of the dried red beets was approximately 9% w.b. (0.1 d.b.). The tunnel dryer is located in the Department of Fundamentals Engineering and Energy, Warsaw University of Life Sciences, Warsaw, Poland. The applied equipment and method of conducting the drying experiments have been described in our paper [15]. The dried red beets (the same drying conditions; three independent experiments) were mixed and then stored for further analysis in a sealed container for seven days at a temperature of 20 °C.
The rehydration of the dried red beets cubes was carried out in distilled water at a temperature of 20 °C. The liquid was static, and its temperature remained constant during the rehydration. The process lasted 6 h. The initial mass and volume of the dried red beets cubes used in experiments were ca. 10 g and 10 cm3, respectively. The solid-to-liquid ratios (dried red beets-to-distilled water ratio) at the beginning of the experiments were 1:20, 1:15, 1:10, 1:5, 1:3, and 1:1 (w/w).
  • Mass determination
The rehydrated cubes mass m (in g) was measured with the WPE 300 scale (RADWAG, Radom, Poland). The accuracy of measurements was ±0.001 g.
  • Dry matter determination
The dry matter md.m. (in g) was determined in accordance with the AOAC method [16].
  • Mass of water determination
The mass of water in rehydrated cubes (in g) was determined from the following formula:
m w = m m d . m .
  • Moisture content determination
  • Moisture content M (in dry basis) was calculated applying Equation (2):
M = m m d . m . m d . m .
  • Volume determination
The rehydrated cubes volume V (in cm3) was calculated according to the buoyancy in petroleum benzene with a relative error not higher than 5% [17]. The initial volume of dried red beets cubes used in experiments was ca. 10 cm3.
Experiments were repeated three times.
The Peleg model [18] was chosen to describe the kinetics of dried red beets cubes’ rehydration.
The mentioned model is presented by Equation (3):
X = X 0 ± t A 1 + A 2 t
where X0 is the initial value of the variable, t is the time, and A1 and A2 are the constants.
The variable X describes the following value: rehydrated cubes mass (m in g), rehydrated cubes dry matter (md.m. in g.), mass of water in rehydrated cubes (mw in g), rehydrated cubes moisture content (M in d.b.), and rehydrated cubes volume (V in cm3).
It turns out from Equation (3) that when rehydration is conducted long enough, i.e., t→∞, the equilibrium value Xe can be determined from the following formula:
X e = X 0 ± 1 A 2
In Equations (3) and (4), the minus sign is applied for the dry matter.
The Peleg model belongs to empirical models, but its constants A1 and A2 have physical meanings. Constant A1, the Peleg rate constant, describes the rate of water absorption especially at the beginning of rehydration. Constant A2, the Peleg capacity constant, enables the prediction of the maximum capacity of water absorption. The discussed model has been very often taken for predicting the kinetics of dried biological products’ rehydration. Lately, the Peleg model gave satisfactory results in describing the rehydration of dried apple slices [19], rice noodles [8], orange slices [20], pumpkin slices [21], sweet corn [22], and tomatoes [23].
The significance of the influences of the solid-to-liquid ratio on the rehydration characteristics of dried red beets (mass gain, dry matter loss, water gain, moisture content increase, and volume increase) was determined using the ANOVA technique (the Levene test (homogeneity of variances) and Tukey’s HSD test (α = 0.05)). Rehydration data of dried red beets cubes obtained from experiments were fitted (the Levenberg–Marquardt algorithm) to the Peleg model. The Statistica 13 (TIBCO Software Inc., Palo Alto, CA, USA) software was used for this task. The coefficient of determination R2 and the root mean square error (RMSE) were applied as statistical criteria for determining the suitability of the Peleg model for describing the rehydration kinetics of dried red beets cubes. The closer the R2 values to 1 and the lower the RMSE values, the better the fitness of the considered model. Such statistical criteria have been widely used in the literature [23,24,25].

3. Results and Discussion

The results of the conducted experiments (in three repetitions) are presented in Figure 1. The figure demonstrates mass changes and the rate of mass changes (Figure 1a), dry matter changes and the rate of dry matter changes (Figure 1b), water changes and the rate of water changes (Figure 1c), moisture content changes and the rate of moisture content changes (Figure 1d), and volume changes and the rate of volume changes (Figure 1e) during the course of dried red beets cubes’ rehydration. The mass, dry matter mass, water mass, moisture content, and volume of rehydrated dried red beets for 10, 20, 40, 90, 180, and 360 min of the rehydration depended (in a statistically significant way) on the solid-to-liquid ratio.
It can be seen (Figure 1a) that at all investigated values of the solid-to-liquid ratio, water uptake increased whereas the rate of water uptake decreased with increasing rehydration time. The higher rehydration rate at the beginning of the process could be caused by fast filling the capillaries of the dried red beets near the surface with the rehydration water [26]. When the rehydrated samples approached the saturation level, the discussed rate was close to zero, so it can be accepted that the mass of the rehydrated material attained the state of equilibrium. Such a typical rehydration behaviour has been observed for kiwifruits [27], lablab bean seeds [28], potatoes [29], wheat starch, wheat protein concentrate, and whey protein isolate [30].
As far as the influence of the solid-to-liquid ratio on the course of mass gain was concerned, it can be stated that at the beginning of the process, the rehydration rates at all considered solid-to-liquid ratios could be treated as almost the same. Then, samples rehydrated in a smaller amount of water reached the state of equilibrium more quickly than samples rehydrated in a larger amount of water. The value of equilibrium sample mass increased with the increasing solid-to-liquid ratio. Similar results obtained by Górnicki [31] concerned rehydration of dried parsley slices at the solid-to-liquid ratios of 1:10, 1:20, 1:30, 1:40, and 1:50.
At all investigated values of the solid-to-liquid ratio (Figure 1b), the rate of dry matter loss was faster in the initial period of rehydration and then slowed down. The discussed rate was faster at the beginning of the process, because the solid concentration gradient between rehydrated dried red beet cubes and rehydrating water was high. As the solid concentration in rehydrated samples equilibrated with a rehydrating medium, the rate of dry matter loss was gradually reduced [30]. A similar course of rehydration has been reported for apples [32], carrots [33,34], and parsley [31].
It can be stated that in the initial period of rehydration, the rates of dry matter loss at all investigated solid-to-liquid ratios were almost the same. In the further stage, dried red beet cubes rehydrated in a smaller amount of water attained a lower loss of dry matter. It could be explained in such a way that in case of a smaller water amount, solid concentration in the rehydrating medium grew quickly and both concentrations (in the rehydrated sample and rehydrating water) approached the equilibrium state faster than in a larger water amount. It can be however noticed that the equilibrium concentrations of dry matter in samples rehydrated in water in case of the solid-to-liquid ratios of 1:20, 1:15, and 1:10 were close to each other. Similar dependences were noticed by Górnicki [31] for the rehydration of dried apple slices.
As far as the water gain in the rehydrated samples was concerned (Figure 1c), it can be noticed that at all considered solid-to-liquid ratios, the rehydration kinetics were similar. At the beginning of the process, water absorption was very fast, but with the increasing rehydration time, the rate of water absorption was substantially reduced, because the amount of water absorbed by the inner structure of material approached the saturation level [35]. The mass of absorbed water during the rehydration of dried red beet cubes depended on the value of the solid-to-liquid ratio. The bigger the ratio, the bigger the equilibrium value of absorbed water mass.
The course of the moisture content increase during the rehydration of dried red beet cubes (Figure 1d) was dependent on the kinetics of mass gain and dry matter loss at the discussed process (Equation (2)). At the initial stage, moisture content increased faster, and then the rate of the process gradually slowed down. A similar rehydration kinetics has been observed for amaranth leaves [36], apples [19], pumpkin [11], red pepper [25], and tomatoes [23]. The value of the solid-to-liquid ratio influenced the course of the process. A higher discussed ratio caused a higher equilibrium value of moisture content. It can be, however, stated that the equilibrium values of moisture content in samples rehydrated in water in case of the solid-to-liquid ratios of 1:20 and 1:15 were close to each other. Ergűn et al. [37] found different rehydration behaviors for freeze dried kiwi slices at the solid-to-liquid ratios of 1:25, 1:50, 1:75, 1:100, and 1:125. The lowest and the highest equilibrium moisture content values were found at the solid-to-liquid ratios of 1:25 and 1:50, respectively.
It can be seen (Figure 1e) that the volume of rehydrated red beet cubes increased with the increasing rehydration time and the rate of the process was faster in the initial period of rehydration and decreased up to the saturation level. It means that at the beginning of the process water mainly filled the open void spaces of the cubes matrix and in the further stage the tissue structure was rehydrated only partially in the more external zone [38]. Such a typical rehydration behaviour has been obtained for apples [39] and potatoes [40]. The value of the solid-to-liquid ratio effected the kinetics of volume increase during rehydration. Although in the initial period the rehydration rates at all considered solid-to-liquid ratios were almost the same, cubes rehydrated in a smaller water amount obtained an equilibrium state more quickly than cubes rehydrated in a greater water amount. A high solid-to-liquid ratio caused a higher value of the equilibrium volume. It can be however noticed that the equilibrium volumes of samples rehydrated in water at solid-to-liquid ratios of 1:20, 1:15, and 1:10 were close to each other.
Statistical tests of the Peleg model applied to simulate dried red beets rehydration curves are presented in Table 1. It can be noticed that all values of the coefficient of determination R2 varied from 0.9731 to 0.9938 for mass gain, from 0.7081 to 0.9916 for dry matter loss, from 0.9782 to 0.9944 for water gain, from 0.9794 to 0.9935 for moisture content increase, and from 0.9507 to 0.9859 for volume increase.
As far as the root mean square error (RMSE) was concerned, it can be stated that its value ranged from 0.2612 to 2.7615 g for mass gain, from 0.1276 to 0.2965 g for dry matter loss, from 0.3664 to 2.8014 g for water gain, from 0.0351 to 0.4946 d.b. for moisture content increase, and from 0.7047 to 1.9851 cm3 for volume increase.
Taking into account the obtained values of R2 and the RMSE, it can be assumed that the Peleg model described the courses of mass gain, dry matter loss, water gain, moisture content increase, and volume increase during the rehydration of dried red beets cubes in an acceptable way at all considered values of the solid-to-liquid ratio. Although the R2 values for dry matter loss in case of solid-to-liquid ratios of 1:3 and 1:1 were not high enough (0.7284 at the solid-to-liquid ratio of 1:3 and 0.7081 at the solid-to-liquid ratio of 1:1), the values of the RMSE were low enough (0.2965 g at the solid-to-liquid ratio of 1:3 and 0.1583 g at the solid-to-liquid ratio of 1:1).
The values of the parameters of the Peleg model, namely the Peleg rate constant A1 and the Peleg capacity constant A2, obtained by fitting the discussed model to the experimental data are shown in Table 2 and in Figure 2 and Figure 3. Parameter A1 represents the water absorption rate at the beginning of the process of rehydration, whereas parameter A2 informs the absorption ability of the rehydrated product and the equilibrium value of investigated variable X [41,42,43].
The effect of the solid-to-liquid ratio on the Peleg rate constant A1 was slightly different for investigated variables, namely rehydrated cubes mass, rehydrated cubes dry matter, mass of water in rehydrated cubes, rehydrated cubes moisture content, and rehydrated cubes volume. As far as cubes mass was concerned, the lowest A1 value (0.309 min/g) was obtained at the solid-to-liquid ratio of 1:1, and the highest (0.739 min/g) was gained at the solid-to-liquid ratio of for 1:5, but the value of A1 at the solid-to-liquid ratio of 1:20 (0.674 min/g) was higher than at the solid-to-liquid ratios of 1:3, 1:10, and 1:15. The results allowed for the statement that the rate of mass gain at the early stage of rehydration was the highest at the solid-to-liquid ratio of 1:1 and was the lowest at the solid-to-liquid ratio of 1:5 but the discussed rate at the solid-to-liquid ratio of 1:20 was lower than at the solid-to-liquid ratios of 1:3, 1:10, and 1:15. In case of dry matter, the lowest value of parameter A1 (1.900) was found at the solid-to-liquid ratio of 1:1, the highest (6.125 min/g) was found at the solid-to-liquid ratio of 1:20, and the discussed parameter increased with the increasing amount of rehydration water. It should be however noticed that the A1 values at the solid-to-liquid ratios of 1:1, 1:3, and 1:5 were almost the same (1.900–1.917 min/g). It can be said, therefore, that the rate of dry matter loss at the beginning of rehydration decreased with the increasing amount of rehydrating water although mentioned rates at the solid-to-liquid ratios of 1:1, 1:3, and 1:5 can be assumed as the same. As far as mass of water in rehydrated cubes was concerned, it can be stated that the lowest value for A1 (0.198 min/g) was found at the solid-to-liquid ratio equal to 1:1 and the highest (0.581 min/g) was obtained at the solid-to-liquid ratio of 1:20. The results suggest that the highest rate of water gain during the early stage of rehydration was gained at the solid-to-liquid ratio of 1:1 and the lowest rate of water gain was obtained at the solid-to-liquid ratio of 1:20. In case of moisture content, the lowest value of parameter A1 (0.163 min/d.b.) was obtained at the solid-to-liquid ratio of 1:1 and the highest value of parameter A1 (6.533 min/d.b) was gained at the solid-to-liquid ratio of 1:20. This allowed for the statement that the rate of moisture content increase in the early period of rehydration was the highest at the solid-to-liquid ratio of 1:1 and was the lowest at the solid-to-liquid ratio of 1:20. As far as volume was concerned, the lowest A1 value (0.478 min/cm3) was found at the solid-to-liquid ratio equal to 1:1, the highest A1 value (0.656 min/cm3) was obtained at the solid-to-liquid ratio of 1:5, and the A1 value at the solid-to-liquid ratio of 1:20 (0.555 min/cm3) was lower than at the solid-to-liquid ratios of 1:3, 1:10, and 1:15. Therefore, it can be assumed that the rate of volume increase at the beginning of the rehydration was highest at the solid-to-liquid ratio of 1:1 and was the lowest at the solid-to-liquid ratio of 1:5 and the discussed rate at the solid-to-liquid ratio of 1:20 was higher than at the solid-to-liquid ratios of 1:3, 1:10, and 1:15.
The effect of the solid-to-liquid ratio on the Peleg capacity constant A2 indicated some characteristics for all investigated variables, namely rehydrated cubes mass, rehydrated cubes dry matter, mass of water in rehydrated cubes, rehydrated cubes moisture content, and rehydrated cubes volume. For each of investigated variables, parameter A2 decreased with the increasing amount of rehydrating water. This means that according to Equation (4), the equilibrium values of rehydrated cubes mass, mass of water in rehydrated cubes, rehydrated cubes moisture, and rehydrated cubes volume increased with the increasing amount of rehydrating water, whereas the equilibrium values of rehydrated cubes dry matter decreased with the increasing amount of rehydrating water.
In order to determine the influence of the solid-to-liquid ratio on the Peleg model constants, such formulas were taken which, from the mathematical point of view, are similar to the Peleg model.
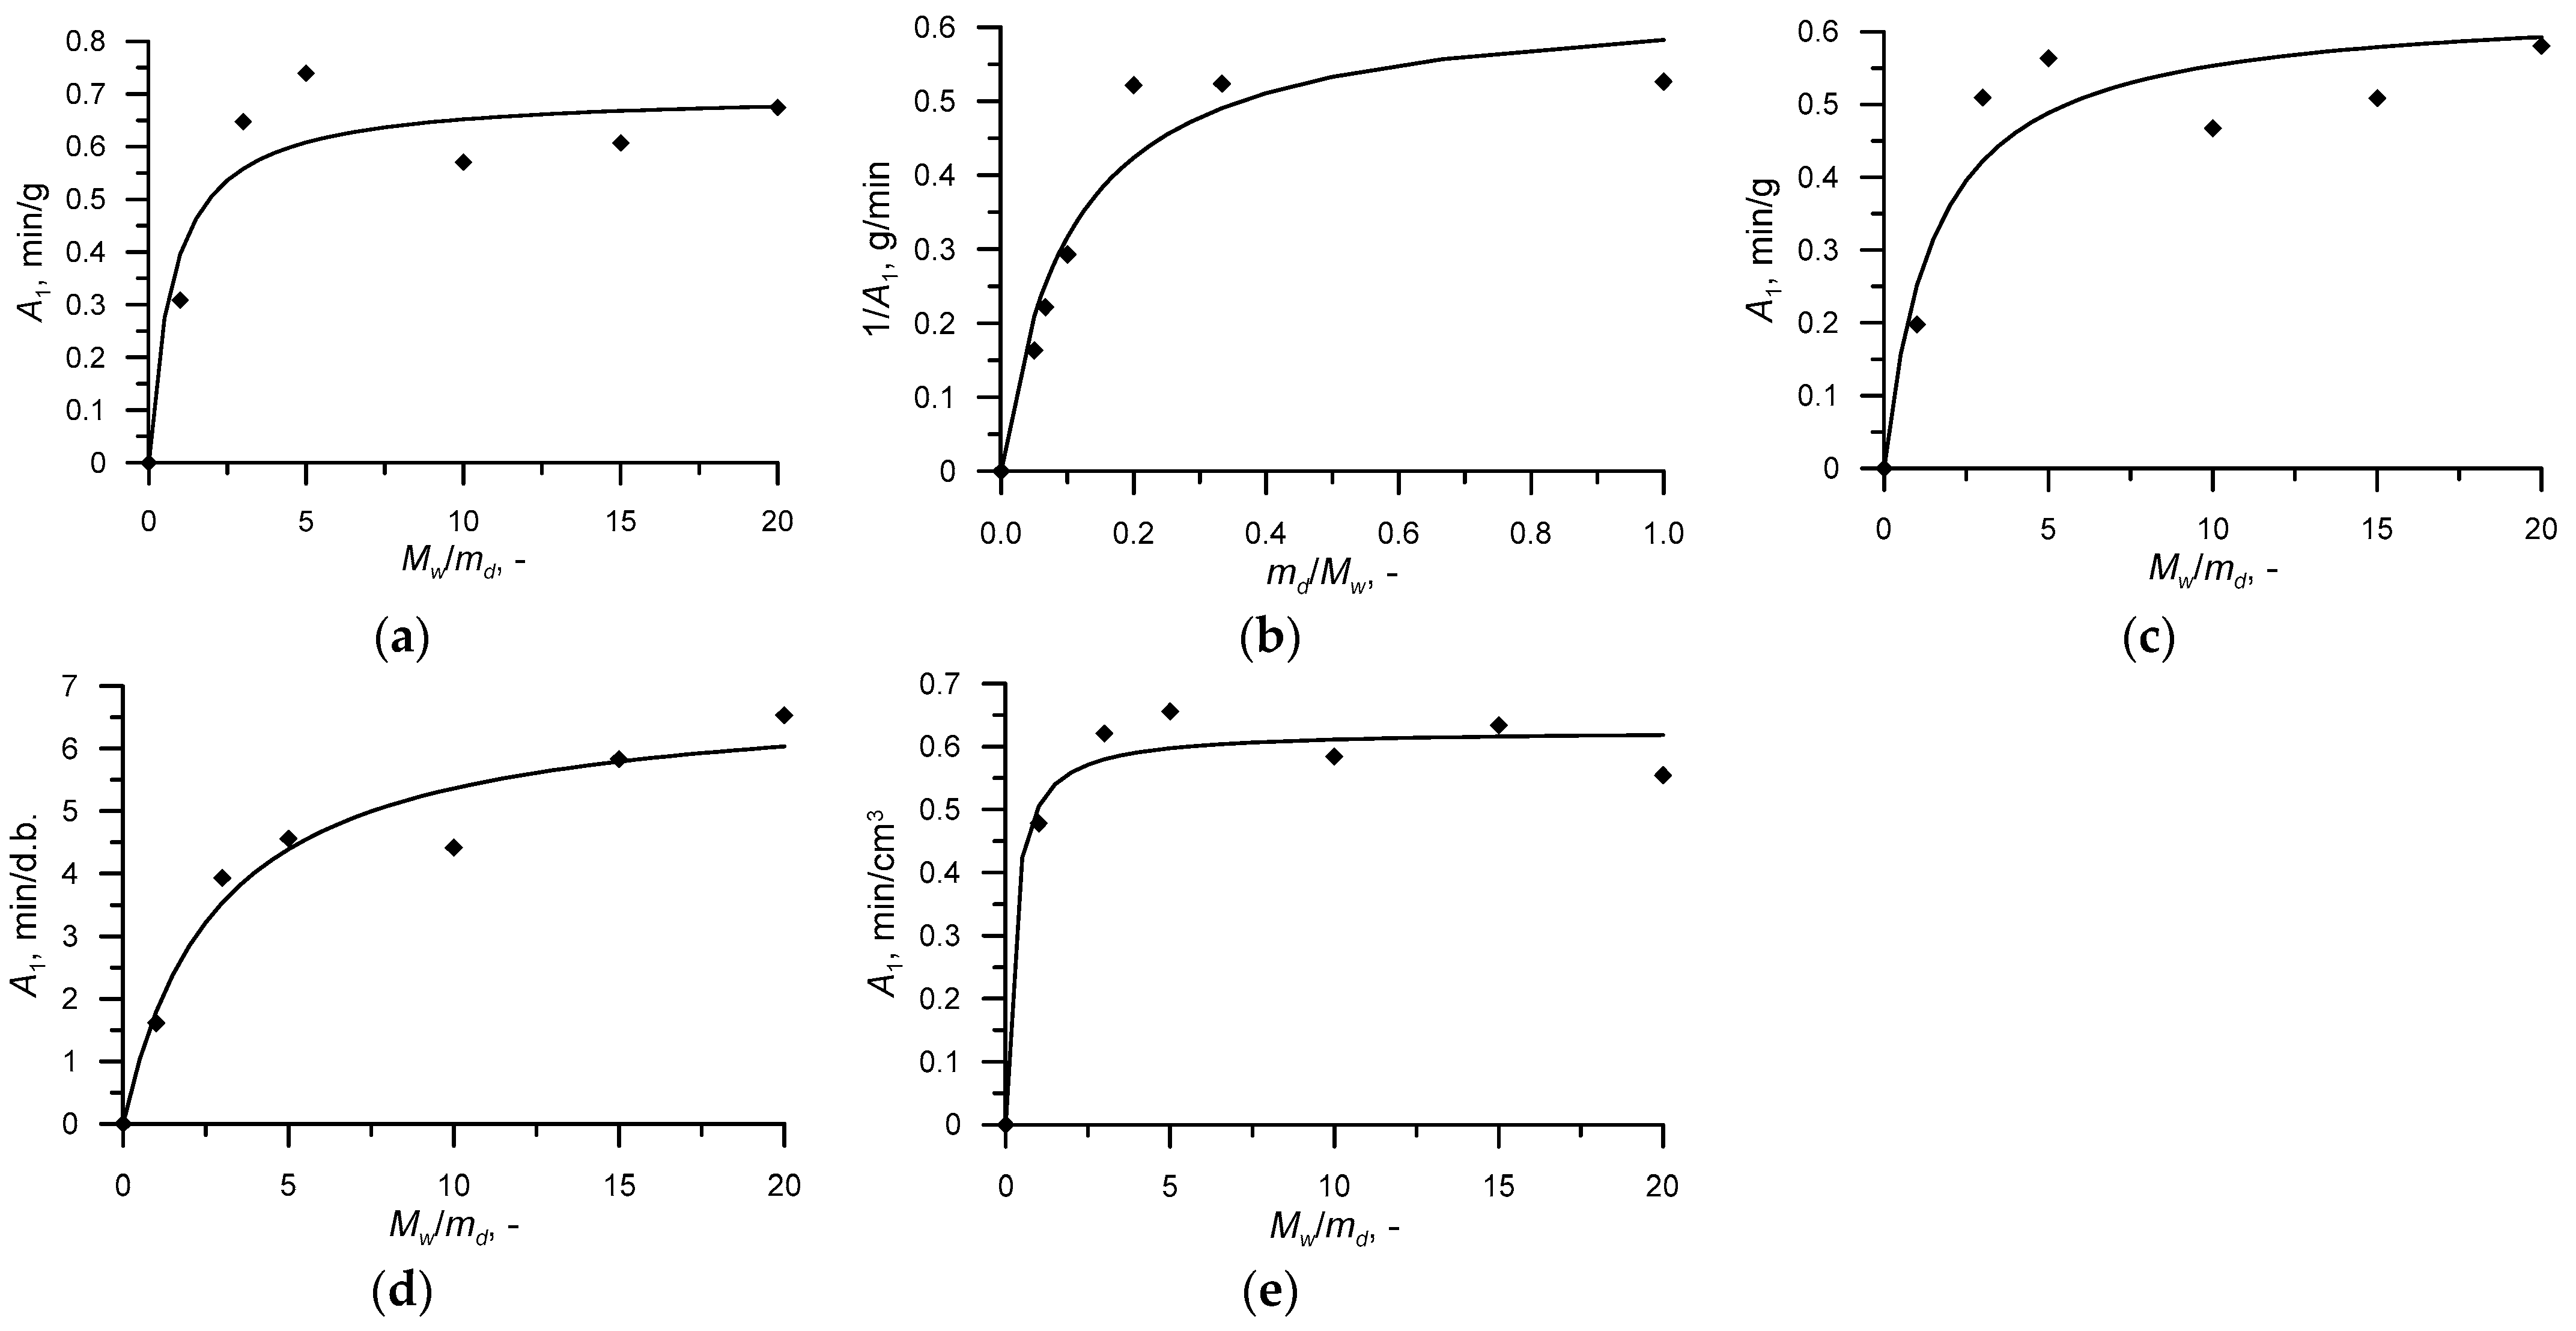
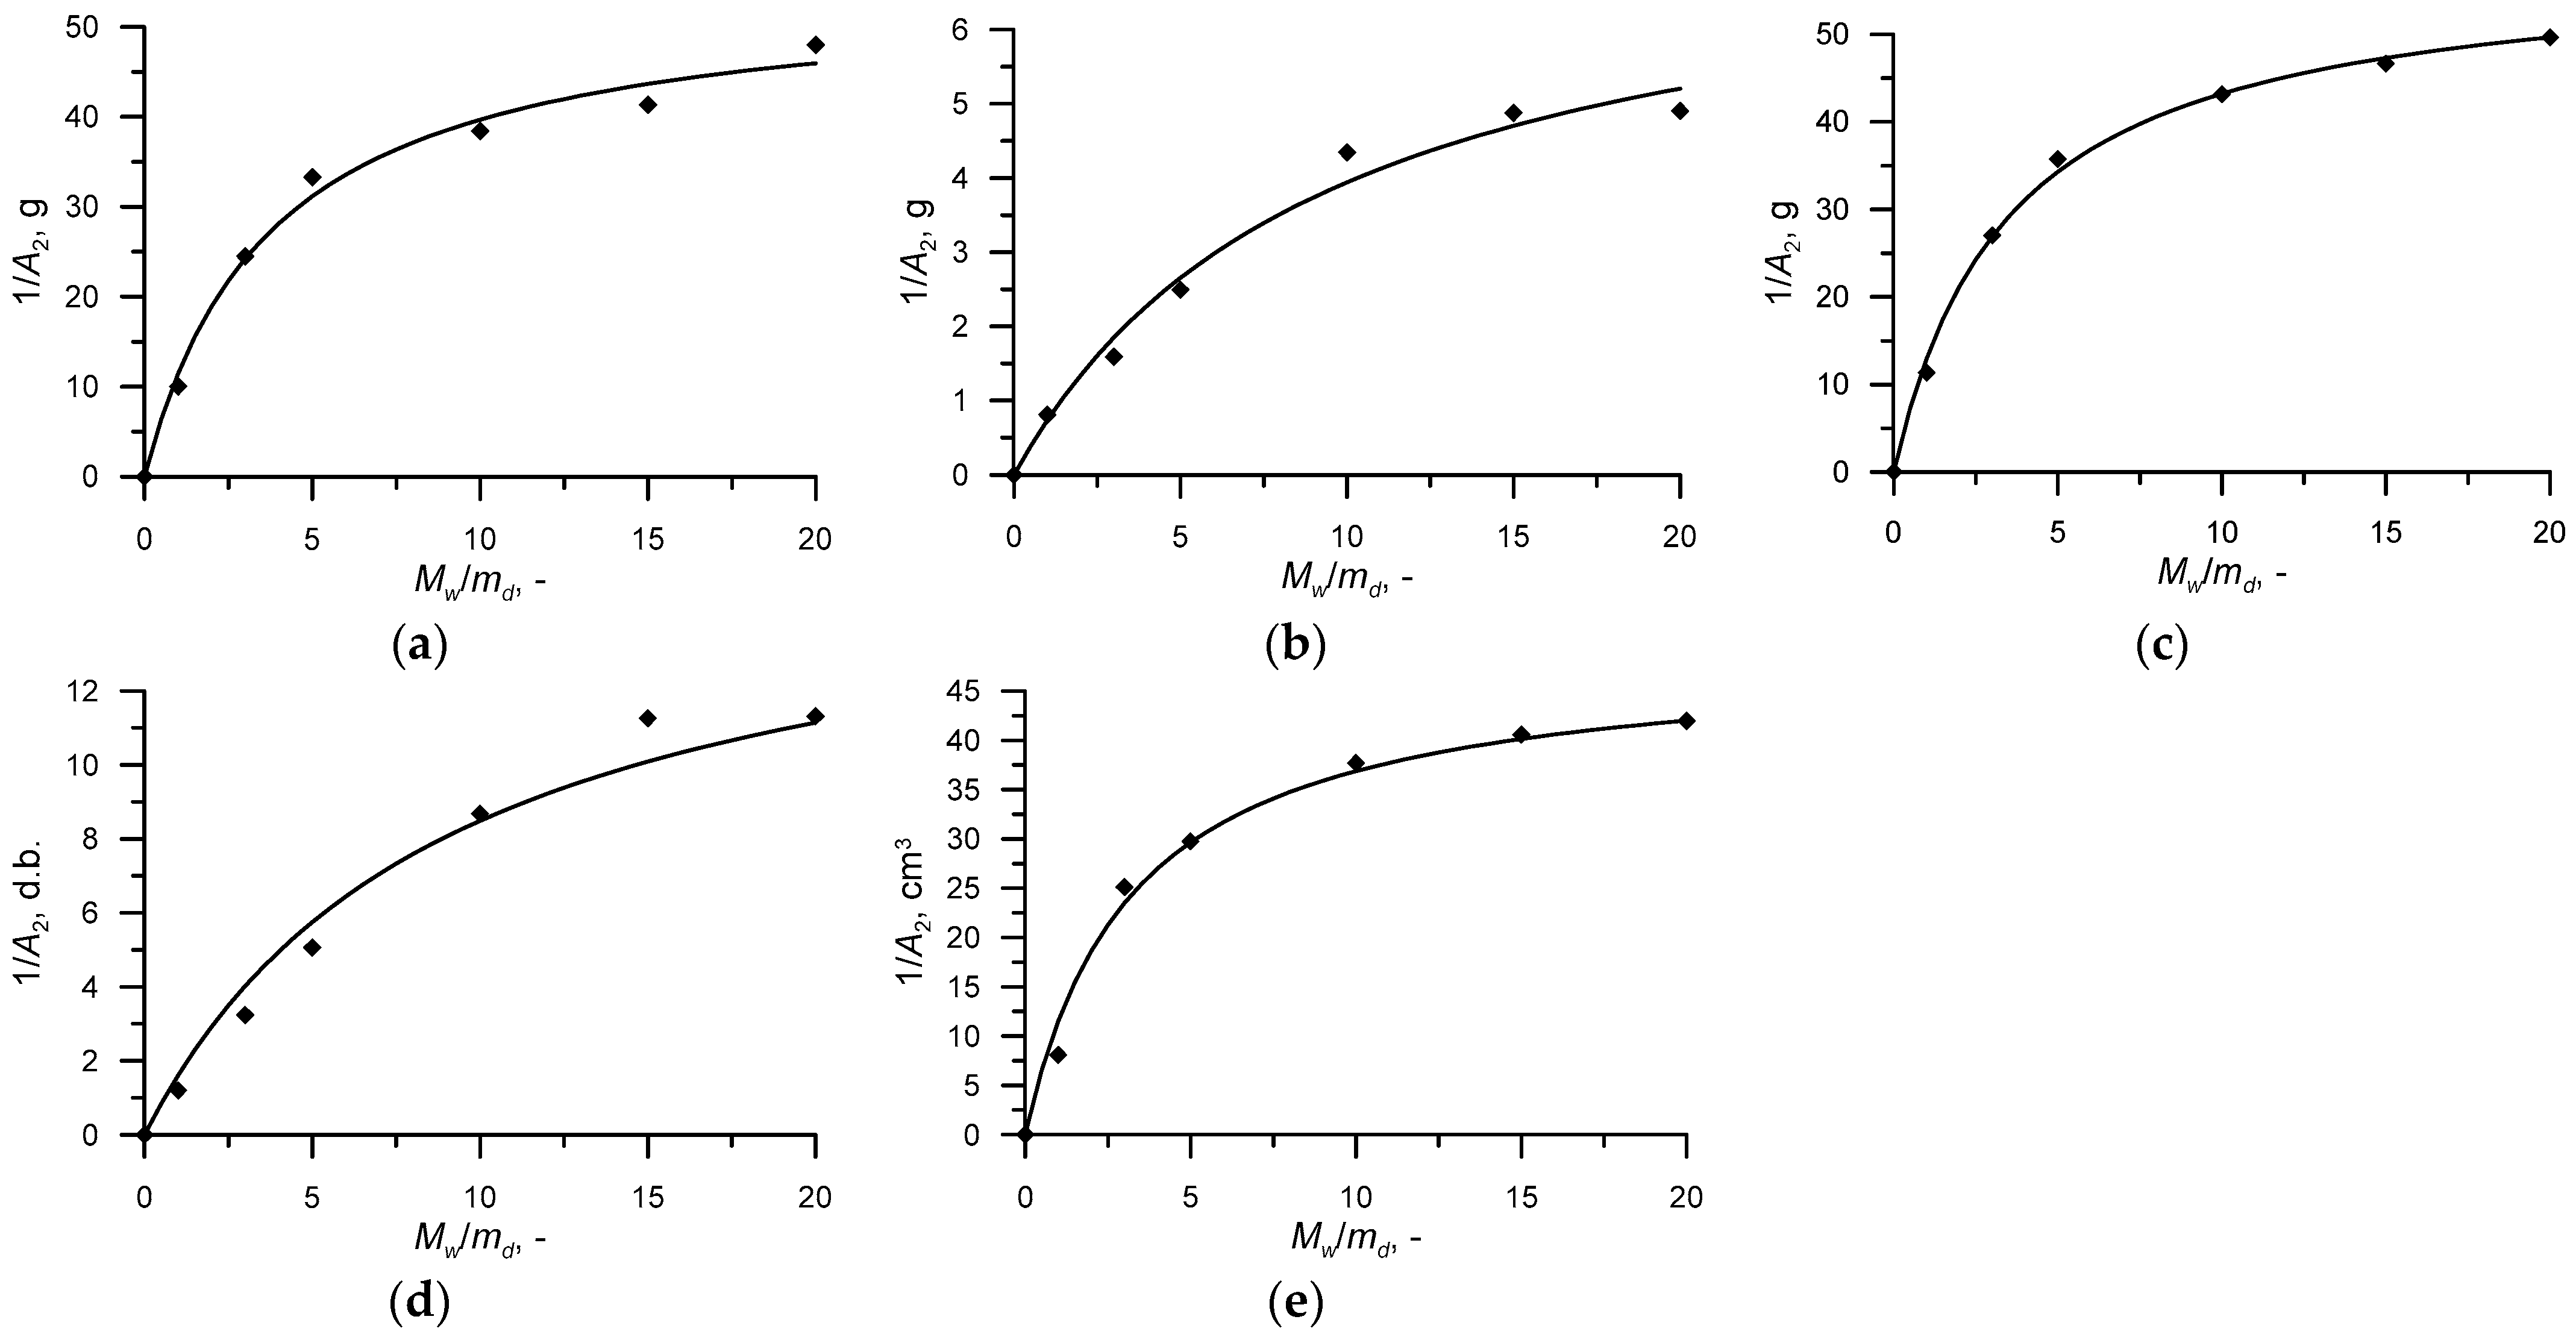
  • Constant A1 for mass gain, water gain, moisture content increase, and volume increase was described using Equation (5):
A 1 = A 1 , 0 + M w m d a 1 + a 2 M w m d
where a1 and a2 constants.
  • Constant A1 for fry matter loss was determined with Equation (6):
1 A 1 = ( 1 A 1 ) 0 + m d M w a 1 + a 2 m d M w
where a1 and a2 are constants.
Constant A2 for all investigated variables (mass gain, dry matter loss, water gain, moisture content increase, and volume increase) was calculated applying Equation (7):
1 A 2 = ( 1 A 2 ) 0 + M w m d a 1 + a 2 M w m d
where a1 and a2 are constants.
In Equations (5)–(7), Mw is the mass of rehydrating water at the beginning of the rehydration, and md is the mass of dried red beets at the beginning of the rehydration. When there is a lack of rehydrating water (Mw = 0), it turns out from Equation (5) that A1 = A1,0. Taking into account the results from the experiments (Table 2 and Figure 2a,c–e), it can be assumed that A1,0 = 0.
As far as Equation (6) was concerned, it can be counted that for the amount of rehydrating water Mw→∞, 1/A1 = (1/A1)0. Experimental results (Table 3 and Figure 2b) allowed for the acceptation that (1/A1)0 = 0.
It can be deducted from Equation (4) that when there is not any rehydrating water (Mw = 0), the process of rehydration cannot be conducted and therefore Xe = X0 under which situation 1/A2 = 0. Considering this in Equation (7), it can be accepted that (1/A2)0 = 0.
The results of the impacts of the solid-to-liquid ratio on the Peleg model constants are presented in Table 3, Table 4 and Table 5 and in Figure 2 and Figure 3. Table 3 presents the values of the constants in Equation (5) for A1 (mass gain, water gain, moisture content increase, and volume increase), in Equation (6) for A1 (dry matter loss), and in Equation (7) for A2, and statistical tests of developed Equations (5)–(7) are shown in Table 4. It can be noticed that the values of the coefficient of determination R2 varied between 0.8957 and 0.9654 for Peleg rate constant A1 and between 0.9845 and 0.9977 for the Peleg capacity constant A2. As far as the root mean square error (RMSE) was concerned, it can be stated that its values were within 2 × 10⁻⁵ to 0.2320 for A1 and within 0.0182 to 39.3976 for A2.
Taking into account the achieved values of R2 and the RMSE, it can be accepted that developed Equations (5)–(7) described the influences of the solid-to-liquid ratio on the Peleg model constants A1 and A2 well enough. Although the RMSE values for Equation (7) describing the dependence of Peleg capacity constant A2 for mass gain and volume increase on the mentioned ratios were high (39.3976 for mass gain and 29.7406 for volume increase), the values of R2 were sufficiently high (0.9904 1/g for mass gain and 0.9920 1/cm3 for volume increase).
The course of the dependence between the value of the Peleg rate constant A1 and the amount of rehydrating water according to developed Equations (5) and (6) is shown in Figure 2. Generally speaking, it can be admitted that the value of A1 increased with the increasing amount of rehydrating water. Therefore, it can be stated that the rates of the rehydration (mass gain, dry matter loss, water gain, moisture content increase, and volume increase) at the early stage of the process decreased with the increasing amount of rehydrating water.
The kinetics of variation in the value of the Peleg capacity constant A2 with the amount of rehydrating water according to developed Equation (7) is shown in Figure 3. It can be noticed that the value of A2 decreased with the increasing amount of rehydrating water. Therefore, it can be concluded that the equilibrium values of mass gain, water gain, moisture content increase, and volume increase increased with the increasing amount of rehydrating water whereas for dry matter loss equilibrium values decreased with the increasing amount of water.
The values of the Peleg model parameters A1 and A2 obtained form Equations (5)–(7) for extreme values of the solid-to-liquid ratio can be found in Table 5. The results obtained for A1 confirmed the statement that when the amount of rehydrating water grew up the rate of the rehydration during the early stage of the process slowed down. For Mw/md→∞, the Peleg rate constant A1 presented the highest values for mass gain, water gain, moisture content increase, and volume increase. On the other hand, for md/Mw →∞, parameter A1 showed the lowest value for dry matter loss. The Peleg capacity constant A2 values obtained from Equation (7) for Mw/md→∞ were the lowest. It confirmed the statement that when the amount of rehydrating water increased, the equilibrium values of mass gain, water gain, moisture content increase, and volume increase increased and the equilibrium value of dry matter loss decreased.
Developed Equations (5)–(7) with constants shown in Table 3 were then used in the Peleg model, and such a model was applied to simulate dried red beets rehydration curves, namely kinetics of mass gain, dry matter loss, water gain, moisture content increase, and volume increase. The results of statistical tests are presented in Table 6. As can be seen, the values of the determination coefficient R2 ranged from 0.9662 to 0.9895 for mass gain, from 0.7042 to 0.9881 for dry matter loss, from 0.9732 to 0.9913 for water gain, from 0.9770 to 0.9929 for moisture content increase, and from 0.9374 to 0.9847 for volume increase. The values of the root mean square error (RMSE) were within 1.0075 to 2.2519 g for mass gain, 0.1681 to 0.3707 g for dry matter loss, 1.2462 to 2.3298 g for water gain, 0.3295–0.6443 d.b. for moisture content increase, and 1.3127 to 2.6472 cm3 for volume increase.
The obtained results allowed for the statement that the Peleg model with its parameters A1 and A2 expressed with Equations (5)–(7) and constants from Table 3 can be applied to simulate dried red beets rehydration curves (mass gain, dry matter loss, water gain, moisture content increase, and volume increase) at all considered values of the solid-to-liquid ratio. Although the determination coefficient values at the solid-to-liquid ratios of 1:3 and 1:1 for dry matter loss were not high enough (0.7042 and 0.7253, respectively), the root mean square error values were low enough (0.3616 g and 0.1681 g, respectively).

4. Conclusions

The Peleg model can be accepted as suitable for describing the course of mass gain (R2 = 0.9731–0.9938; RMSE = 0.2612–2.7615), dry matter loss (R2 = 0.7081–0.9916; RMSE = 0.1276–0.2965), water gain (R2 = 0.9782–0.9944; RMSE = 0.3664–2.8014), moisture content increase (R2 = 0.9794–0.9935; RMSE = 0.0351–0.4946), and volume increase (R2 = 0.9507–0.9859; RMSE = 0.7047–1.9851) during the rehydration of dried red beet cubes at all considered values of the solid-to-liquid ratio (1:20, 1:15, 1:10, 1:5, 1:3, and 1:1).
A method for determining the parameters of the Peleg model (the Peleg rate constant A1 and the Peleg capacity constant A2) was developed. The technique can determine the parameters within the entire range of the solid-to-water ratio. The values of A1 increased, whereas values of A2 decreased with the increasing amount of rehydrating water. Therefore, the conclusions were drawn as follows: (1) the rates of the rehydration (mass gain, dry matter loss, water gain, moisture content increase, and volume increase) decreased with the increasing amount of rehydrating water at the early stage of the process; (2) the equilibrium values for mass gain, water gain, moisture content increase, and volume increase increased, whereas dry matter loss decreased with the increasing amount of water. It turned out from statistical tests that the Peleg model with parameters A1 and A2 expressed as a function of the solid-to-liquid ratio can be recommended for describing the kinetics of mass gain (R2 = 0.9662–0.9895; RMSE = 1.0075–2.2519), dry matter loss (R2 = 0.7042–0.9881; RMSE = 0.1681–0.3707), water gain (R2 = 0.9732–0.9913; RMSE = 1.2462–2.3298), moisture content increase (R2 = 0.9770–0.9929; RMSE = 0.3295–0.6443), and volume increase (R2 = 0.9374–0.9847; RMSE = 1.3127–2.6472) during the rehydration of dried red beet cubes at all considered values of the solid-to-liquid ratio.

Author Contributions

Conceptualization, A.K. and K.G.; methodology, A.K. and K.G.; experiments, K.K.; software, K.G.; visualization, K.G. and M.O.; formal analysis, A.K., M.O. and K.G.; writing—original draft preparation, A.K.; writing—review and editing, K.G. All authors have read and agreed to the published version of the manuscript.

Funding

This research received no external funding.

Institutional Review Board Statement

Not applicable.

Informed Consent Statement

Not applicable.

Data Availability Statement

Data are contained within the article.

Conflicts of Interest

The authors declare no conflict of interest.

Appendix A

Table A1. Solid-to-liquid ratio (mass of the sample/mass of the liquid) applied in the rehydration process of the dried product.
Solid-to-Liquid RatioRehydration LiquidApplications
1:333distilled waterpumpkin [11]
1:200distilled waterbananas [27], broccoli [44], and pumpkin [21]
1:125distilled waterkiwi [37]
1:120watercarrots [45]
1:100distilled watercelery [46], kiwi [37], and mangoes [47]
1:75distilled waterkiwi [37]
1:50distilled waterapples [31], jackfruit [48], kiwi [37], parsley [31], and red bell pepper [49]
1:40distilled waterapples [19] and hawthorn fruit [50]
1:30distilled waterapples [31,32], oranges [20], parsley [31], potatoes [35], red pepper [25], and wormwood [51]
waterlablab bean seeds [28] and mangoes [52]
1:25distilled waterdate palm [10], kiwi [37], potatoes [40]
watercarrots [33,34], and coriander leaves [53]
1:20distilled waterapples [31,54,55], broccoli [56], and parsley [31]
waterpotatoes [9]
0.5% solution of citric acid, apple, juiceapples [54]
1:15distilled wateramaranth grain [57] and okra [58]
SO2 aqueous solution (0.01% and 0.02% (w/v))
SO2 solution (0.02% w/v) with variable concentrations of lactic acid (0.0025% and 0.0050% (v/v))
amaranth grain [57]
1:14distilled waterpear [59]
1:10tap waterapples [31], carrots [60], and parsley [31]
1:7.5distilled watersesame seeds [61]
1:5distilled water and vegetable stockpotatoes [62]
1:1.125,
1:0.512
drinking waterpork tenderloins [63]

References

  1. Chen, S.; Wu, W.; Yang, Y.; Wang, H.; Zhang, H. Experimental Study of a Novel Vacuum Sublimation–Rehydration Thawing for Frozen Pork. Int. J. Refrig. 2020, 118, 392–402. [Google Scholar] [CrossRef]
  2. Nejatdarabi, S.; Mohebbi, M. Predicting the Rehydration Process of Mushroom Powder by Multiple Linear Regression (MLR) and Artificial Neural Network (ANN) in Different Rehydration Medium. J. Food Meas. Charact. 2023, 17, 1962–1973. [Google Scholar] [CrossRef]
  3. Ratti, C.; Kudra, T. Drying of Foamed Biological Materials: Opportunities and Challenges. Dry. Technol. 2006, 24, 1101–1108. [Google Scholar] [CrossRef]
  4. Khan, M.I.H.; Farrell, T.; Nagy, S.A.; Karim, M.A. Fundamental Understanding of Cellular Water Transport Process in Bio-Food Material during Drying. Sci. Rep. 2018, 8, 15191. [Google Scholar] [CrossRef] [PubMed]
  5. Abbaspour-Gilandeh, Y.; Kaveh, M.; Fatemi, H.; Khalife, E.; Witrowa-Rajchert, D.; Nowacka, M. Effect of Pretreatments on Convective and Infrared Drying Kinetics, Energy Consumption and Quality of Terebinth. Appl. Sci. 2021, 11, 7672. [Google Scholar] [CrossRef]
  6. Biswas, R.; Hossain, M.A.; Zzaman, W. Thin Layer Modeling of Drying Kinetics, Rehydration Kinetics and Color Changes of Osmotic Pre-Treated Pineapple (Ananas comosus) Slices during Drying: Development of a Mechanistic Model for Mass Transfer. Innov. Food Sci. Emerg. Technol. 2022, 80, 103094. [Google Scholar] [CrossRef]
  7. Wang, B.; Li, Y.; Lv, Y.; Jiao, X.; Wang, Z.; He, Y.; Wen, L. Dehydration–Rehydration Mechanism of Vegetables at the Cell-Wall and Cell-Membrane Levels and Future Research Challenges. Crit. Rev. Food Sci. Nutr. 2023, 1–17. [Google Scholar] [CrossRef] [PubMed]
  8. Zhang, J.; Zhao, F.; Li, C.; Ban, X.; Gu, Z.; Li, Z. Acceleration Mechanism of the Rehydration Process of Dried Rice Noodles by the Porous Structure. Food Chem. 2024, 431, 137050. [Google Scholar] [CrossRef] [PubMed]
  9. Ravindra, M.R.; Chattopadhyay, P.K. Optimisation of Osmotic Preconcentration and Fluidised Bed Drying to Produce Dehydrated Quick-Cooking Potato Cubes. J. Food Eng. 2000, 44, 5–11. [Google Scholar] [CrossRef]
  10. Falade, K.O.; Abbo, E.S. Air-Drying and Rehydration Characteristics of Date Palm (Phoenix dactylifera L.) Fruits. J. Food Eng. 2007, 79, 724–730. [Google Scholar] [CrossRef]
  11. Rojas, M.L.; Augusto, P.E.D. Microstructure Elements Affect the Mass Transfer in Foods: The Case of Convective Drying and Rehydration of Pumpkin. LWT 2018, 93, 102–108. [Google Scholar] [CrossRef]
  12. Janiszewska, E. Microencapsulated Beetroot Juice as a Potential Source of Betalain. Powder Technol. 2014, 264, 190–196. [Google Scholar] [CrossRef]
  13. Kumar, Y.; Khan, M.A.; Patel, K.K. Effect of Microwave on Fluidized Bed Drying of Beetroot (Beta vulgaris L.). Am. J. Eng. Res. 2014, 3, 267–273. [Google Scholar]
  14. Latorre, M.E.; De Escalada Plá, M.F.; Rojas, A.M.; Gerschenson, L.N. Blanching of Red Beet (Beta vulgaris L. Var. Conditiva) Root. Effect of Hot Water or Microwave Radiation on Cell Wall Characteristics. LWT-Food Sci. Technol. 2013, 50, 193–203. [Google Scholar] [CrossRef]
  15. Kaleta, A.; Górnicki, K. Some Remarks on Evaluation of Drying Models of Red Beet Particles. Energy Convers. Manag. 2010, 51, 2967–2978. [Google Scholar] [CrossRef]
  16. Horwitz, W. (Ed.) Official Methods of Analysis of AOAC International, 18th ed.; AOAC International: Gaithersburg, MD, USA, 2005; ISBN 978-0-935584-75-2. [Google Scholar]
  17. Mazza, G. Dehydration of Carrots.: Effects of Pre-Drying Treatments on Moisture Transport and Product Quality. Int. J. Food Sci. Technol. 2007, 18, 113–123. [Google Scholar] [CrossRef]
  18. Peleg, M. An Empirical Model for the Description of Moisture Sorption Curves. J. Food Sci. 1988, 53, 1216–1219. [Google Scholar] [CrossRef]
  19. Tepe, T.K.; Tepe, B. The Comparison of Drying and Rehydration Characteristics of Intermittent-Microwave and Hot-Air Dried-Apple Slices. Heat Mass Transf. 2020, 56, 3047–3057. [Google Scholar] [CrossRef]
  20. Özkan-Karabacak, A.; Acoğlu, B.; Yolci Ömeroğlu, P.; Çopur, Ö.U. Microwave Pre-treatment for Vacuum Drying of Orange Slices: Drying Characteristics, Rehydration Capacity and Quality Properties. J. Food Process Eng. 2020, 43, e13511. [Google Scholar] [CrossRef]
  21. Benseddik, A.; Azzi, A.; Zidoune, M.N.; Khanniche, R.; Besombes, C. Empirical and Diffusion Models of Rehydration Process of Differently Dried Pumpkin Slices. J. Saudi Soc. Agric. Sci. 2019, 18, 401–410. [Google Scholar] [CrossRef]
  22. Nayi, P.; Kumar, N.; Kachchadiya, S.; Chen, H.; Singh, P.; Shrestha, P.; Pandiselvam, R. Rehydration Modeling and Characterization of Dehydrated Sweet Corn. Food Sci. Nutr. 2023, 11, 3224–3234. [Google Scholar] [CrossRef] [PubMed]
  23. Lopez-Quiroga, E.; Prosapio, V.; Fryer, P.J.; Norton, I.T.; Bakalis, S. Model Discrimination for Drying and Rehydration Kinetics of Freeze-dried Tomatoes. J. Food Process Eng. 2020, 43, e13192. [Google Scholar] [CrossRef]
  24. Demir, H.; Demir, H.; Lončar, B.; Nićetin, M.; Pezo, L.; Yilmaz, F. Artificial Neural Network and Kinetic Modeling of Capers during Dehydration and Rehydration Processes. J. Food Process Eng. 2023, 46, e14249. [Google Scholar] [CrossRef]
  25. Demiray, E.; Tulek, Y. Effect of Temperature on Water Diffusion during Rehydration of Sun-Dried Red Pepper (Capsicum annuum L.). Heat Mass Transf. 2017, 53, 1829–1834. [Google Scholar] [CrossRef]
  26. García-Pascual, P.; Sanjuán, N.; Melis, R.; Mulet, A. Morchella esculenta (Morel) Rehydration Process Modelling. J. Food Eng. 2006, 72, 346–353. [Google Scholar] [CrossRef]
  27. Maskan, M. Drying, Shrinkage and Rehydration Characteristics of Kiwifruits during Hot Air and Microwave Drying. J. Food Eng. 2001, 48, 177–182. [Google Scholar] [CrossRef]
  28. Pervin, S.; Islam, M.; Islam, M. Study on Rehydration Characteristics of Dried Lablab Bean (Lablab purpureus) Seeds. J. Agric. Rural Dev. 2008, 6, 157–163. [Google Scholar] [CrossRef]
  29. Maté, J.I.; Zwietering, M.; Van’T Riet, K. The Effect of Blanching on the Mechanical and Rehydration Properties of Dried Potato Slices. Eur. Food Res. Technol. 1999, 209, 343–347. [Google Scholar] [CrossRef]
  30. Sopade, P.A.; Xun, P.Y.; Halley, P.J.; Hardin, M. Equivalence of the Peleg, Pilosof and Singh–Kulshrestha Models for Water Absorption in Food. J. Food Eng. 2007, 78, 730–734. [Google Scholar] [CrossRef]
  31. Górnicki, K. Modelling of Selected Vegetables and Fruits Rehydration Process; Wydawnictwo SGGW: Warsaw, Poland, 2011. (In Polish) [Google Scholar]
  32. Taiwo, K.A.; Angersbach, A.; Knorr, D. Rehydration Studies on Pretreated and Osmotically Dehydrated Apple Slices. J. Food Sci. 2002, 67, 842–847. [Google Scholar] [CrossRef]
  33. Rastogi, N.K.; Nayak, C.A.; Raghavarao, K.S.M.S. Influence of Osmotic Pre-Treatments on Rehydration Characteristics of Carrots. J. Food Eng. 2004, 65, 287–292. [Google Scholar] [CrossRef]
  34. Nayak, C.A.; Suguna, K.; Rastogi, N.K. Combined Effect of Gamma-Irradiation and Osmotic Treatment on Mass Transfer during Rehydration of Carrots. J. Food Eng. 2006, 74, 134–142. [Google Scholar] [CrossRef]
  35. McMinn, W.A.M.; Magee, T.R.A. Physical Characteristics of Dehydrated Potatoes—Part II. J. Food Eng. 1997, 33, 49–55. [Google Scholar] [CrossRef]
  36. Mujaffar, S.; Lee Loy, A. The Rehydration Behavior of Microwave-dried Amaranth (Amaranthus dubius) Leaves. Food Sci. Nutr. 2017, 5, 399–406. [Google Scholar] [CrossRef]
  37. Ergün, K.; Çalışkan, G.; Dirim, S.N. Determination of the Drying and Rehydration Kinetics of Freeze Dried Kiwi (Actinidia deliciosa) Slices. Heat Mass Transf. 2016, 52, 2697–2705. [Google Scholar] [CrossRef]
  38. Moreira, R.; Chenlo, F.; Chaguri, L.; Fernandes, C. Water Absorption, Texture, and Color Kinetics of Air-Dried Chestnuts during Rehydration. J. Food Eng. 2008, 86, 584–594. [Google Scholar] [CrossRef]
  39. Vetter, S.; Kunzek, H. The Influence of Suspension Solution Conditions on the Rehydration of Apple Cell Wall Material. Eur. Food Res. Technol. 2003, 216, 39–45. [Google Scholar] [CrossRef]
  40. Markowski, M.; Bondaruk, J.; Błaszczak, W. Rehydration Behavior of Vacuum-Microwave-Dried Potato Cubes. Dry. Technol. 2009, 27, 296–305. [Google Scholar] [CrossRef]
  41. Solomon, W.K. Hydration Kinetics of Lupin (Lupinus albus) Seeds. J. Food Process Eng. 2007, 30, 119–130. [Google Scholar] [CrossRef]
  42. Noshad, M.; Mohebbi, M.; Shahidi, F.; Mortazavi, S.A. Kinetic Modeling of Rehydration in Air-Dried Quinces Pretreated with Osmotic Dehydration and Ultrasonic: Rehydration in Dried Quinces. J. Food Process. Preserv. 2012, 36, 383–392. [Google Scholar] [CrossRef]
  43. Ohaco, E.H.; Ichiyama, B.; Lozano, J.E.; De Michelis, A. Rehydration of Rosa rubiginosa Fruits Dried with Hot Air. Dry. Technol. 2015, 33, 696–703. [Google Scholar] [CrossRef]
  44. Doymaz, İ.; Sahin, M. Effect of Temperature and Pre-Treatment on Drying and Rehydration Characteristics of Broccoli Slices. J. Food Meas. Charact. 2016, 10, 364–373. [Google Scholar] [CrossRef]
  45. Doymaz, İ. Drying Kinetics, Rehydration and Colour Characteristics of Convective Hot-Air Drying of Carrot Slices. Heat Mass Transf. Waerme-Stoffuebertragung 2017, 53, 25–35. [Google Scholar] [CrossRef]
  46. Nowak, D.; Piechucka, P.; Witrowa-Rajchert, D.; Wiktor, A. Impact of Material Structure on the Course of Freezing and Freeze-Drying and on the Properties of Dried Substance, as Exemplified by Celery. J. Food Eng. 2016, 180, 22–28. [Google Scholar] [CrossRef]
  47. Link, J.V.; Tribuzi, G.; Laurindo, J.B. Improving Quality of Dried Fruits: A Comparison between Conductive Multi-Flash and Traditional Drying Methods. LWT-Food Sci. Technol. 2017, 84, 717–725. [Google Scholar] [CrossRef]
  48. Kaushal, P.; Sharma, H.K. Osmo-Convective Dehydration Kinetics of Jackfruit (Artocarpus heterophyllus). J. Saudi Soc. Agric. Sci. 2016, 15, 118–126. [Google Scholar] [CrossRef]
  49. Vega-Gálvez, A.; Lemus-Mondaca, R.; Bilbao-Sáinz, C.; Fito, P.; Andrés, A. Effect of Air Drying Temperature on the Quality of Rehydrated Dried Red Bell Pepper (Var. Lamuyo). J. Food Eng. 2008, 85, 42–50. [Google Scholar] [CrossRef]
  50. Aral, S.; Bese, A.V. Convective Drying of Hawthorn Fruit (Crataegus Spp.): Effect of Experimental Parameters on Drying Kinetics, Color, Shrinkage, and Rehydration Capacity. Food Chem. 2016, 210, 577–584. [Google Scholar] [CrossRef] [PubMed]
  51. Beigi, M. Thin Layer Drying of Wormwood (Artemisia absinthium L.) Leaves: Dehydration Characteristics, Rehydration Capacity and Energy Consumption. Heat Mass Transf. 2017, 53, 2711–2718. [Google Scholar] [CrossRef]
  52. Maldonado, S.; Arnau, E.; Bertuzzi, M.A. Effect of Temperature and Pretreatment on Water Diffusion during Rehydration of Dehydrated Mangoes. J. Food Eng. 2010, 96, 333–341. [Google Scholar] [CrossRef]
  53. Kaur, P.; Kumar, A.; Arora, S.; Singh Ghuman, B. Quality of Dried Coriander Leaves as Affected by Pretreatments and Method of Drying. Eur. Food Res. Technol. 2006, 223, 189–194. [Google Scholar] [CrossRef]
  54. Winiczenko, R.; Górnicki, K.; Kaleta, A.; Janaszek-Mańkowska, M.; Choińska, A.; Trajer, J. Apple Cubes Drying and Rehydration. Multiobjective Optimization of the Processes. Sustainability 2018, 10, 4126. [Google Scholar] [CrossRef]
  55. Górnicki, K.; Choińska, A.; Kaleta, A. Effect of Variety on Rehydration Characteristics of Dried Apples. Processes 2020, 8, 1454. [Google Scholar] [CrossRef]
  56. Femenia, A.; Bestard, M.J.; Sanjuan, N.; Rosselló, C.; Mulet, A. Effect of Rehydration Temperature on the Cell Wall Components of Broccoli (Brassica oleracea L. Var. Italica) Plant Tissues. J. Food Eng. 2000, 46, 157–163. [Google Scholar] [CrossRef]
  57. Resio, A.C.; Aguerre, R.J.; Suarez, C. Hydration Kinetics of Amaranth Grain. J. Food Eng. 2006, 72, 247–253. [Google Scholar] [CrossRef]
  58. Kocabay, Ö.G.; İsmail, O. Investigation of Rehydration Kinetics of Open-Sun Dried Okra Samples. Heat Mass Transf. 2017, 53, 2155–2163. [Google Scholar] [CrossRef]
  59. Komes, D.; Lovrić, T.; Kovačević Ganić, K. Aroma of Dehydrated Pear Products. LWT-Food Sci. Technol. 2007, 40, 1578–1586. [Google Scholar] [CrossRef]
  60. Marabi, A.; Thieme, U.; Jacobson, M.; Saguy, I.S. Influence of Drying Method and Rehydration Time on Sensory Evaluation of Rehydrated Carrot Particulates. J. Food Eng. 2006, 72, 211–217. [Google Scholar] [CrossRef]
  61. Khazaei, J.; Mohammadi, N. Effect of Temperature on Hydration Kinetics of Sesame Seeds (Sesamum indicum L.). J. Food Eng. 2009, 91, 542–552. [Google Scholar] [CrossRef]
  62. Severini, C.; Baiano, A.; De Pilli, T.; Carbone, B.F.; Derossi, A. Combined Treatments of Blanching and Dehydration: Study on Potato Cubes. J. Food Eng. 2005, 68, 289–296. [Google Scholar] [CrossRef]
  63. Chen, S.; Wu, W.; Mao, S.; Li, K.; Zhang, H. Optimization of a Novel Vacuum Sublimation–Rehydration Thawing Process. J. Food Sci. 2023, 88, 259–272. [Google Scholar] [CrossRef] [PubMed]
Figure 1. Mass changes and rate of mass changes (a), dry matter changes and rate of dry matter changes (b), water changes and rate of water changes (c), moisture changes and rate of moisture content changes (d), and volume changes and rate of volume changes (e) for the rehydration (distiller water; 20 °C) of dried red beets cubes at different solid-to-liquid ratios of 1:20 (Applsci 14 06132 i001), 1:15 (Applsci 14 06132 i002), 1:10 (Applsci 14 06132 i003), 1:5, (Applsci 14 06132 i004), 1:3 (Applsci 14 06132 i005), and 1:1 (Applsci 14 06132 i006).
Applsci 14 06132 g001
Figure 2. Variations in parameter A1 with the solid-to-liquid ratio for mass gain (a), dry matter loss (b), water gain (c), moisture content increase (d), and volume increase (e). ♦ values from Table 2, ──Equation (5) (a,ce), Equation (6) (b).
Applsci 14 06132 g002
Figure 3. Variations in inverse of parameter A2 with the solid-to-liquid ratio for mass gain (a), dry matter loss (b), water gain (c), moisture content increase (d), and volume increase (e). ♦ values from Table 2, ──Equation (7).
Applsci 14 06132 g003
Table 1. Statistical tests of the Peleg model applied to simulate dried red beets rehydration curves.
Solid-to-Liquid RatioStatistical
Criterion
Mass GainDry Matter LossWater GainMoisture Content IncreaseVolume Increase
1:20R20.9778410.9901220.9800340.9863910.978582
RMSE2.7614680.1600822.8014460.4945711.985095
1:15R20.9769740.9884290.9785780.9793640.983792
RMSE1.9861130.1679642.1807060.4809821.641184
1:10R20.9899930.9915710.9914650.9935210.979681
RMSE1.2181650.1276371.2933320.2163521.715386
1:5R20.9730970.9347430.9781940.9932530.985869
RMSE1.7283020.2136591.6920720.1315131.157729
1:3R20.976920.728370.9816040.9888820.957971
RMSE1.2814040.2964521.1847850.1098651.676851
1:1R20.9937960.7080770.9943710.9933510.950684
RMSE0.2611700.158260.3664030.0351410.704667
Table 2. Values of the parameters of the Peleg model applied to simulate dried red beets rehydration curves.
Solid-to-Liquid RatioParameterMass Gain (1)Dry Matter Loss (2)Water Gain (3)Moisture Content Increase (4)Volume Increase (5)
1:20A10.6746.1250.5816.5330.555
A20.0210.2040.0190.0800.024
1:15A10.6074.5120.5095.8340.634
A20.0240.2050.0210.0890.025
1:10A10.5703.4150.4674.4180.584
A20.0260.2300.0230.1150.027
1:5A10.7391.9170.5634.5580.656
A20.0300.4010.0280.1980.034
1:3A10.6471.9100.5103.9300.621
A20.0410.6290.0370.3090.040
1:1A10.3091.9000.1981.6130.478
A20.1001.2350.0880.8330.124
(1) A1 in min/g and A2 in 1/g; (2) A1 in min/g and A2 in 1/g; (3) A1 in min/g and A2 in 1/g; (4) A1 in min/d.b. and A2 in 1/d.b.; (5) A1 in min/cm3 and A2 in 1/cm3.
Table 3. Values of constants in Equation (5) for A1 (mass gain, water gain, moisture content increase, and volume increase), in Equation (6) for A1 (dry matter loss), and in Equation (7) for A2.
ParameterConstantMass GainDry Matter LossWater GainMoisture Content IncreaseVolume Increase
A1a11.102900.161042.403450.413130.38017
a21.423941.554551.566840.145121.59827
A2a10.0118321.232120.060080.560680.06615
a20.068860.130490.0117130.061740.02050
Table 4. Statistical tests of Equations (5)–(7) applied to determine the Peleg model parameters.
ParameterStatistical
Criterion
Mass GainDry Matter LossWater GainMoisture Content IncreaseVolume Increase
A1R20.89570.93500.90400.95710.9654
RMSE0.00024 × 10−50.00010.23202 × 10−5
A2R20.99040.98450.99770.98600.9920
RMSE39.39760.01823.41620.916029.7406
Table 5. Values of the Peleg model parameters at extreme values of the solid-to-liquid ratio according to Equations (5)–(7).
VariableExtreme Solid-to-Liquid RatioA1A2
Mass grainMw (1)/md (2)→∞1.42390.0183 1/g
Dry matter lossmd/Mw→∞1.5546-
Mw/md→∞-0.1305 1/g
Water gainMw/md→∞0.63820.0171 1/g
Moisture content increaseMw/md→∞6.89090.0617 1/d.b.
Volume increaseMw/md→∞0.62570.0205 1/cm3
(1) Mw is the mass of rehydrating water at the beginning of the rehydration. (2) md is the mass of dried red beets at the beginning of the rehydration.
Table 6. Statistical tests of the Peleg model applied to simulate dried red beets rehydration curves at the model parameters expressed with Equations (5)–(7) and constants from Table 3.
Solid-to-Liquid RatioStatistical
Criterion
Mass GainDry Matter LossWater GainMoisture Content IncreaseVolume Increase
1:20R20.97750.98460.97940.98220.9800
RMSE2.25190.37072.30390.43632.1207
1:15R20.97730.98490.97960.97700.9837
RMSE2.16730.18762.32980.64431.6507
1:10R20.98950.98810.99130.99230.9797
RMSE1.48710.25571.76270.41411.8390
1:5R20.96620.91310.97330.99290.9847
RMSE1.94510.25261.82390.40981.3127
1:3R20.97170.70420.97650.98780.9589
RMSE1.37630.36161.38290.53381.6643
1:1R20.98740.72530.99130.98870.9374
RMSE1.00750.16811.24620.32952.6472
Disclaimer/Publisher’s Note: The statements, opinions and data contained in all publications are solely those of the individual author(s) and contributor(s) and not of MDPI and/or the editor(s). MDPI and/or the editor(s) disclaim responsibility for any injury to people or property resulting from any ideas, methods, instructions or products referred to in the content.

