1. Introduction
China has strict gun control, but the number of gun cases has increased year by year. The Ministry of Public Security announced at a press conference that, since 2023, a total of 13,000 gun explosion cases have been investigated and 43,000 guns have been confiscated. Because the marks on the bullets and shell casings have a strong reflection on the gun equipment [
1,
2], through the inspection and analysis of guns and bullets in gun-related cases, the obtained information is of great significance to the matching identification of the types of guns and bullets [
3] and provides reliable evidence for the detection of cases. Bullet marks are small, usually up to the micron level, so traditional bullet mark detection is performed by technicians operating microscope equipment combined with image processing technology to observe and compare the features of the bullet marks [
4]. However, this comparison method lacks objective quantitative analysis and technical personnel are highly subjective, so the results are not objective and comprehensive.
In the early 2000s, with the development of optical imaging instruments with the ability to acquire depth data, researchers began to apply such instruments to the examination of bullet marks. Two-dimensional images initially acquired by optical photography technology will be affected by lighting conditions, the reflection of bullet metal materials, the material color, and other factors [
5]. Three-dimensional image acquisition technology can avoid these effects. At present, bullet mark inspection is gradually changing from 2D to 3D measurement, comparison, and identification to increase useful information [
6,
7]. Bacharach [
6] proposed in 2002 that 3D imaging could better characterize the surface feature topography of bullets. With the development and popularity of various 3D scanning technologies, various scanning devices can quickly acquire 3D point clouds on the bullet surface, including confocal microscopy [
8], coherent scanning interferometry [
9], photometric stereoscopy [
10], structured light scanning [
11], and zoom [
12]. To obtain the surface topography of the warhead, the warhead is usually scanned at different angles, and the obtained point cloud data of all parts need to be registered into the same coordinate system by using registration technology; that is, a complete three-dimensional point cloud model of the warhead is registered. Point cloud registration technology affects the quality of the three-dimensional point cloud model.
Domestic and foreign researchers have invested a lot of research on point cloud registration technology. Although the registration problem has been extensively studied, most of the current methods are mainly based on the feature matching between point cloud data, while the overlapping regions between point cloud data are relatively less considered. Besl and Mckay [
13] proposed one of the most classical algorithms in the field of point cloud registration, the iterative closest point (ICP) algorithm. The ICP algorithm can produce accurate results when initialized near the optimal pose, but is not reliable without initialization. A series of ICP-based variants enhance the robustness of ICP algorithms [
14], such as TRICP [
15] and GOICP [
16]. Ji et al. [
17] proposed a hybrid algorithm combining the genetic algorithm and ICP algorithm. Meng [
18] combined kd-tree and extrapolation to improve the speed and accuracy of the ICP algorithm. Zhu et al. [
19] deployed an improved iterative nearest point (ICP) algorithm in which an adaptive threshold was introduced to accelerate the iterative convergence. Although the classical ICP registration problem has received extensive attention and improvement, most of the current methods rarely consider the overlapping region between point clouds. The overlap area of a point cloud refers to the area with the same structure between the data of two point clouds. Li [
20] et al. analyzed the geometric structural features of point clouds for segmentation, created multidimensional shape descriptors for each block, and used these descriptors to identify overlapping regions between the point clouds. However, this approach can lead to false matches when there are multiple similar structures. In addition, when implementing the registration algorithm, if the point pairs matched by features are not selected from the overlapping region of two point clouds, many incorrect corresponding point pairs will be generated, thus reducing the accuracy of the matching. When the overlap rate is lower than 60%, the registration difficulty is increased, and, in practical applications, a low overlap degree of point clouds is often encountered [
21,
22]. On the one hand, problems such as occlusion may be encountered in the process of 3D scanning, which cannot ensure that the overlap rate of each scan is very high; on the other hand, in view of the relatively high cost of point cloud data acquisition, the adoption of low-overlap-rate point clouds can effectively reduce the number of point cloud fragments that need to be processed, thus reducing the overall workload of the registration.
In our experiments, we found that the bullet as a feature with fine bullet marks is more of a challenge in the low-overlap-rate alignment process. Compared with traditional images and depth images, the features of bullet point clouds are more difficult to extract, so it is difficult for existing point cloud alignment algorithms to accurately align bullet point clouds. Especially in cases such as small overlapping areas, these algorithms suffer from poor accuracy, falling into local optimization, or even the inability to align and mismatch. To address the shortcomings of the existing alignment algorithms, this paper proposes a low-overlap bullet point cloud registration method based on line feature detection. By fitting the central axis, good initial locations of the two bullet point clouds with large differences are found to simplify the search space for subsequent rotation parameters. Then, the linear features of the bullet are extracted by using an icosahedral fitting discrete Hof transform. Finally, an improved Cuckoo algorithm is used to find the optimal rotation angle to reduce the complexity of the matching algorithm and achieve low-overlap bullet point cloud registration.
The paper is organized as follows.
Section 1 describes the research background and related work.
Section 2 is devoted to our methodology.
Section 2.1 introduces automatic cyclic voxel downsampling, while
Section 2.2 explains the principle of fitting the bullet median.
Section 2.3 introduces the use of the discrete Hough transform to extract the linear features of the bullet traces.
Section 2.4 searches for the optimal rotation angle in the parameter space using the improved Cuckoo algorithm to achieve the low overlap rate of the bullet point cloud alignment. In
Section 2.5, the algorithm is analyzed for its computational complexity. In
Section 3, we apply this algorithm to some noisy bullet point cloud models and actual bullet point cloud data collected, and compare the results with those of the ICP, TRICP, and GOICP algorithms, where the computational error is close to zero, which proves the validity of this algorithm. Suggestions for possible further improvements of the algorithm are presented in
Section 4. Finally, in
Section 5, the methodology and experimental results used in this paper are summarized.
2. Bullet Low-Overlap Point Cloud Registration Based on Line Feature Detection
Generally speaking, registration is used to find a transformation that transforms the target point cloud to the source point cloud position in 3D space. Unlike the method used by Horner, Ji Ri [
23], or Pomerleau et al. [
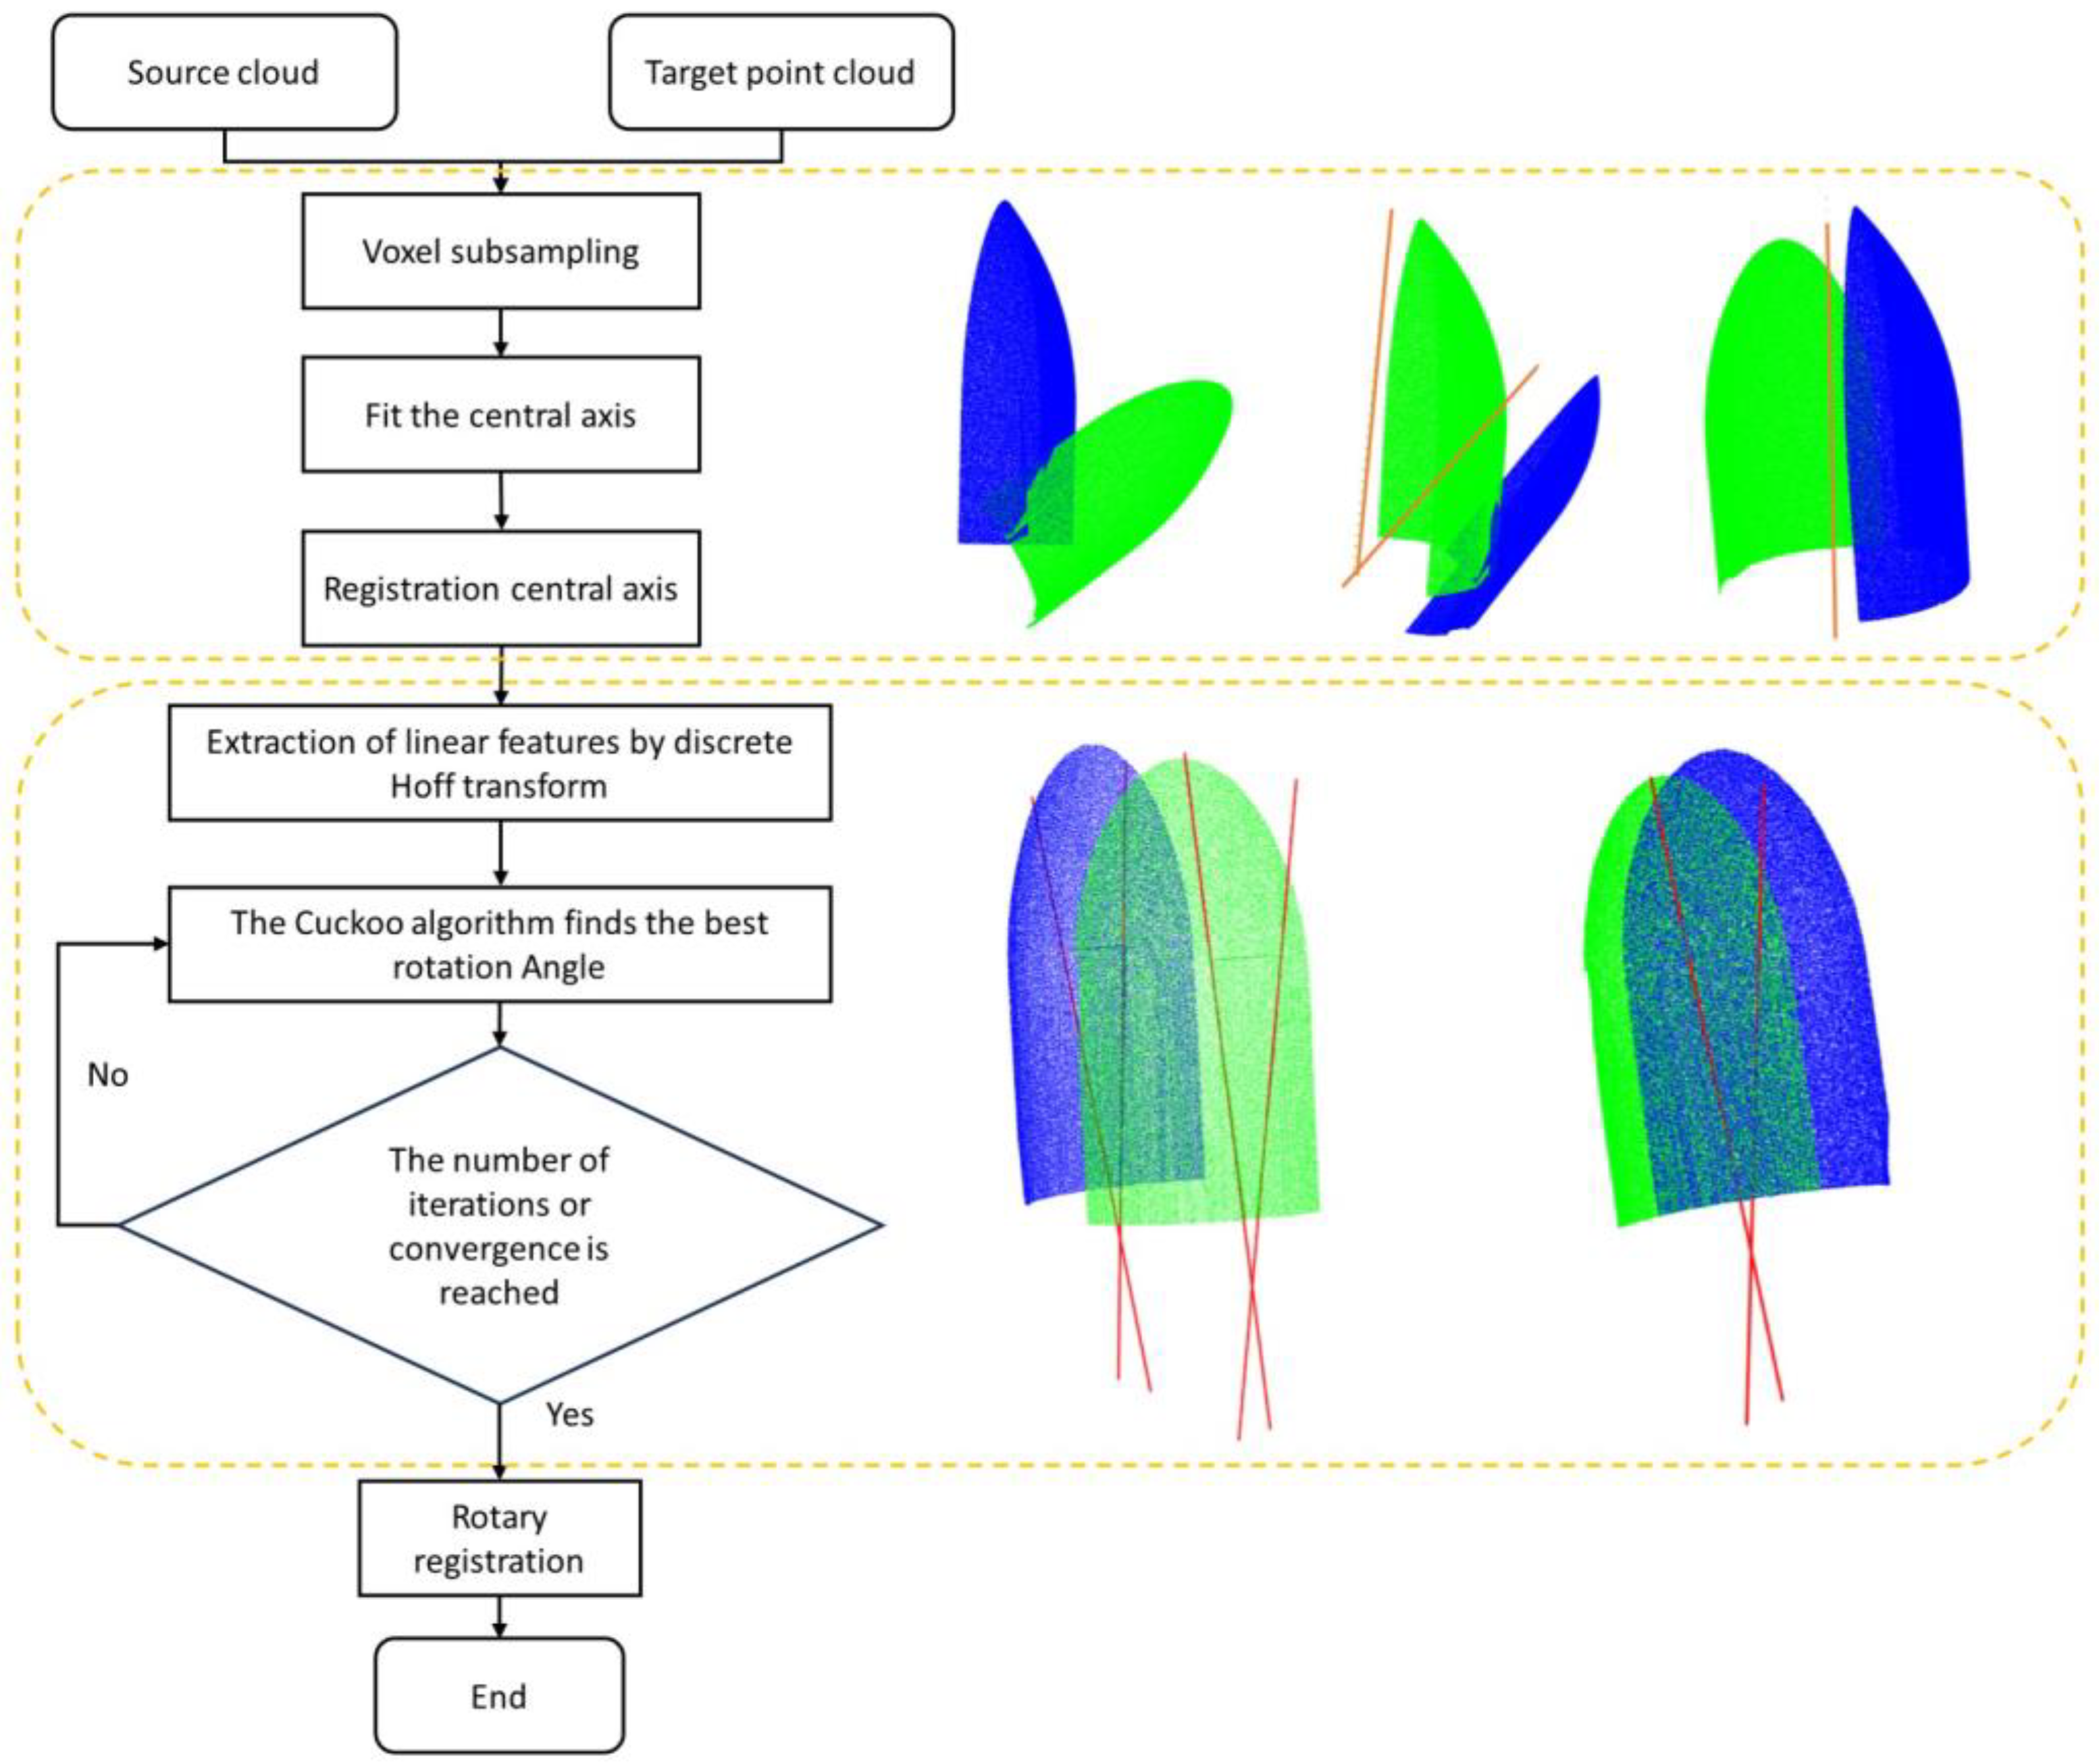
24], the algorithm in this paper does not require complex computation to generate and match local descriptors for key points in the scanning process. Instead, as shown in
Figure 1, a good initial position is determined by using the coarse registration of the central axis, and then the optimal rotation angle is found by improving the Cuckoo algorithm. The core of the registration algorithm is to reduce the search space by finding good initial position optimization transformation parameters, rather than searching the whole parameter space to find the optimal transformation.
2.1. Voxelization Downsampling
Due to the large number of point clouds on the surface of the captured warhead, the running time will be greatly increased, and the presence of noise will reduce the data quality. Point cloud filtering can well solve the above problems [
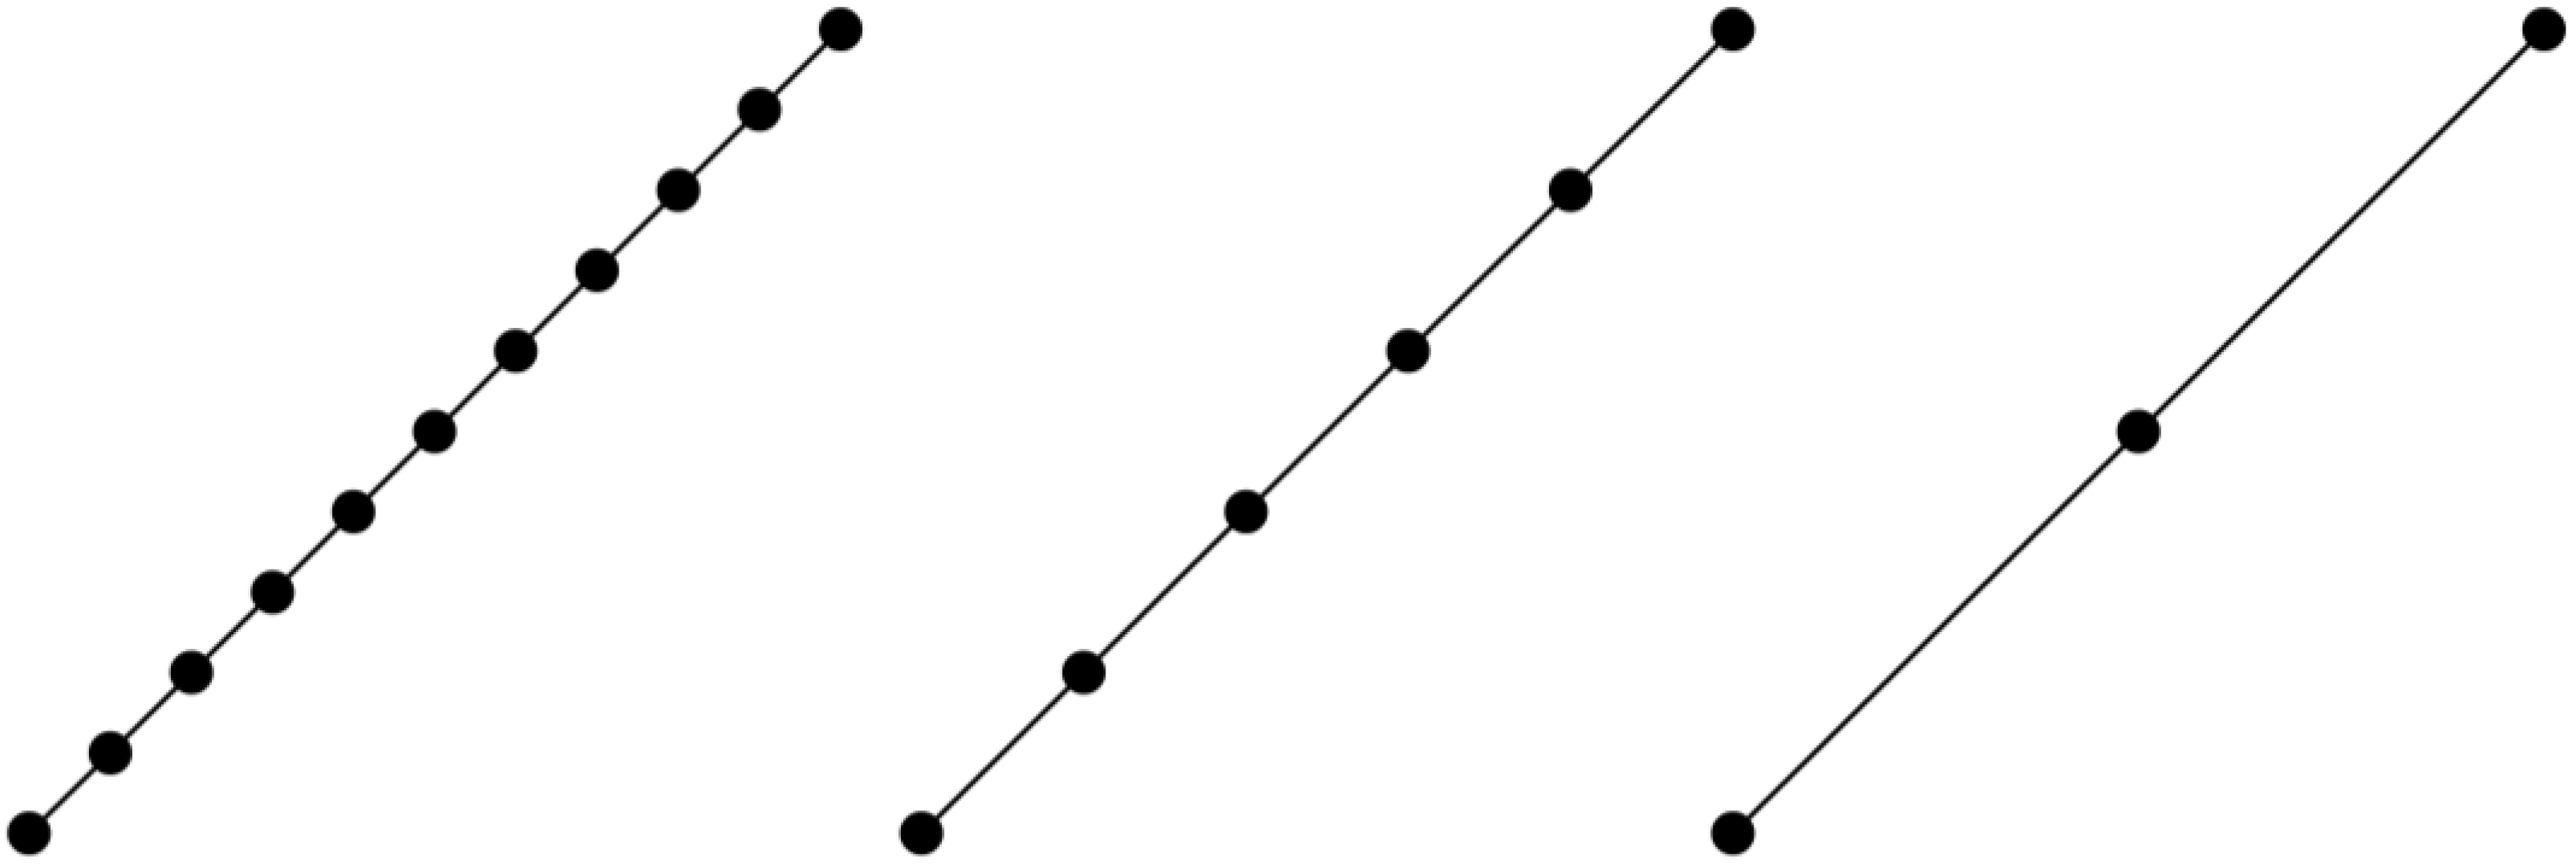
25], and the filtered point cloud will use fewer points to describe warhead information than the original point cloud collection, as shown in
Figure 2. Through investigation, we can consider bullet marks as linear features [
1] to describe the same linear bullet marks. The original dense point cloud requires 10 point clouds to describe and contain noise points, while the filtered point cloud only requires 3 points to describe the linear features.
In order to reduce the size of the point cloud, this paper uses voxel filtering to create a three-dimensional voxel grid, filters the point cloud with a uniform resolution of 0.003 mm, adopts automatic cyclic voxel filtering, calculates the maximum and minimum values of the x-, y-, and z-axes of the input point cloud, establishes a three-dimensional boundary box according to these values, and divides the boundary box into small cubes with specified voxel sizes. While the actual acquisition of the bullet point cloud data is usually in the order of millions, a reasonable filtering of the dense point cloud can help to improve the alignment efficiency.
2.2. Fitting the Registration Central Axis
Fitting the central axis is used to shorten the calculation time of the subsequent registration. By fitting the central axis of two sets of bullet point cloud data, the distance between two points in space can be effectively reduced. In this paper, a pre-registration method based on the geometric features of the warhead is proposed. Two bullet point clouds with large position differences in space are registered on the same central axis. The algorithm for fitting the central axis is as follows (see Algorithm 1).
| Algorithm 1 Fit the registration central axis |
Input: Point cloud data P1 and P2 of two bullets
Output: Pre-registered point clouds P1’ and P2’ along the same central axis |
- 1:
Compute ymin and ymax for point cloud P1 - 2:
Divide the y-axis range [ymin, ymax] into n layers, each with height Δy = (ymax − ymin)/n - 3:
for each layerk, do - 4:
layerk ← [ymin + (k − 1) × Δy, ymin + k × Δy] - 5:
(xi, yi, zi)← { (x, y, z)|ymin + (k − 1) × Δy ≤ y ≤ ymin + k × Δy } - 6:
end for - 7:
for each layerk, do - 8:
Randomly select four non-coplanar points: (x1, y1, z1), (x2, y2, z2), (x3, y3, z3), (x4, y4, z4) - 9:
Verify the four points are not coplanar - 10:
Solve the circumsphere equation to find the sphere center (h, l, k) using SVD - 11:
Collect all sphere centers to form point set S - 12:
end for - 13:
Remove invalid points from S that exceed the point cloud’s y-axis range to obtain filtered point set S’ - 14:
Centering and Principal Component Analysis (PCA) - 15:
Fit the central axis line of P2 similarly to find line points L’ - 16:
Pre-register P1 and P2 by aligning their central axis lines L and L’ - 17:
Output the pre-registered point clouds P1’ and P2’
|
- 18:
end
|
Treat bullet point cloud data as a set of points P = {P1, P2, …, Pm}. Each of these points Pi is a three-dimensional coordinate (xi, yi, zi). First, compute the maximum and minimum values of the Y-axis, stratifying these points in the Y-axis direction, as follows:
Based on y
min and y
max, the whole range is divided into n layers. The height range of each layer Δy is as follows:
For each layer k, define its height range on the Y-axis as [y
min + (k − 1)Δy, y
min + kΔy], where k = 1, 2, …, n. Each layer contains points that meet the following conditions:
- 2.
For each layer
k, take any of the four points to remember, (x
1, y
1, z
1), (x
2, y
2, z
2), (x
3, y
3, z
3), and (x
4, y
4, z
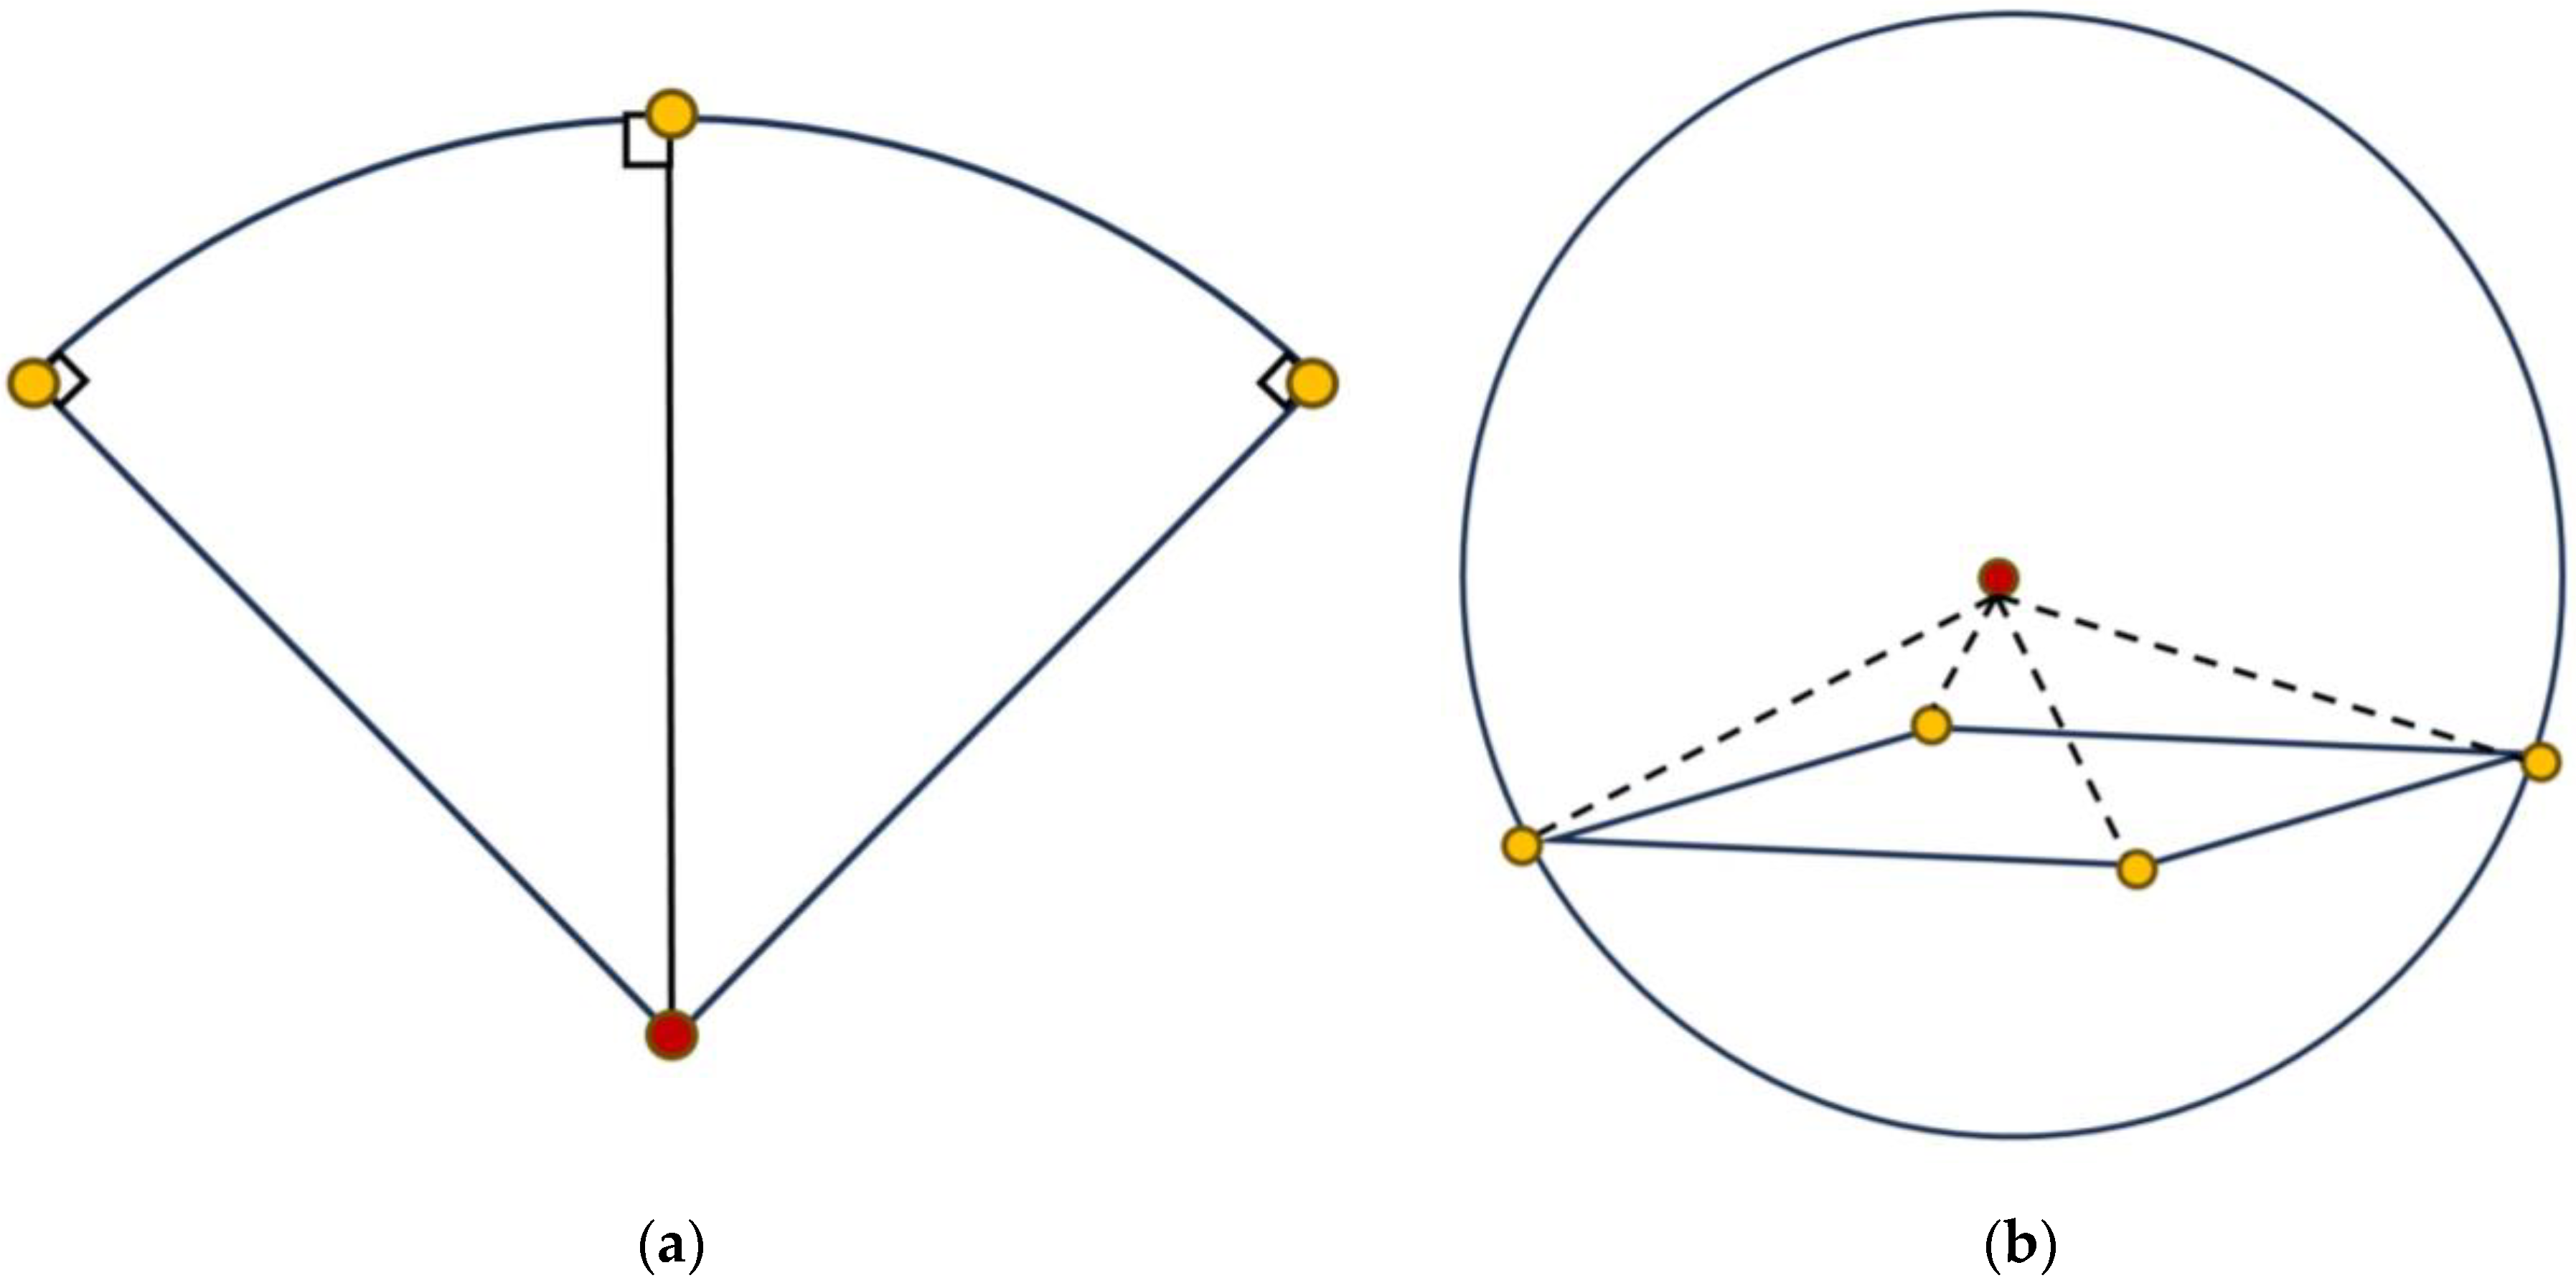
4), as shown in
Figure 3, for each layer of the outer ball, where each layer is marked as (h, l, k). First, verify that the four points are not coplanar; if any of them are coplanar, then discard the coplanar point and take any one more point for verification, and then bring the four points that are not coplanar into the equation of the outer sphere to obtain the following four equations:
By constructing a linear equation, SVD is applied to find the best solution in the sense of least squares, that is, (h, l, k), the coordinate point set X of the center of the sphere.
- 3.
In all of the obtained spherical center coordinate point sets X, the invalid points whose axis ranges exceed the point cloud are eliminated to obtain the point set X″.
- 4.
The point cloud data X″ is a matrix of n × 3, where n is the number of points; calculate the central point of the point cloud, that is, p0, the average of the coordinates of all points on each dimension, as follows:
Centralize the coordinates of all points to form a new set of points X′, such that each point is x’ = x
i − p
0. Find a direction vector v that maximizes the projection variance of the point set X’ in that direction. This is achieved by solving the eigenvalues and eigenvectors of the covariance matrix C, as follows:
After finding the first principal component direction v1, take a series of points along that direction, calculate the projection ti = xi · v1 of each point after centralization in the direction v1, and then evenly choose a series of t values between the largest and smallest ti, which corresponds to the point L(t) = p0 + tv1 on the line.
- 5.
A good coarse registration position of two low-overlapping point clouds on the coaxial line is obtained by matching the central axis of two point clouds.
2.3. Extraction of Linear Features by Discrete Hoff Transform
Many existing alignment algorithms, such as the ICP algorithm, have high requirements for the initial position of the point cloud alignment, and many incorrect feature point matches can occur with small overlap rates, both of which can result in excessive errors in the results. This paper is implemented in the following ways: (1) avoiding the key point detection method and treating the “line shape” in the data as the feature to be matched; (2) using a technique that does not depend on the initial configuration of the search results, which is usually not affected by local spurious feature matching between features, because the algorithm in this paper takes into account the global relative position of the detected features; (3) performing a geometric constraint alignment search using a similar idea as in [
26]. We draw on this idea by filtering the entire set of impact points by the most linear feature of the bullet marks, discarding widely varying correspondences and extracting the marks as linear features. The detected bullet marks are shown in
Figure 4.
2.3.1. Sharp Feature Detection
For each point q in the bullet point cloud after voxel downsampling, point q is assigned to the set G
A or G
B, and a value δ(q) is defined. The calculation formula is as follows [
27]:
2.3.2. Line Feature Detection
After identifying subsets GA’ ⊂ GB and GB’ ⊂ GB that contain sharp feature points, we continue to look for linear features in these subsets.
The line features are found by discretizing the Hough parameter space into a regular icosahedron. This step uses the method in [
28].
Use an improved version of the Hough transform algorithm, which is applied iteratively and corrected with least squares error line fitting to improve the accuracy.
2.4. Improved Cuckoo Algorithm to Find the Best Rotation Angle
Point cloud registration methods usually find local descriptors that match in two global scans for the registration. In this paper, a good initial position is found by fitting the registration axis, and the parameter space is simplified to reduce the computational complexity. After fitting the central axis of registration, it is sufficient to consider only the rotation of the central axis [
29]. In order to determine the rotation relationship between the two point clouds, the Improved Cuckoo Search (ICS) algorithm [
30] was adopted in this paper to find the optimal rotation angle in the parameter space to achieve the purpose of fine registration (see Algorithm 2).
| Algorithm 2 Improved Cuckoo Search Algorithm for Bullet Point Cloud Registration |
Input: Point clouds P1 and P2 of two bullets
Population size n ← 20
Maximum iterations MaxIter ← 30
Output: Optimal rotation matrix for aligning P1 to P2 |
- 1:
Initialize population (nests) with random solutions - 2:
Evaluate fitness of each nest - 3:
Identify the current best nest with the highest fitness - 4:
for iter ← 1 to MaxIter do - 5:
for each nest i do - 6:
Randomly select three nests xi, xj, xk from the population - 7:
xnew ← xi + r × (xj − xk), r ← [0, 1], and α ←0.01 - 8:
Apply Lévy flight: L ← (Γ(1 + β)×sin(π × β)/(Γ((1 + β)/2) × β × 2^((β − 1)/2)))^(1/β) u ← normal(0, σ_u^2) v ← normal(0, σ_v^2) step = u/abs(v)^(1/β) xnew ← xnew + step × (xnew − best_nest) - 9:
if fitness(xnew) > fitness(xi) then - 10:
xi ← xnew - 11:
end if - 12:
end for - 13:
for each nest i do - 14:
With probability pa, discard nest i and generate a new nest using: xnew ← xr1 + r × (xr2 − xr3), where xr1, xr2 are two randomly chosen nests, r is a random number in [0, 1] - 15:
end for - 16:
Evaluate fitness of all nests - 17:
Identify the current best nest with the highest fitness - 18:
end for - 19:
Output the optimal rotation matrix from the best nest
|
- 20:
end
|
The Cuckoo Search Algorithm is a heuristic optimization algorithm that mimics the parasitic breeding behavior of cuckoo birds. The core of improving the Cuckoo Search Algorithm is to increase the diversity of the population by exchanging information about different members within the group. The periodic and oscillation characteristics of sine and cosine functions are used to optimize the convergence to the global optimal solution, which mainly includes the following aspects:
Parasitic breeding: Cuckoos place their eggs in the nests of other birds. In the algorithm, this is simulated as finding new solutions in the solution space. The basic principle of this mechanism is to increase the diversity of the population by exchanging information about different members within the population, and to use the periodic and oscillatory properties of the sine and cosine functions to optimize the convergence to the global optimal solution. First, 3 individuals are randomly selected from the entire nest x and then passed as follows:
Three of them are x(q1), x(q2), and x(q3), where n is the number of population sizes, usually a constant value of 0.01, and Lévy is Levi’s flight, the current optimal nest location; maxiter is the maximum number of iterations, and r ∈ {0, 1] is a random number.
- 2.
Egg discovery and discarding: If other birds find foreign eggs, they discard the nest with the probability of pa ∈ [0, 1], and then rebuild the nest in the following way:
where
and
are two random locations of the nth generation population.
- 3.
Levy flight: Cuckoo’s movement follows Levy flight, a random walk with a small step aggregation and an occasional long leap. Although this method is conducive to jumping out of a local optimal, the accuracy of the search is entirely determined by the small step aggregation [
30]. To solve this problem, the improved algorithm uses the random iteration number change formula, so that the search range is wide in the initial iteration, and narrow in the later iteration, and then searches around the optimal value. The calculation formula is as follows:
where Γ is a gamma function, μ and ν are independent random variables subject to normal distribution with a mean of 0 and variance of 1, β ∈ [1, 2] is a constant, and r
1,r
2 ∈ [0, 1] is a random number. In an ideal case, the rotation transformation between the two bullet point clouds is obtained by using the improved Cuckoo algorithm, and the solving error of the transformation is 0 [
31]. In fact, due to the influence of measurement errors and other factors, the distance between corresponding features cannot reach the ideal position through iteration, so the solution of the problem of seeking the best rotation angle becomes as follows. To minimize the Euclidean distance between the target point cloud P = {P
1, P
2, …, P
m} and the source point cloud Q = {Q
1, Q
2, …, Q
n}, the transformation matrix parameters are first encoded and normalized, which represent the nest position in the Cuckoo Search Algorithm. Then, the Cuckoo Search Algorithm is used to optimize the objective function of the point cloud model. The Cuckoo global optimization function based on pattern search and chemotactic behavior is as follows:
The parameters of the algorithm in this paper are set as follows: the population number is set to 20, the rotation angle range is [0°, 360°], Pa = 0.25, and the maximum number of iterations is set in the experiment, and the optimal rotation angle is obtained by running it independently and completely 30 times.
2.5. Algorithm Complexity Analysis
This algorithm mainly includes the following four steps: voxel downsampling, fitting the central axis, using the discrete Hough transform to extract line features, and improving the Cuckoo algorithm to find the optimal rotation angle to complete the matching. The total computational complexity is O(m + k3 + n. + T-m + m), where m is the number of points in the point cloud, and assuming that there are k voxels on each axis, and the number of populations n is set to 20 and the maximal number of iterations is T, then k3 ≪ m and n ≪ m and h ≪ m, where the overall complexity is then mainly controlled by O(T-m). The ICP algorithm consists of initializing the alignment, iterating the nearest-point matching, calculating the transformation matrix and applying it, and iterating until convergence, and the computational complexity is O(T − (mlogm + m)) = O(mlogm). Similarly, the computational complexity of TRICP and GOICP is O(T − (mlogm + m)) and O(T − (mlogm + m) + bd), where the GOICP algorithm branch delimitation is obtained by the branching factor b = 3 and depth of tree d = 10. The algorithms in this paper have some advantages in terms of complexity.
3. Experimental Result
In order to verify the performance of the proposed algorithm, the point cloud data of the three-dimensional morphology of different types of warheads were obtained, respectively. The actual bullet point cloud collected on the automatic zoom three-dimensional surface measuring instrument and the bullet point cloud obtained from the CAD model were taken as the experimental data. The proposed algorithms, ICP, TRICP, and GOICP, were used for the registration, and the experimental results were analyzed. The experimental platform was the Intel(R) Core (TM) i5-8250U CPU @ 1.60 GHz 1.80 GHz processor (Intel, Santa Clara, CA, USA), with 8 GB of memory, using Windows 10, a 64-bit operating system, and a Matlab 2022b coding environment.
The initial position of the bullet point cloud sampled by the CAD model is shown in
Figure 5, where the 9 mm_source is the source point cloud, represented in green, and the 9 mm_target is the target point cloud, represented in blue.
The algorithm proposed in this paper can simplify the dense point cloud to the specified resolution.
Table 1 shows the point cloud filtering results when the target size is specified as 0.003 mm. After two voxel filtering operations, the point cloud can be automatically adjusted to the specified size, and the resolution of the source point cloud is basically the same as that of the target cloud, with an error of about 1.4%.
The registration results of the bullet point clouds under different overlap rates are shown in
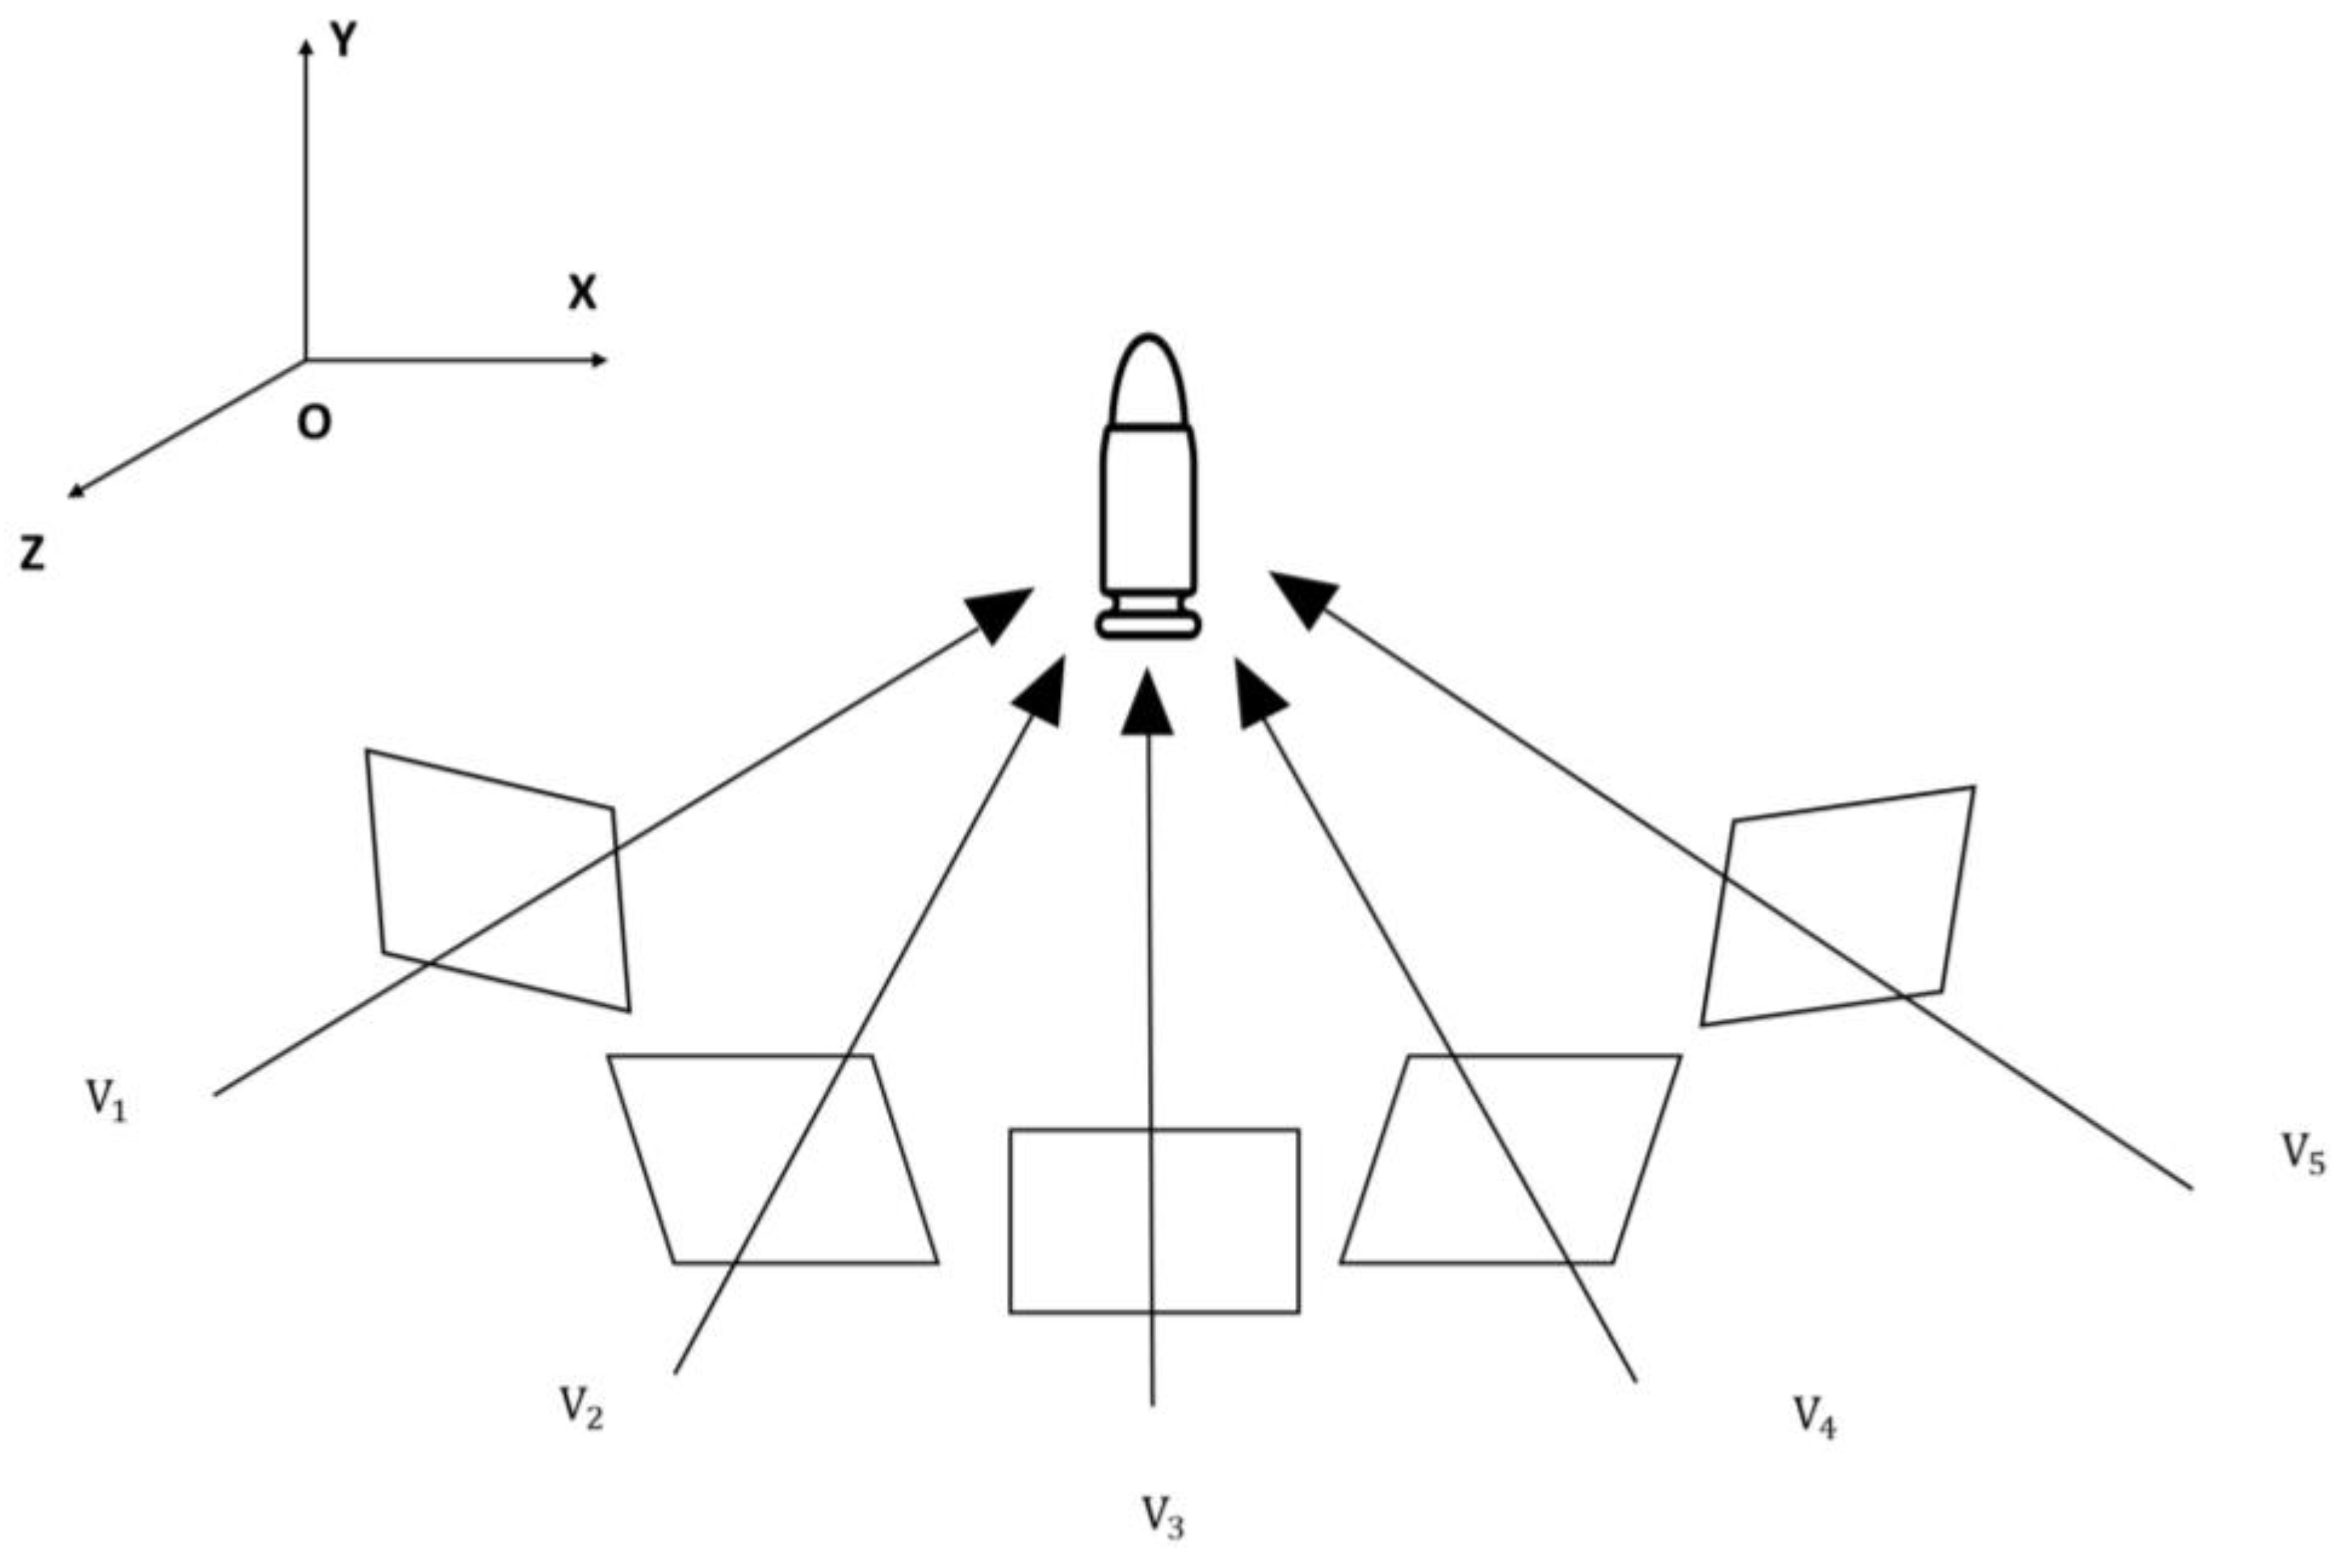
Table 2. The CAD model of the bullet is similar to that of five bullet point clouds generated by the three-dimensional topography measurement from five angles, as shown in
Figure 6, with different overlap rates among the point clouds. The definition is based on local density comparison of the points in the two aligned point clouds to assess their spatial overlap degree. By calculating the local density of each point within a given search radius and comparing the density ratio of the corresponding pair of points, the two points are considered to overlap when the local densities of the two points are similar. The ratio of the total number of overlapping points to the total number of points in the point cloud is defined as the overlap rate.
Part of the CAD bullet point cloud obtained from the above five different angles was used for the registration experiments, and the proposed algorithm was compared with the ICP, TRICP, and GOICP algorithms. The ICP algorithm is a classical registration algorithm that is easy to implement and has a high efficiency, but is easily affected by the initial position. The TRICP algorithm provides a more robust registration method by improving the ability to deal with outliers and partial overlaps through a pruning mechanism; the GOICP algorithm is committed to solving the local optimal problem of the ICP algorithm and providing the global optimal solution, but the calculation cost is high. The experimental results are shown in
Table 2. It can be seen that the proposed algorithm has a good registration effect when the overlap rate is greater than 20%, while the ICP algorithm fails when the overlap rate is lower than 40%.
At the same time, we use the mean distance error, nearest neighbor distance error, Hausdorff distance, and root error for the overlapping regions of the mean square as the registration error, where the smaller the registration error, the better the registration effect. It can be seen from
Table 3,
Table 4,
Table 5 and
Table 6 that the registration algorithm proposed in this paper has a high speed and high registration accuracy. When the overlap rate is large, the registration accuracy of these registration algorithms is similar. With the decrease in the overlap rate, when the overlap rate is not less than 20%, the registration algorithm proposed in this paper has a higher registration accuracy than the ICP, TRICP, and GOICP algorithms.
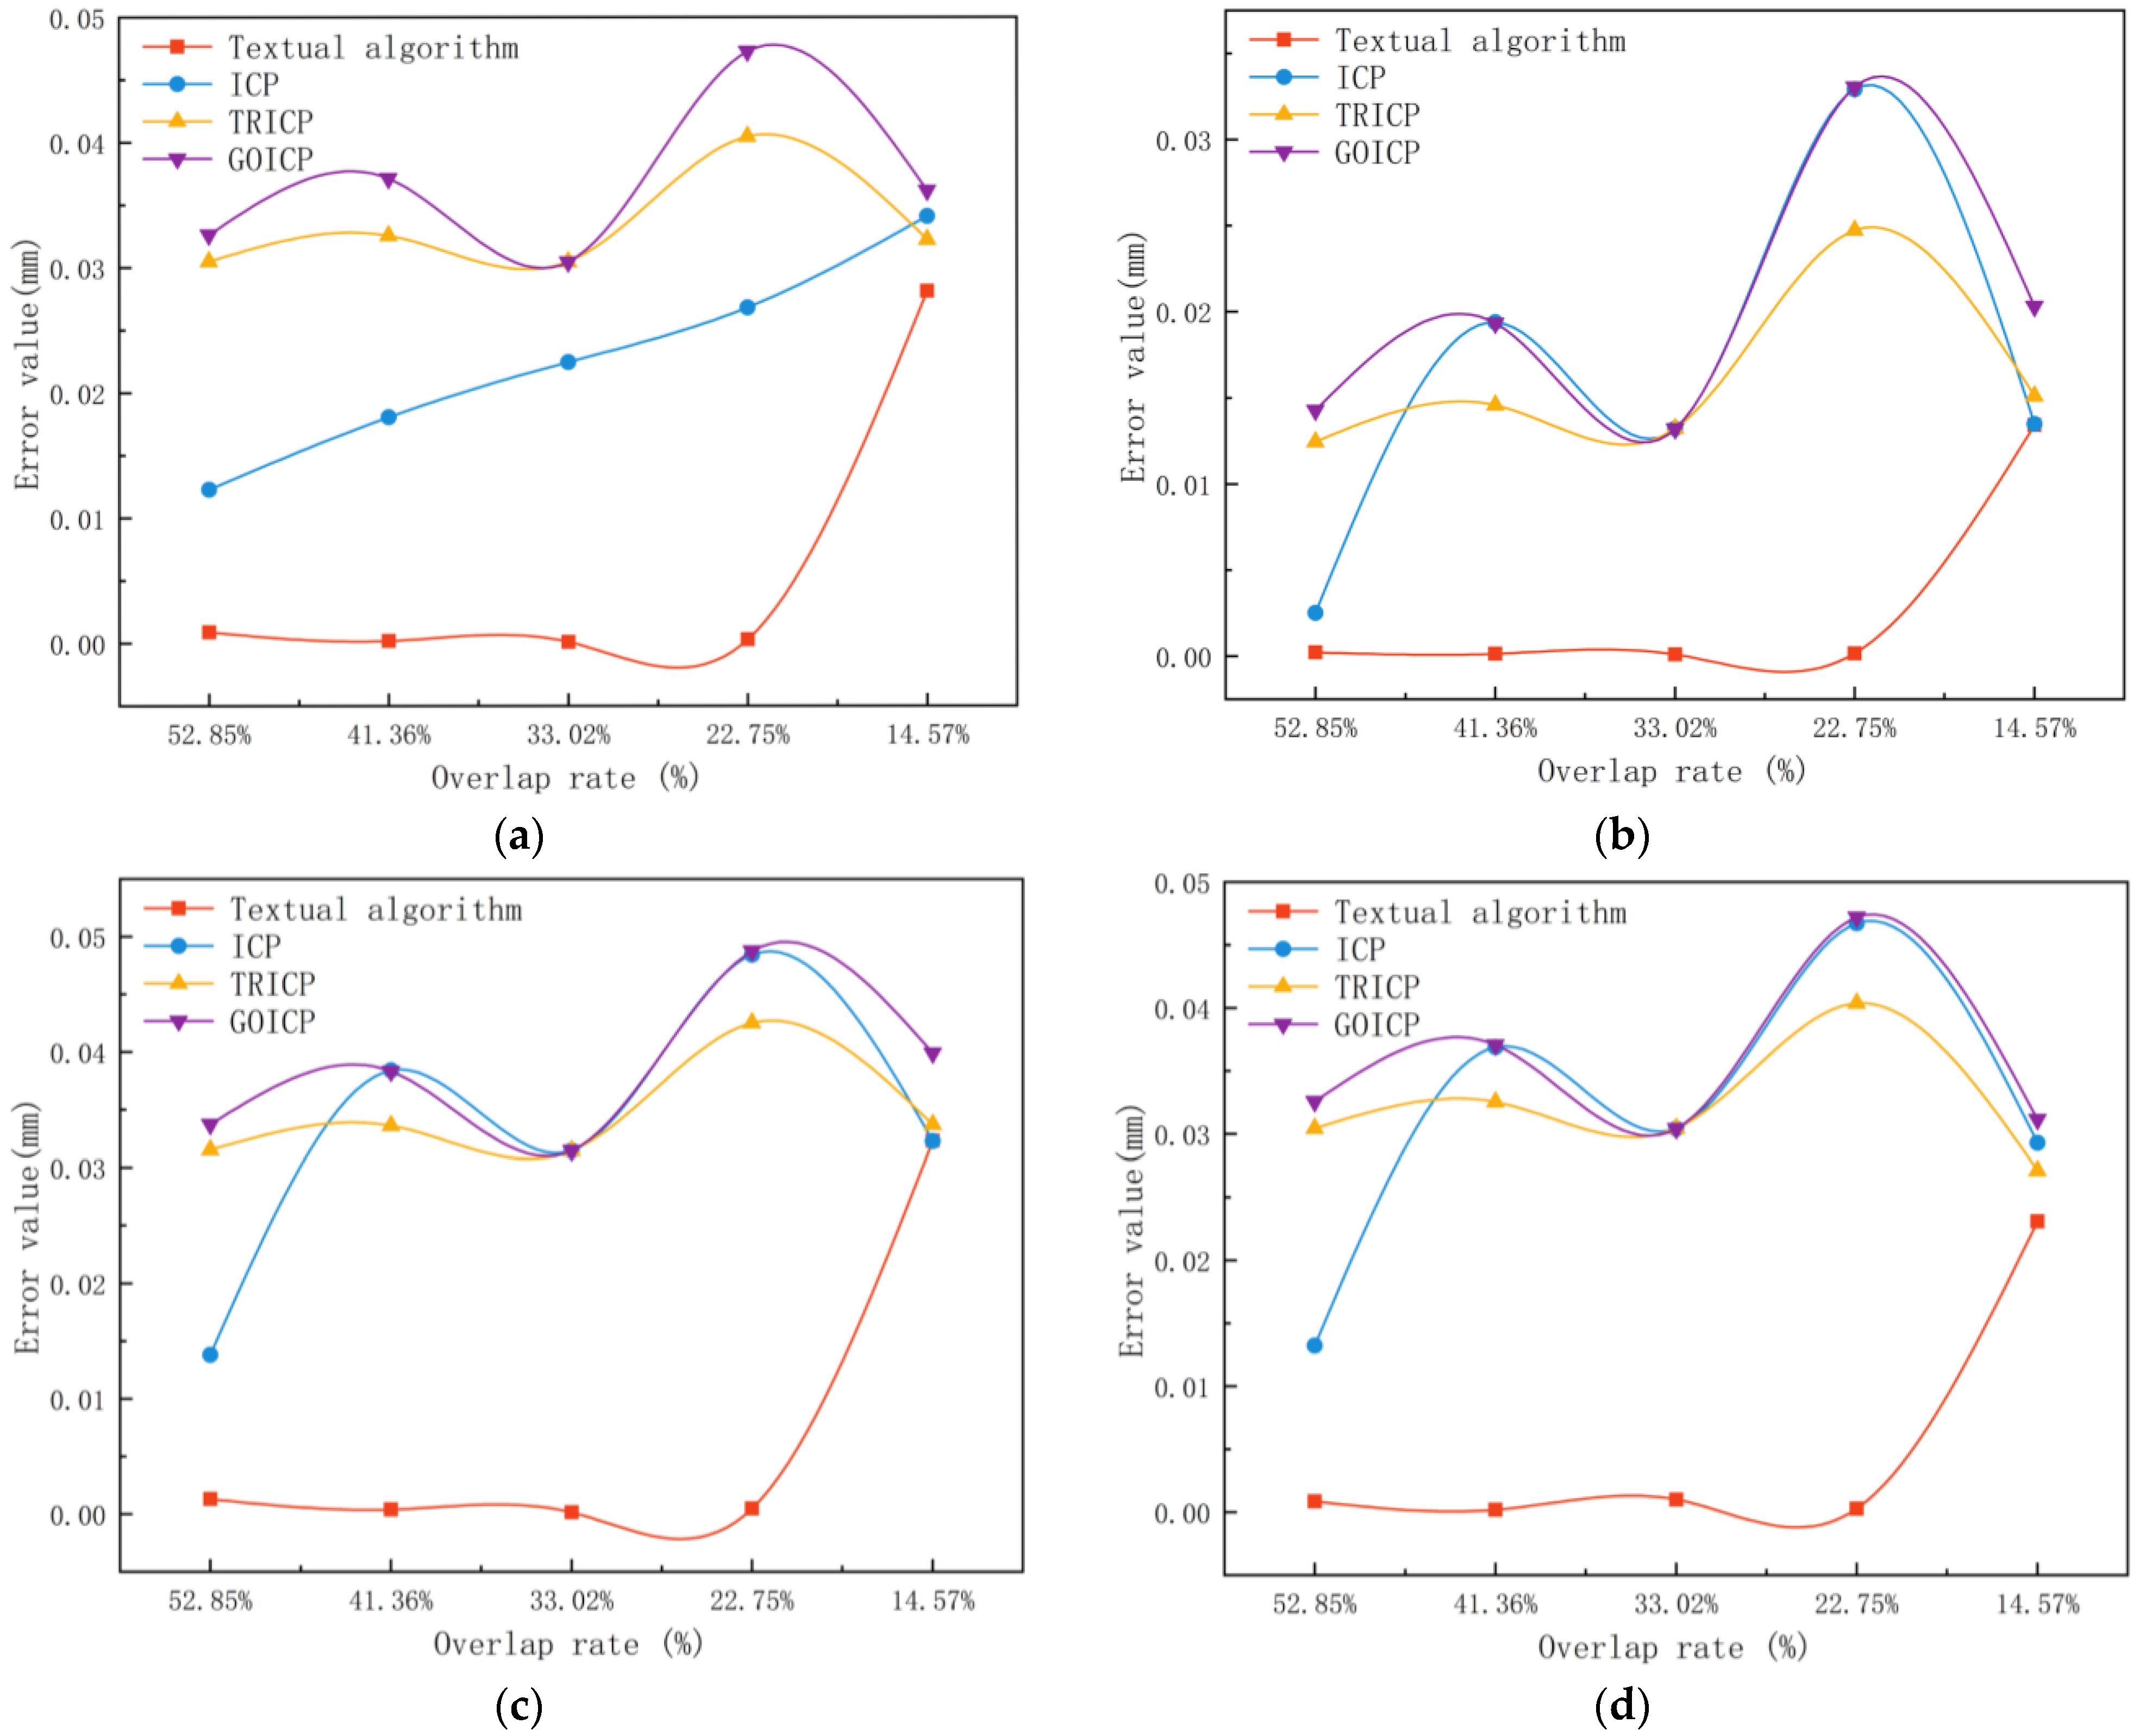
Figure 7 shows the comparison diagram of the mean distance error, nearest neighbor distance error, Hausdorff distance, and root mean square error curves of the four algorithms. The smaller the registration error, the better the registration effect. As can be seen from
Figure 7, when the overlap rate is not less than 20%, the four error indicators of the proposed algorithm are far lower than the ICP algorithm and its variant algorithms, indicating that the registration accuracy of the proposed algorithm is superior to the other three algorithms.
As can be seen from the graphs generated by the ICP algorithm and its variants’ error values, the RMS, NNED, HD, and MED, at different overlap rates of the bullet point cloud in
Figure 7, it is difficult to find an accurate match because the geometric structure and complexity of the overlapping regions of the point cloud can be different, and it is even more difficult for the ICP, TRICP, and GOICP alignment algorithms to accurately match the overlapping regions if they contain even smaller and more complex geometric features, resulting in wavy fluctuations in the error value. However, the algorithm in this paper has a stable error value close to zero when the overlap rate is not less than 20%, which indicates that the alignment algorithm in this paper is very effective in dealing with the current point cloud data, and can accurately find the best alignment transform.
According to the actual project requirements, an automatic zoom microscope was used in this paper to collect bullet data, as shown in
Figure 8. The autozoom microscope combines the function of a surface roughness measuring instrument with that of a topography measuring instrument based on the focus change technology. The focus change technique combines the small-range depth focus of an optical system with vertical scan detection to provide morphology and color information from the focus change. The main part of the system consists of a precision optical device containing a variety of lens systems that can be equipped with different objectives, thus achieving measurements of different resolutions. Precision optics move vertically along the optical axis while continuously capturing data from the surface. This means that each area of the object can be clearly focused for imaging and subsequently convert the acquired sensor data into 3D point cloud data. The test object of this experiment is a bullet, and two point clouds of the tested object under different viewing angles are obtained. The overlapping part of the point cloud from the two viewing angles can be extracted in pairs through the point cloud overlapping part extraction algorithm. The details are shown in
Figure 9 and
Figure 10.
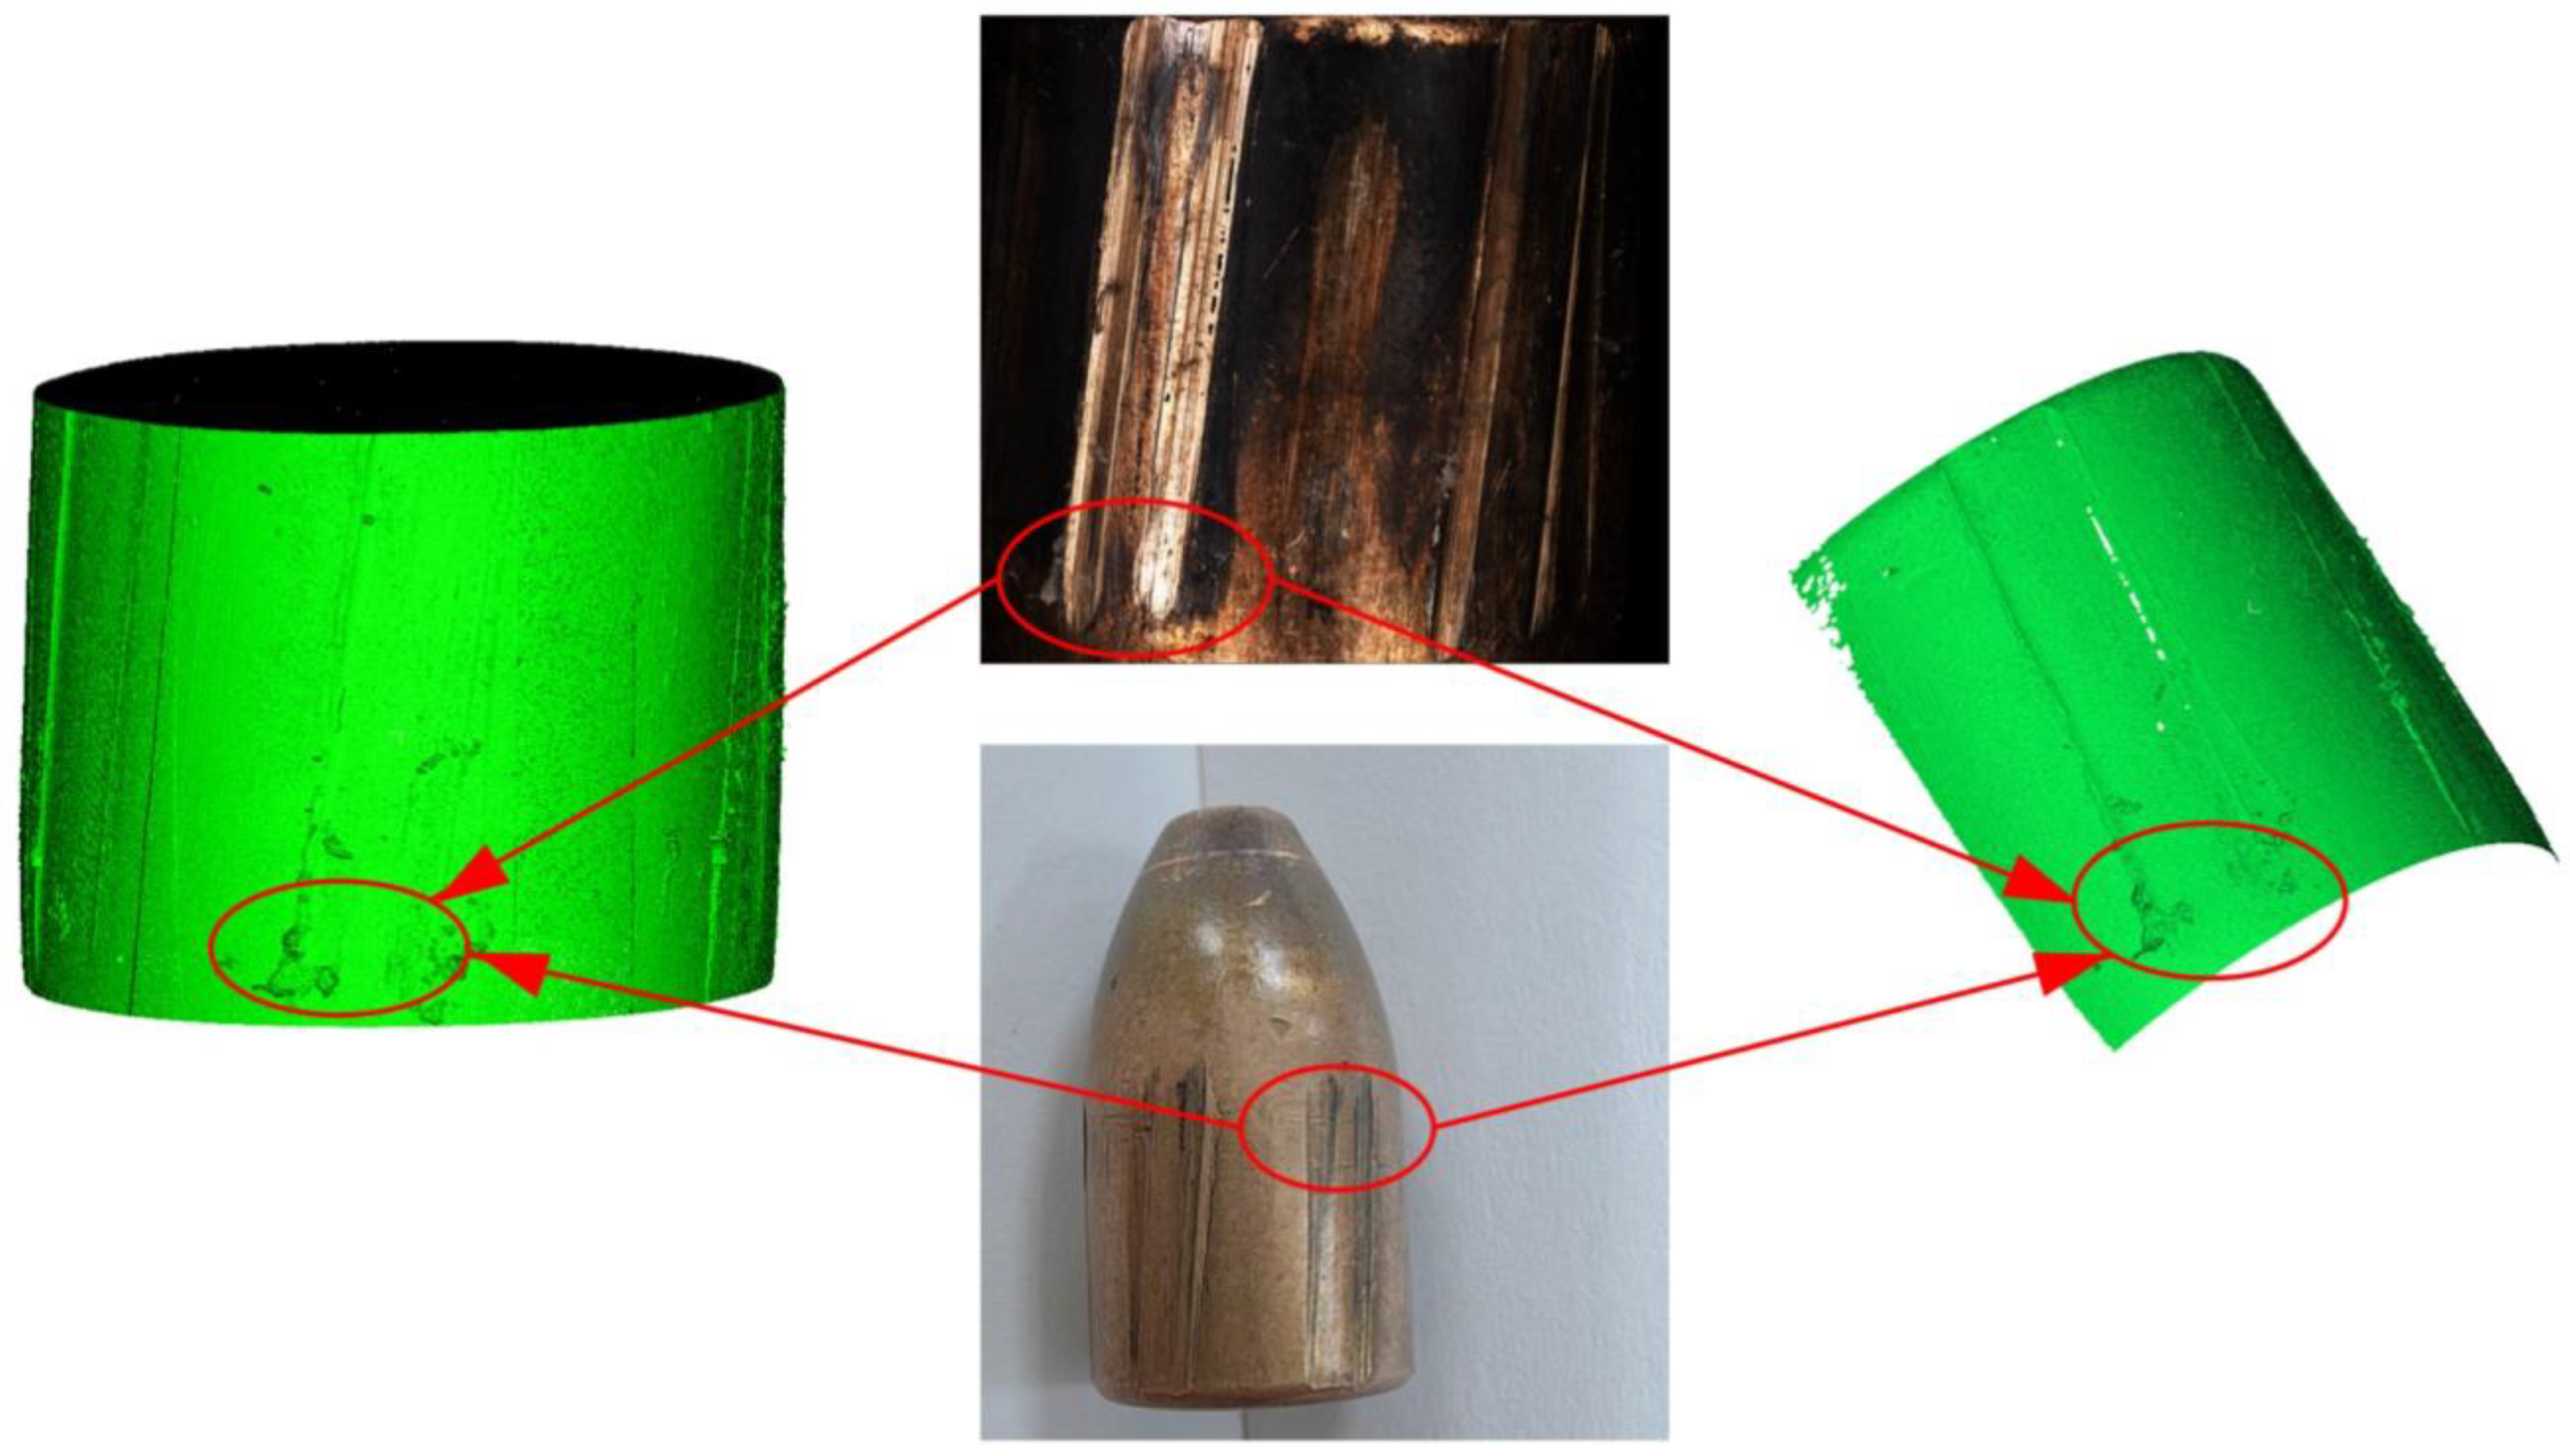
An automatic zoom microscope was used to carry out the morphological measurements of the bullet marks of 9 mm pistol bullets. In this paper, the key parts of the bullet marks were selected for acquisition with higher precision and were more conducive to achieving high-precision registration. The results are shown in
Figure 9.
The extracted two pairs of point cloud data were registered in two pairs according to the sequence, as shown in
Figure 9. In the process of self-mining, we separately collected the topography of the overlapping regions of two point clouds and used it as the true value of the registration of the overlapping region (
Figure 10 and
Figure 11). After the registration, we pairwise calculated the overlapping areas of two point clouds, using the mean distance error, nearest neighbor distance error, and Hausdorff distance as registration errors to evaluate the registration accuracy of the overlapping regions. As can be seen from
Table 7, the registration accuracy is high; as can be seen from the effect diagram in
Figure 12, the point cloud splicing effect after the registration of the proposed algorithm is remarkable, preserving the integrity of the original data while enhancing the overall shape recognition of the model, greatly reducing errors, providing reliable data fusion, and laying a solid foundation for subsequent analysis and application.


